Embed Size (px)
Citation preview

M. ChiumentiInternational Center for Numerical Methods in
Engineering (CIMNE),
Universitat Politecnica de Catalunya (UPC),
Barcelona 08034, Spain
e-mail: [email protected]
M. CerveraInternational Center for Numerical Methods in
Engineering (CIMNE),
Universitat Politecnica de Catalunya (UPC),
Barcelona 08034, Spain
E. SalsiInternational Center for Numerical Methods in
Engineering (CIMNE),
Universitat Politecnica de Catalunya (UPC),
Barcelona 08034, Spain
A. ZonatoInternational Center for Numerical Methods in
Engineering (CIMNE),
Universitat Politecnica de Catalunya (UPC),
Barcelona 08034, Spain
A Phenomenological Model forthe Solidification of Eutectic andHypoeutectic Alloys IncludingRecalescence and UndercoolingIn this work, a novel phenomenological model is proposed to study the liquid-to-solidphase change of eutectic and hypoeutectic alloy compositions. The objective is toenhance the prediction capabilities of the solidification models based on a-priori defini-tion of the solid fraction as a function of the temperature field. However, the use of mod-els defined at the metallurgical level is avoided to minimize the number of materialparameters required. This is of great industrial interest because, on the one hand, theclassical models are not able to predict recalescence and undercooling phenomena, and,on the other hand, the complexity as well as the experimental campaign necessary to feedmost of the microstructure models available in the literature make their calibration diffi-cult and very dependent on the chemical composition and the treatment of the melt. Con-trarily, the proposed model allows for an easy calibration by means of few parameters.These parameters can be easily extracted from the temperature curves recorded at thehot spot of the quick cup test, typically used in the differential thermal analysis (DTA) forthe quality control of the melt just before pouring. The accuracy of the numerical resultsis assessed by matching the temperature curves obtained via DTA of eutectic and hypoeu-tectic alloys. Moreover, the model is validated in more complex casting experimentswhere the temperature is measured at different thermocouple locations and the metallur-gical features such as grain size and nucleation density are obtained from an exhaustivemicrography campaign. The remarkable agreement with the experimental evidence vali-dates the predicting capabilities of the proposed model. [DOI: 10.1115/1.4039991]
Keywords: thermal analysis, solidification model, eutectic and hypoeutectic cast-ironalloys, recalescence, undercooling
1 Introduction
One of the challenges of today’s casting practice is the qualitycontrol of the manufacturing process and the final properties ofthe casting products. The mechanical properties of cast ironstrongly depend on the solidification microstructure as well as theporosity induced by the shrinkage phenomena. The chemical com-position of the alloy, the inoculation treatment of the melt, and theoverall cooling conditions are the main process parameters thatinfluence the solidification process. Complex casting geometriesare characterized by a wide range of cooling rates due to the thick-ness distribution of the casting components and complex heat lossmechanisms, leading to wide differences in the final metallurgicalproperties at different points of the casting part. Therefore, anaccurate study of solidification and cooling conditions is essentialfor the improvement of the casting process and the metallurgicalquality of the parts.
In order to study these phenomena, the numerical simulation ofthe thermal process is a consolidated industrial practice thanks tothe use of dedicated software allowing for the heat transfer analy-sis of foundry components. The latent heat released during the sol-idification is the key point of the phase change transformation. Onthe one hand, the total amount of latent heat is assumed as a mate-rial property. On the other hand, the heat release mechanism iscontrolled by the evolution of the solid fraction during the solidifi-cation process.
In the first attempts of predicting the solidification phenomena,the solid fraction has been assumed as an explicit function of thealloy temperature. Several methods have been proposed such asthe effective specific heat method [1–3], the enthalpy method[4–6], or the temperature recovery method [7], among others.These methods assume an explicit relationship between the tem-perature at each point of the melt and the amount of latent heatreleased. The solid fraction function can be obtained by differen-tial thermal analysis (DTA) measurements [8,9], using the backdiffusion model [10], or adopting analytical laws such as the leverrule or Scheil rules [11]. All these methods take into account theeffects induced by the actual chemical composition of the alloybut, generally, ignore the influence of the local cooling rates aswell as any kinetic phenomena during the solidification. Conse-quently, undercooling and recalescence phenomena are typicallyimpossible to be predicted and pose serious numerical inconven-iences when dealing with eutectic compositions (e.g., isothermalphase changes).
The numerical simulation of casting processes experienced asignificant step forward by introducing models based on the pre-diction of the microstructure evolution. As a first approximation,the mesoscale models express the fraction of solid during the sol-idification by estimating an average nucleation density and thecorresponding grain growth for each phase. Typically, both thenucleation density and grain growth are related to kinetic parame-ters such as the cooling rates of the melt, the undercooling effects,and the specific melt treatment such as the inoculation strategy.Starting from the original works of Oldfield [12] on the nucleationlaw for cast iron, to the models proposed by Stefanescu andcoworkers [13–15], Rappaz [3,16], Lacaze and coworkers[17–19], Wessen and Svensson [20], Celentano and workers
Contributed by the Heat Transfer Division of ASME for publication in theJOURNAL OF HEAT TRANSFER. Manuscript received March 10, 2017; final manuscriptreceived April 9, 2018; published online May 7, 2018. Assoc. Editor: GennadyZiskind.
Journal of Heat Transfer AUGUST 2018, Vol. 140 / 082301-1Copyright VC 2018 by ASME

[21–26], Dardati et al. [27–30], the complexity of the subjacentmicrostructure has been incremented progressively.
More sophisticated models, such as the cellular automata tech-nique [31–34], describe the solidification phenomena at the micro-scale level, combining both deterministic and probabilistic laws inorder to study the evolution of each single grain and the grain-to-grain interaction within a more realistic description of the micro-structure. Using these microstructure models, it is possible toachieve a realistic visualization of the dendritic phase growingduring the solidification, the interaction with the eutectic nuclei,and the influence of the carbon content and its diffusion.
Both mesoscale and microscale approaches have some draw-backs. On the one hand, mesoscale models are very much depend-ent on the actual chemical composition of the alloy and thetechnological treatment of the melt, requiring a tedious calibrationprocess of the sophisticated evolution laws proposed in the lastyears. Furthermore, they still rely on coarse approximation of thegrain shape (typically equiaxial grains) and grain interactions, aswell as on empirical nucleation laws. On the other hand, microscalemodels can produce very accurate predictions but the upscaling pro-cess to the macroscale, where the heat transfer analysis is modeled,and the necessary computational resources, make their use unaf-fordable when facing the study of complex industrial components.
In this paper, a different approach to the solidification problemis proposed. The main idea consists of assuming a macroscalemodel, where the solidification depends on the definition of an adhoc evolution law for the solid fraction. Hence, the latent heatrelease is not written as an explicit function of the local tempera-ture field, but it relies on the time integration of an evolution lawfor the solid fraction. This evolution law takes into account thechemical composition (i.e., the equivalent carbon content) as wellas the cooling rate at each point of the casting. Therefore, themain idea is to characterize the solidification process to obtain themost realistic temperature evolution without introducing anyexplicit relationship with the subjacent microstructure. The phasechange model is kept as simple as possible, regardless of the com-plexity of the phenomena taking place at the microscale whilecapturing their effects at the macroscale. The alloy compositionas well as the melt treatment is accounted by experimental calibra-tion (e.g., matching the numerical result of the model with thetemperature evolution recorded by a thermocouple at the hot-spotin a quick cup test, typically used in DTA).
The same idea has been successfully used to study the thermo-chemical hydration process of concrete [35,36]. The parallelismwith the metal casting process is evident: the hydration of con-crete is a highly exothermic and thermally activated reactionwhere the diffusion of water and the formation of hydrates are thedominant mechanisms at the microscale level defining the reac-tion kinetics. Also, in this case, the main objective is to capturethe phenomenological aspects of the process without explicitlyreferring to the physical–chemical phenomena occurring at themicroscale level.
In Sec. 2, a review of the equations used for the heat transferanalysis is presented. The solidification model for the eutectic andthe hypoeutectic phase-changes is introduced in Secs. 3 and 4,respectively. The models are enhanced by coupling the solidifica-tion with the characterization of the thermophysical material prop-erties used in the heat transfer analysis. This is achieved byintroducing a mixture rule based on the growth of the differentphases in the melt. Finally, Sec. 5 shows the calibration and vali-dation work carried out. In the casting, benchmarks proposed boththe chemical composition of the melt and the thermal module ofthe components are modified to demonstrate the prediction accu-racy of the proposed model.
2 Heat Transfer Analysis
Both the solidification and the cooling phases are controlled bythe balance of energy equation [37]. This governing equation canbe stated as
dH
dT¼ �r � q (1)
where dH=dT is the enthalpy rate (per unit of volume) and q is theheat flux.
The enthalpy H(T, fL) is the state variable defined as a functionof the temperature, T, and the liquid fraction, fL. Hence, theenthalpy rate in Eq. (1) can be written as
dH
dTT; fLð Þ ¼ @H
@T_T þ @H
@fL
_f L ¼ CdT
dtþ L
dfLdt
(2)
where C ¼ @H=@T is the heat capacity and L ¼ @H=@fL is thelatent heat released during the phase-change process.
The heat capacity of the material is defined as: C¼ qc, theproduct of the material density, q, and the specific heat, c.
The heat flux (per unit of surface) q, is computed as a functionof the temperature gradient through the Fourier’s law as
q ¼ �krT (3)
where k is the thermal conductivity.The solution of the thermal problem consists of enforcing the
weak form of the balance of energy equation. This means integrat-ing Eq. (1) over the open and bounded volume V, closed by thesmooth boundaries S¼ ST [ Sq where the corresponding boundaryconditions are defined in terms of either prescribed temperature(T ¼ �T ) on ST or prescribed heat flux (�krT � n ¼ �q) through thesurface Sq with external normal n. Suitable initial conditions forthe transient thermal problem are defined in terms of initial tem-perature field: T(t¼ 0)¼T0.
The resulting weak (integral) form of the energy balance equa-tion used for the heat transfer analysis, can be written as [38–41]
ÐV C
dT
dtþ L
dfLdt
� �dT
� �dV þ
ÐV k$T � $ dTð Þ½ � dV ¼ Wext
ther 8dT
(4)
where dT are the variations of the temperature field (test func-tions) compatible with the Dirichlet’s boundary conditions andWext denotes the external work of the thermal loads
WextðTÞ ¼ �ð
Sq
½ð�q þ qcond þ qconv þ qradÞ dT� dS (5)
In Eq. (5), �q represents the prescribed heat flux (Neumann’s con-dition) while qconv and qrad are the heat fluxes by convection andby radiation, responsible of the heat loss through the body surfa-ces in contact with the environment. The effects of the heat con-vection can be taken into account using Newton’s law (Robin’scondition) in the form [42]
qcond ¼ hconvðT � TenvÞ (6)
where hconv(T) is the (temperature dependent) heat transfer coeffi-cient (HTC) by convection and Tenv is the ambient temperature.
The radiation heat flux can be computed using Stefan–Boltzmann’s law as a function of the casting surface temperature,T, and the ambient temperature as
qrad ¼ rraderadðT4 � T4envÞ (7)
where rrad is the Stefan–Boltzmann constant and erad is the emis-sivity parameter.
Finally, the heat flux due to the heat conduction processbetween the casting and the mold surfaces, qcond, can be takeninto account using Newton’s law as
qcond ¼ hcondðT � TmoldÞ (8)
082301-2 / Vol. 140, AUGUST 2018 Transactions of the ASME

where hcond is the HTC by conduction between the casting and themold surfaces in contact, and Tmould is the mold temperature.
Remark 1. The HTC by conduction is defined as the inverse ofthe corresponding thermal resistivity and it depends on differentparameters at the contact interface such as the contact pressureand the surfaces roughness, among others. When the contact isbetween metallic materials (e.g., solidification of aluminum cast-ing in permanent steel molds), the HTC assumes very high valuesaround 2000–3000 W/m2 K. When using a sand mold, this valuecan be reduced to 100–500 W/m2 K (see Refs. [22], [36], and[42].
Remark 2. Stefan–Boltzmann’s law can be rewritten as
qrad ¼ hradðT � TenvÞ (9)
where hrad(T) is the (temperature dependent) HTC by radiationdefined as
hradðTÞ ¼ rraderadðT3 þ T2Tenv � TT2env � T3
envÞ (10)
This format is interesting for two reasons: first, because it is possi-ble to linearize the contribution of the heat radiation term as
qrad ¼ hradðTnÞðTnþ1 � TenvÞ (11)
where Tnþ1¼T(tnþ1) is the current temperature at time tnþ1, andTn¼ T(tn) is temperature in the previous time-step. The secondreason is that it is extremely difficult to separate the heat lossesdue to the convection and the radiation mechanisms. Hence, thenumerical model may use a unique HTC accounting for both heatconvection and radiation terms, as
qloss ¼ hlossðT � TenvÞ (12)
where hloss(T) is the (temperature dependent) HTC accounting forthe total heat loss through the surrounding environment.
Remark 3. The thermal problem in Eq. (4) can be solved usingdifferent numerical methods such as finite volume, finite differen-ces or finite element (FE) methods, among others. In this work,the results obtained in both the numerical calibration and the fol-lowing validation strategy refer to a spatial FE discretization anda Backward–Euler time integration of the thermal problem.Hence, after meshing the integration domain, V, is split into (ne)
elements as: V ¼Pne
e¼1
VðeÞ. The temperature field within each ele-
ment is obtained from the nodal values T(e) through the interpola-tion (shape) functions N(e), as: T(e)¼N(e) T(e). Moreover,following the Galerkin method, the test (weight) function is cho-sen as: dT(e)¼N(e). Hence, the discrete form of the balance ofenergy equation can be written as
Xne
e¼1
ðV eð Þ
NTeð Þ C
Tnð Þeð Þ � T n�1ð Þ
eð ÞDt
!þ L
fnð Þ
L � f n�1ð ÞL
Dt
!24
35
dV eð Þ
þXne
e¼1
ðV eð Þ
k BTeð Þ$T eð Þ dV eð Þ ¼
Xne
e¼1
Wexteð Þ (13)
where the BðeÞ ¼ rNðeÞ andPne
e¼1
stands for the assemblingprocedure.
3 Eutectic Model
The reference material in this work is SG cast iron also knownas ductile iron or nodular iron. This material plays a key role formany engineering applications in automotive and aerospaceindustry due to the good combination of high strength, good creep,and fatigue resistance. Focusing on the SG eutectic composition,the uninodular theory for stable equiaxial solidification assumesthat after the nucleation, the graphite nodules are encapsulated by
the austenite dendrites and a constant ratio between the size of theaustenite shell and the graphite nodule is maintained during thegrain growth [13,24,37,43].
During the phase transformation, the volume of the casting, V,can be split into liquid and solid phases as: V¼VLþVS. Theliquid and solid fractions are defined as: fL ¼ VL=V andfS ¼ VS=V, respectively, so that: fLþ fS¼ 1. The evolution of theliquid fraction dfL=dt or, alternatively, the solid fraction rate:dfS=dt ¼ �ðdfL=dtÞ, defines the phase change, that is, how thelatent heat is absorbed or released during the transformation. Thephase transformation is monitored at each point of the domain sothat the solidification analysis depends on the local evolution ofthe temperature field.
Hereafter, this solid phase is referred to as the eutectic phase,fE. Therefore, fS¼ fE, being 0 � fE � 1. Hence, the weak form ofthe balance of energy equation (4) is modified by associating thelatent heat release with the grain growth of the eutectic phase:LðdfL=dtÞ ¼ �LðdfE=dtÞ.
Figure 1 shows the temperature curve and its first derivative asrecorded in a typical DTA for a eutectic alloy. In this figure, dif-ferent key points are shown
� TstartL indicates the beginning of the solidification. For a
eutectic composition TstartL is also assumed as the beginning
of the eutectic phase TstartL ¼ Tstart
E . This value corresponds toa local minimum in the curve of the first derivative of thetemperature;
� dT=dtjT¼TEis the cooling rate used to characterize the nucle-
ation law (see Eq. (19));� Tmin
E and TmaxE are the temperatures corresponding to the local
minimum and maximum of the eutectic transformation.Hence, the first derivative of the temperature curve is null atthese points;
� TS indicates the solidus temperature and corresponds to a fur-ther local minimum in the curve of the first derivative of thetemperature.
In this work, the transformation kinetics of the eutectic phase isdefined by the following evolution law:
dfEdt¼ AE 1� fEð ÞfE fE t ¼ 0ð Þ ¼ f 0
E(14)
This is an Avrami-type equation [44–46], which results into thecharacteristic s-shaped or sigmoidal profile where the transforma-tion rates are slow at the beginning and at the end of the transfor-mation but rapid in between (see Fig. 2). The initial slow rate canbe attributed to the nucleation process and the first growing phase,which can be observed at the microscale, once the melt cools
Fig. 1 Temperature evolution and its first derivative obtainedfrom the DTA of a eutectic solidification process. Identificationof the highlight temperatures used for the characterization ofthe eutectic solidification model.
Journal of Heat Transfer AUGUST 2018, Vol. 140 / 082301-3
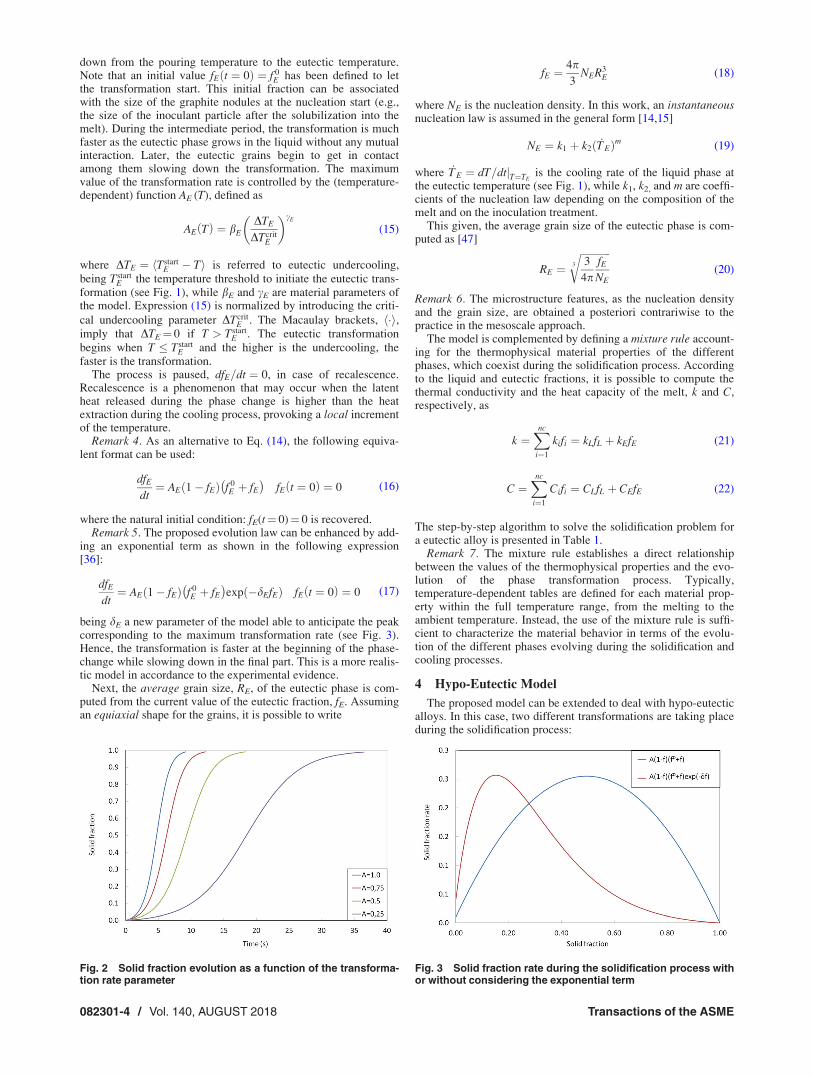
down from the pouring temperature to the eutectic temperature.Note that an initial value fEðt ¼ 0Þ ¼ f 0
E has been defined to letthe transformation start. This initial fraction can be associatedwith the size of the graphite nodules at the nucleation start (e.g.,the size of the inoculant particle after the solubilization into themelt). During the intermediate period, the transformation is muchfaster as the eutectic phase grows in the liquid without any mutualinteraction. Later, the eutectic grains begin to get in contactamong them slowing down the transformation. The maximumvalue of the transformation rate is controlled by the (temperature-dependent) function AE (T), defined as
AE Tð Þ ¼ bE
DTE
DTcritE
� �cE
(15)
where DTE ¼ hTstartE � Ti is referred to eutectic undercooling,
being TstartE the temperature threshold to initiate the eutectic trans-
formation (see Fig. 1), while bE and cE are material parameters ofthe model. Expression (15) is normalized by introducing the criti-
cal undercooling parameter DTcritE . The Macaulay brackets, h�i,
imply that DTE¼ 0 if T > TstartE . The eutectic transformation
begins when T � TstartE and the higher is the undercooling, the
faster is the transformation.The process is paused, dfE=dt ¼ 0, in case of recalescence.
Recalescence is a phenomenon that may occur when the latentheat released during the phase change is higher than the heatextraction during the cooling process, provoking a local incrementof the temperature.
Remark 4. As an alternative to Eq. (14), the following equiva-lent format can be used:
dfEdt¼ AE 1� fEð Þ f 0
E þ fE
� �fE t ¼ 0ð Þ ¼ 0 (16)
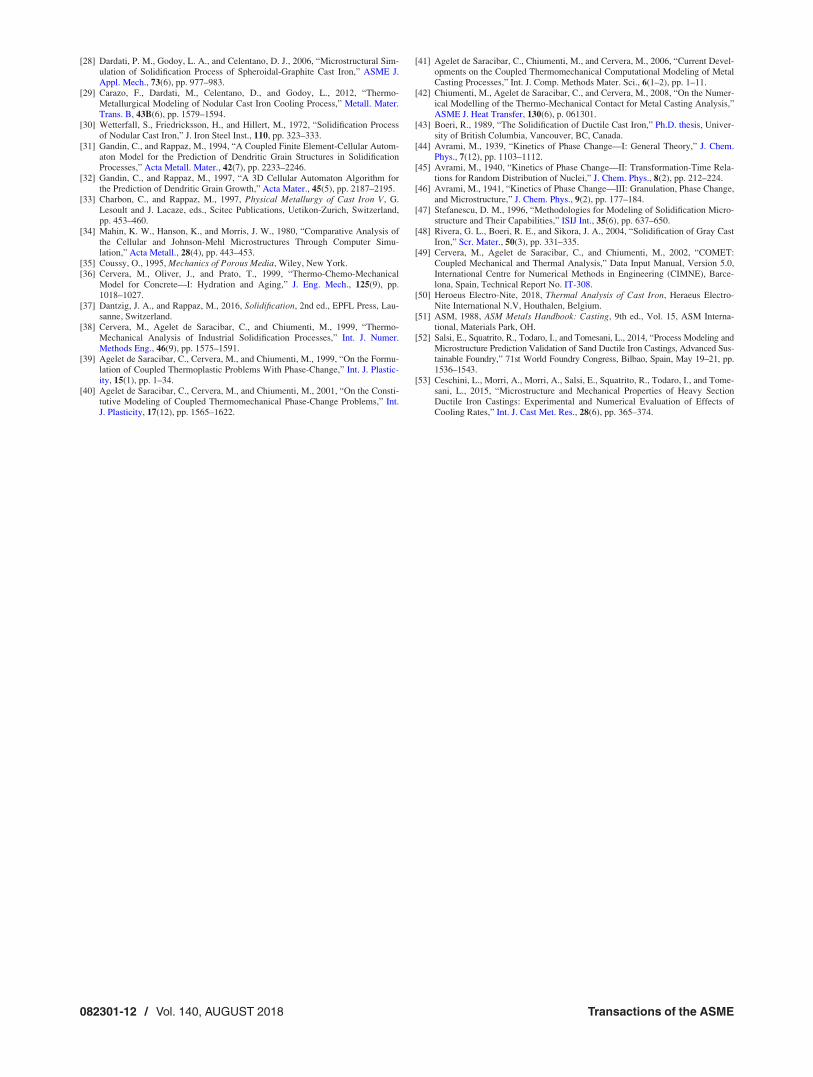
where the natural initial condition: fE(t¼ 0)¼ 0 is recovered.Remark 5. The proposed evolution law can be enhanced by add-
ing an exponential term as shown in the following expression[36]:
dfEdt¼ AE 1� fEð Þ f 0
E þ fE� �
exp �dEfEð Þ fE t ¼ 0ð Þ ¼ 0 (17)
being dE a new parameter of the model able to anticipate the peakcorresponding to the maximum transformation rate (see Fig. 3).Hence, the transformation is faster at the beginning of the phase-change while slowing down in the final part. This is a more realis-tic model in accordance to the experimental evidence.
Next, the average grain size, RE, of the eutectic phase is com-puted from the current value of the eutectic fraction, fE. Assumingan equiaxial shape for the grains, it is possible to write
fE ¼4p3
NER3E (18)
where NE is the nucleation density. In this work, an instantaneousnucleation law is assumed in the general form [14,15]
NE ¼ k1 þ k2ð _T EÞm (19)
where _T E ¼ dT=dtjT¼TEis the cooling rate of the liquid phase at
the eutectic temperature (see Fig. 1), while k1, k2, and m are coeffi-cients of the nucleation law depending on the composition of themelt and on the inoculation treatment.
This given, the average grain size of the eutectic phase is com-puted as [47]
RE ¼ffiffiffiffiffiffiffiffiffiffiffiffi3
4pfENE
3
r(20)
Remark 6. The microstructure features, as the nucleation densityand the grain size, are obtained a posteriori contrariwise to thepractice in the mesoscale approach.
The model is complemented by defining a mixture rule account-ing for the thermophysical material properties of the differentphases, which coexist during the solidification process. Accordingto the liquid and eutectic fractions, it is possible to compute thethermal conductivity and the heat capacity of the melt, k and C,respectively, as
k ¼Xnc
i¼1
kifi ¼ kLfL þ kEfE (21)
C ¼Xnc
i¼1
Cifi ¼ CLfL þ CEfE (22)
The step-by-step algorithm to solve the solidification problem fora eutectic alloy is presented in Table 1.
Remark 7. The mixture rule establishes a direct relationshipbetween the values of the thermophysical properties and the evo-lution of the phase transformation process. Typically,temperature-dependent tables are defined for each material prop-erty within the full temperature range, from the melting to theambient temperature. Instead, the use of the mixture rule is suffi-cient to characterize the material behavior in terms of the evolu-tion of the different phases evolving during the solidification andcooling processes.
4 Hypo-Eutectic Model
The proposed model can be extended to deal with hypo-eutecticalloys. In this case, two different transformations are taking placeduring the solidification process:
Fig. 2 Solid fraction evolution as a function of the transforma-tion rate parameter
Fig. 3 Solid fraction rate during the solidification process withor without considering the exponential term
082301-4 / Vol. 140, AUGUST 2018 Transactions of the ASME

(1) First, the dendritic phase, referred to as the primary austen-ite ðc0Þ, occurs. Its formation starts at the liquidus tempera-ture, Tstart
L , to finish at TstartE , with the nucleation of the
eutectic phase.(2) Later, the eutectic phase starts at Tstart
E temperature,presents its maximum growth at the eutectic temperature,TE, to terminate at the solidus temperature, TS. The eutecticphase of the SG cast iron is characterized by graphiticnuclei surrounded by the secondary austenite ðc00Þ while inthe case of Lamellar cast iron (LG), there are graphiteflakes surrounded by the secondary austenite [48].
Figure 4 shows temperatures TstartL ; Tstart
E , and TS as recorded inthe DTA of a hypoeutectic alloy, and corresponding to local min-ima in the curve of the first derivative of the temperature evolutionduring the phase transformation. In this figure, the eutectic plateauis characterized by Tmin
E and TmaxE where the first derivative
vanishes.This given, the solid fraction is obtained adding the contribu-
tions of the dendritic phase fD, and the eutectic phase fE, as
fS ¼ fD þ fE (23)
The partition ratio, h, is introduced to establish the volumetric par-tition between these two phases, as
0 � fD � 1� h (24)
0 � fE � h (25)
This ratio is defined as a function of the chemical composition ofthe alloy. The model adopts the ratio between the actual equiva-lent carbon concentration, Ceq (including the effects of the Sisegregation) and the carbon content, Ce, of the eutecticcomposition
h ¼ Ceq
Ce
� �b
Ceq � Ce (26)
where b is a parameter of the model.Consequently, the solid fraction is computed as
fS ¼ ð1� hÞ f �D þ h f �E (27)
where 0 � f �D � 1 and 0 � f �E � 1 are the normalized dendriticand the eutectic fractions, respectively, that is
fD ¼ ð1� hÞ f �D (28)
fE ¼ h f �E (29)
The latent heat release in the balance of energy equation (4) for ahypo-eutectic alloy is computed taking into account the transfor-mation kinetics of both phases as
LdfLdt¼ �L
dfDdtþ dfE
dt
� �¼ �L 1� hð Þ df �D
dtþ h
df �Edt
� �(30)
The transformation kinetics of the dendritic and the eutecticphases are defined by the corresponding Avrami-type evolutionlaws
df �Ddt¼ AD 1� f �D
� �f 0D þ f �D� �
exp �dDf �D� �
(31)
df �Edt¼ AE 1� f �E
� �f 0E þ f �E� �
exp �dEf �E� �
(32)
where f 0D and f 0
E are the initial dendritic and eutectic fractions attheir respective nucleation time.
The transformation rates are controlled by the (temperature-dependent) functions AD and AE, respectively, and defined as
AD Tð Þ ¼ bD
DTD
DTcritD
� �cD
(33)
AE Tð Þ ¼ bE
DTE
DTcritE
� �cE
(34)
Table 1 Algorithm to solve the solidification analysis usingthe eutectic model
Algorithm for the eutectic model
Initialize:
Toð Þeð Þ ¼ To
foð Þ
E ¼ f 0E
Loop on time-steps: n¼ 1, number-of-time-steps
Compute the eutectic fraction:
A n�1ð ÞE ¼ bE
DTstart
E � T n�1ð Þeð Þ
EDTcrit
E
0@
1AcE
fnð Þ
E ¼ f n�1ð ÞE þ A n�1ð Þ
E 1� f n�1ð ÞE
f n�1ð ÞE Dt
Update liquid and solid fractions:
fnð Þ
S ¼ fnð Þ
E
fnð Þ
L ¼ 1� fnð Þ
S
Update thermo-physical properties:
C nð Þ ¼ CLfnð Þ
L þ CEfnð Þ
E
k nð Þ ¼ kLfnð Þ
L þ kEfnð Þ
E
Solve thermal problem:
Xne
e¼1
ðV eð Þ
NTeð Þ C nð Þ
Tnð Þeð Þ � T n�1ð Þ
eð ÞDt
0@
1Aþ L
fnð Þ
L � f n�1ð ÞL
Dt
0@
1A
264
375 dV eð Þ
þXne
e¼1
ðV eð Þ
k nð Þ BTeð Þ$T
nð Þeð Þ dV eð Þ ¼
Xne
e¼1
Wexteð Þ
Compute actual grain size:
Nnð Þ
E ¼ k1 þ k2_T
nð ÞE
m
Rnð Þ
E ¼
ffiffiffiffiffiffiffiffiffiffiffiffiffiffi3
4pf
nð ÞE
Nnð Þ
E
3
vuutEnd loop
Fig. 4 Temperature evolution and its first derivative obtainedfrom the DTA of a hypoeutectic solidification process. Identifi-cation of the highlight temperatures used for the characteriza-tion of the hypoeutectic solidification model.
Journal of Heat Transfer AUGUST 2018, Vol. 140 / 082301-5

On the one side, the dendritic growth depends on the value ofundercooling, DTD, defined as
DTD ¼ h �TL � Ti (35)
where �TL is the actual liquidus temperature, which is varyingbecause of the carbon segregation. Its value is updated accordingto the solidification evolution using the following lever rule:
�TL ¼ ð1� fSÞTstartL þ fSTstart
E (36)
On the other side, the transformation rate of the eutectic phasedepends on the undercooling with respect to the eutectictemperature
DTE ¼ hTstartE � Ti (37)
It is interesting to observe that the eutectic model is a particularcase of the hypoeutectic model. If for the actual alloy Ceq¼Ce
than the partition ratio: h¼ 1, and consequently: fS¼ fE. Hence,the solid fraction is computed according to the evolution of theeutectic phase, only. Note that when Tstart
L ! TstartE , then �T L !
TstartE meaning that the dendritic phase is negligible and the solidi-
fication is characterized by the nucleation of the eutectic phaseand following grain growth.
Finally, the mixture rule used to compute the thermo-physicalproperties accounts for both eutectic and dendritic phases, as
k ¼Xnc
i¼1
kifi ¼ kLfL þ kDfD þ kEfE (38)
C ¼Xnc
i¼1
Cifi ¼ CLfL þ CDfD þ CEfE (39)
The corresponding step-by-step algorithm to solve the solidifica-tion problem of a hypo-eutectic alloy is shown in Table 2.
5 Validation Strategy
In this section, three different benchmarks are presented to vali-date the model proposed for the solidification process of cast ironalloys in sand molds. They are: The quick cup test, the Y-shapetest, and the cubes test. These benchmarks are characterized bydifferent thermal modules and chemical compositions of the meltin order to study the response of the model to a wide range of pro-cess parameters and cooling rates. In particular, two different fam-ilies of alloys have been studied: the eutectic ductile iron and thehypoeutectic gray cast iron. Hence, changing the chemical compo-sition and the melt treatment, it is possible to reproduce differentsolidification behaviors, characterized by specific phase transfor-mation temperatures and recalescence phenomena. To validate themodel, the temperature field has been monitored during the solidi-fication process by means of thermocouples located either in themelt or in the mold. The temperature evolution measured at thethermocouples has been compared to the numerical predictions.
The proposed model has been implemented into the softwarepackage COMET [49], a FE based platform for the analysis of cou-ple thermo-mechanical problems. Hence, the calculations havebeen performed in the enhanced version of this software devel-oped at CIMNE (International Center for Numerical Methods inEngineering).
The proposed benchmarks have been characterized accordingto the process parameters and the material data as detailed in the
Table 2 Algorithm to solve the solidification analysis usingthe hypo-eutectic model
Algorithm for the hypo-eutectic model
Initialize:
Toð Þeð Þ ¼ To
foð Þ
D ¼ f 0D
foð Þ
E ¼ f 0E
Loop on time-steps: n¼ 1, number-of-time-steps
Compute the actual liquidus temperature:
�Tn�1ð Þ
L ¼ 1� f n�1ð ÞS
Tstart
L þ f n�1ð ÞS Tstart
E
Update the dendritic and eutectic fractions:
A n�1ð ÞD ¼ bD
D�T
n�1ð ÞL � T n�1ð Þ
eð Þ
EDTcrit
D
0B@
1CA
cD
A n�1ð ÞE ¼ bE
DTstart
E � T n�1ð Þeð Þ
EDTcrit
E
0B@
1CA
cE
f �Dnð Þ ¼ f �D
n�1ð Þ þ A n�1ð ÞD 1� f �D
n�1ð Þ
f �Dn�1ð ÞDt
f �Enð Þ ¼ f �E
n�1ð Þ þ A n�1ð ÞE 1� f �E
n�1ð Þ
f �En�1ð ÞDt
fnð Þ
D ¼ 1� hð Þ f �D nð Þ
fnð Þ
E ¼ h f �Enð Þ
Update liquid and solid fractions:
fnð Þ
S ¼ fnð Þ
D þ fnð Þ
E
fnð Þ
L ¼ 1� fnð Þ
S
Update thermo-physical properties:
C nð Þ ¼ CLfnð Þ
L þ CDfnð Þ
D þ CEfnð Þ
E
k nð Þ ¼ kLfnð Þ
L þ kDfnð Þ
D þ kEfnð Þ
E
Solve thermal problem:
Xne
e¼1
ðV eð Þ
NTeð Þ C nð Þ
Tnð Þeð Þ � T n�1ð Þ
eð ÞDt
0@
1Aþ L
fnð Þ
L � f n�1ð ÞL
Dt
0@
1A
264
375 dV eð Þ
þXne
e¼1
ðV eð Þ
k nð Þ BTeð Þ$T
nð Þeð Þ dV eð Þ ¼
Xne
e¼1
Wexteð Þ
Compute actual grain size:
Nnð Þ
E ¼ k1 þ k2_T
nð ÞE
m
Rnð Þ
E ¼
ffiffiffiffiffiffiffiffiffiffiffiffiffiffi3
4pf
nð ÞE
Nnð Þ
E
3
vuutEnd loop
Fig. 5 Quick cup test geometry: dimensions in millimeters
082301-6 / Vol. 140, AUGUST 2018 Transactions of the ASME

corresponding references. Hence, it was no possible to assess theperformance of the mixture rule model described in Secs. 3 and 4due to the lack of data.
5.1 Quick Cup Test. The quick cup test refers to the solidifi-cation of a small amount of cast iron poured into a little sand cup,commercially known as quick cup. This cup is characterized by astandard geometry, which includes a K-type thermocoupleinserted into a thin quartz tube and located at the hot spot of thespecimen to measure the temperature evolution during the solidifi-cation process. The quick cup is one of the easiest and cheapestways to study the solidification of different casting alloys. It isextensively used in the foundry industry, and it is the standard inDTA allowing for a quick quality control of the melt just beforethe pouring process [50]. The quick cup dimensions and the loca-tion of the thermocouple are shown in Fig. 5.
In this work, two different melt compositions have beenconsidered:
(1) Quick cup test-1: a eutectic ductile iron with the followingchemical composition: 3.52% C, 2.18% Si, 0.29% Mn and0.01% S. The melt treatment consists of an Mg treatment(0.05%) and an inoculation.
(2) Quick cup test-2: a Hypoeutectic gray cast iron with the fol-lowing chemical composition: 3.08% C, 2.14% Si, 0.82%Mn, 0.06% S and 0.05% P with an inoculation melttreatment.
The first test was chosen to assess the model for a eutectic sol-idification. The second test extends the assessment to a hypoeutec-tic alloy characterized by a dendritic austenite growth, where bothundercooling and recalescence phenomena occur.
In this work, the geometry of the Quick Cup test has been simpli-fied to an equivalent two-dimensional (2D) geometry with the samethermal module as for the original three-dimensional geometry.The objective of such simplification is the possibility to perform afast 2D sensitivity analysis to calibrate both thermophysical proper-ties and the parameters of the solidification model.
The FE discretization is defined by 464 nodes and 833 triangu-lar elements with an average mesh size of 2 mm. The time integra-tion scheme uses a constant time increment: Dt¼ 1 s.
The simulation of the pouring phase has been omitted so thatonly the solidification process has been considered. A uniform ini-tial temperature of 1300 �C and 20 �C has been assumed for thecasting and for the sand mold, respectively.
The Quick Cup is made of resin bonded sand. As in Celentanoet al. [23], the following thermal properties of the mold have beenadopted for the numerical simulations: density 1550 kg/m3, ther-mal conductivity 0.8 W/m K and specific heat 1000 J/kg K. Thethermal properties of both gray cast iron and ductile iron adoptedin this work refer to those used in Refs. [23] and [29]: density7000 kg/m3 and latent heat 228,097 J/kg. The specific heat andthermal conductivity are temperature-dependent material proper-ties and they are reported in Table 3. Note that a higher thermalconductivity is assumed when the temperature is higher than themelting temperature, in order to take into account the natural con-vection in the liquid phase.
The temperature evolution during the solidification processobtained in the numerical simulation is driven by the HTC atboundaries of the integration domain. On the one hand, the initialcooling of the melt after pouring is strictly related to the valueHTC chosen at the casting/mold interface. On the other hand, thecooling phase after the solidification process is controlled by theHTC adopted for the heat dissipation by convection/radiationthrough the surrounding environment. Both values have been cali-brated to match the experimental evidence. The resulting HTCused for the heat exchange between casting and mold surfaces is500 W/m2 K. A convection/radiation HTC of 50 W/m2 K hasbeen adopted to account for the heat dissipation through all theexternal surfaces of both the sand mold and the casting, exposedto the ambient temperature of 20 �C.
The comparison between the experimental measurements andthe prediction of the numerical model in terms of the temperatureevolution at the center of the casting is shown in Figs. 6 and 7 forthe eutectic and hypoeutectic alloy compositions, respectively.
Table 3 Quick cup test: thermal properties of cast iron
Temperature(�C)
Specific heat(J/kg K)
Temperature(�C)
Conductivity(W/m K)
20 500 420 41.0600 750 560 37.0800 750 700 33.61073 820 840 28.01155 840 980 22.51400 900 1120 18.8
1250 65.0
Fig. 6 Quick cup test: eutectic ductile cast iron. Temperatureevolution at the hot-spot during the solidification process.
Fig. 7 Quick cup test: hypoeutectic gray cast iron. Tempera-ture evolution at the hot-spot during the solidification process.
Table 4 Quick cup test: parameters used to characterize theeutectic model
Eutectic phase
TstartE ¼ 1170 �C
DTcritE ¼ 50 �CbE¼ 1
cE¼ 4
dE¼ 0
f 0E ¼ 0:1%
Journal of Heat Transfer AUGUST 2018, Vol. 140 / 082301-7

In the case of eutectic ductile cast iron, three different phasescan be clearly distinguished in the temperature evolution graphshown in Fig. 6: (i) a fast cooling of the liquid, (ii) a plateaucaused by the isothermal solidification of the eutectic phase andfinally, (iii) a sudden change in the slope of the temperature curve,denoting the end of solidification and the beginning of the finalcooling process.
The temperature curve resulting from the numerical analysisreproduces with great accuracy the three phases described above,including both the undercooling and the recalescence phenomenaproduced after the nucleation of the eutectic phase. The length ofthe solidification plateau (i.e., the solidification time) depends onthe actual value of latent heat, which is specified as a materialproperty, while the temperature evolution during the phase-change is strictly related to the solidification model adopted.
Table 4 shows the parameters used to feed the eutectic modelproposed in this work.
It can be noted that TstartE is a parameter of the model used to
trigger the beginning of the eutectic transformation. This valuecorresponds to the change in the cooling rate of the liquid phasecaused by the nucleation of the eutectic phase. The value of theeutectic temperature, TE is lower than Tstart
E and it corresponds tothe temperature plateau during the solidification process:TE¼ 1150 �C, characteristic for such alloy.
In the case of hypoeutectic gray cast iron, two different trans-formations take place during the solidification: first, the formationof the dendritic phase corresponding to the primary austenite c0,followed by the nucleation and growth of eutectic cells composedby secondary austenite c00 (also referred to as eutectic austenite)and graphite flakes [48]. Both transformations can be clearlyobserved in Fig. 7, where the temperature measurement and themodel prediction are compared. The dendritic growth of the pri-mary austenite starts when the temperature drops below the liqui-dus temperature, referred to as Tstart
L . A first plateau due to thelatent heat release of this transformation can be observed aroundthis temperature threshold. The model takes into account theincrease of carbon content in the liquid due to the dendritic growthby reducing the actual value of the liquidus temperature accordingto the solid fraction evolution as stated in Eq. (36). This affects
the cooling rate of the casting just before the eutectic transforma-tion. Additionally, by modifying the parameter, h, of the leverrule defined in Eq. (26), it is possible to split the latent heat deliv-ery intended for the dendritic and the eutectic transformations.The value chosen for this parameter depends on the actual compo-sition of the melt as well as on the inoculation treatment, allowingfor an easy calibration of the model response.
The parameters adopted to characterize the hypoeutectic modelare shown in Table 5.
A good agreement between the model prediction and the exper-imental evidence is achieved, capturing the temperature evolutionand the cooling rate in the casting during the phase change, aswell as the amount of latent heat released by the dendritic andeutectic transformation. Both dendritic and eutectic undercoolingand recalescence phenomena are reproduced with remarkableaccuracy.
5.2 Y-Shape Test. The Y-shape casting refers to a test pre-sented by Celentano et al. [23], and is repurposed in this work tovalidate the solidification model for hypoeutectic gray cast iron.
The geometry and the dimensions of the casting are shown inFig. 8. Specimens of this shape are commonly used for themechanical characterization of different alloys [51]. The top partof Y-shape geometry works as a simple riser to avoid porosities inthe lower part. Hence, it is possible to extract cylindrical samplesfrom the bottom part free of casting defects and showing a goodstructural integrity. During the casting process, a thermocouple,denoted by TCY, is placed at the midsection of the lower part ofthe casting sample in order to study the temperature evolution dur-ing the solidification. Note that this is not the hot spot of the cast-ing. Because of this, the cooling conditions observed in the Y-shape test are not the same as for the quick cup test. Furthermore,this benchmark test has larger thermal module with longer solidifi-cation times, more representative of industrial foundrycomponents.
The analysis is carried out in 2D with a FE discretization con-sisting of 2004 triangular elements and 1058 nodes and a timeincrement of: Dt¼ 1 s. The average mesh sizes adopted are 4 mmand 8 mm for the casting and the mold, respectively.
The mold is made of resin bonded sand with material propertiessimilar to the ones used for the Quick cup test. The main differen-ces lie in the different degree of sand compaction and humiditycontent. According to Ref. [23], the density is set to 1550 kg/m3,the specific heat is higher: c¼ 1300 J/kg K and, finally, the ther-mal conductivity is a temperature-dependent properties as shownin Table 6.
The casting alloy is a hypoeutectic gray cast iron with a muchhigher carbon content compared to the quick cup test-2 so that adifferent solidification behavior is expected. The reported chemi-cal composition is the following: 3.45% C, 2.4% Si, 0.66% Mn,0.014% S and 0.017% P with an inoculation melt treatment.Nevertheless, the same thermophysical material properties havebeen used as for the quick cup test. The differences between thetwo casting alloys are reflected in the parameters adopted for thesolidification model as shown in Table 7.
Table 5 Quick cup test: parameters used to characterize thehypoeutectic gray cast iron
Dendritic phase Eutectic phase
TstartL ¼ 1260 �C Tstart
E ¼ 1180 �CDTcrit
D ¼ 40 �C DTcritE ¼ 50 �C
bD¼ 1 bE¼ 1
cD¼ 4 cE¼ 4
dD¼ 0 dE¼ 0
f 0D ¼ 0:1% f 0
E ¼ 0:1%
h¼ 0.4
Fig. 8 Y-shape test geometry. Dimensions (in mm) of the cast-ing equipment. TCY denotes the thermocouple location.
Table 6 Y-shape test: thermal conductivity of the resin bondedsand
Temperature (�C) Conductivity (W/m K)
20 0.54300 0.57500 0.65700 0.79900 1.001100 1.261300 1.59
082301-8 / Vol. 140, AUGUST 2018 Transactions of the ASME

The pouring temperature is 1370 �C, used as homogeneous ini-tial temperature for the heat transfer analysis. The HTC coeffi-cients used to characterize the heat flux between casting and moldas well as used for the heat convection model are the same as forthe quick cup test.
Figure 9 shows a notable agreement between the experimentalmeasurements and the corresponding numerical results in terms oftemperature evolution at the thermocouple location TCY. Due tothe higher carbon content of the Y-shape test, the primary austen-itic phase has a smaller impact on the solidification trend than inthe quick cup test, showing a lower temperature of liquidus and amuch smaller temperature plateau corresponding to the dendritictransformation. This is reflected in the lower value of Tstart
L as wellas the lower value of the h parameter adopted.
5.3 Cubes Test. The cubes test refers to the casting settingpresented by Salsi et al. [52]. A cluster of seven cubes of differentsizes: 60, 75, 100, 120, 150, 180, and 210 mm, respectively, isinstrumented and an eutectic ductile iron alloy is used for the cast-ing operation. The cubes are labeled with the numbers 1–7
according to their ascending size as shown in Fig. 10. The molddimensions are: 1200 1600 mm2 and 640 mm height. The FEdiscretization consists of 1391 nodes and 2624 tetrahedral ele-ments. The average mesh sizes are: 3, 5, and 10 mm for the threecube sizes of 60, 100, and 180 mm, respectively. The time incre-ment used is: Dt¼ 1 s.
This casting experiment was designed to obtain a wide range ofsolidification conditions due to the increasing thermal modulesand, consequently, lower and lower cooling rates according to thecubes size. Hence, a wide range of microstructures and mechani-cal properties were obtained. The temperature evolution duringthe solidification has been recorded at the hot spot (center) of eachcube by means of different thermocouples (K-type chrome/aluminum) with alumina shielding to protect them against pro-longed expositions to high temperatures. The detailed descriptionof the experimental setting, materials, methods, and experimentalmeasurements can be found in Ref. [52]. Additional informationabout the metallurgical and mechanical properties and the micro-structure obtained for the different cubes of the casting arereported in Ref. [53].
This test allows for validating the solidification model in thecase of the more complex casting processes as well as to checkthe model accuracy when dealing with very different thermalmodules.
The casting alloy is a ductile iron with carbon content close tothe eutectic. The chemical composition is: 3.72% C, 2.19% Si,0.19% Mn, 0.048% Mg, 0.001% S and 0.025% P with inoculationmelt treatment and Mg addition. The thermophysical properties ofthe cast iron are the same as for quick cup test-1. If we comparethe two alloys, the cubes test presents a higher carbon and lowersilicon content. Table 8 shows the parameters used to characterizethe solidification model.
The mold is made of green sand and the same thermal proper-ties used in Ref. [52] have been adopted for the heat transfer anal-ysis presented in this work: density: 1370 kg/m3, specific heat:1030 J/kg K. The thermal conductivity is defined as atemperature-dependent property as shown in Table 9.
Despite a pouring temperature of 1350 �C, after the mold fillingoperation, the temperature field is not uniform. Hence, the initialtemperature for the following solidification and cooling phases isdifferent for each cube.
Figure 11 shows the temperature evolution recorded at thethermo-couples 1, 3, and 6 belonging to the cubes of 60, 100, and180 mm and compares them with the numerical results. The
Table 7 Y-shape test: parameters used to characterize thehypoeutectic alloy
Dendritic phase Eutectic phase
TstartL ¼ 1215 �C Tstart
E ¼ 1170 �CDTcrit
D ¼ 40 �C DTcritE ¼ 70 �C
bD¼ 1 bE¼ 1
cD¼ 4 cE¼ 4
dD¼ 0 dE¼ 0
f 0D ¼ 0:1% f 0
E ¼ 0:1%
h¼ 0.25
Fig. 9 Y-shape test. Temperature evolution at the thermocou-ple location TCY during the solidification process: experimentalmeasurement versus numerical result.
Fig. 10 Cubes test geometry. Dimensions (in mm) of the cubesin the casting experience.
Table 8 Cubes test: parameters used to characterize the solidi-fication model
Dendritic phase Eutectic phase
TstartL ¼ 1173 �C Tstart
E ¼ 1172 �CDTcrit
D ¼ 30 �C DTcritE ¼ 100 �C
bD¼ 1 bE¼ 1
cD¼ 4 cE¼ 4
dD¼ 0 dE¼ 0
f 0D ¼ 0:1% f 0
E ¼ 0:1%
h¼ 0.075
Table 9 Cubes test: thermal conductivity of the green sandmold
Temperature (�C) Conductivity (W/m K)
20 0.40200 0.45400 0.51705 0.591005 0.771300 1.13
Journal of Heat Transfer AUGUST 2018, Vol. 140 / 082301-9

measured temperatures show a first latent heat release previous tothe eutectic solidification, which is related to the formation of asmall amount of primary austenite phase ðc0Þ. Hence, the hypoeu-tectic model has been calibrated adopting a small value: h¼ 0.075for the partition ratio. Once again, the solidification model pro-posed presents a good agreement with the experimental evidencein terms of cooling rates, solidification times, undercooling and
recalescence phenomena for the three cubes, each one character-ized by a different thermal module. More in detail, it is possible toobserve how the undercooling and the recalescence are more pro-nounced for the smaller thermal modules. Contrarily, the tempera-ture of the eutectic plateau increases according to the size(thermal module) of the cubes. All these phenomena are well cap-tured by the proposed model.
5.3.1 Microstructural Analysis. The objective of this castingexperiment is the characterization of the ductile cast iron for dif-ferent cooling conditions and their influence on the final metallur-gical properties in terms of nodule density and grain sizedistribution. Hence, in the cubes test, the sensitivity to the differ-ent cooling conditions depends on: (i) the size of each cube; (ii)the distance from the center (thermal center) of the specimen. Theoutcome of this experimental campaign is detailed in Ref. [53].
The general trend in the experimental data shown in Fig. 12presents some fluctuation due to measurement uncertainties in theoptical analysis. Moreover, the microstructure is affected by someundesired phenomena such as the local segregation, the presenceof microporosity, or the degeneration of the graphite nodules nearthe mold surfaces due to the sulfur content of the sand mold.
The experimental measurements show a higher density ofgraphite nodules for the smaller cubes or near the external surfa-ces according to the corresponding higher cooling rates. Similarly,the grain size decreases with the distance from the center of thecubes. It is important to note that the radius of the eutectic grainhas been obtained multiplying the radius of the graphite nodule by
Fig. 11 Cubes test: evolution of the temperature field duringthe solidification. Comparison between the experimental meas-urements and the numerical results for the cubes 1, 3, and 6.
Fig. 12 Cubes test microstructures. Experimental measurements and numerical result formicrostructural main features (density of nodules and average grain radius) along a profilefrom the center to a vertex of cubes of 60, 100, 180 mm side.
082301-10 / Vol. 140, AUGUST 2018 Transactions of the ASME

a factor of 2.4 that is assuming a constant ratio between the sizeof the austenitic shell and graphite nodule for eutectic ductileirons [13].
These results have been used to calibrate the nucleation law inEq. (19) and the corresponding nucleation parameters are reportedin Table 10. The average grain size (within the hypothesis ofgraphite nodules surrounded by equiaxial austenitic shells) hasbeen estimated using Eq. (20).
The comparison between the experimental data and the numeri-cal predictions for cubes 1, 3, and 6 is shown in Fig. 12. In this fig-ure, both the nodules density and the average grain size arepresented as a function of the distance from the center of each ofthe three casting samples selected. There is a good agreementbetween the experiments and the numerical analysis even if theeutectic grain size predicted is slightly larger than the measure-ments. This can be attributed to the specific technique adopted forthe 2D optical analysis. In fact, using this method, the averagegrain size refers to a generic section of the casting sample wherethe cutting plane divides the eutectic grains, leading to a system-atic underestimation of their real sizes.
6 Conclusions
In this work, a novel solidification model suitable for botheutectic and hypoeutectic alloy compositions is described. Thelatent heat release is not defined by a generic temperature-dependent solid fraction function nor obtained from meso ormicroscale metallurgical models. Instead, a phenomenologicalmodel is introduced, depending on apropos evolution laws forboth the dendritic and the eutectic phases. Hence, the latent heatreleased by the different phases evolving during the liquid-to-solid phase-change is controlled by ad hoc Avrami-type functionsdefined for each phase.
The model allows to reproduce the recalescence phenomenaobserved during the solidification process as well as the thermalundercooling at the beginning of the phase-change.
The effects induced by the increase in the carbon contentobserved during the solidification process have also been consid-ered modifying the actual liquidus temperature according to thesolidification of the austenitic phase.
The model is complemented by defining a mixture ruleaccounting for the different thermophysical material properties ofall the phases, which coexist during the solidification process.
Finally, the average grain size (under the hypothesis of equiaxialgrain growth) resulting from the microstructure evolution duringthe phase-change process is obtained a posteriori by specifying asuitable nucleation law to estimate the actual nucleation density.
The proposed model is tested by reproducing the solidificationpatterns of both eutectic and hypoeutectic alloys. First, the modelhas been calibrated considering simple castings as the quick cuptest and the Y-shape test. Later, the numerical model is validatedusing the cubes test, a casting experiment closer to the foundryproduction. The comparison between the numerical results andthe experimental evidence shows a remarkable accuracy in termsof both temperature evolution and metallurgical features.
Acknowledgment
The collaboration with the Department of Industrial Engineer-ing (DIN) of the University of Bologna as well as the foundryexpertise from ProService-Tech is gratefully acknowledged.
Funding Data
� Financial support from the EU under the project: Robust andFlexible Cast Iron Manufacturing (FLEXICAST) within theSeventh Framework Programme—Factories of the Future(Ref. NMP-2012-ICT-FoF).
� The Marie Skłodowska-Curie Grant No. 746250 receivedwithin the EU research and innovation programme.
References[1] Morgan, K., Lewis, R. W., and Zienkiewicz, O. C., 1978, “An Improved Algo-
rithm for Heat Conduction Problems With Phase Change,” Int. J. Numer. Meth-ods Eng., 12(7), pp. 1191–1195.
[2] Clyne, T. W., 1982, “The Use of Heat Flow Modeling to Explore SolidificationPhenomena,” Metall. Trans. B, 13(3), pp. 471–478.
[3] Rappaz, M., 1989, “Modelling of Microstructure Formation in SolidificationProcesses,” Int. Mater. Rev., 34(1), pp. 93–123.
[4] Crowley, A. B., 1978, “Numerical Solution of Stefan Problems,” Int. J. HeatMass Transfer, 21(2), pp. 215–219.
[5] Desbiolles, J., Droux, J., Rappaz, J., and Rappaz, M., 1987, “Simulation of Sol-idification of Alloys by the Finite Element Method,” Comput. Phys. Rep.,6(1–6), pp. 371–383.
[6] Shamsundar, N., and Sparrow, E., 1975, “Analysis of Multidimensional Con-duction Phase Change Via the Enthalpy Model,” ASME J. Heat Transfer, 97(3),pp. 333–340.
[7] Rolph, D., and Bathe, K., 1982, “An Efficient Algorithm for Analysis of Non-linear Heat Transfer With Phase Changes,” Int. J. Numer. Methods Eng., 18(1),pp. 119–134.
[8] Chen, I. G., and Stefanescu, D. M., 1984, “Computer-Aided Differential Ther-mal Analysis of Spheroidal and Compacted Graphite Cast Irons,” AFS Trans.,92, pp. 947–964.
[9] Oliveira, M. J., Malheiros, L. F., and Ribeiro, C. A., 1999, “Evaluation of theHeat of Solidification of Cast Irons From Continuous Cooling Curves,” J.Mater. Process. Technol., 92–93, pp. 25–30.
[10] Bower, T. F., Brody, H. D., and Flemings, M. C., 1966, “Measurements of Sol-ute Redistribution in Dendritic Solidification,” Trans. Metall. Soc. AIME, 236,pp. 624–633.
[11] Scheil, E., 1942, “Comments on the Layer Crystal Formation,” Z. Metallkd.,34, pp. 70–72.
[12] Oldfield, W., 1966, “A Quantitative Approach to Casting Solidification: Freez-ing of Cast Iron,” ASM Trans., 59, pp. 945–959.
[13] Stefanescu, D. M., and Kanetkar, C., 1985, Computer Simulation of Microstruc-tural Evolution, D. J., Srolovitz, ed., The Minerals, Metals & Materials Society,Warrendale, PA, pp. 171–188.
[14] Stefanescu, D. M., Upadhya, G., and Bandypadhyay, D., 1990, “Heat Transfer-Solidification Kinetics Modeling of Solidification of Castings,” Metall. Trans.,21A(3), p. 997.
[15] Stefanescu, D. M., 2001, “Microstructure Evolution,” Modeling for Casting andSolidification Processing, K.-O. Yu, ed., RMI Titanum Company, Niles, OH,pp. 123–187.
[16] Thevoz, P., Desbioles, L., and Rappaz, M., 1989, “Modeling of EquiaxedMicrostructure Formation in Casting,” Metall. Trans. A, 20(2), pp. 311–322.
[17] Lesoult, G., Castro, M., and Lacaze, J., 1998, “Solidification of SpheroidalGraphite Cast Irons—I: Physical Modelling,” Acta Mater., 46(3), pp. 983–995.
[18] Lacaze, J., Castro, M., and Lesoult, G., 1998, “Solidification of SpheroidalGraphite Cast Irons—II: Numerical Simulation,” Acta Mater., 46(3),pp. 997–1110.
[19] Lacaze, J., 1999, “Solidification of Spheroidal Graphite Cast Irons—III: Micro-segregation Related Effects,” Acta Mater., 47(14), pp. 3779–3792.
[20] Wessen, M., and Svensson, I. L., 1996, “Modeling of Ferrite Growth in NodularCast Iron,” Metall. Mater. Trans. A, 27(8), pp. 2209–2220.
[21] Perez, E., Celentano, D., and O~nate, E., 1996, “Simulacion del proceso de solid-ificacion de la fundicion gris considerando un modelo microestructural,” ThirdCongreso de Metodos Numericos en Ingenieria, Zaragoza, Spain, June 3–6.
[22] Celentano, D. J., and Cruchaga, M., 1999, “A Thermally Coupled Flow Formu-lation With Microstructural Evolution for Hypoeutectic Cast-Iron Solid-ification,” Metall. Mater. Trans. B, 30(4), pp. 731–744.
[23] Celentano, D. J., Cruchaga, M., and Schulz, B., 2005, “Thermal MicrostructuralAnalysis of Grey Cast Iron Solidification: Simulation and Experimental Vali-dation,” Int. J. Cast Met. Res., 18(4), pp. 237–247.
[24] Celentano, D. J., Dardati, P. M., Godoy, L. A., and Boeri, R. E., 2008,“Computational Simulation of Microstructure Evolution During Solidificationof Ductile Cast Iron,” Int. J. Cast Met. Res., 21(6), pp. 416–426.
[25] Celentano, D. J., Dardati, P. M., Carazo, F. D., and Godoy, L. A., 2013,“Thermomechanical-Microstructural Modelling of Nodular Cast Iron Solid-ification,” Mater. Sci. Technol., 29(2), pp. 156–164.
[26] Cruchaga, M., and Celentano, D., 1998, “A Thermally Coupled Flow Formula-tion With Microstructural Phase-Change Effects,” Computational Mechanics,S. Idelsohn and E. O~nate, eds., International Centre for Numerical Methods inEngineering, Barcelona, Spain.
[27] Dardati, P. M., Godoy, L. A., Cervetto, G. A., and Paguaga, P., 2005,“Micromechanics Simulation During the Solidification of SG Cast-Iron,” Rev.Int. M�etodos Num�er. C�alc. Dis. Ing., 21(4), pp. 327–344.
Table 10 Cubes test: best suitable parameters for the nuclea-tion law
Nucleation parameters
K1¼ 236.5
K2¼ 53.5
m¼ 1
Journal of Heat Transfer AUGUST 2018, Vol. 140 / 082301-11
[28] Dardati, P. M., Godoy, L. A., and Celentano, D. J., 2006, “Microstructural Sim-ulation of Solidification Process of Spheroidal-Graphite Cast Iron,” ASME J.Appl. Mech., 73(6), pp. 977–983.
[29] Carazo, F., Dardati, M., Celentano, D., and Godoy, L., 2012, “Thermo-Metallurgical Modeling of Nodular Cast Iron Cooling Process,” Metall. Mater.Trans. B, 43B(6), pp. 1579–1594.
[30] Wetterfall, S., Friedricksson, H., and Hillert, M., 1972, “Solidification Processof Nodular Cast Iron,” J. Iron Steel Inst., 110, pp. 323–333.
[31] Gandin, C., and Rappaz, M., 1994, “A Coupled Finite Element-Cellular Autom-aton Model for the Prediction of Dendritic Grain Structures in SolidificationProcesses,” Acta Metall. Mater., 42(7), pp. 2233–2246.
[32] Gandin, C., and Rappaz, M., 1997, “A 3D Cellular Automaton Algorithm forthe Prediction of Dendritic Grain Growth,” Acta Mater., 45(5), pp. 2187–2195.
[33] Charbon, C., and Rappaz, M., 1997, Physical Metallurgy of Cast Iron V, G.Lesoult and J. Lacaze, eds., Scitec Publications, Uetikon-Zurich, Switzerland,pp. 453–460.
[34] Mahin, K. W., Hanson, K., and Morris, J. W., 1980, “Comparative Analysis ofthe Cellular and Johnson-Mehl Microstructures Through Computer Simu-lation,” Acta Metall., 28(4), pp. 443–453.
[35] Coussy, O., 1995, Mechanics of Porous Media, Wiley, New York.[36] Cervera, M., Oliver, J., and Prato, T., 1999, “Thermo-Chemo-Mechanical
Model for Concrete—I: Hydration and Aging,” J. Eng. Mech., 125(9), pp.1018–1027.
[37] Dantzig, J. A., and Rappaz, M., 2016, Solidification, 2nd ed., EPFL Press, Lau-sanne, Switzerland.
[38] Cervera, M., Agelet de Saracibar, C., and Chiumenti, M., 1999, “Thermo-Mechanical Analysis of Industrial Solidification Processes,” Int. J. Numer.Methods Eng., 46(9), pp. 1575–1591.
[39] Agelet de Saracibar, C., Cervera, M., and Chiumenti, M., 1999, “On the Formu-lation of Coupled Thermoplastic Problems With Phase-Change,” Int. J. Plastic-ity, 15(1), pp. 1–34.
[40] Agelet de Saracibar, C., Cervera, M., and Chiumenti, M., 2001, “On the Consti-tutive Modeling of Coupled Thermomechanical Phase-Change Problems,” Int.J. Plasticity, 17(12), pp. 1565–1622.
[41] Agelet de Saracibar, C., Chiumenti, M., and Cervera, M., 2006, “Current Devel-opments on the Coupled Thermomechanical Computational Modeling of MetalCasting Processes,” Int. J. Comp. Methods Mater. Sci., 6(1–2), pp. 1–11.
[42] Chiumenti, M., Agelet de Saracibar, C., and Cervera, M., 2008, “On the Numer-ical Modelling of the Thermo-Mechanical Contact for Metal Casting Analysis,”ASME J. Heat Transfer, 130(6), p. 061301.
[43] Boeri, R., 1989, “The Solidification of Ductile Cast Iron,” Ph.D. thesis, Univer-sity of British Columbia, Vancouver, BC, Canada.
[44] Avrami, M., 1939, “Kinetics of Phase Change—I: General Theory,” J. Chem.Phys., 7(12), pp. 1103–1112.
[45] Avrami, M., 1940, “Kinetics of Phase Change—II: Transformation-Time Rela-tions for Random Distribution of Nuclei,” J. Chem. Phys., 8(2), pp. 212–224.
[46] Avrami, M., 1941, “Kinetics of Phase Change—III: Granulation, Phase Change,and Microstructure,” J. Chem. Phys., 9(2), pp. 177–184.
[47] Stefanescu, D. M., 1996, “Methodologies for Modeling of Solidification Micro-structure and Their Capabilities,” ISIJ Int., 35(6), pp. 637–650.
[48] Rivera, G. L., Boeri, R. E., and Sikora, J. A., 2004, “Solidification of Gray CastIron,” Scr. Mater., 50(3), pp. 331–335.
[49] Cervera, M., Agelet de Saracibar, C., and Chiumenti, M., 2002, “COMET:Coupled Mechanical and Thermal Analysis,” Data Input Manual, Version 5.0,International Centre for Numerical Methods in Engineering (CIMNE), Barce-lona, Spain, Technical Report No. IT-308.
[50] Heroeus Electro-Nite, 2018, Thermal Analysis of Cast Iron, Heraeus Electro-Nite International N.V, Houthalen, Belgium.
[51] ASM, 1988, ASM Metals Handbook: Casting, 9th ed., Vol. 15, ASM Interna-tional, Materials Park, OH.
[52] Salsi, E., Squatrito, R., Todaro, I., and Tomesani, L., 2014, “Process Modeling andMicrostructure Prediction Validation of Sand Ductile Iron Castings, Advanced Sus-tainable Foundry,” 71st World Foundry Congress, Bilbao, Spain, May 19–21, pp.1536–1543.
[53] Ceschini, L., Morri, A., Morri, A., Salsi, E., Squatrito, R., Todaro, I., and Tome-sani, L., 2015, “Microstructure and Mechanical Properties of Heavy SectionDuctile Iron Castings: Experimental and Numerical Evaluation of Effects ofCooling Rates,” Int. J. Cast Met. Res., 28(6), pp. 365–374.
082301-12 / Vol. 140, AUGUST 2018 Transactions of the ASME


![Biological Dose Comparison between a Fixed RBE and a ...distribution, RBE was obtained by the FRBE of 1.1 and the phenomenological RBE model [22]. This phenomenological model can calculate](https://img.dokumen.tips/doc/110x75/5f105b9f7e708231d448b6af/biological-dose-comparison-between-a-fixed-rbe-and-a-distribution-rbe-was-obtained.jpg)