Embed Size (px)
Citation preview

International Journal of Heat and Mass Transfer xxx (2008) xxx–xxx
ARTICLE IN PRESS
Contents lists available at ScienceDirect
International Journal of Heat and Mass Transfer
journal homepage: www.elsevier .com/locate/ i jhmt
A performance evaluation plot of enhanced heat transfer techniquesoriented for energy-saving
J.F. Fan, W.K. Ding, J.F. Zhang, Y.L. He, W.Q. Tao *
School of Energy & Power Engineering, Xi’an Jiaotong University, Xi’an, Shaanxi 710049, PR China
a r t i c l e i n f o a b s t r a c t
Article history:Received 9 April 2008Received in revised form 27 June 2008Available online xxxx
0017-9310/$ - see front matter � 2008 Elsevier Ltd. Adoi:10.1016/j.ijheatmasstransfer.2008.07.006
* Corresponding author.E-mail address: [email protected] (W.Q. Tao
Please cite this article in press as: J.F. FanTransfer (2008), doi:10.1016/j.ijheatmasst
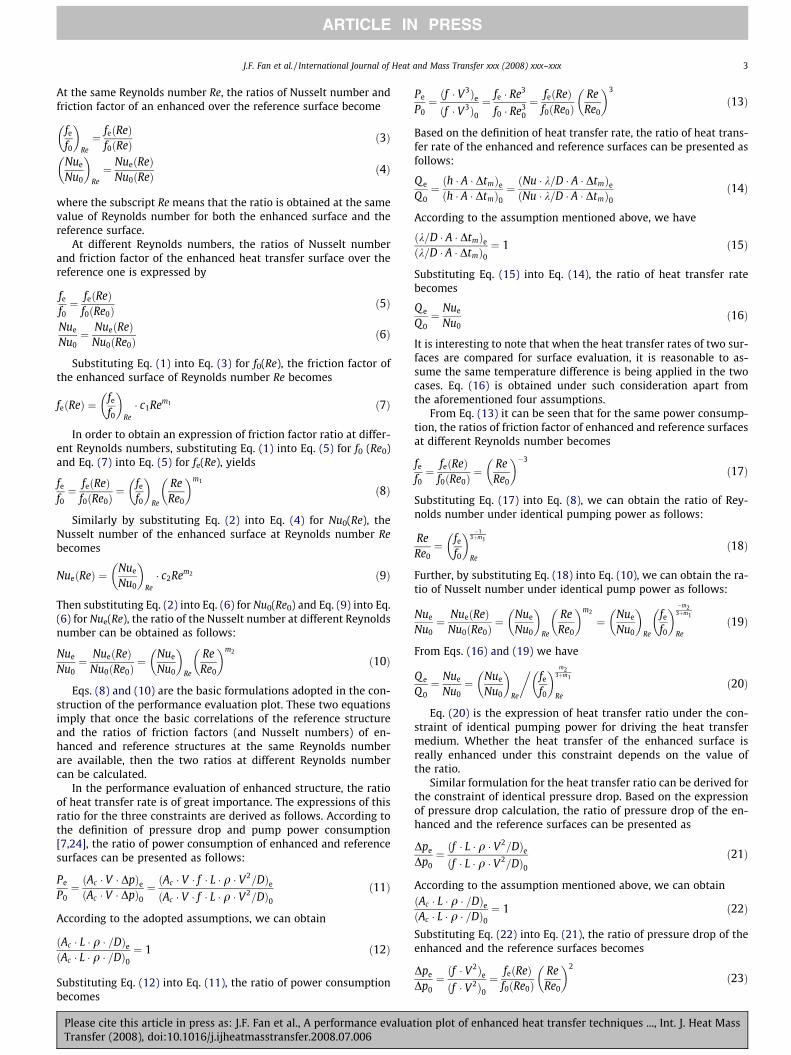
On the basis of the existing performance evaluation criteria analysis and four assumptions, a performanceevaluation plot has been proposed in this paper. This plot takes the ratios of heat transfer enhancementand friction factor increase as its two coordinates. The quadrant of the coordinate where both (Nue/Nu0),(fe/f0) are greater than 1.0 can be divided into four regions. In Region 1 heat transfer is actually deterio-rated based on identical pumping power, in Region 2 heat transfer is enhanced based on identical pump-ing power but deteriorated based on identical pressure drop, in Region 3 heat transfer is enhanced basedon identical pressure drop but the increase in friction factor is larger than the enhancement of heat trans-fer at identical flow rate, and in Region 4 heat transfer enhancement ratio is larger than friction factorincrease ratio based on identical flow rate. For some techniques which lead to the reduction of both heattransfer rate and friction factor, the proposed plot is still applicable. Different enhanced techniques forthe same reference one can be easily and clearly compared for their effectiveness when enhancementstudy is based on energy-saving. Five practical examples are provided to show the functions of the plot.
� 2008 Elsevier Ltd. All rights reserved.
1. Introduction
Heat exchangers are widely used in many engineering fields forthe transport of heat (energy) from one fluid to the other. Examplesinclude gas heating in waste heat recovery and gas cooling in inter-cooler of compressor, refrigerant evaporation and condensation inair-conditioning, liquid heat transfer in chemical and processingequipment, steam generation and condensation in power plants,etc. Heat transfer enhancement techniques provide a powerful toolto improve the thermal performance of heat exchangers, includingthe reduction of its size and cost, and to save energy for its opera-tion. According to [1], the purposes of heat transfer enhancementstudy may be classified into four objectives. Simply speaking, theyare (1) reducing heat transfer surface area; (2) reducing tempera-ture difference; (3) increasing heat transfer rate; and (4) reducingpumping power. Extensive data have been published on variouskinds of heat transfer promoters of heat exchangers [2,3], and allof these heat transfer promoters cause an increase of pressure losscross the exchanger. It is a common knowledge that the ratio ofpressure drop increase is often larger than the ratio of heat transferenhancement. For example, the very effective offset strip fins usedin compact heat exchangers has its ratio of j factor and friction fac-tor j/f being only 80% of that of a plain fin [4], i.e., the increase inthe j-factor is only 80% of the increase in pressure drop. Thus withthe development of heat transfer enhancement techniques, thequestion of how to evaluate the enhancement technique is also
ll rights reserved.
).
et al., A performance evaluaransfer.2008.07.006
brought to attention. A qualitative comparison for enhanced heattransfer surface is an important issue in evaluating the perfor-mance improvement of the enhancement techniques. In 1972Webb and Eckert [5] developed equations to define the perfor-mance advantage of roughened tubes in heat exchanger design rel-ative to smooth tubes of equal diameter. To the authors’knowledge this is probably the first paper concerning the evalua-tion criterion for heat transfer enhancement technique. Since thena great number of evaluation methods have been proposed. Theseinclude the 12 combinations for the single-phase flow heat transferproposed in [1,6]; the criteria based on identical pumping power/identical pressure drop [7–12]; the goodness factor [13,14] usedin plate fin–tube surfaces, the criterion based on correlating theheat transfer coefficient and the dissipation energy in a fluid[15]; and the performance assessment methods based on the 2ndlaw of thermodynamics by computing the entropy generation, orexergy generation in the enhancement processes [16–23]. Broadlyspeaking, all the existing assessment methods, or criteria, can beclassified into two categories. In one category of assessment meth-ods, the 2nd law of the thermodynamics is applied and either en-tropy or exergy generated is determined, while in the othercategory discussion is only based on the 1st law of thermodynam-ics in that no computation of entropy or exergy generation is in-volved. From an academic point of view the first category seemsmeaningful, but they have not found wide engineering applica-tions. In this paper, we will concentrate on the second categoryin the sense that we will not compute exergy or entropy for thecomparison purpose, yet we can still identify the effectiveness ofan enhancement technique. As indicated in [24], many factors have
tion plot of enhanced heat transfer techniques ..., Int. J. Heat Mass

Nomenclature
Latin symbolsA heat transfer surface area, m2
Ac frontal cross-section area, m2
b intercept of straight linec1, c2 coefficient in equationCQ,P the ratio of heat transfer rate between enhanced and
reference surfaces under identical pumping powerCQ,V the ratio of heat transfer rate between enhanced and
reference surfaces over the ratio of friction factor be-tween enhanced and reference surfaces under identicalflow rate
CQ ,Dp the ratio of heat transfer rate between enhanced andreference surfaces under identical pressure drop
D hydraulic diameter, mf friction factorh heat transfer coefficient, W/(m2 K)j j-factor, Colburn factork slope of straight lineL length of the flow passage, mNu Nusselt numberP pumping power, Wq fluid flow rate, kg/s
Q heat transfer rate, WRe Reynolds numberV flow velocity of fluid, m/s
Greek symbolsDp pressure drop, PaDt wall-to-fluid temperature difference, Kk thermal conductivity of fluid, W/(m K)q fluid density, kg/m3
Superscriptsm1, m2 exponent in equation
Subscripts0 reference surface or smooth surfacee augmented surfacem mean valueP under equal pumping powerRe under equal Reynolds numberV under equal flow rateDp under equal pressure drop
2 J.F. Fan et al. / International Journal of Heat and Mass Transfer xxx (2008) xxx–xxx
ARTICLE IN PRESS
to be considered in the construction of the assessment criteria,including economic, manufacturability, reliability, and safety,among others. Thus it seems impossible to establish a generallyapplicable selection criteria [6].
With the emerging of worldwide crises of energy shortage, theenergy-saving purpose of heat transfer enhancement has becomemore crucial and has attracted more and more attention of theinternational heat transfer community. In this regard, the evalua-tion approach based in the comparison between enhanced and ori-ginal (or reference) heat transfer surfaces (or structure) foridentical flow rate, identical pressure drop and identical pumpingpower [7–12] seems more suitable. These criteria will be adoptedin this paper.
In another development, for a visual presentation of the perfor-mance of heat transfer enhancement technique different kinds ofplots have been suggested. These include the plots of heat transferratio vs. Reynolds number, the surface area ratio vs. Reynolds num-ber, and the combined j-factor, f-factor vs. Reynolds number [24].Among all the existing plots none can be used to indicate whetherthe heat transmitted per unit pumping power can be increased, orwhether the heat transmitted per unit pressure drop can be in-creased. The major purpose of the present paper is to propose sucha plot for the study on heat transfer enhancement techniques ori-ented towards energy-saving.
In the following presentation, the equations for constructing ofsuch a plot will first be derived, followed by the introduction of theplot components. Following this the application of such a plot willbe illustrated taking several existing enhancement techniques asexamples. Finally some conclusions will be drawn.
2. The basic equations for constructing performance evaluationplot
First it is to be noted that by performance evaluation we meanthe comparison of heat transfer and pressure drop characteristicsof an enhanced structure with a reference structure which pos-sesses the same basic dimensions except the part of enhancedstructure. As indicated by Marner et al. [25], an equivalent parallelplate duct or an empty tube has often served as such a reference
Please cite this article in press as: J.F. Fan et al., A performance evaluaTransfer (2008), doi:10.1016/j.ijheatmasstransfer.2008.07.006
geometry. For the convenience of presentation, all the physicalquantities related to the reference geometry will be denoted by asubscript 0.
To facilitate the comparison process, the performance evalua-tion is based on the following assumptions:
(1) The thermophysical properties of fluid are constant [1].(2) Heat transfer area used for calculating the convective heat
transfer coefficient of enhanced surface is the same as thatof the reference one [1].
(3) The cross-sectional area used for calculating the averagevelocity of fluid of enhanced surface is the same as that ofthe reference one.
(4) The reference dimension used for calculating the dimension-less characteristic number of enhanced surface is the sameas that of the reference one.
Most of enhanced heat transfer technologies and data reductionmethods meet these assumptions in engineering applications, andin some sense, only based on the above assumptions, the perfor-mance comparison is meaningful between an enhanced and thereference one.
From our own comparison experiences a convenient and practi-cal way for performance comparison can be made as follows:through experimental or numerical investigations, the ratios ofheat transfer and pressure drop of an enhanced surface over thereference one are obtained, and the correlations of friction factorand heat transfer for the reference surface are available, then per-formance comparison between the two surfaces are conducted in asimple and explicit manner without further computation. In orderto construct the performance evaluation plot which can meet theabove requirement, derivations of some basic equations are pre-sented as follows.
Assuming that the relevant correlations of the average frictionfactors and Nusselt number can be fitted for the reference structureas follows:
f0ðReÞ ¼ c1Rem1 ð1ÞNu0ðReÞ ¼ c2Rem2 ð2Þ
tion plot of enhanced heat transfer techniques ..., Int. J. Heat Mass
J.F. Fan et al. / International Journal of Heat and Mass Transfer xxx (2008) xxx–xxx 3
ARTICLE IN PRESS
At the same Reynolds number Re, the ratios of Nusselt number andfriction factor of an enhanced over the reference surface become
fe
f0
� �Re¼ feðReÞ
f0ðReÞ ð3Þ
Nue
Nu0
� �Re
¼ NueðReÞNu0ðReÞ ð4Þ
where the subscript Re means that the ratio is obtained at the samevalue of Reynolds number for both the enhanced surface and thereference surface.
At different Reynolds numbers, the ratios of Nusselt numberand friction factor of the enhanced heat transfer surface over thereference one is expressed by
fe
f0¼ feðReÞ
f0ðRe0Þð5Þ
Nue
Nu0¼ NueðReÞ
Nu0ðRe0Þð6Þ
Substituting Eq. (1) into Eq. (3) for f0(Re), the friction factor ofthe enhanced surface of Reynolds number Re becomes
feðReÞ ¼ fe
f0
� �Re
� c1Rem1 ð7Þ
In order to obtain an expression of friction factor ratio at differ-ent Reynolds numbers, substituting Eq. (1) into Eq. (5) for f0 (Re0)and Eq. (7) into Eq. (5) for fe(Re), yields
fe
f0¼ feðReÞ
f0ðRe0Þ¼ fe
f0
� �Re
ReRe0
� �m1
ð8Þ
Similarly by substituting Eq. (2) into Eq. (4) for Nu0(Re), theNusselt number of the enhanced surface at Reynolds number Rebecomes
NueðReÞ ¼ Nue
Nu0
� �Re
� c2Rem2 ð9Þ
Then substituting Eq. (2) into Eq. (6) for Nu0(Re0) and Eq. (9) into Eq.(6) for Nue(Re), the ratio of the Nusselt number at different Reynoldsnumber can be obtained as follows:
Nue
Nu0¼ NueðReÞ
Nu0ðRe0Þ¼ Nue
Nu0
� �Re
ReRe0
� �m2
ð10Þ
Eqs. (8) and (10) are the basic formulations adopted in the con-struction of the performance evaluation plot. These two equationsimply that once the basic correlations of the reference structureand the ratios of friction factors (and Nusselt numbers) of en-hanced and reference structures at the same Reynolds numberare available, then the two ratios at different Reynolds numbercan be calculated.
In the performance evaluation of enhanced structure, the ratioof heat transfer rate is of great importance. The expressions of thisratio for the three constraints are derived as follows. According tothe definition of pressure drop and pump power consumption[7,24], the ratio of power consumption of enhanced and referencesurfaces can be presented as follows:
Pe
P0¼ ðAc � V � DpÞeðAc � V � DpÞ0
¼ ðAc � V � f � L � q � V2=DÞeðAc � V � f � L � q � V2=DÞ0
ð11Þ
According to the adopted assumptions, we can obtain
ðAc � L � q � =DÞeðAc � L � q � =DÞ0
¼ 1 ð12Þ
Substituting Eq. (12) into Eq. (11), the ratio of power consumptionbecomes
Please cite this article in press as: J.F. Fan et al., A performance evaluaTransfer (2008), doi:10.1016/j.ijheatmasstransfer.2008.07.006
Pe
P0¼ ðf � V
3Þeðf � V3Þ0
¼ fe � Re3
f0 � Re30
¼ feðReÞf0ðRe0Þ
ReRe0
� �3
ð13Þ
Based on the definition of heat transfer rate, the ratio of heat trans-fer rate of the enhanced and reference surfaces can be presented asfollows:
Q e
Q0¼ ðh � A � DtmÞeðh � A � DtmÞ0
¼ ðNu � k=D � A � DtmÞeðNu � k=D � A � DtmÞ0
ð14Þ
According to the assumption mentioned above, we have
ðk=D � A � DtmÞeðk=D � A � DtmÞ0
¼ 1 ð15Þ
Substituting Eq. (15) into Eq. (14), the ratio of heat transfer ratebecomes
Q e
Q0¼ Nue
Nu0ð16Þ
It is interesting to note that when the heat transfer rates of two sur-faces are compared for surface evaluation, it is reasonable to as-sume the same temperature difference is being applied in the twocases. Eq. (16) is obtained under such consideration apart fromthe aforementioned four assumptions.
From Eq. (13) it can be seen that for the same power consump-tion, the ratios of friction factor of enhanced and reference surfacesat different Reynolds number becomes
fe
f0¼ feðReÞ
f0ðRe0Þ¼ Re
Re0
� ��3
ð17Þ
Substituting Eq. (17) into Eq. (8), we can obtain the ratio of Rey-nolds number under identical pumping power as follows:
ReRe0¼ fe
f0
� � �13þm1
Re
ð18Þ
Further, by substituting Eq. (18) into Eq. (10), we can obtain the ra-tio of Nusselt number under identical pump power as follows:
Nue
Nu0¼ NueðReÞ
Nu0ðRe0Þ¼ Nue
Nu0
� �Re
ReRe0
� �m2
¼ Nue
Nu0
� �Re
fe
f0
� � �m23þm1
Reð19Þ
From Eqs. (16) and (19) we have
Q e
Q0¼ Nue
Nu0¼ Nue
Nu0
� �Re
�fe
f0
� � m23þm1
Reð20Þ
Eq. (20) is the expression of heat transfer ratio under the con-straint of identical pumping power for driving the heat transfermedium. Whether the heat transfer of the enhanced surface isreally enhanced under this constraint depends on the value ofthe ratio.
Similar formulation for the heat transfer ratio can be derived forthe constraint of identical pressure drop. Based on the expressionof pressure drop calculation, the ratio of pressure drop of the en-hanced and the reference surfaces can be presented as
Dpe
Dp0¼ ðf � L � q � V
2=DÞeðf � L � q � V2=DÞ0
ð21Þ
According to the assumption mentioned above, we can obtainðAc � L � q � =DÞeðAc � L � q � =DÞ0
¼ 1 ð22Þ
Substituting Eq. (22) into Eq. (21), the ratio of pressure drop of theenhanced and the reference surfaces becomes
Dpe
Dp0¼ ðf � V
2Þeðf � V2Þ0
¼ feðReÞf0ðRe0Þ
ReRe0
� �2
ð23Þ
tion plot of enhanced heat transfer techniques ..., Int. J. Heat Mass

1 2 6 80.90.7fe/ f 0
1
10
2
4
6
8
0.9
0.7
Nu
e/N
u0
12
3
4(Qe/Q0)/(f e/f 0)=1
(Qe/Q0)/( pe/ p0)=1
(Qe/Q0)/(Pe/P0)=1
1
4 10
Fig. 1. A performance evaluation plot for enhancement technique oriented forenergy-saving.
4 J.F. Fan et al. / International Journal of Heat and Mass Transfer xxx (2008) xxx–xxx
ARTICLE IN PRESS
From Eq. (23) it can be seen that for the same pressure drop, the ra-tios of friction factor of enhanced and reference surfaces at differentReynolds number becomes
fe
f0¼ feðReÞ
f0ðRe0Þ¼ Re
Re0
� ��2
ð24Þ
Substituting Eq. (24) into Eq. (8), the ratio of Reynolds number un-der identical pressure drop becomes
ReRe0¼ fe
f0
� � �12þm1
Reð25Þ
Further, by substituting Eq. (25) into Eq. (10), the ratio of Nusseltnumber under identical pressure drop becomes
Nue
Nu0¼ NueðReÞ
Nu0ðRe0Þ¼ Nue
Nu0
� �Re
ReRe0
� �m2
¼ Nue
Nu0
� �Re
fe
f0
� � �m22þm1
Re
ð26Þ
Substituting Eq. (26) into Eq. (16), we can obtain
Q e
Q 0¼ Nue
Nu0¼ Nue
Nu0
� �Re
�fe
f0
� � m22þm1
Re
ð27Þ
Eq. (27) is the expression of heat transfer ratio under the con-straint of identical pressure drop for driving the heat transfer med-ium. Whether the heat transfer of the enhanced structure is reallyenhanced under this constraint depends on the value of this ratio.
The heat transfer enhancement ratio between enhanced andreference surfaces for the constraint of identical flow rate casecan be simply copied from Eq. (16) as follows:
Q e
Q 0¼ Nue
Nu0
� �Re
ð28Þ
When experiments are conducted for the heat transfer and fric-tion factor characteristics of enhanced and reference surfaces, theratios of friction factor and Nusselt number at the same Reynoldsnumbers are often obtained. It is often required that based on suchdata, heat transfer performance comparisons can be examinedunder different constraints. Thus it will be convenient for theperformance evaluation plot that the two ratios, i.e. (fe/f0)Re and(Nue/Nu0)Re (or (je/j0)Re), are taken as the two coordinates and thecomprehensive performance of the enhanced surface can bejudged from the plot. For this purpose some transformation areconducted based on the three equations, i.e., Eqs. (20), (27) and(28).
The above three equations can be unified in the following form:
CQ ;i ¼Nue
Nu0
� �Re
�fe
f0
� �ki
Reði ¼ P;Dp;VÞ ð29Þ
where P, Dp, V stand for identical pumping power, identical pres-sure drop and identical flow rate, respectively.
By comparison of Eq. (29) with Eqs. (20), (27) and (28), then
For identical pumping power : CQ ;P ¼Q e
Q 0
� ��Pe
P0
� �¼Qe
Q0; kP ¼
m2
3þm1
ð30aÞ
For identical pressure drop : CQ ;Dp ¼Q e
Q 0
� ��Dpe
Dp0
� �¼Qe
Q0; kDp ¼
m2
2þm1
ð30bÞ
For identical flow rate : CQ ;V ¼Qe
Q0
� ��fe
f0
� �; kV ¼1:0 ð30cÞ
By taking the logarithm of Eq. (29), we have
lnNue
Nu0
� �Re
¼ bi þ ki lnfe
f0
� �Re
ð31Þ
where for the three constraints the constant term bi takes the valuesof ln CQ,P, ln CQ,Dp, and ln CQ,V, respectively.
Please cite this article in press as: J.F. Fan et al., A performance evaluaTransfer (2008), doi:10.1016/j.ijheatmasstransfer.2008.07.006
Eq. (31) provides the framework of our performance evaluationplot. It can be easily observed that if we take ln(fe/f0)Re, ln (Nue/Nu0)Re as the abscissa and ordinate, respectively, then Eq. (31)represents a straight line in such a coordinates system, for whichki is the slope and bi is the intercept of straight line in log–log coor-dinate system. Such straight lines are called performance lines. Wecan give both bi and ki some physical interpretations. The value ofbi is an indication related to the heat transfer enhancement underdifferent constraint conditions. It represents either the ratio of heattransfer rate under the identical pumping power constraint andidentical pressure drop constraint, or it represents the ratio of in-crease in the heat transfer rate and increase in the friction factorat the same flow rate. When b = 0, the straight line crosses thepoint of coordinate (1,1) and this means that the enhanced and ref-erence surfaces possess the same heat transfer rates under the cor-responding constraint conditions. When b > 0, the enhanced heattransfer surface can transfer a larger heat transfer rate than thatof the reference one, and when b < 0, the enhanced heat transfersurface transmits a lower heat transfer rate.
As far as the slope k is concerned, the magnitudes of the threeconstraints can be estimated as follows. For the convective heattransfer and fluid flow problems known to the authors, the rangeof variables m1 and m2 are �1 6m1 < 0 and 0 < m2 < 1, respectively.So the following magnitude relationship can be obtained
0 <m2
3þm1<
m2
2þm1< 1 ð32Þ
Thus the slope of the performance line of identical pumping poweris less than that of identical pressure drop, which in turn less thanthat of identical flow rate. We then can conclude that: it is the eas-iest way to obtain the enhanced heat transfer under the identicalpumping power constraint; it is relatively easy to obtain the in-crease of heat transfer rate under the identical pressure drop con-straint; while it is quite difficult to obtain a higher heat transferrate increase than that of friction coefficient under the same flowrate. This conclusion is consistent with our common understanding.
According to above discussion and derivations a performanceevaluation plot for heat transfer enhancement techniques orientedfor energy-saving is proposed in Fig. 1. In the figure the twocoordinates are log–log based. The abscissa of the figure presents
tion plot of enhanced heat transfer techniques ..., Int. J. Heat Mass

J.F. Fan et al. / International Journal of Heat and Mass Transfer xxx (2008) xxx–xxx 5
ARTICLE IN PRESS
the friction coefficient ratio between the enhanced and referencesurfaces under the same Reynolds numbers, and the ordinate pre-sents the Nusselt number (or j-factor, or Stanton number) ratio be-tween the enhanced and reference surfaces under the sameReynolds numbers. The components of this performance evalua-tion plot are as follows. There are two major components in theplot. One of the two major components of the plot is an array ofa straight lines with different slopes through the point with coor-dinates (1,1). The plot can be divided into four regions indicatedby the four Arabic numbers in boldface in Fig. 1. Region 1 is char-acterized by enhanced heat transfer without energy-saving, where
1 10fe/ f0
1
10
Nu e
/Nu 0
Qe/Q0=6
Pe/P0=1,Qe/Q0=1
4
3
2
1.5
5
2.5
A
Qe/Q0=1.25
1.75
3.5
4.5
Fig. 2. The refined contours of heat transfer enhancement ratio for identicalpumping power.
1 10fe /f0
1
10
Nu e
/Nu 0
Qe/Q0=6
Pe/P0=1,Qe/Q0=1
pe/ p0=1,Qe/Q0=1
Qe/Q0=5
Qe/Q0=4
Qe/Q0=3
Qe/Q0=2.5
Qe/Q0=2
Qe/Q0=1.5 Δ Δ
Fig. 3. The contours of heat transfer enhancement ratio under identical pressuredrop.
Please cite this article in press as: J.F. Fan et al., A performance evaluaTransfer (2008), doi:10.1016/j.ijheatmasstransfer.2008.07.006
the enhancement of heat transfer rate is less than the increase ofpower consumption. Region 2 is featured by enhanced heat trans-fer with the same pump power consumption, i.e., where the en-hanced surface presents higher heat transfer rate than referenceone under the same pumping power consumption. In Region 3 en-hanced heat transfer can be obtained with the same pressure drop,i.e., where the enhanced surface presents higher heat transfer ratethan the reference one under the identical pressure drop con-straint. Finally Region 4 is the most favorable one where the aug-mentation of heat transfer rate is more than the increase offriction coefficient under the same flow rate. The boundary lineof Regions 1 and 2 is the dividing line of heat transfer enhancement
1 10fe / f0
1
10
Nu e
/Nu 0
(Qe/Q0)/(Pe/P0)=1(Qe/Q0)/( pe/ p0)=1
(Qe/Q0)/(f e/f 0)=1
12
345
5'
Δ Δ
Fig. 5. The working lines showing effectiveness of energy-saving.
1 10f e /f 0
1
10
Nu e
/Nu 0
CQ,V=6
Pe/P0=1,Qe/Q0=1
pe/ p0=1,Qe/Q0=1
qe/q0=1,CQ,V=1CQ,V=3
CQ,V=4
CQ,V=2
CQ,V=1.5
CQ,V=5
CQ,V=2.5
CQ,V=(Qe/Q0)/ (f e/ f 0)
Δ Δ
Fig. 4. The contours of CQ,V under identical flow rate.
tion plot of enhanced heat transfer techniques ..., Int. J. Heat Mass

Fig. 6. Arrangements of three kinds of slotted-fin surfaces and the referenced plate.
1 2 31
2
3
Nu e
/Nu 0
slit b
slit c
slit d
CQ,P=1CQ,Δp=1
CQ,V=1
f e /f 0
Fig. 7. Performance comparisons of three kinds of slotted fin in [26] for energy-saving objective.
6 J.F. Fan et al. / International Journal of Heat and Mass Transfer xxx (2008) xxx–xxx
ARTICLE IN PRESS
Please cite this article in press as: J.F. Fan et al., A performance evaluaTransfer (2008), doi:10.1016/j.ijheatmasstransfer.2008.07.006
or deterioration of the enhanced surfaces compared with the refer-ence ones based on the identical pumping power consumption. Theboundary line of Regions 2 and 3 is the dividing line of heat trans-fer enhancement and deterioration for the enhanced surfaces com-pared with the reference ones based on the identical pressure drop.The boundary line of Regions 3 and 4 is the dividing line judgingthe level of the ratio of increase of heat transfer rate and frictioncoefficient for the enhanced surfaces compared with the referenceones under the same fluid flow rate. All the above-mentionedstraight lines cross the point (1,1) and will be called the baselinesfor clarity. The boldface baselines are drawn from Eq. (31) byapplying the corresponding constraint and condition. For example,the boundary line between Regions 1 and 2 is constructed underthe conditions of Pe/P0 = 1 and Qe/Q0 = 1. The slopes of these base-lines are drawn from Eqs. (30a), (30b) and (30c), where the valuesof variables m1 and m2 come from the relevant correlations for theturbulent flow and heat transfer in smooth tubes, i.e., the value ofvariables m1 and m2 are �0.25 and 0.8, respectively [15], unlessotherwise specified. The other of the two major components in thisplot are the lines representing the performance of some enhancingstructure, which are called the working lines. Any point on theworking line is called a working point. According to the above dis-cussion, there are three kinds of working lines corresponding to thethree constraints, respectively. These three working lines are char-acterized by their slope (i.e., the value of ki in Eq. (31)). As indicatedabove, the greater the value of the working line slope, the more se-
tion plot of enhanced heat transfer techniques ..., Int. J. Heat Mass

J.F. Fan et al. / International Journal of Heat and Mass Transfer xxx (2008) xxx–xxx 7
ARTICLE IN PRESS
vere the comparison constraint. For energy-saving purposes, thelarger the slope of the working line, the better the enhanced tech-nique. As far as different points on the same working line are con-cerned, they have the same enhanced heat transfer ratio undercorresponding friction loss constraint. Therefore, the working linesare the contours of the heat transfer enhancement ratio under dif-ferent constraints.
The contours of heat transfer enhancement ratio for identicalpumping power can be constructed according to Eq. (31).According to the previous analysis, the contour of heat transferenhancement ratio is a group of parallel working lines on thelog–log coordinate plot. The better the enhancement effective-ness, the larger the intercept of the straight line. The distancebetween the contours (i.e., working lines) can be controlled byrearranging the value of the intercept b according to actualneeds. In order to show explicitly the heat transfer augmentationratio of Point A (3.25), the contours are refined and the resultsare shown in Fig. 2.
Fig. 8. Three ‘‘front sparse and rear dense” slo
Please cite this article in press as: J.F. Fan et al., A performance evaluaTransfer (2008), doi:10.1016/j.ijheatmasstransfer.2008.07.006
The contours of heat transfer enhancement ratios for identicalpressure drop and identical flow rate can be obtained in a similarway to Fig. 2 and are shown in Figs. 3 and 4.
Some applications of the present plot are illustrated in the fol-lowing section.
3. Major functions of the proposed performance evaluation plot
3.1. Determining whether the enhancement technique can really saveenergy (pumping power)
In Fig. 1 the shaded region is the case of enhanced heat trans-fer without energy-saving, i.e., when a working point of anenhancement technique is located in this region the consump-tion of unit pumping power leads to less heat transfer rate com-pared with that of the reference one. Thus for energy-savingpurposes the working point should be located outside the shadedregion.
tted-fin surfaces and the referenced plate.
tion plot of enhanced heat transfer techniques ..., Int. J. Heat Mass

1 2fe / f0
1
2
3
Nu e
/Nu 0
slit 1slit 2slit 3
1.8
1.2
1.4
2.0
1.6
1.8
1.6
1.2
1.41.6
2.0
1.2
1.4
a
b2.2
1.8
2.2
CQ,P=1CQ, p=1
CQ,V=1
3
Δ
Fig. 9. The enhanced heat transfer capacity under different constraints of theslotted surfaces (data from [12]).
Fig. 11. Schematic diagram of the ducts with winglet disturbances.
8 J.F. Fan et al. / International Journal of Heat and Mass Transfer xxx (2008) xxx–xxx
ARTICLE IN PRESS
3.2. Showing energy-saving effectiveness
The comparison of energy-saving effectiveness of different en-hanced techniques should also be conducted at certain constraints.Here, the three above-mentioned constraints are first considered.For two enhanced techniques located at the same working line itis obvious that the working point with a larger slope of its
Fig. 10. Schematic diagram of the duc
Please cite this article in press as: J.F. Fan et al., A performance evaluaTransfer (2008), doi:10.1016/j.ijheatmasstransfer.2008.07.006
basic line has a better energy-saving effectiveness. An example ispresented in Fig. 5. In the figure three working points for the con-straint of identical pumping power are shown. Points 1, 2 and 3 lo-cate on the same working line and present the same heat transferenhancement ratios under the identical pumping power constraint.Obviously, among the three enhanced techniques, Point 1 repre-sents the technique with the highest energy-saving effectiveness,Point 3 has the worst energy-saving effectiveness, while Point 2is something in between.
ts with periodic rectangular fins.
tion plot of enhanced heat transfer techniques ..., Int. J. Heat Mass

1 10fe/ f0
1
10
Nu e
/Nu 0
Rectangular fin,AR=1:1 [27]Rectangular fin,AR=1:2 [27]Winglet,c=4,AR=1:2 [28]Winglet,c=6,AR=1:2 [28]Winglet,c=4,AR=1:1 [28]Winglet,c=6,AR=1:1 [28]
(Qe/Q0)/(Pe/P0)=1
(Qe/Q0)/( pe/ p0)=1
(Qe/Q0)/(f e/f 0)=1
Δ Δ
Fig. 12. Performance evaluations of ducts with rectangular fins and wingletdisturbances.
J.F. Fan et al. / International Journal of Heat and Mass Transfer xxx (2008) xxx–xxx 9
ARTICLE IN PRESS
Two more constraints may be added for practical usage. One isthe same friction factor ratio. Point 4 and Point 2 in Fig. 5 representsuch two enhanced techniques. Needless to say, Point 4 stands forthe technique with a better energy-saving technique. The othercondition is the same Reynolds number. In Fig. 5, Point 5 and Point4 are supposed to be the results of two enhanced techniques at thesame Re. The advantage of the technique represented by Point 5 isvery clear. However, if Point 50 and Point 4 are the results at thesame Re, which technique is more effective from energy-savingpoint of view? From above analysis, the effectiveness of Point 4should be regarded better because its higher heat transferenhancement ratio.
From above illustration it can be observed that, generally speak-ing, the larger the basic line slope of a working point the better itsenergy-saving effectiveness.
It should also be indicated that if any two points in the plot arepicked out without specifying a comparison condition, the energy-saving effectiveness of the two enhanced techniques can be hardlycompared.
3.3. Relatively comparison between different enhanced surfaces oroperational conditions
This function is actually the application of above-discussed con-cept. Since it is the major application of the proposed plotting tech-nique we described it in a separate section with several examples.
3.3.1. Example 1: slotted fins with different strip locationsIn actual engineering application, there are different enhanced
heat transfer technologies to meet heat transfer enhancementrequirements of a reference surface. We can select the better heattransfer technology through corresponding performance evalua-tions. The plate fin-and-tube surfaces are widely used in enhancingair-side heat transfer. For the further enhancement of heat transferthe plate fin is often slotted. For enhancing heat transfer of platefin, three kinds of slotted fin are proposed and were tested exper-imentally in [26]. The slot arrangements of the three kinds of slot-ted fin and the reference plate fin are presented in Fig. 6. Fig. 7presents the comparison of the three kinds of enhanced heat trans-fer technologies for the energy-saving objective. Three boldfacebaselines are drown from Eq. (31), where variables m1 and m2
come from the relevant correlation for laminar flow and heattransfer of air in plate-fin surface [26] with m1 and m2 being�0.487 and 0.186, respectively. According to the data provided inreference [26], the working points in the figure can be determinedby the ratios of friction coefficient and Nusselt number betweenthe enhanced and reference surfaces under corresponding Rey-nolds number. In the figure, 10 working points for slit b and slitc are presented where the corresponding Reynolds number is350, 700, 1000, 1400, 1700, 2100, 2400, 2800, 3100 and 3400, fromright to left, respectively. It should be noted since slit d has morestrips than that of slit b and slit c, comparison is only conductedbetween slit d and slit b/c. If we connect point (1,1) with the cor-responding working points of the two slits we can clearly observethat the energy-saving effectiveness of the two slotted fins are slitc, slit b in that order.
According to above discussion, it can be concluded that the slot-ted fin with the slots mostly in the rear part of the fin (i.e., thedownstream part) is the better augment fin system.
3.3.2. Example 2: slotted fins with strips positioned according to the‘‘Front sparse and rear dense” principle
The above example indicates that for the slotted-fin surface theslots are better to be positioned mainly in the downstream or rearpart of the fin. For a specific application case, numerical investiga-tions can be applied to determine how the slots (or strips) should
Please cite this article in press as: J.F. Fan et al., A performance evaluaTransfer (2008), doi:10.1016/j.ijheatmasstransfer.2008.07.006
be located. In [12] three types of slotted fins are proposed charac-terized by the non-uniform position of strips along the flow direc-tion. The so-called ‘‘front sparse and rear dense” positioningprinciple is suggested which says that the distance between twoadjacent strips should be gradually reduced along the flow direc-tion. The proposed three arrangements of strips according to thisprinciple are shown in Fig. 8 and their heat transfer/pressure dropcharacteristics are tested numerically. Fig. 9 shows the workinglines corresponding to the three constraints (solid line, short-dashed line and long-dashed line) drawn from Eq. (31), where vari-ables m1 and m2 come from the relevant correlation for laminarflow and heat transfer of air in the plain plate fin-and-tube surfaceswith m1 and m2 being �0.32 and 0.35, respectively [12]. Accordingto the data provided in reference [12], five working points for thethree slit fins are presented in the figure where the correspondingReynolds number is 2100, 5600, 8000, 10,000 and 13,500, respec-tively. Similar discussion on the three arrangements of strips canbe conducted as for the slits shown in Fig. 6. Thus slit 1 may be rec-ommended to be used in practical application.
3.3.3. Example 3: duct with rectangular fins and wingletsOne of the novel heat transfer enhancement techniques is the
use of the winglet as surface turbulence or vortex promoter. Vorti-ces are generated by flow separation. According to their axis ofrotation with respect to the main flow direction, they are calledlongitudinal vortices while their axis of rotation is aligned withthe main flow direction and transverse vortices while their axisof rotation is normal to the main flow direction. Because longitudi-nal vortices consist of strong swirling around an axis essentiallyaligned with the main flow direction, leading to a heavy fluid mix-ing between the core and the region near the wall. Generally, less
tion plot of enhanced heat transfer techniques ..., Int. J. Heat Mass

10 J.F. Fan et al. / International Journal of Heat and Mass Transfer xxx (2008) xxx–xxx
ARTICLE IN PRESS
energy is needed to turn the flow around an axis aligned with themain flow direction than to generate the swirl around an axis per-pendicular to the main flow direction. Therefore, longitudinal vor-tices are more efficient for heat transfer enhancement thantransverse vortices when both heat transfer and pressure dropare taken into account. Based on this, a new type of augmentationstructure has been proposed and investigated in reference [27].The passages of the structures proposed consist of a rectangularduct and internal plate fins or winglets. Figs. 10 and 11 show sche-matic diagrams of such structures. Yuan et al. [28] studied flow andheat transfer characteristics of ducts with internal fins and wingletdisturbances.
Fig. 12 presents the performance evaluation of rectangular finsand winglet disturbances in cooling ducts for saving energy objec-tive, where variable AR is the aspect ratio of the duct. The data inthe figure come from Yuan et al. [27,28]. In the figure the workingpoints of these enhanced surfaces mainly located in Region 3, indi-cating that the enhancement ratios of heat transfer rate are largerthan the increases of pressure drop penalties. At the same time, wecan also find from the figure that the cooling duct with rectangularfins present higher performance values than that with wingletdisturbances.
3.3.4. Example 4: dimpled surfaceIn the past decade, a new type of enhanced surface, called dim-
pled surfaces, were extensively studied in the literatures [29–34].Dimples are arrays of indentations along surfaces. Generally, theseare spherical in shape, while a variety of other shapes have alsobeen employed, ranging from triangular to tear drop. Schematic
Fig. 13. Schematic diagram
Please cite this article in press as: J.F. Fan et al., A performance evaluaTransfer (2008), doi:10.1016/j.ijheatmasstransfer.2008.07.006
diagrams of dimpled surfaces are shown in Fig. 13 for a flat surfaceand a tube [33,34]. As shown in the figure dimples do not protrudeinto the flow to produce significant amounts of form drag, so dim-pled surfaces generally produce lower friction penalties comparedto the several other types of augmentation ones. Numerous exper-imental investigations [29–35] were performed to study flow char-acteristic and heat transfer mechanism of the dimpled surface withdifferent arrangements and geometric parameters. Flow visualiza-tion studies reveal that the flow structure in the dimple is mainlyof vortex type. The vortex structure augments local and down-stream Nusselt numbers. Therefore, the dimpled surface is anattractive enhanced heat transfer technology for enhancing heattransfer, especially for internal cooling technology.
Fig. 14 presents the performance comparison of different dim-pled surface of turbulent flow inside cooling channel based on sav-ing energy. The data in the figure come from references [32–36]. Inthe figure it can be seen that working points of these dimpled sur-faces mainly located in Regions 3 and 4, implying that most of thedimpled surfaces possess high effectiveness of saving energy. Atthe same time, we can also find from the figure that the coolingchannel with spherical dimple and protrusion on opposite surfacespresented in [36] possesses lower performance than other dimpledsurface. So from the energy-saving view point, the structure of en-hanced surface shown in [36] is the worst.
3.3.5. Example 5: shell-side heat transfer of helical baffled heatexchangers
In all the above-referenced cases the enhanced structure givesboth larger heat transfer rate and friction factor hence the two
of dimpled surface.
tion plot of enhanced heat transfer techniques ..., Int. J. Heat Mass

1 101
10
Nu e
/Nu 0
spherical,smooth top/dimpled bottom[36]spherical,smooth top/dimpled bottom[33]spherical,smooth top/dimpled bottom[32]tear drop,smooth top/dimpled bottom[36]spherical dimpled top/spherical dimpled bottom [36]teardrop dimpled top/teardrop dimpled bottom [36]spherical dimple/protrusion [36]spherical cavity [35]dimpled tube [34]
(Qe/Q0)/(Pe/P0)=1
(Qe/Q0)/( pe/ p0)=1
(Qe/Q0)/(f e/f 0)=1
Δ Δ
f e /f 0
Fig. 14. Performance evaluations of dimpled surfaces.
0.1 10fe/ f0
0.1
1
10
Nu e
/Nu 0 (Qe/Q0)/(Pe/P0)=1
(Qe/Q0)/( pe/ p0)=1
(Qe/Q0)/(f e/f 0)=1
1
Δ Δ
Fig. 15. Performance evaluations of shell-side heat transfer of helical baffle andvertical baffle heat exchangers.
J.F. Fan et al. / International Journal of Heat and Mass Transfer xxx (2008) xxx–xxx 11
ARTICLE IN PRESS
Please cite this article in press as: J.F. Fan et al., A performance evaluaTransfer (2008), doi:10.1016/j.ijheatmasstransfer.2008.07.006
ratios are greater than 1. There are some cases where the new struc-ture leads to the reduction of both heat transfer and pressure drop,with the reduction of pressure drop being much more significant.The shell-side heat transfer occurring in the helical baffle shell-and-tube heat exchangers is one of such example. It is interestingto see whether the proposed plot technique is still applicable tosuch a case. For a meaningful performance comparison betweenthe shell-and-tube heat exchangers with vertical (segmental) baf-fles and the helical baffles, two almost identical heat exchangersof vertical baffle type and helical baffle type were specifically madewith the difference only being in the baffle type [37]. For the helicalbaffle its helical angle is 20�. The comparison results are presentedin Fig. 15. It is interesting to note in the figure the working area isextended to the region where both the ratios of (Nue/Nu0), (fe/f0)are less than 1. It can be easily shown that in this specially regionthe space under the baseline corresponding to a certain constraintis the area within which the heat transfer based on the correspond-ing constant has deteriorated. For example the area below the solidbold line is characterized by the deterioration of heat transfer peridentical pumping power. Two typical comparison results are pre-sented in Fig. 15. It can be seen that because the significant reduc-tion of pressure drop, for the heat exchanger with helical baffle theshell-side heat transfer is more effective based on the identicalpumping power. Thus the shell-and-tube heat exchanger with heli-cal baffle has a more energy-saving shell-side heat transfer in thissense. It is interesting to note that in this special region, the orderof implementation difficulty for the three constraints is the oppo-site to that, where both (Nue/Nu0), (fe/f0) are greater than 1.0. Thatis the order from easy to difficult is identical flow rate, identicalpressure drop and identical pumping power.
4. Conclusion
A performance evaluation plot has been proposed in this work,on the basis of the existing performance evaluation criteria analy-sis and four conventionally-adopted assumptions. In the plot theratio of the friction factor of the enhanced surface over that ofthe reference surface and the ratio of the related heat transferenhancement at the same Reynolds number are taken as the ab-scissa and ordinate, respectively. The coordinates are log–logbased. From experimentally obtained data or numerically simu-lated results of such two ratios, a working point can be made inthe plot. It is shown that the quadrant surrounded by the two coor-dinates can be divided by four regions corresponding to the differ-ent effectiveness of saving energy: in Region 1 heat transferenhancement is obtained with larger pressure drop penalty suchthat per identical pumping power the heat transfer is deteriorated;in Region 2 heat transfer is enhanced per identical pumping powerbut deteriorated per identical pressured drop, in Region 3 heattransfer is enhanced per identical pressure drop, and in Region 4the heat transfer enhancement ratio is larger than the friction fac-tor increase ratio under identical flow rate, which is the most dif-ficult region to reach for heat transfer enhancement study. In thisplot different enhanced techniques for the same reference systemcan easily and clearly be compared for their energy-saving perfor-mances. Four examples are provided to show the function of such aplot. For some techniques which lead to the reduction of both heattransfer rate and friction factor, the proposed plot is still applica-ble. This plot will be useful in the study of heat transfer enhance-ment technique oriented for energy-saving purposes.
Acknowledgement
This study was supported by the National Fundamental Re-search R&D of China (G 2007CB206902).
tion plot of enhanced heat transfer techniques ..., Int. J. Heat Mass
12 J.F. Fan et al. / International Journal of Heat and Mass Transfer xxx (2008) xxx–xxx
ARTICLE IN PRESS
References
[1] R.L. Webb, N.H. Kim, Principles of Enhanced Heat Transfer, second ed., Taylor &Francis, Boca Raton, 2005.
[2] A.E. Bergles, Heat transfer enhancement – the maturing of second-generationheat transfer technology, Heat Transf. Eng. 18 (1) (1997) 47–55.
[3] C.C. Wang, Technology review – a survey of recent patents of fin-and-tube heatexchangers, Enhanced Heat Transf. 7 (2000) 333–345.
[4] R.K. Shah, D.P. Pekulic, Fundamentals of Heat Exchanger Design, John Wiley &Sons, Hobokin, New Jersey, 2003. pp. 696.
[5] R.L. Webb, E.R. Eckert, Application of rough surfaces to heat exchanger design,Int. J. Heat Mass Transf. 15 (1972) 1647–1658.
[6] A.E. Bergles, Techniques to enhance heat transfer, in: W.M. Rohsenow, J.P.Hartnett, Y.L. Cho (Eds.), Handbook of Heat Transfer, third ed., McGraw-Hill,New York, 1998 (Chapter 11).
[7] E.M. Sparrow, W.Q. Tao, Symmetric vs asymmetric periodic disturbances at thewalls of a heated flow passage, Int. J. Heat Mass Transf. 27 (11) (1984) 2133–2144.
[8] H.Z. Huang, W.Q. Tao, An experimental study on heat/mass transfer andpressure drop characteristics for arrays of nonuniform plate length positionedobliquely to the flow direction, ASME J. Heat Transf. 115 (3) (1993)568–575.
[9] S.S. Lue, H.Z. Huang, W.Q. Tao, Experimental study on heat transfer andpressure drop characteristics in the developing region for arrays of obliquelypositioned plates of nonuniform length, Exp. Therm. Fluid Sci. 7 (1) (1993) 30–38.
[10] Z.X. Yuan, W.Q. Tao, Q.W. Wang, Numerical prediction for laminar forcedconvection heat transfer in parallel plate channels with streamwise-periodicrod disturbances, Int. J. Numer. Methods Fluids 28 (1998) 1371–1387.
[11] B. Yu, J.H. Nie, Q.W. Wang, W.Q. Tao, Experimental study on the pressure dropand heat transfer characteristics of tubes with internal wave-like longitudinalfins, Heat Mass Transf. 35 (1999) 65–73.
[12] Y.P. Cheng, Z.G. Qu, W.Q. Tao, Y.L. He, Numerical design of efficient slotted finsurface based on the field synergy principle, Numer. Heat Transf. Part A 45 (6)(2004) 517–538.
[13] R.K. Shah, K.A. Afimiwala, R.W. Mayne, Heat exchanger optimization, in:Proceedings of 6th International Heat Transfer Conference, vol. 4, Hemisphere,pp. 185–191.
[14] Z.G. Qu, W.Q. Tao, Y.L. He, Three dimensional numerical simulation on laminarheat transfer and fluid flow characteristics of strip fin surface with X-arrayarrangement of strips, ASME J. Heat Transf. 126 (2004) 697–707.
[15] Y. Sano, H. Usui, Evaluation of heat transfer promoters by the fluid dissipationenergy, Scripta Publishing Co. (1982) 91–96.
[16] A. Bejan, General criterion for rating heat exchanger performance, Int. J. HeatMass Transf. 21 (1978) 655–658.
[17] A. Bejan, Second law analysis in heat transfer, Energy 5 (1980) 721–732.[18] R.O. William, A. Bejan, Conservation of available work (exergy) by using
promoters of swirl flow in forced convection heat transfer, Energy 5 (1980)587–596.
Please cite this article in press as: J.F. Fan et al., A performance evaluaTransfer (2008), doi:10.1016/j.ijheatmasstransfer.2008.07.006
[19] B.H. Chen, W.H. Huang, Second-law analysis for heat transfer enhancement ona rib-type turbulence promoter, Energy 13 (2) (1988) 167–175.
[20] B.H. Chen, W.H. Huang, Performance evaluation criteria for enhanced heattransfer surface, Int. Commun. Heat Mass Transf. 15 (1988) 59–72.
[21] V.D. Zimparov, N.L. Vulchanov, Performance evaluation criteria for enhancedheat transfer surfaces, Int. J. Heat Mass Transf. 37 (12) (1994) 1807–1816.
[22] R.C. Prasad, J.H. Shen, Performance evaluation of convective heat transferenhancement devices using exergy analysis, Int. J. Heat Mass Transf. 36 (17)(1993) 4193–4197.
[23] R.C. Prasad, J.H. Shen, Performance evaluation using exergy analysis-application to wire-coil inserts in forced convection heat transfer, Int. J. HeatMass Transf. 37 (15) (1994) 2297–2303.
[24] R.M. Manglik, Heat transfer enhancement, in: A. Bejan, A. Kraus (Eds.), HeatTransfer Handbook, John Wiley & Son, Hobokin, New Jersey, 2003.
[25] W.J. Marner, A.E. Bergles, J.M. Chenoweth, On the presentation of performancedata for enhanced tubes used in shell-and-tube heat exchanger, ASME J. HeatTransf. 105 (1983) 358–365.
[26] H. Kang, M.H. Kim, Effect of strip location on the air-side pressure drop andheat transfer in strip fin-and-tube exchanger, Int. J. Ref. 22 (1999) 302–312.
[27] Z.X. Yuan, W.Q. Wang, W.Q. Tao, Experimental study of enhanced heat transferin ducts with periodic rectangular fins along the main flow direction, in: HeatTransfer 1998 Proceeding of 11th IHTC, Kyongju, Korea, 1998, pp. 23–28.
[28] Z.X. Yuan, W.Q. Tao, X.T. Yan, Experimental study on heat transfer in ductswith winglet disturbances, Heat Transf. Eng. 24 (2) (2003) 76–78.
[29] V.N. Afanasyev, Y.P. Chudnovsky, A.I. Leontiev, P.S. Organic, Turbulent flowfriction and heat transfer characteristic for spherical cavities on a flat plate,Exp. Therm. Fluid Sci. 7 (1993) 1–8.
[30] P.M. Ligrani, G.I. Mahmood, J.L. Harrison, CM. Clayton, D.L. Nelson, Flowstructure and local Nusselt number variations in a channel with dimples andprotrusions on opposite walls, Int. J. Heat Mass Transf. 44 (2001) 4413–4425.
[31] P.M. Ligrani, J.L. Harrison, G.I. Mahmmod, M.L. Hill, Flow structure due todimple depressions on a channel surface, Phys. Fluids 13 (11) (2001) 3442–3451.
[32] G.I. Mahmood, P.M. Ligrani, Heat transfer in a dimpled channel: combinedinfluences of aspect ratio, temperature ratio, Reynolds number, and flowstructure, Int. J. Heat Mass Transf. 45 (2002) 2011–2020.
[33] G.I. Mahmood, M.L. Hill, D.L. Nelson, P.M. Ligrani, H.K. Moon, B. Glezer, Localheat transfer and flow structure on and above a dimpled surface in a channel, J.Turbomach. 123 (2001) 115–123.
[34] J. Chen, Hans Müller-Steinhagen, Geoffrey G. Duffy, Heat transferenhancement in dimpled tubes, Appl. Therm. Eng. 21 (2001) 535–547.
[35] M.Ya. Belen’kiy, M.A. Gotovskiy, B.M. Lekakh, B.S. FoKin, K.S. Dolgushin, Heattransfer augmentation using surfaces formed by a system of spherical cavities,Heat Transf. Res. 25 (2) (1993) 196–203.
[36] P.M. Ligrani, M.M. Oliveira, T. Blaskovich, Comparison of heat transferaugmentation techniques, AIAA J. 41 (3) (2003) 337–362.
[37] J.F. Zhang, Y.G. Lei, W.J. Wang, B. Li, Y.L. He, W.Q. Tao, Experimentalcomparison study of shell-side heat transfer of oil in helical baffle andvertical baffle heat exchangers, submitted for publication.
tion plot of enhanced heat transfer techniques ..., Int. J. Heat Mass