Embed Size (px)
Citation preview

Journal of Computational Physics165,311–333 (2000)
doi:10.1006/jcph.2000.6604, available online at http://www.idealibrary.com on
A Numerical Model for Trickle Bed Reactors1
Richard M. Propp, Phillip Colella, William Y. Crutchfield, and Marcus S. Day
Lawrence Berkeley National Laboratory, Berkeley, California 94720E-mail: [email protected], [email protected], [email protected], [email protected]
Received March 18, 1999; revised January 25, 2000
Trickle bed reactors are governed by equations of flow in porous media such asDarcy’s law and the conservation of mass. Our numerical method for solving theseequations is based on a total-velocity splitting, sequential formulation which leadsto an implicit pressure equation and a semi-implicit mass conservation equation.We use high-resolution finite-difference methods to discretize these equations. Oursolution scheme extends previous work in modeling porous media flows in twoways. First, we incorporate physical effects due to capillary pressure, a nonlinearinlet boundary condition, spatial porosity variations, and inertial effects on phasemobilities. In particular, capillary forces introduce a parabolic component into therecast evolution equation, and the inertial effects give rise to hyperbolic nonconvexity.Second, we introduce a modification of the slope-limiting algorithm to prevent ournumerical method from producing spurious shocks. We present a numerical algorithmfor accommodating these difficulties, show the algorithm is second-order accurate,and demonstrate its performance on a number of simplified problems relevant totrickle bed reactor modeling. c© 2000 Academic Press
Key Words:trickle bed reactor; conservation laws; porous media flows; Godunovmethods.
1. INTRODUCTION
A trickle bed reactor is a fixed bed of catalyst particles through which gas and liquidare allowed to flow. Typically the gas and liquid flow concurrently downward throughthe reactor; the liquid phase flows over the catalyst as a thin film, while the gas phaseflows continuously between the catalysts [22]. These reactors have been used mainly in the
1 Research supported at UC Berkeley by the US Department of Energy Mathematical, Information and Computa-tional Sciences Division, Grants DE-FG03-94ER25205 and DE-FG03-92ER25140; and at the Lawrence BerkeleyNational Laboratory by the US Department of Energy Mathematical, Information and Computational Sciences Di-vision, Grant DE-AC03-76SF00098. The first author was also supported by the Computational Sciences GraduateFellowship Program of the Office of Scientific Computing in the Department of Energy.
311
0021-9991/00 $35.00Copyright c© 2000 by Academic Press
All rights of reproduction in any form reserved.

312 PROPP ET AL.
petroleum industry for hydrotreating processes, such as hydrodesulfurization and hydroc-racking. However, there are applications in other fields, such as chemical processing, wastetreatment, and biochemical processing [13].
There have been a few numerical simulations of flow distribution in a trickle bed reactor.For example, Staneket al. [24] used a radial diffusion model, while Zimmerman and Ng[30] used a computer-generated model of randomly packed spheres. Anderson and Sapre[2] modeled a reactor using the same general porous media equations that are typically usedin petroleum reservoir simulations (for a description of petroleum reservoir simulations,see the book by Aziz and Settari [3] or the paper by Stevensonet al. [25]).
Although there has been relatively little effort in modeling trickle bed reactors, similarporous media problems have been modeled extensively, mainly in the context of subsurfaceflows (typically petroleum reservoirs). While the same general governing equations modelflow in a reactor and flow in a reservoir, there are a few key differences. First of all, thereare geometry and size differences. Reactors are typically cylindrical and 10–30 meters tall[13]; on the other hand, petroleum reservoirs are typically much larger than reactors andhave a large aspect ratio. Secondly, porosities are typically larger in reactors. Finally, thespeed of the flow differs substantially. In a reactor, gas velocities typically range from 0.05to 0.5 m/s, while liquid velocities range from 0.005 to 0.025 m/s. In a reservoir, velocitiesare typically 5× 10⁻⁶ m/s [2].
The larger velocities in the reactor have a significant effect on the governing equations.Normally, Darcy’s law is used to model the effects of phase pressure on phase velocity;however, Darcy’s law is not accurate at higher velocities. To account for the discrepanciesat higher velocities, we modify Darcy’s law by using the Ergun equation (this is discussedin detail in Section 2.1).
The equations governing flow in a reactor are coupled and nonlinear. We reformulatethese governing equations using the sequential method pioneered by Spillette [23]. In thisformulation, we solve a pressure equation and then compute a total velocity; this totalvelocity is then used in the saturation equation instead of the individual phase velocities.Using total velocity in the saturation equation decouples the hyperbolic and elliptic piecesof the two-phase flow equations [27].
These equations are solved using the higher order Godunov techniques for hyperbolicequations outlined in Bellet al.[6]. Other authors have used these techniques for modelingporous media flow; for example, Trangenstein and Bell [26, 27] modeled mass transferbetween phases and Nelson [18] modeled time-varying porosity.
Our work focuses on two extensions of the methods in [6]. First, we introduce morecomplicated physical effects into the problem and show that these effects can be modeledwith second-order accuracy. We include capillary pressure effects which introduce nonlin-ear parabolic terms in the saturation equation. In addition, we introduce a nonlinear inletboundary condition where we specify physically measurable quantities—the liquid velocityand the average gas velocity. We use a novel reformulation of a modified Ergun equationto model the nonlinear inertial effects due to the larger velocities present in the reactor.Second, we introduce a modification of the slope-limiting algorithm proposed by Colella[10] to prevent our numerical method from producing spurious shocks.
The rest of this paper describes the equations used to model the reactor and the numer-ical algorithm used to solve these equations. Section 2 describes the mathematical modelof the reactor and the reformulation of the governing equations into an elliptic equationfor pressure and an advection–diffusion equation for saturation. Section 3 describes the
NUMERICAL MODEL FOR TRICKLE BED REACTOR 313
implementation of the sequential algorithm. We discuss the solution of the pressure equa-tion using a multigrid-accelerated iterative method [8] and the saturation equation usinga Crank–Nicolson scheme and a multidimensional upwind method. Section 4 shows theeffects of the slope-limiting algorithm and demonstrates that the algorithm is second-orderaccurate. In addition, simulations show the effects of the modified Ergun equation, capillarypressure, porosity variation, and the nonlinear inlet boundary condition.
2. MATHEMATICAL FORMULATION
In this section, we specify the governing equations, auxiliary relations, and boundaryconditions for a trickle bed reactor. Then we derive a system of equations that is suitable fora sequential solution method. We assume a basic knowledge of porous media; for a moredetailed examination of porous media, see Bear [4] or Collins [11].
2.1. Governing Equations
In this paper we use a simplified model of flow in the reactor. These assumptions are notnecessary for our numerical algorithm to work; however, they do simplify the algorithm.We make the following assumptions about the flow:
(1) There are only two components present: component A and component B. In addition,there are only two phases: the liquid phase and the gas phase. Component A exists only inthe liquid phase and component B exists only in the gas phase.
(2) The phase densities and phase viscosities are constant.(3) Porosity is not a function of time, but it can be a function of space.
As a result of assumption (1), we can use the terms “phase” and “component” interchange-ably in this paper. We will denote the liquid phase by the subscript L and the gas phase bythe subscript G.
With these assumptions, the three main equations governing the flow are conservation ofvolume, conservation of mass, and Darcy’s law,
sL + sG = 1 (1)
φ∂(sp)
∂t+∇ · vp = 0 (2)
vp = −λp(∇Pp + γp∇z), (3)
whereγp = (ρpg/gc) is a grouping of gravity terms andsp, ρp, vp, Pp, andλp representthe saturation, density, velocity, pressure, and mobility of phasep. In addition,g is theacceleration due to gravity,φ is the porosity,gc is the gravity conversion factor (gc = 1 inthe metric system),t denotes time, andz is the upward-directed coordinate. These threeequations must be augmented by auxiliary correlations to make the system solvable.
The phase mobility of phasep is defined as
λp = kpkRp
µp, (4)
wherekp is the phase permeability,kRp is the relative permeability of phasep, andµp isthe viscosity of phasep. The expressions for permeability, relative permeability, and phaseviscosity are typically problem dependent.
314 PROPP ET AL.
In reservoir simulations, the Kozeny–Carman equation [9] is typically used to expresspermeability as
kp = d2eφ
3gc
C1(1− φ)2 , (5)
wherede is the pore diameter, andC1 = 180. The combination of the form of phase mobilitydefined in (4), the equation for permeability defined in (5), and Darcy’s law (3) imply thatthe pressure gradient is linearly proportional to the velocity. However, several experimentaland theoretical investigations have shown that there is not a simple linear dependence atlarger velocities. MacDonaldet al. ran experiments and determined that a modified Ergunequation provided a better fit to experimental data [17],
kp =(
C1(1− φ)2d2
eφ3gc
+ C2(1− φ)ρp|vp|µpdeφ3gc
)−1
, (6)
whereC1 = 180 andC2 = 1.8. We note that the first term of the equation is simply thestandard permeability as expressed in the Kozeny–Carman equation (5), while the secondterm captures the nonlinear inertial effects. If we insert Ergun’s equation (6) and the defi-nition of phase mobility (4) into Darcy’s law (3), we note thatvp appears on both sides ofthe equation; we will deal with this nonlinearity in Section 3.1.4 by reformulating Ergun’sequation.
Using available experimental data on flow in packed beds, Saez and Carbonell [21]correlated the relative permeability functions as
kRL =(
sL − sLirr
1.0− sLirr
)2.43
(7)
kRG = (sG)4.8, (8)
wheresLirr is the irreducible saturation of the liquid phase. Using available data, Saez andCarbonell [21] correlated the irreducible liquid saturation as
sLirr =1
(20+ 0.9Eo)φ, (9)
where Eo is the Eotvos number
Eo= ρLgd2eφ
2
σ(1− φ)2 , (10)
andσ is the surface tension between the gas and liquid phases.The capillary pressure between phase L and phase G,PC, is defined as
PC = PG− PL . (11)
Leverett [16] proposed the following form for capillary pressure in an arbitrary porousmedia:
PC = σ J(sL)
√φ
k, (12)
NUMERICAL MODEL FOR TRICKLE BED REACTOR 315
whereJ(sL) is a dimensionless function. Grosseret al. [14] approximated theJ functionof Leverett using
J(sL) = 0.48+ 0.036 ln
(1− sL
sL
). (13)
2.2. Total Velocity Formulation
The equations of flow in porous media exhibit both elliptic and parabolic behavior. Forexample, pressure effects are instantaneously felt throughout the reservoir, while saturationfronts move at a finite speed [7]. Our numerical algorithm treats these effects separatelyby splitting the system of governing equations into an elliptic pressure equation and ahyperbolic–parabolic saturation equation.
In a manner similar to the work of Watts [29], we define a total velocity as
vT ≡ vL + vG. (14)
As a result of the simplified conservation of volume (1) and conservation of mass (2)equations, the total velocity is divergence-free. Using the definition of total velocity andDarcy’s law (3), we obtain the pressure equation
∇ · [(λL + λG)(∇PG)] = ∇ · [(λGγG+ λLγL)(∇z)] +∇ · (λL∇PC). (15)
We use the total velocity to eliminate the phase velocity from the conservation of massequation (2)
φ∂sL
∂t+∇ · (F(sL, vT)) = −∇ · [H(sL)∇PC], (16)
where
F(sL, vT) = λL(vT −GλG)
λL + λG
G = (γL − γG)∇z
H = λLλG
λL + λG.
The motivation for this substitution is that in incompressible problems with no capillarypressure, the use of total velocity splits the system into elliptic and hyperbolic pieces.
We can also expand the total velocity in terms of phase mobilities and pressures:
vT = −(λL + λG)∇PG− (λLρL + λGρG)g∇z+ λL∇PC. (17)
This reformulation has resulted in three main equations: a hyperbolic–parabolic saturationequation (16), an elliptic pressure equation (15), and an equation for total velocity (17). Wecan now apply appropriate numerical techniques to each type of equation.

316 PROPP ET AL.
2.3. Boundary Conditions
In order to make our system solvable, we also need to specify boundary conditions. Weassume that there is an inlet at the top of the reactor and an outlet at the bottom of thereactor; the other edges are assumed to be impermeable walls.
At the impermeable walls, the normal components of the velocities are zero. From Darcy’slaw, it follows that the pressure gradient normal to the wall is zero at vertical walls.
At the outlet, we specify the gas pressure; this condition results from the assumptionthat flow exits the reactor into a region at ambient pressure. In addition, we specify that thenormal derivative of capillary pressure be zero; in effect, this means that we will have noboundary layer at the outlet.
At the inlet, we use two different sets of boundary conditions. In the first set of boundaryconditions, we specify quantities that are easy to implement numerically in our algorithm—liquid saturation and the pressure gradient. In the second set of boundary conditions, wespecify conditions that can be measured experimentally. In this case, we specify the averagegas velocity at the top of the reactor,vAVG
G , and the liquid velocity at each cell along the topof the reactor,vL(x, zTOP).
3. NUMERICAL ALGORITHM
In the last section, we recast the governing equations into a system of three equations: anelliptic pressure equation (15), an advection–diffusion equation for saturation (16), and anequation for total velocity (17). This section discusses the solution of those three equations.
We discretize the reactor using a finite volume discretization by covering the reactorwith a mesh of grid cells. We use one of two different two-dimensional coordinate systemsfor these grid cells: (1) anx–z Cartesian coordinate system and (2) anr –z cylindricalcoordinate system. In the Cartesian coordinate system, the grid cells are rectangular ofsize4x by4z, and are indexed in thex-direction byi and in thez-direction by j . In thecylindrical coordinate system, the grid cells are of size4r by 4z, and are indexed in ther -direction byi and in thez-direction by j . We discretize in time using the indexn, suchthat the time step4t is the difference between discrete timestn andtn+1.
Saturations and pressures are defined at cell centers, such that
sni, j ≈ s((i + 0.5)4x, ( j + 0.5)4z, tn).
Phase mobilities and the normal components of velocities are defined at cell edges and usehalf indices, such thatvn
i+1/2, j represents thex-velocity at the “right edge” of cell(i, j )andvn
i, j+1/2 represents thez-velocity at the “top edge” of cell(i, j ). Phase mobilities arecomputed at cell centers and averaged to cell edges. Typically we use arithmetic averagingto compute phase mobilities; however, when the equation itself implies harmonic averaging(such as theH term in (16)), then harmonic averaging is used.
The equations are discretized using standard block-centered finite difference operators.We define the discrete gradient operatorG as taking a cell-centered scalar and mapping itinto an edge-centered vector field. If we consider a cell-centered scalarφ, then we definethex-component andz-component of the gradient field as
Gx(φ)|i+1/2, j = φi+1, j − φi, j
4x, Gz(φ)|i, j+1/2 = φi, j+1− φi, j
4z. (18)

NUMERICAL MODEL FOR TRICKLE BED REACTOR 317
We define the discrete divergence operator,D, as taking an edge-centered vector fieldand mapping it into a cell-centered scalar. We define the divergence operator acting on anedge-centered vectorf as
D(f )|i, j =f xi+1/2, j − f x
i−1/2, j
1x+ f z
i, j+1/2− f zi, j−1/2
1z. (19)
These discrete operators are used to discretize all of the gradients and divergences in all ofthe governing equations—the pressure equation (15), the saturation equation (16), and theequation for total velocity (17). As a result, there is a mathematical consistency betweenthe equations.
3.1. Algorithm Overview
The sequential algorithm advances the liquid saturation from timetn to timetn+1 using acombination of hyperbolic–parabolic and elliptic equations. The multidimensional upwindmethod used to solve the hyperbolic equation was developed in [10]. This work was laterextended to problems that combined hyperbolic and elliptic equations in [6] and to problemswith viscous terms in [5].
We denote variables at the current time by the superscriptn and variables at the new timeby the superscriptn+ 1. In addition, we denote temporary predicted variables at timen+ 1by the superscript ˜. With this notation, we can express the predictor–corrector scheme toadvance the saturation fromn to n+ 1 through the following steps.
Step 1. Compute the gas pressure and total velocity at the current time step. We computethe gas pressure at the current time,Pn
G, by solving the pressure equation:
−∇ · [( λnG+ λn
L
)(∇PnG
)] = −∇ · [( λnGγG+ λn
LγL)(∇z)
]−∇ · ( λnL∇Pn
C
).
Next, we compute the total velocity at the current time,vnT:
vnT = −
(λn
L + λnG
)∇PnG −
(λn
LγL + λnGγG
)∇z+ λnL∇Pn
C.
Step 2. Trace the liquid saturation to cell edges at the half time step. We utilize thetotal velocity and saturation at the current time in Godunov’s method to compute liquidsaturation at the half time step at cell edges,sn+1/2
EDGE (this will be discussed in Section 3.1.2).
Step 3. Approximate the total velocity at the half time step. First, we predict the totalvelocity at the next time step,vT; then, we average it with the total velocity at the currenttime step,vn
T, in order to approximate the total velocity at the half time step,vn+1/2T .
The first step in predictingvT is to predict the saturation at the next time step,sL, suchthat
φsL − sn
L
4t= −∇ · F(sn+1/2
EDGE, vnT
)− 1
2∇ · [H∇ PC
]− 1
2∇ · [Hn∇Pn
C
],
whereF is an approximation to the flux at cell edges. The ˜ superscript on the variablesHand PC indicates that they are computed using the predicted saturations. In addition, wenote that this equation’s nonlinear dependence on saturation makes it difficult to solve; asa result, we actually solve anO(4t2) approximation to this equation. This approximationis discussed in Section 3.1.1.
318 PROPP ET AL.
Next, we use this predicted saturation to predict the pressure at the next time step,PG:
−∇ · [(λG+ λL)(∇ PG)] = −∇ · [(λGγG+ λLγL)(∇z)] −∇ · (λL∇ PC).
Again, the ˜ superscript on the phase mobilities indicates that they are computed using thepredicted saturations. Finally, we predict the total velocity at the next time step,vT:
vT = −(λL + λG)∇ PG− (λLγL + λGγG)∇z+ λL∇ PC.
Then, we average the predicted velocity and the current velocity to obtain the velocity atthe half time step,vn+1/2
T :
vn+1/2T = 1
2
(vn
T + vT).
Step 4. Compute the liquid saturation at the next time step. Now that we have both asaturation and a velocity at the half time step, we can compute a second-order accuratesaturation at the next time step,sn+1
L :
φsn+1
L − snL
4t= −∇ · F(sn+1/2
EDGE, vn+1/2T
)− 1
2∇ · [Hn∇Pn
C
]− 1
2∇ · [Hn+1∇Pn+1
C
].
As in Step 3, we only solve an approximation to this equation. We will now describe specificpieces of the algorithm in greater detail.
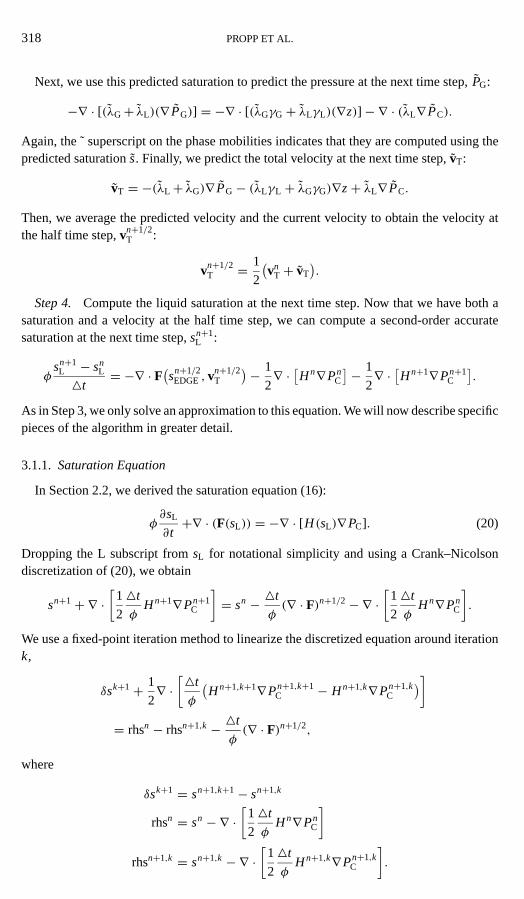
3.1.1. Saturation Equation
In Section 2.2, we derived the saturation equation (16):
φ∂sL
∂t+∇ · (F(sL)) = −∇ · [H(sL)∇PC]. (20)
Dropping the L subscript fromsL for notational simplicity and using a Crank–Nicolsondiscretization of (20), we obtain
sn+1+∇ ·[
1
2
4t
φHn+1∇Pn+1
C
]= sn − 4t
φ(∇ · F)n+1/2−∇ ·
[1
2
4t
φHn∇Pn
C
].
We use a fixed-point iteration method to linearize the discretized equation around iterationk,
δsk+1+ 1
2∇ ·[4t
φ
(Hn+1,k+1∇Pn+1,k+1
C − Hn+1,k∇Pn+1,kC
)]= rhsn − rhsn+1,k − 4t
φ(∇ · F)n+1/2,
where
δsk+1 = sn+1,k+1− sn+1,k
rhsn = sn −∇ ·[
1
2
4t
φHn∇Pn
C
]rhsn+1,k = sn+1,k −∇ ·
[1
2
4t
φHn+1,k∇Pn+1,k
C
].
NUMERICAL MODEL FOR TRICKLE BED REACTOR 319
We lagHn+1,k+1; i.e., we useHn+1,k+1 ≈ Hn+1,k. In addition, we rewrite the capillarypressure difference in terms ofδsk+1. We obtain
δsk+1+∇ ·[
1
2
4t
φHn+1,k
(∂PC
∂s
)n+1,k
∇δsk+1
]= rhsn − rhsn+1,k − 4t
φ(∇ · F)n+1/2.
(21)
This saturation equation is discretized using the discrete divergence operator (19) andgradient operator (18). We solve this linear equation forδsk+1 with multigrid-acceleratedGauss–Seidel with Red–Black ordering.
We choose the time step using the Courant–Friedrichs–Lewy (CFL) condition [12],
4t < σ4x
max(v),
whereσ is the CFL number and max(v) indicates the maximum wave speed in the domain.For our conservation law, the wave speedv is
v = 1
φ
∂F∂s.
3.1.2. Godunov’s Method
We compute the(∇ · F)n+1/2 term in the saturation advection equation using a second-order extension of Godunov’s method. Godunov’s method is a two-step process: (1) a Taylorseries extrapolation of saturations from cell centers to cell edges at the half time step and(2) the solution of a Riemann problem using the extrapolated saturations to choose thecorrect edge-centered flux.
Taylor extrapolation. We denote thex-component of the total velocity byu and thez-component byv. We extrapolate saturations to cell edges at the half time step using aTaylor series extrapolation and use the saturation equation (16) to replace the temporalderivative. For example, if we extrapolate from cell(i, j ) to edge(i + 1
2, j ) in Cartesiancoordinates, we obtain
sn+1/2i+1/2, j,L = sn + 4x
2
∂s
∂x+ 4t
2
∂s
∂t
= sn + 4x
2
∂s
∂x− 4t
2
1
φ(∇ · F)− 4t
2
1
φ(∇ · H∇PC).
By expanding∇ · F, using the chain rule onF(vT, φ, s) in thex-direction, and utilizing thevelocity equation (14), we obtain
sn+1/2i+1/2,L = sn + 1
2
[1− 4t
4x
1
φmax
(0,∂F X
∂s
)]4x
∂s
∂x− 4t
2φ
[∇ ·(
λLλG
λL + λG∇PC
)]
+ 4t
2φ
[−∂F X
∂φ
∂φ
∂x+ ∂F X
∂u
∂v
∂z− ∂F Z
∂z
]. (22)
Since we are extrapolating from cell(i, j ) to edge(i + (1/2), j ), we only wish to considerinformation (saturations, eigenvalues, etc.) from cell(i, j ). We enforce this condition by

320 PROPP ET AL.
using the max term in (22); this ensures that we only use positive characteristic wave speeds.We will use (22) to extrapolate the saturations to cell edges from the left.
SinceF(vT, φ, s) is a known function, we can derive analytical expressions for∂F X/∂sand∂F X/∂u. The computation of the phase mobilities, capillary pressure, and porosity isalso straightforward.
We approximate∂F X/∂φ by
∂F
∂φ≈ F X(φ + ε)− F X(φ − ε)
2ε,
whereε = 0.001. In addition, we can approximate∂u/∂x and∂F Z/∂z as
∂u
∂x≈ ui+1/2, j − ui−1/2, j
4x
∂F Z
∂z≈ F Z,TOP− F Z,BOT
4z,
whereF Z,TOP andF Z,BOT are the fluxes obtained from solving the Riemann problem at thetop and bottom edges of cell(i, j ). We defineF Z,TOP andF Z,BOT as
F Z,TOP= FRP(si, j , si, j+1)
F Z,BOT = FRP(si, j−1, si, j ),
whereFRP indicates the solution to the Riemann problem. The solution to the Riemannproblem will be discussed later in this section.
We approximate∂s/∂x and∂φ/∂x as
∂s
∂x≈ 4sVL ,M
4x
∂φ
∂x≈ 4φ
VL
4x
where4φVL are second-order van Leer slopes [28] and4sVL ,M are modified second-ordervan Leer slopes. van Leer slopes are defined as
4sVL ={
sign(4SC)min(2|4SL |, |4SC|, 2|4SR|), if 4SL4SR > 0
0.0, if 4SL4SR ≤ 0
and the undivided differences are defined as
4SC = Si+1, j − Si−1, j
24SL = Si, j − Si−1, j
4SR = Si+1, j − Si, j .
Several authors [1, 6] have suggested that in the presence of non-convexity, the second-order Godunov method can produce shocks that violate the entropy condition (see Section 4.1

NUMERICAL MODEL FOR TRICKLE BED REACTOR 321
for an example). To prevent these entropy-violating shocks from occurring in this work, weuse a variation of the approach in [6] to modify the algorithm in [10] slightly and apply itto our problem to handle regions around saturation fronts. We only modify the van Leerslopes for saturation; the porosity slope calculation remains the same.
For a given cell, we first determine if additional slope limiting is necessary. The twocriteria necessary for additional limiting are (1)∂2F X/∂s2 changes sign in the regionaround the cell and (2) a saturation front is present. We determine the presence of a frontby computingξi, j as
ξi, j = |si+1, j − si−1, j |max(|si+1, j − si−1, j |, |si+2, j − si−2, j |, ε) .
We assert that a front is present in any region whereξ > ξH and that a smooth region occurswhenξ < ξL. In a smooth region, we expectξ ≈ 1
2; in the presence of a front, we expectξ → 1. Using these values as a guideline, we performed experiments and choseξH = 0.75andξL = 0.65. Also based on experiments, we choseε = 0.0001 to prevent division byzero.
To implement the additional limiting, we compute a linearly varying smoothing function,χi, j as
χi, j =
1.0, if ξ < ξL
1.0− ξ−ξL
ξH−ξL , if ξL < ξ < ξH
0.0, if ξ > ξH.
Then, we multiply the standard van Leer slopes byχi, j , where
χi, j = min(χi−1, j , χi, j , χi+1, j ).
So, in summary, the extrapolation formula for the left edge in the Cartesian coordinatesystem is
sn+1/2i+1/2,L = sn + 1
2
[1− 4t
4x
1
φmax
(0,∂F X
∂s
)]4sVL ,M − 4t
2φ[∇ · (H∇PC)]
+ 4t
2φ
[−∂F X
∂φ
4φVL
4x+ ∂F X
∂u
4v4z− 4F Z
4z
].
Extrapolation to the right edge is handled analogously, except that we will use informa-tion from cell (i + 1, j ) instead of(i, j ); as a result, we will use min(0, ∂F X
∂s ) instead ofmax(0, ∂F X
∂s ) to ensure that information is traveling in the correct direction.For our purposes, the main difference between cylindrical and Cartesian coordinates is
that the divergence operator looks different. Using the same techniques as in Cartesiancoordinates, the extrapolation equation in ther -direction is
sn+1/2i+1/2, j,L = sn + 1
2
[1− 4t
4r
1
φ
∂F R
∂s
]4sVL ,M − 4t
2φ[∇ · (H∇PC)]
+ 4t
2φ
[−∂F R
∂φ
4φVL
4r− F R
r− ∂F Z
∂z+ ∂F R
∂u
(∂v
∂z+ u
r
)].

322 PROPP ET AL.
In thez-direction, we obtain
sn+1/2i, j+1/2,L = sn + 1
2
[1− 4t
4z
1
φ
∂F Z
∂s
]4sVL ,M − 4t
2φ[∇ · (H∇PC)]
+ 4t
2φ
[−∂F Z
∂φ
4φVL
4z− F R
r− ∂F R
∂r+ ∂F Z
∂v
(∂u
∂r+ u
r
)].
We computeu/r as
u
r= 1
2
(ui+1/2, j + ui−1/2, j
)/r,
wherer is the radius computed at the center of cell(i, j ). We computeF R/r by calculatingF R at the center of cell(i, j ). In addition, we note that if the flux function is a linearfunction of velocity, then the extrapolation formulas in cylindrical coordinates and Cartesiancoordinates are the same.
Riemann problem. The Taylor series extrapolation produces two saturations at eachedge—one extrapolated from the left and one extrapolated from the right. We choose thecorrect edge-centered value by solving the Riemann problem. Solving the Riemann problemis central to Godunov’s method; as a result, it has been widely studied in the literature. Allenet al. [1] and LeVeque [15] provide a general description of Riemann problems for scalarconservation laws.
Stated in general terms, the Riemann problem is the initial value problem
∂s
∂t+ ∂F(s)
∂x= 0, (23)
with initial conditions
s(x, 0) ={
sL, x < 0sR, x > 0.
(24)
Osher [20] states that the solution to this problem is to choose thes that produces a globalextremum of the flux function. Specifically, ifsL < sR, then choose the value ofsbetweensL
andsR that produces the minimum flux. IfsL > sR, then choose the value ofs that producesthe maximum flux. This solution method requires the computation of critical states,sC,such that (∂F/∂s)(sC) = 0. In this work, the critical states are computed using Newton’smethod.
3.1.3. Pressure Equation
In Section 2.2, we derived a pressure equation (15):
∇ · [(λG+ λL)(∇PG)] = ∇ · [(λGγG+ λLγL)(∇z)] +∇ · (λL∇PC). (25)
If we use the Ergun equation, then this pressure equation is nonlinear because the phasemobilities depend on the pressure. We linearize the gas pressure around iterationk,
∇ · [(λkG+ λk
L
)∇δpk+1] = ∇ · [(λk
GγG+ λkLγL)∇z
]+∇ · [λkL∇PC−
(λk
G+ λkL
)∇PkG
],
(26)

NUMERICAL MODEL FOR TRICKLE BED REACTOR 323
where
δpk+1 = Pk+1G − Pk
G.
This pressure equation is discretized using the discrete divergence operator (19) and gradientoperator (18). We solve forδpk+1 using multigrid-accelerated Gauss–Seidel with Red–Blackordering; each iteration is a multigrid V-cycle. Due to the nonlinearity of the problem, wemust recalculate the coefficients between iterations.
3.1.4. Darcy’s Law
In Section 2.2, we derived an expression for total velocity (17):
vT = −(λL + λG)∇PG− (λLρL + λGρG)g∇z+ λL∇PC.
This equation is also discretized using the discrete gradient operator (18). The numericalimplementation of Ergun’s equation is difficult because of the nonlinearity of the phasevelocity. Using the Ergun equation, Darcy’s law takes the form
vp = −λp(sp, |vp|, µp)(∇Pp + γp∇z). (27)
If we examine this equation, we notice thatvp appears on both sides of the equation; thismakes solving the equation difficult as neither laggingvp nor iterating onλp andvp worksvery well. Laggingvp effectively ignores the velocity’s dependence on phase mobilitywhich can be a significant effect. Iterating onλp andvp frequently does not converge to asolution.
However, it is possible to manipulate equation (27) into a form where we can solve forvp explicitly. Using the Kozeny–Carman correlation for permeability (5), we defineAp andBp as
Ap ≡ µp
k
Bp ≡(
1.8(1− φ)ρp
µpdeφ3gc
)µp.
In addition, we define a force vector,2p, which includes the effects of the pressure gradientand the gravity term:
2p ≡ (∇Pp + γp∇z). (28)
With these definitions, we can rewrite Darcy’s law as
vp = −λp2p. (29)
If we expand the phase mobility term in (29), replace all thevp terms using (28), andsolve the resulting quadratic equation, we obtain
λp(sp, |2p|, µp) = 2kRp
Ap
(1+
√1+ 4Bp|2p|kR p
Ap ∗ Ap
) . (30)

324 PROPP ET AL.
This equation expresses phase mobility in a form that is not dependent on phase velocity.If we use (30) to express the phase mobility, then the phase velocity no longer appears onboth sides of (27):
vp = −λp(sp, |2p|, µp)(∇Pp + γp∇z). (31)
As a result, Darcy’s law is much easier to solve.
3.1.5. State Update
For this problem, there is a specific order in which the phase properties are computed. Thefirst step is to compute the capillary pressure as a function of saturation using the Leverettcapillary pressure correlation (12) with Grosser’s correlation (13). Next, we compute theliquid pressure using the definition of capillary pressure (11). Then, we compute the phasemobilities. If we are using the Ergun equation, we must utilize the reformulation of theErgun equation (30) to avoid the dependence of mobility on phase velocity; otherwise,we may use the more standard form of phase mobilities (4). Finally, we calculate phasevelocities using Darcy’s law (3).
3.1.6. Implementation of Boundary Conditions
The boundary conditions for this problem were specified in Section 2.3. Since the twomain equations that we solve are an equation for gas pressure and an equation for liquidsaturation, the specified boundary conditions must be translated into boundary conditionson gas pressure and liquid saturation.
At the impermeable walls, the physical boundary condition is that the normal componentof the phase velocity is zero. Using Darcy’s law, this implies
∂PG
∂n= −ρGg∇z,
wheren is the direction normal to the wall. For the saturation equation, we specify that theflux of saturation,F , through the wall is zero. In addition, we also specify that the saturationgradient normal to the wall is zero.
At the outlet, we specify the gas pressure and that the normal derivative of capillarypressure is zero. Assuming that the outlet is oriented in thez-direction, and using the chainrule onPC(φ, s), we obtain
∂s
∂z= −
∂PC∂φ
∂PC∂s
∂φ
∂z.
All three terms on the right-hand side of the equation can be calculated analytically at celledges. If we are not including capillary pressure effects, then we specify that the saturationgradient in thez-direction is zero.
There are two cases to consider for inlet boundary conditions. In the first case, wespecify the liquid saturation and gas pressure gradient. Since these are the variables weneed specified, there is no need to translate the boundary conditions.
In the second case, we attempt to specify physical quantities that are easier to measureexperimentally: the average gas velocity at the inlet,vAVG
G , and the liquid velocity at each

NUMERICAL MODEL FOR TRICKLE BED REACTOR 325
cell along the inlet,vL(x, zTOP). These velocity boundary conditions must be translated intoboundary conditions forsL andPG.
We index each of theN inlet cells with the superscripti . We denote the component of theliquid velocity normal to the inlet by the scalarvL and the component of the force vector(as defined in (28)) for the liquid phase that is normal to the inlet by the scalarθL. With thisnotation, we can write theN equations for liquid velocity as
viL Ai = −λi
LθiL Ai , i = 1, N,
whereAi is the cross-sectional area at the inlet of celli . In addition, we write the constraintequation for gas velocity as:
vAVGG ∗ ATOP= −
N∑i=1
AiλiGθ
iG,
where ATOP is the cross-sectional area at the inlet for the entire reactor andθ iG is the
component of the force vector for the gas phase that is normal to the inlet.Using theseN + 1 equations, we can solve forN + 1 unknowns at the inlet, that is, the
N liquid saturations,si , and the gas pressure at the top,PTOP. To determine these valueswe write the equations in residual form and then solve forsi and PTOP using a Newtoniteration scheme. We repeat the Newton iterations until the sum of the squared residuals isless than our specified tolerance.
The Newton iteration equations can be written in matrix form as
0=[
fi
fN+1
]+[
∂ fi∂si
∂ fi∂PTOP
∂ fN+1
∂si∂ fN+1
∂PTOP
] [δsi
δPTOP
],
where f i is the residual for thei th equation. These residuals are defined as
f i = Ai viL + Aiλi
LθiL, i = 1, N
f N+1 =N∑
i=1
(Ai vAVG
G + AiλiGθ
iG
),
and their derivatives with respect tosi andPTOP are
∂ f i
∂si= Ai ∂λ
iL
∂siθ i
L , i = 1, N
∂ f i
∂PTOP= Ai
(∂λi
L
∂θ iL
θ iL + λi
L
)∂θ i
L
∂PTOP, i = 1, N
∂ f N+1
∂si= Ai ∂λ
iG
∂siθ i
G, i = 1, N
∂ f N+1
∂PTOP=
N∑i=1
Ai
(∂λi
G
∂θ iG
θ iG+ λi
G
)∂θ i
G
∂PTOP.
This linear system can be solved to give closed-form solutions forδsi andδPTOP.

326 PROPP ET AL.
4. RESULTS
In this section, we describe the results from three series of test problems. The first testproblem is a simple one-dimensional problem, for which we can construct an exact solution;here we examine the effects of the slope-limiting algorithm. The second problem is theadvection of a smooth Gaussian distribution of saturation, which we use to demonstrate thesecond-order accuracy of the algorithm. The final problem explores the effects of capillarypressure, the Ergun equation, and variable porosity. In this section, saturation always refersto liquid saturation; the value of the gas saturation can be computed from (1).
4.1. Problem 1: Comparison with an Exact Solution
There are very few experimental or computational results in the open literature that aresuitable for comparison with the model in this paper. As a result, we define a one-dimensionalproblem with an exact solution in order to validate the model for a simple case; in addition,we will use this simple problem to examine the effects of the slope-limiting algorithm.
In this problem, we use Cartesian coordinates and neglect the effects of gravity, capillarypressure, and the Ergun equation. We initialize the reactor as a Riemann problem centeredat x = 0.5 with a left state of 1.0 and a right state of 0.0. We impose Dirichlet boundaryconditions on saturation atx = 0 andx = 1. As a result of these boundary conditions, thetotal velocity is constant and the pressure equation does not need to be solved; we simplyspecify that the total velocity is 2.0.
The exact solution is constructed using Oleinik’s solution to the Riemann problem [19].For this problem (sR > sL), Oleinik’s solution is to replace any convex portions of theflux function with straight lines. Any parts of the modified flux function that are straightlines are shocks, while any smoothly varying regions are rarefactions. Figure 1 shows the
FIG. 1. Flux function and its modified convex hull. The straight line from 0 to 0.4468 indicates the presenceof a shock.

NUMERICAL MODEL FOR TRICKLE BED REACTOR 327
FIG. 2. Saturation profiles for the 1D problem.
flux function and its convex hull for this problem. The straight line from 0.0 to 0.4468indicates that we expect a shock between these two saturations. In addition, we expect ararefaction between 0.4468 and 1.0. The shock speed, in this case 3.241, follows from theRankine–Hugoniot condition.
We run two one-dimensional simulations; one uses normal van Leer slopes, while theother uses theχ correction to the van Leer slopes. Both of these simulations are run for350 time steps with a CFL number of 0.9 on a grid with 500 grid points. The results ofthese two simulations, along with the exact solution, are shown in Fig. 2. As expected, bothsimulations correctly predict the gross features of the exact solution.
Figure 3 shows an enlarged view of these solutions around the shock. Here we can seethat the simulation using van Leer slopes predicts an incorrect location of the rarefactionand the shock (this problem is alluded to in [1, 6]). On the other hand, the simulation usingmodified van Leer slopes (i.e., the van Leer slopes with theχ correction) more accuratelypredicts the location of the rarefaction and the shock.
4.2. Problem 2: Gaussian Distribution
In this problem, we advect a Gaussian distribution of saturation in order to demonstratethe second-order accuracy of the method for smooth data. In the first case, we neglectthe effects of capillary pressure and the Ergun equation, and use the Cartesian coordinatesystem. The reactor has a uniform porosity of 0.35. We run the simulations to the same timeat four different grid resolutions—32× 32, 64× 64, 128× 128, and 256× 256.
We determined the error in the solution by comparing the saturation on a particular gridwith the saturation on the next finer grid. Then, by comparing errors on successive grids, wecomputed convergence rates. In Table I we present the error and rates of convergence forthis test problem. Due to the slope limiter in the advection algorithm, we see second-order

328 PROPP ET AL.
FIG. 3. A closeup of the solution for the 1D problem. The solution using normal van Leer slopes incorrectlypredicts the rarefaction and the location of the shock. The solution using theχ correction, denoted as modifiedslopes, predicts the rarefaction and shock location more accurately.
convergence in theL1 norm only; theL2 andL∞ norms are within the expected ranges fora slope-limited, second-order algorithm.
In the second case, the effects of capillary pressure and the Ergun equation are included,and the calculation is done in cylindrical coordinates. As in the first case, the reactor hasa uniform porosity of 0.35 and the simulations are run to the same time on four differentgrid resolutions—32× 32, 64× 64, 128× 128, and 256× 256. The convergence resultsfor these simulations are shown in Table II; again, we obtain second-order convergence forour algorithm.
4.3. Problem 3: Physical Effects
In this problem, we first demonstrate that the algorithm is second-order accurate for morecomplicated problems and then explore some of the more complicated physical effectspresent in the reactor. All of the simulations in this subsection use cylindrical coordinatesand the nonlinear inlet boundary condition described in Section 3.1.6. In these simulations,we usevAVG
G = −0.01 andvL(r, zTOP) = −0.005. In addition, we specify that the reactor
TABLE I
Convergence Rate of Saturation inx–z Coordinates Without Capillary Pressure
and Without the Ergun Equation
Norms 32–64 Rate 64–128 Rate 128–256
L1 3.593e-5 2.05 8.662e-6 2.07 2.068e-6L2 1.210e-4 1.79 3.508e-5 1.79 1.011e-5L∞ 8.957e-4 1.29 3.664e-4 1.44 1.347e-4

TABLE II
Convergence Rate of Saturation inr–z Coordinates with Capillary Pressure and
with the Ergun Equation for Smooth Initial Conditions
Norms 32–64 Rate 64–128 Rate 128–256
L1 1.006e-5 1.93 2.646e-6 2.01 6.548e-7L2 4.437e-5 1.69 1.371e-5 1.87 3.763e-6L∞ 4.734e-4 1.23 2.018e-4 1.20 8.782e-5
TABLE III
Convergence Rate of Saturation inr–z Coordinates with Capillary Pressure
and with the Ergun Equation
Norms 32–64 Rate 64–128 Rate 128–256
L1 1.235e-0 1.42 1.847e-0 2.32 1.479e-0L2 1.048e-1 1.05 1.011e-1 1.64 6.489e-2L∞ 1.579e-2 0.37 1.219e-2 0.93 6,399e-3
FIG. 4. Error in solution on 128× 128 grid. The error is concentrated around the shock.
FIG. 5. Saturation at timet = 2.0 with no porosity variation using 12 equally spaced contours.
329

330 PROPP ET AL.
TABLE IV
Summary of Simulations of the Effects of Capillary Pressure and the Ergun Equation
Figure Ergun effects Capillary pressure effects Porosity Maximum saturation Minimum saturation
5 no no 0.35 0.46513 0.250006(a) no no Eq. (32) 0.46848 0.250006(b) yes no Eq. (32) 0.49578 0.250007(a) no yes Eq. (32) 0.50618 0.138447(b) yes yes Eq. (32) 0.53530 0.13865
has a radius of 0.14605 and a height of 0.2286; initially it contains fluid with a saturationof 0.25.
We performed a convergence study on the problem with capillary pressure, the Ergunequation, and variable porosity (this corresponds to the case shown later in Fig. 7b). Theresults, presented in Table III, show that even though we have added more complicatedphysics, we still obtain second-order convergence. Figure 4 shows that the error on the128× 128 grid is concentrated around the shock.
Next, we examine the effects of the Ergun equation, capillary pressure, and variableporosity by running five different simulations to timet = 2.0 on a 128× 128 grid. In thefirst simulation, we neglect the effects of capillary pressure and the Ergun equation. Inaddition, the reactor has a uniform porosity of 0.35. As shown in Fig. 5, this simulationproduces a one-dimensional saturation profile. In the next four simulations the porosityprofile varies in ther -direction; the profile is uniform through most of the domain, butincreases rapidly near the outer wall such that
φ(r ) = 0.35+ 0.07
(e50r
e50R
), (32)
whereR is the radius of the reactor.
FIG. 6. Saturation with porosity variation at timet = 2.0 using 12 equally spaced contours: (a) withoutcapillary pressure and without the Ergun equation; (b) without capillary pressure and with the Ergun equation.

NUMERICAL MODEL FOR TRICKLE BED REACTOR 331
FIG. 7. Saturation with porosity variation at timet = 2.0 using 12 equally spaced contours: (a) with capillarypressure and without the Ergun equation; (b) with capillary pressure and with the Ergun equation.
Table IV summarizes the five simulations; in this table, “yes/no” signifies whether capil-lary pressure effects and Ergun effects are or are not included in the simulation. The resultsof these simulations are shown in Figs. 6 and 7. All of these figures use the same scale andcontour interval so they can be easily compared.
By examining Figs. 6 and 7, we observe two effects of the Ergun equation: (1) it decreasesthe speed of the front and (2) it increases the saturation of the front. Thus, the Ergun equationappears to change the magnitude of various properties of the solution, but does not changethe qualitative character of the solution.
On the other hand, capillary pressure tends to change the character of the solution. It iswell known that capillary pressure acts as a diffusive force [1]; in these simulations, wenote that capillary pressure causes the saturation front to “smear.” In addition, in the regiondownstream from the front, the capillary pressure causes the liquid phase to diffuse fromthe high-porosity region to the low-porosity region.
5. CONCLUSIONS
This paper describes an algorithm for solving a simplified flow problem in a trickle bedreactor. Flow in a trickle bed reactor is governed by equations of flow in porous media, suchas Darcy’s law and conservation of mass for each component. By using a total-velocityformulation, we transformed these governing equations into a system of equations suitablefor a sequential algorithm. This transformation split the problem into an elliptic pressureequation, an advection–diffusion equation that describes conservation of mass, and anequation for total velocity.
The elliptic pressure equation was solved using a multigrid-accelerated iterative method.The saturation equation was solved using a combination of Godunov’s method and themultigrid-accelerated iterative method. The equation for total velocity used a reformulationof the Ergun equation that eliminated the nonlinear dependence on phase velocity. These

332 PROPP ET AL.
three equations formed the basis for the sequential predictor–corrector algorithm that weimplemented.
We applied this algorithm to several test problems. For a simple one-dimensional problem,the algorithm converged to the exact solution and the modified slope limiting algorithmplaced the shock and the rarefaction more accurately than standard van Leer slopes. Thealgorithm was shown to be second-order accurate. Finally, the code was used to explore theeffects of capillary pressure, spatial porosity variations, the Ergun equation, and a nonlinearinlet boundary condition.
This work is meant as an initial step toward the design of a more complicated simulatorof flow in a trickle bed reactor; several other improvements are necessary to handle thecomplicated physics inside a trickle bed reactor. These improvements include using a com-pressible gas phase, using multiple phases and components, and including heat and masstransfer and chemical reactions. Most of these changes simply involve reformulating thegoverning equations to include the appropriate physical effects; then the same numericalframework can be used to solve them. For example, Trangenstein and Bell [26, 17] modeledpetroleum reservoir flow with multiple phases and components and a compressible gas phaseby casting the governing equations in terms of component masses instead of saturations.Other potential improvements to this work are extending it to a more realistic geometry,such as a three-dimensional coordinate system, and using adaptive mesh refinement to focusthe computational effort where it is needed in the problem domain.
REFERENCES
1. M. B. Allen, III, G. A. Behie, and J. A. Trangenstein,Multiphase Flow in Porous Media, Vol. 34 (Springer-Verlag, Berlin, 1988).
2. D. H. Anderson and A. V. Sapre, Trickle bed reactor flow simulation,AIChE J.37, 377 (1991).
3. K. Aziz and A. Settari,Petroleum Reservoir Simulation(Applied Science, 1979).
4. J. Bear,Dynamics of Fluids in Porous Media(Dover, New York, 1972).
5. J. B. Bell, P. Colella, and H. M. Glaz, An efficient second-order projection method for the incompressibleNavier–Stokes equations,J. Comput. Phys.85, 257 (1989).
6. J. B. Bell, P. Colella, and J. A. Trangenstein, Higher order Godunov methods for general systems of conser-vation laws,J. Comput. Phys.82, 362 (1989).
7. J. B. Bell, G. R. Shubin, and J. A. Trangenstein, A method for reducing numerical dispersion in two-phaseblack-oil reservoir simulation,J. Comput. Phys.65, 71 (1986).
8. A. Brandt, Multi-level adaptive solutions to boundary-value problems,Math. Comput.31, 333 (1977).
9. P. C. Carman, Fluid flow through a granular bed,Trans. Inst. Chem. Eng.15, 150 (1937).
10. P. Colella, Multidimensional upwind methods for hyperbolic conservation laws,J. Comput. Phys.87, 171(1990).
11. R. E. Collins,Flow of Fluids through Porous Materials(Reinhold, New York, 1961).
12. R. Courant, K. Friedrichs, and H. Lewy, On the partial difference equations of mathematical physics,IBM J.11, 215 (1967). English translation of the original work, “Uber die Partiellen Diefferenzengleichungen derMathematischen Physik,”Math. Ann.100, 32 (1928).
13. A. Gianetto and V. Specchia, Trickle-bed reactors: State of art and perspectives,Chem. Eng. Sci.47, 3197(1992).
14. K. Grosser, R. G. Carbonell, and S. Sundaresen, Onset of pulsing in two-phase cocurrent downflow througha packed bed,AIChE J.34 (1988).
15. R. J. LeVeque,Numerical Methods for Conservation Laws, Birkhauser, 1990.
16. M. C. Leverett, Capillary behavior in porous solids,Trans. AIME142, 152 (1941).
NUMERICAL MODEL FOR TRICKLE BED REACTOR 333
17. I. F. MacDonald, M. S. El-Sayed, K. Mow, and F. A. L. Dullien, Flow through porous media—The Ergunequation revisited,Ind. Eng. Chem. Fundam.18, 199 (1979).
18. E. S. Nelson,A Numerical Model for the Simulation of Reactive Melt InfiltrationPh.D. thesis (University ofCalifornia, Berkeley, 1998).
19. O. A. Oleinik, Discontinuous solutions of non-linear differential equations,Am. Math. Soc. Transl.26, 95(1963).
20. S. Osher, Riemann solver, the entropy condition, and difference approximations,SIAM J. Num. Anal.21, 217(1984).
21. A. E. Saez and R. G. Carbonell, Hydrodynamic parameters for gas-liquid cocurrent flow in packed beds,AIChE J.31, 52 (1985).
22. Y. T. Shah,Gas–Liquid–Solid Reactor Design(McGraw–Hill, New York, 1979).
23. A. G. Spillette, J. G. Hillestad, and H. L. Stone, A high-stability sequential solution approach to reservoirsimulation, presented at the SPE 48th Annual Fall Meeting, Las Vegas, Sept. 1973.
24. V. Stanek, J. Hanika, V. Hlavacek, and O. Trnka, The effect of liquid flow distribution on the behaviour of atrickle bed reactor,Chem. Eng. Sci.36, 1045 (1981).
25. M. D. Stevenson, M. Kagan, and W. V. Pinczewski, Computational methods in petroleum reservoir simulation,Comp. Fluids19, 1 (1991).
26. J. A. Trangenstein and J. B. Bell, Mathematical structure of compositional reservoir simulation,SIAM J. Sci.Stat. Comput.10, 817 (1989).
27. J. A. Trangenstein and J. B. Bell, Mathematical structure of the black-oil model for petroleum reservoirsimulation,SIAM J. Appl. Math.49, 749 (1989).
28. B. van Leer, Towards the ultimate conservative difference scheme. IV. A new approach to numerical convec-tion, J. Comput. Phys.23, 276 (1977).
29. J. W. Watts, A compositional formulation of the pressure and saturation equations, in7th SPE Symposium onReservoir Simulation(Society of Petroleum Engineers, 1983), pp. 113–122.
30. S. P. Zimmerman and K. M. Ng, Liquid distribution in trickling flow trickle-bed reactors.Chem. Eng. Sci.41,861 (1986).