Embed Size (px)
Citation preview

Askarian Khoob & Ketabdari, Cogent Engineering (2017), 4: 1387951https://doi.org/10.1080/23311916.2017.1387951
MECHANICAL ENGINEERING | RESEARCH ARTICLE
A numerical investigation into the effects of long-term wave-induced loads on the cross structure of a wave-piercing trimaranAbolfath Askarian Khoob1 and Mohammad Javad Ketabdari1*
Abstract: In the present study, the numerical analysis of long-term prediction of wave-induced loads on cross structure of a trimaran ship has been studied. The computation of these wave loads was performed by the use of MAESTRO-Wave, which is a linear sea-keeping analysis code. A global FEM model of the trimaran with symmetric and asymmetric side hull configurations was constructed using MAESTRO software. Then, the distribution and trend of the load at the junction of the cross deck and the main hull were derived. Results demonstrate that the 20-year long-term predictions are about 20% larger than the 1-year predictions for responses in combined sailing speeds. The study offers useful information about wave loads for balancing seakeeping performance with other design considerations in the concep-tual design of a wave piercing trimaran.
Subjects: Mechanical Engineering; Mechanics; Fluid Mechanics
Keywords: trimaran ship; cross structure; long-term prediction; wave-induced loads
*Corresponding author: Mohammad Javad Ketabdari, Department of Marine Technology, Amirkabir University of Technology, Tehran, IranE-mail: [email protected]
Reviewing editor:Duc Pham, University of Birmingham, UK
Additional information is available at the end of the article
ABOUT THE AUTHORSAbolfath Askarian Khoob was born in 1972. He obtained his BSc degree in marine engineering and received his MSc degree from Sharif University of Technology of Tehran in Naval Architecture in 2000. Currently, he is a PhD student in the Naval Architecture at Amirkabir University of Technology (Tehran Polytechnic). His main research interests are field of hydrodynamics, with specific emphasis on experimental and numerical modeling of ships in waves.
Mohammad Javad Ketabdari is currently the associate professor of the Faculty of Marine Technology, Amirkabir University of Technology. He obtained his BSc degree from Isfahan University of Technology, MSc degree from Engineering Faculty of Tehran University and his PhD degree from the University of Birmingham in UK. He has published more than 400 papers addressing theoretical and practical applications in offshore and Coastal structures and marine hydraulics. He supervised BSc, MSc and PhD students in their final projects and is currently teaching Nonlinear Wave Theory and Hydrodynamics of offshore platforms for PhD students.
PUBLIC INTEREST STATEMENTTrimaran has unique hull form with a rapidly growth in recent years due to its application as a mode of transports and naval vessels. In contrast to traditional monohull ships which are exposed to longitudinal wave loads, trimaran is also exposed to transverse wave loads because of its cross structure. Configuration of side hulls has a significant effect on wave-induced structural loads. In this paper, we used a statistical long-term analysis in order to determine the wave-induced loads of a trimaran ship with symmetric and asymmetric side hull configurations. The calculation of these wave-induced loads was carried out using MAESTRO-Wave, a panel method-based program. Long-term prediction of wave-induced load of this vessel was performed based on some important factors such as wave scatter diagram, wave spectrum, incident wave angle and period of lifetime. The conclusions of this study offer useful information to the design of this new type of ship.
Received: 28 June 2017Accepted: 26 September 2017First Published: 09 October 2017
© 2017 The Author(s). This open access article is distributed under a Creative Commons Attribution (CC-BY) 4.0 license.
Page 1 of 17
Abolfath Askarian Khoob

Page 2 of 17
Askarian Khoob & Ketabdari, Cogent Engineering (2017), 4: 1387951https://doi.org/10.1080/23311916.2017.1387951
1. IntroductionIn recent years, the demand for high speed multihull ships has significantly increased for military, commercial, and recreational purposes. Trimaran is a multihull thin vessel consisting of three inde-pendent hulls including a long main hull and two slim side hulls (outriggers). Because of its high hydrodynamic and operational performance, trimaran ships have been of great interest to naval architects, especially in ferry research and military applications.
In contrast to traditional monohull ships which are exposed to longitudinal wave loads, trimaran is also subjected to transverse wave loads due to its cross structure. The exact prediction of wave-induced loads on the cross structure of a trimaran is the key to the design and assessment of trans-verse strength of the structure.
In recent years, various studies have been performed on the prediction of long-term wave-in-duced loads of ships. Most of these studies are devoted to the monohull and catamarans ships. A method proposed (Guedes Soares & Schellin, 1996) offers a long-term non-linear formulation of wave-induced loads for a container ship hull. This formulation proposes practical long-term predic-tions. A direct calculation method used (Guedes Soares, Fonseca, & Pascoal, 2004) is based on trans-fer functions called “pseudo transfer functions” which is used in order to calculate the long-term vertical bending moment at the midship of a fast moving monohull. His results showed that the long-term wave-induced loads were much greater than the least wave loads which are specified in the rules of classification societies.
The longitudinal strength of a fast moving ferry was investigated by exposing the hull girder of a ship to long-term wave loads created by a frequency-domain panel code (Schellin & de Lucas, 2004). A spectral analysis based on the wave induced loads conducted to select suitable side hull location for a trimaran ship advancing in waves (Fang & Chen, 2008). They applied the 3D source distribution meth-od, using a combination of pulsating source potential and the panel method, to drive wave load with respect to different staggers and clearances. A 3D hydroelasticity analysis of a trimaran, including slamming carried out by Hirdaris and Temarel (2009). Regular wave-induced loads for vertical bending moment at amidships and the prying moment at the connection between the main hull and cross structure wereevaluated in head waves of unit amplitude at Froude number Fn = 0. 41. The prediction of wave loads response were carried out using both 3D FFSI (fluid–flexible structure interaction) and rigid-body analyses, through application of hydrodynamic and hydrostatic pressures and inertia forces on the 3D FE model of the trimaran, namely uncoupled FSI (fluid structure interaction). It should be noted that for the rigid-body methods, both pulsating and translating, pulsating source distributions over the mean wetted surface are employed, the latter being considered more appropriate for this high Fn. For the vertical bending moment the rigid-body and hydroelastic predictions, using a pulsat-ing source, are close to each other, with the translating, pulsating source method producing smaller values around resonance. On the other hand, for the prying moment, all methods produce different predictions, with the rigid-body pulsating source method resulting in unrealistically high values at resonance. None of these predictions have been verified formally in the open literature; however, the comments on the prying moment, obtained using rigid-body FSI, are based on informal feedback.
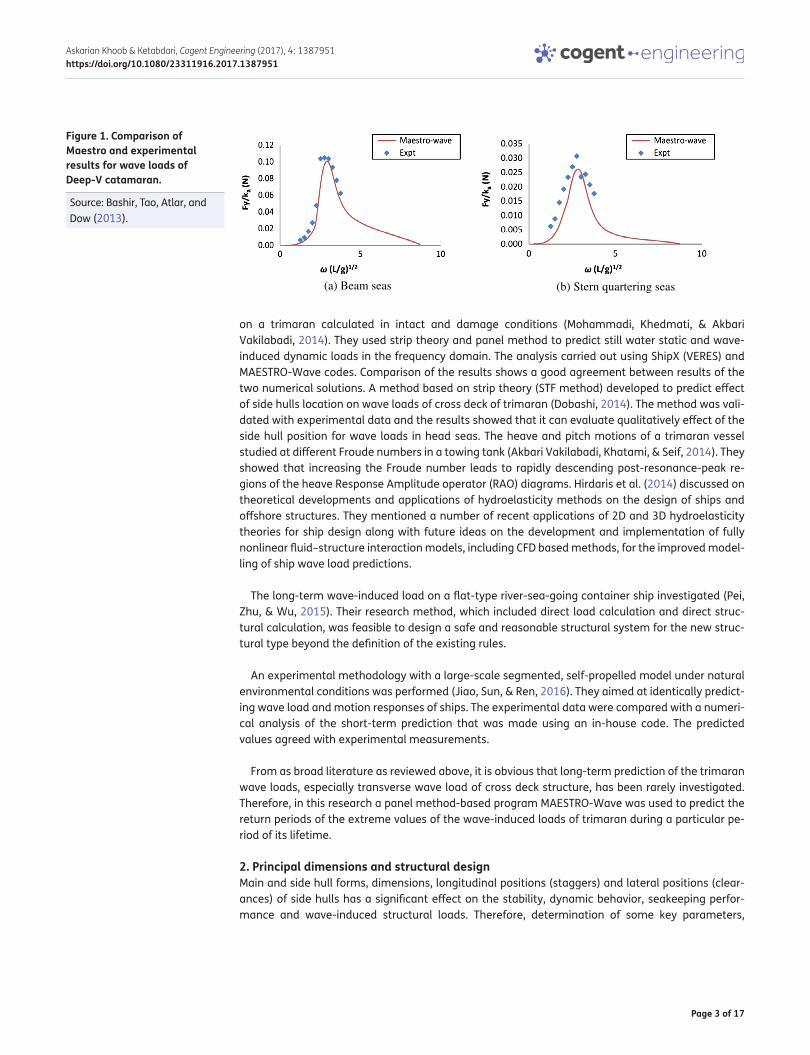
The significant values calculated for wave loads of a trimaran with different layouts and lengths of the side hulls based on 3D potential theory and Green’s function (Min & Shi-Lian, 2011). The ex-perimental model tests data used to validate the numerical prediction of the wave-induced loads in regular wave conditions on a Deep-V hull form catamaran carried out using Maestro-Wave (Bashir, Tao, Atlar, & Dow, 2013). The comparison of his results with measured data in Figure 1 showed a good agreement.
A practical method proposed for balancing the loads in FE model and hull girder sectional loads which were taken from hydrodynamic analysis (Ma, Zhao, & Hughes, 2014). The global loads acting
Page 3 of 17
Askarian Khoob & Ketabdari, Cogent Engineering (2017), 4: 1387951https://doi.org/10.1080/23311916.2017.1387951
on a trimaran calculated in intact and damage conditions (Mohammadi, Khedmati, & Akbari Vakilabadi, 2014). They used strip theory and panel method to predict still water static and wave-induced dynamic loads in the frequency domain. The analysis carried out using ShipX (VERES) and MAESTRO-Wave codes. Comparison of the results shows a good agreement between results of the two numerical solutions. A method based on strip theory (STF method) developed to predict effect of side hulls location on wave loads of cross deck of trimaran (Dobashi, 2014). The method was vali-dated with experimental data and the results showed that it can evaluate qualitatively effect of the side hull position for wave loads in head seas. The heave and pitch motions of a trimaran vessel studied at different Froude numbers in a towing tank (Akbari Vakilabadi, Khatami, & Seif, 2014). They showed that increasing the Froude number leads to rapidly descending post-resonance-peak re-gions of the heave Response Amplitude operator (RAO) diagrams. Hirdaris et al. (2014) discussed on theoretical developments and applications of hydroelasticity methods on the design of ships and offshore structures. They mentioned a number of recent applications of 2D and 3D hydroelasticity theories for ship design along with future ideas on the development and implementation of fully nonlinear fluid–structure interaction models, including CFD based methods, for the improved model-ling of ship wave load predictions.
The long-term wave-induced load on a flat-type river-sea-going container ship investigated (Pei, Zhu, & Wu, 2015). Their research method, which included direct load calculation and direct struc-tural calculation, was feasible to design a safe and reasonable structural system for the new struc-tural type beyond the definition of the existing rules.
An experimental methodology with a large-scale segmented, self-propelled model under natural environmental conditions was performed (Jiao, Sun, & Ren, 2016). They aimed at identically predict-ing wave load and motion responses of ships. The experimental data were compared with a numeri-cal analysis of the short-term prediction that was made using an in-house code. The predicted values agreed with experimental measurements.
From as broad literature as reviewed above, it is obvious that long-term prediction of the trimaran wave loads, especially transverse wave load of cross deck structure, has been rarely investigated. Therefore, in this research a panel method-based program MAESTRO-Wave was used to predict the return periods of the extreme values of the wave-induced loads of trimaran during a particular pe-riod of its lifetime.
2. Principal dimensions and structural designMain and side hull forms, dimensions, longitudinal positions (staggers) and lateral positions (clear-ances) of side hulls has a significant effect on the stability, dynamic behavior, seakeeping perfor-mance and wave-induced structural loads. Therefore, determination of some key parameters,
Figure 1. Comparison of Maestro and experimental results for wave loads of Deep-V catamaran.
Source: Bashir, Tao, Atlar, and Dow (2013).
(a) Beam seas (b) Stern quartering seas

Page 4 of 17
Askarian Khoob & Ketabdari, Cogent Engineering (2017), 4: 1387951https://doi.org/10.1080/23311916.2017.1387951
including main hull length to beam ratios, outrigger length and its location is very important at initial design stage.
In this work a trimaran was initially designed based on prescription of American Bureau of Shipping rules (ABS) for high speed naval crafts. Moreover, the reports on designing models of trimaran ship, including RV Triton, LCS-2 independence, Bechijiqua express and Austal 102 were employed in the present study. The model consisted of a symmetric displacement type main hull and two symmetric and asymmetric side hulls. The outriggers are rigidly connected to the main hull by using a cross deck structure. The form of the centre hull is quite slender while in outriggers, they are in Wigley hull forms. A wave piercing bow was used to improve hydrodynamic performance of the ship. Main par-ticulars of the ship are listed in Table 1.
A global FEM of trimaran was simulated in the full load condition based on the ABS rules. The ma-rine steel grade of AH36 was used as the structural material for the model to achieve lower building cost and fatigue. Main tanks and compartments were located in both central and side hulls of the model. Main ship components and payloads (deck house, basic machinery, generators, weapon sys-tems with ammunition and helicopters) were modeled as weights, which are distributed on a certain number of nodes. The model consisted of 5,941 nodes and 13,090 elements. The FE model was cre-ated using five sub structural units with 28 modules which collectively formed the model of the en-tire ship. The structural components include strake panels, frames, beams, columns, and plate elements. The complete finite element model is shown in Figure 2. The model is coarse meshed with element size equal to stiffener spacing.
The structural configuration of the model for the main hull, outriggers and cross decks is a longi-tudinal framing system with frame spaces of 1,000 mm. Special considerations were taken into ac-count at the junctions of cross decks and the main hull to avoid stress concentration on the main hull. According to the ABS rules, minimum scantlings were defined for each member and strength of the midship section was controlled with respect to the global and local design loads.
Table 1. Main particulars of the trimaranItem ValueLength overall (m) 121
Length on waterline (m) 120.2
Length between perpendiculars (m) 117.31
Beam overall (m) 24.17
Beam on waterline (m) 10.66
Depth (m) 13.03
Draft (m) 4. 86
Length of the side hull (m) 40
Beam of side the hull (m) 2.62
Depth of side the hull (m) 9.04
Draft of side the hull (m) 8.60
Clearance between the centreline of the main hull and the centreline of the side hull (m) 10.77
Stagger between the midship of the side hull and the midship of main hull (m) 25.41
Displacement (ton) 2,435.93
Design speed (Knot) 30

Page 5 of 17
Askarian Khoob & Ketabdari, Cogent Engineering (2017), 4: 1387951https://doi.org/10.1080/23311916.2017.1387951
3. A numerical method for statistical predictionsDuring the navigational lifetime, a ship faces many different sea conditions on its journeys to differ-ent geographic areas. Because of the unpredictable nature of the ocean environment, wave loading of ships and offshore structures are stochastic and the response of these structures is a random process too. Probability analysis theory for wave loads, consists of two steps, short-term prediction and long-term prediction. Short-term prediction means predicting for a short period, e.g. half an hour to three hours or more, when the significant wave height and the average wave period are considered as constant. Long-term prediction means to statistically predict the reaction of a ship to irregular waves over a long period of time, with the duration of 20 to 25 year. The long-term distribu-tion and its probability density function in irregular waves can be fitted by overlying the short-term values according to their appearance probability illustrated in wave scatter diagrams. The long-term extreme values under excessive probabilities are then calculated. The procedure of assessing the wave- induced motions and load responses is based on the transfer functions which can be pre-dicted by a linear theory. The incidental waves and the ship response signals are regarded as sta-tionary stochastic processes in linear theory. The ship response spectrum in three-dimensional irregular waves is calculated from the input wave spectrum and transfer functions as (Dai, Sheen, & Song, 2007).
In this formula, ω is wave frequency, Hs is significant wave height, Tz is wave period, U represents the speed of the ship, β is wave heading, θ is the angle between component and main wave direction, SR is ship response function of motions or loads, HRw is transfer function of motion or load response, and Sw is wave spectral density function.
When the response spectrum is obtained, all statistical values of the response are taken from mo-ments of the response spectrum. For a vessel advancing at a constant forward speed U in waves with head angle β, the n-th order spectral moment of the response is obtained by:
where, ωe denotes the frequency of encounter defined by:
The variance of the process at the 0-th moments of SR is calculated by:
(1)SR(�,Hs, Tz,U, �
)= ||HRw(�,U, �)
||2Sw
(�,Hs, Tz, �
)
� = � + �
(2)mn =∞
∫0
�neSR(�)d�
(3)�e =|||||� − U
�2
gcos�
|||||
Figure 2. Finite element model of trimaran and side hulls configuration.
(a) FE Model (b) Symmetric (c) Asymmetric
Page 6 of 17
Askarian Khoob & Ketabdari, Cogent Engineering (2017), 4: 1387951https://doi.org/10.1080/23311916.2017.1387951
The significant amplitude value of short-term responses is defined as follows:
Generally, the long-term prediction is made based on short-term responses to various sea condi-tions, and is calculated by the significant wave height Hs, and a particular period Tz. It is then general-ized to the long-term prediction by considering the wave scatter diagram. In the short-term prediction, the probability of exceeding a given level x of response amplitude, for i-th sea state, j-th wave heading and k-th speed, is calculated by the Rayleigh distribution:
where, E[(Hs, Tz
)i, �j ,Uk
] is two times the variance and is computed by the formula:
Long-term prediction is defined as the weighted sum of all short-term responses according to vari-ous sea states, wave headings, and the speed of the ship. In the long-term prediction, the probability of the exceedance of ship motion and load responses in different navigational conditions are com-puted by:
In this formula, the joint probability pi(Hs, Tz) is related to wave occurrence in a specified sea area which is represented in the form of a scatter diagram. Meanwhile, pj symbolizes the probability of the occurrence of j-th relative wave heading and pk displays the probability of k-th ship speed. It is as-sumed that the sea surface is constituted by short-crested waves. The directional wave density spectrum is supposed to be represented by a one dimensional spectrum. The directional spectrum S(�, �) can be presented as (Jiao et al., 2016):
where, D(ω, θ) defines the proportion of the total energy propagating at an angle θ to the mean wave direction. With the directional spreading function defined so that its integral over all possible direc-tions is unity constant:
The directional function can be simply expressed as:
m0
(Hs, Tz,U, �
)= �
2 =�∕2
∫−�∕2
∞
∫0
SR(�,Hs, Tz,U, �
)d�d�
(4)=�∕2
∫−�∕2
∞
∫0
||HRw(�,U, �)||2Sw
(�,Hs, Tz, �
)d�d�
(5)xs = 2√m(Hs, Tz,U, �)
(6)Pijk(x) = exp
{−x2
/
E[(Hs, Tz
)i, �j ,Uk
]}
(7)E[(Hs, Tz
)i, �j ,Uk
]= 2m(Hs, Tz,U, �)
(8)P(X ≥ x) =∑
i
∑
j
∑
k
pi(Hs, Tz)pj(�)pk(U)exp
{−x2
/
E[(Hs, Tz
)i, �j ,Uk
]}
(9)S(�, �) = Sw(�)D(�, �)
(10)2�
∫0
D(�, �)d� = 1
D(�, �) = 2cos2�∕� − �∕2 ≤ � ≤ �∕2
(11)D(�, �) = 0.0 elsewhere
Page 7 of 17
Askarian Khoob & Ketabdari, Cogent Engineering (2017), 4: 1387951https://doi.org/10.1080/23311916.2017.1387951
4. Selection of wave spectrum and scatter diagramThe computed long-term distribution is highly dependent on the assumptions used in the analysis. The choice of wave scatter diagram containing the probabilities of occurrence of various short-term sea states is the most important parameter in the long-term distribution. Other parameters, such as ship speed and heading angles could also influence the results significantly to standardize the pro-cedure for computation of extreme values (Parunov, Senjanović, & Pavićević, 2004). IACS has issued Recommendation note No.34 as guidance for the long-term statistical analysis (IACS Recommendation, 2000). The basic assumptions proposed by IACS for calculation of wave loads with exceeding probability of 10−8 which corresponds to the extreme loads with a return period of 20 years are:
• The IACS North Atlantic scatter diagram should be used. This scatter diagram covers areas 8, 9, 15 and 16, as defined in Global Wave Statistics (GWS) (Hagen, Dacha, & Olliver, 1986). Data from the GWS are further modified by IACS in order to take into account the limited wave steepness more properly.
• When calculating design wave bending moments, it is recommended to use a return period of at least 20 years, corresponding to about 10−8probability of exceedance per cycle.
• The Bretschneider or two parameter Pierson-Moskowitz spectrum is recommended for the North Atlantic.
• In long term calculations, all wave headings (0–360°) can be assumed to have an equal probabil-ity of occurrence and at most 30° spacing between headings should be applied.
• Short-crested waves with the wave energy spreading function proportional to cos2(θ) have to be used.
• For evaluation of extreme global bending moments it is recommended to use zerospeed.
• When calculating vertical bending moments (Sag and Hog) proper corrections for non-linear effects are to be applied.
We used the popular Bretschneider Wave Spectrum, which represents the area of operation and wave data from the North Atlantic area and is a usual wave scatter diagram, as input for the statisti-cal analysis. Table 2 denotes the IACS wave scatter diagram for the North Atlantic Ocean. For a particular significant wave height Hs, and the period of zero-crossing Tz, each cell shows the number of occurrences of the sea state from among 100,000 normal sea states.
5. The description of the numerical methodA 3D panel linear code called MAESTRO-Wave was used to predict the wave loads of this vessel (MAESTRO, 2012). The MAESTRO-Wave is a frequency domain 3D-panel potential flow seakeeping module that is seamlessly has been integrated into the MAESTRO Global Structural Analysis soft-ware. This program uses the Green’s function integral equation’s technique to determine the un-steady potentials in order to solve the boundary value problem of interaction between water waves and bodies in the frequency domain. The code is used for the prediction of motions and wave-in-duced load response characteristics of marine vehicles. The main impetus for using this software is that it does not require the use of Finite Element (FE) mesh separate from the hydrodynamic mesh when performing the structural analysis of the same hull geometry. This process, therefore, ensures that there is equilibrium between the hydrodynamic and the FE mesh; hence it reduces the difficulty of convergence between the two different meshes which is commonly experienced when importing hydrodynamic mesh into an FE program.

Page 8 of 17
Askarian Khoob & Ketabdari, Cogent Engineering (2017), 4: 1387951https://doi.org/10.1080/23311916.2017.1387951
The followings are the fundamental assumptions made in the formulations:
• The fluid is assumed to be ideal, (inviscid, incompressible and irrotational).
• The body stays at its mean position. Any oscillatory amplitude of its motions as well as incident wave’s amplitude are assumed to be small.
• The double body steady flow assumption neglects the wave making of the vessel.
• Incoming waves are assumed to be sinusoidal with small amplitudes and hence linear free sur-face conditions apply.
• The vessel is considered to move at a constant speed.
It should be noted that the non-linear features of wave load could not be captured by the linear hydrodynamic theory. Therefore, some approximate correction should be accounted for in order to reduce the errors associated with calculated results respect to the physical reality. For example (Parunov et al., 2004) mentioned that non -linear corrections should be assumed as in the IACS UR S11, which means that the ratio between the wave bending moments in sagging and hogging de-pends only on the block coefficient Cb. Nevertheless neglecting the effects of 3D flow, viscosity and nonlinearities in numerical models causes an increase in the discrepancies between the numerical and experimental data.
The S-175 container ship is a common standard test case which was utilized by the ITTC in 2010 to carry out a comparative numerical study of linear wave-induced structural loads and motions. The database obtained from that study contains some experimental data and also numerical results from many institutions. In order to validate the theoretical capacity of Maestro-wave to predict the motion characteristics of ship hull forms over a range of wave frequencies and Froude numbers, comparison was conducted with the available experimental data of S-175.
The particular features of the S-175 container ship which were shown in Figure 3 are reported in Table 3. The results of motion and wave-induced loads RAO as well as the existing experimental data
Table 2. IACS wave scatter diagram for the North Atlantic Ocean Hs∕T
Z3.5 4.5 5.5 6.5 7.5 8.5 9.5 10.5 11.5 12.5 13.5 14.5 15.5 16.5 17.5 18.5 Sum
0.5 1.3 133 865 1,186 634 186 36.9 5.6 0.7 0.1 0 0 0 0 0 0 3,050
1.5 0 29.3 986 4,976 7,738 5,569 2,375 703 160 30.5 5.1 0.8 0.1 0 0 0 22,575
2.5 0 2.2 197 2,158 6,230 7,449 4,860 2,066 644 160 33.7 6.3 1.1 0.2 0 0 23,810
3.5 0 0.2 34.9 695 3,226 5,675 5,099 2,838 1,114 377 84.3 18.2 3.5 0.6 0.1 0 19,128
4.5 0 0 6 196 1,354 3,288 3,857 2,685 1,275 455 130 31.9 6.9 1.3 0.2 0 13,289
5.5 0 0 1 51 498 1,602 2,372 2,008 1,126 463 150 41 9.7 2.1 0.4 0.1 8,328
6.5 0 0 0.2 12.6 167 690 1,257 1,268 825 386 140 42.2 10.9 2.5 0.5 0.1 4,806
7.5 0 0 0 3 52.1 270 594 703 524 276 111 36.7 10.2 2.5 0.6 0.1 2,586
8.5 0 0 0 0.7 15.4 97.9 255 350 296 174 77.6 27.7 8.4 2.2 0.5 0.1 1,309
9.5 0 0 0 0.2 4.3 33.2 101 159 152 99.2 48.3 18.7 6.1 1.7 0.4 0.1 626
10.5 0 0 0 0 1.2 10.7 37. 9 67.5 71.7 51.5 27.3 11.4 4 1.2 0.3 0.1 285
11.5 0 0 0 0 0.3 3.3 13.3 26.6 31.4 24.7 14.2 6.4 2.4 0.7 0.2 0.1 124
12.5 0 0 0 0 0.1 1 4.4 9.9 12.8 11 6.8 3.3 1.3 0.4 0.1 0 51
13.5 0 0 0 0 0 0.3 1.4 3.5 5 4.6 3.1 1.6 0.7 0.2 0.1 0 21
14.5 0 0 0 0 0 0.1 0.4 1.2 1.8 1.8 1.3 0.7 0.3 0.1 0 0 8
15.5 0 0 0 0 0 0 0.1 0.4 0.6 0.7 0.5 0.3 0.1 0.1 0 0 3
16.5 0 0 0 0 0 0 0 0.1 0.2 0.2 0.2 0.1 0.1 0 0 0 1
Sum 1 165 2,091 9,280 1,992 2,487 2,087 1,289 6,245 2,479 837 247 66 16 3 1 100,000

Page 9 of 17
Askarian Khoob & Ketabdari, Cogent Engineering (2017), 4: 1387951https://doi.org/10.1080/23311916.2017.1387951
from ITTC in design speed, are represented in Figures 4 and 5. In order to investigate the wave loads, two common transverse sections including a midship section for studying the vertical bending mo-ment and the 0.25L section after a midship for studying the vertical shear force were selected. The results are provided in a non- dimensional way based on the wave amplitude (A), wave number (k), encounter frequency (ω), water density (ρ), gravitational acceleration (g), ship beam (B), and ship length between perpendiculars (Lpp) as is represented in Table 3. Comparisons showed that this method had a satisfactory accuracy in predicting wave-induced loads and the motion of ship.
Figure 4. RAOs of motion and wave load of S-175 container ship.
(a) Heave motion in beam seas (b) Vertical bending moments in head seas
0.000
0.200
0.400
0.600
0.800
1.000
1.200
1.400
1.600
0 2 4 6 8 10
Hea
ve/A
√( / )
Maestro
Experiment
-0.005
0.000
0.005
0.010
0.015
0.020
0.025
0 2 4 6 8 10
2
√( /
/
)
Maestro
experiment
Figure 3. Finite element model of S-175 container ship.
(a) 3D model (b) Body plan
Table 3. Main particulars of the S-175 container shipItem ValueLength between perpendiculars (m) 175
Beam (m) 25.4
Depth (m) 15.4
Draft (m) 9.5
LCG aft of midship (m) 2.5
XG(from AP) (m) 84.97
Vertical center of gravity(m) 9.55
YG(from centerline) (m) 0
Block coefficient 0.572
Midship section coefficient 0.98
Displacement (ton) 24,742
Design speed (Knot) 22.145

Page 10 of 17
Askarian Khoob & Ketabdari, Cogent Engineering (2017), 4: 1387951https://doi.org/10.1080/23311916.2017.1387951
6. Results and discussionIn this article, two kinds of side hull forms (symmetric and asymmetric types) were utilized to predict the long-term extreme wave loads on cross deck of the trimaran. Both hull forms had the same hy-drostatic properties and wetted surface area, despite their different cross sections. This was per-formed for different speeds and wave angles. The speeds were 0, 10, 20 and 30 knots.
The wave headings were chosen as beam seas (90°), bow quartering seas (135°), and head seas (180°), that are usually of greatest concern in the sea-keeping design. The probabilities of each speed and wave heading were assumed to be equal. To study the cross deck wave loads, the section which connects the cross structure and the main hull was selected, which is usually the weakest part of the vessel. The representations of the wave-induced forces and moments acting on cross deck are shown in Figure 6. Transverse bending moments MX, transverse shear forces QY and transverse tor-sional moments MTY are very important for cross structure analysis.
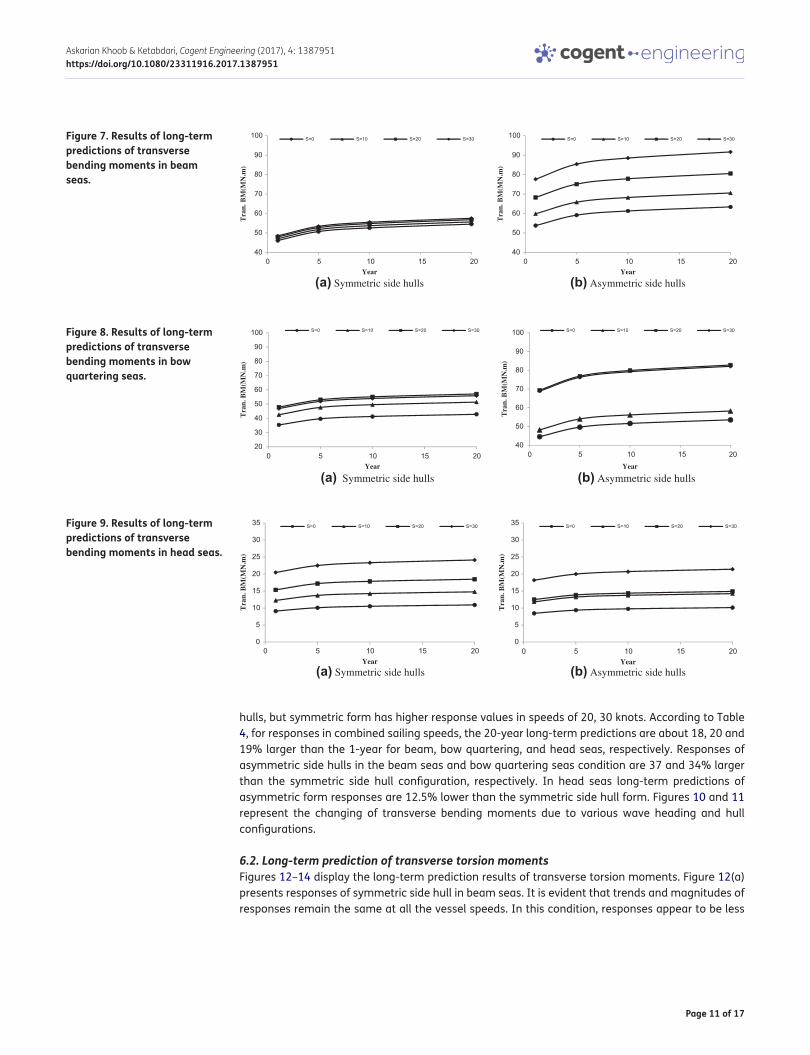
6.1. Long-term prediction of transverse bending momentsThe long-term statistics of transverse bending moments under different return periods are shown in Figures 7–9. According to IACS Wave Scatter Diagram for the North Atlantic Ocean wave data, plots are similar with respect to physical trends. Figure 7(a) presents responses in beam seas for symmet-ric side hull configuration. It is evident that trends and magnitudes of responses remain constant in all the vessel speeds and during their respective return periods. These changes in the vessel speeds do not affect the responses in this heading. As shown in Figure 7(b), in the beam sea conditions, changes in the vessel speeds affect the responses for asymmetric form of side hulls. The asymmetric form has higher response magnitudes in this heading.
In the bow quartering sea condition as shown in Figure 8(a) and (b), transverse bending moments are approximately the same for speeds of 20 and 30 knots but there are different values for different side hull configurations. Figure 9(a) and (b) present responses in head seas. It can be seen that the responses remain the same for vessel speeds of 0 and 10 knots for symmetric and asymmetric side
Figure 6. The trimaran ship concept and representation of the wave-induced loads acting on cross deck.
(a) Cross structure (b) The main components of trimaran
Y
Z X
Cross Deck
Side Hull
Figure 5. RAOs of wave load of S-175 container ship in bow quartering seas (β = 150).
(a) Vertical shear forces (b) Longitudinal torsion moments
00.0050.01
0.0150.02
0.0250.03
0.0350.04
0.0450.05
0 2 4 6 8 10
SFL
√( / )
Maestro
Experiment
0.0000
0.0001
0.0002
0.0003
0.0004
0.0005
0.0006
0 1 2 3 4 5
2L
TM
√( /
/
/
)
MaestroExperiment
Page 11 of 17
Askarian Khoob & Ketabdari, Cogent Engineering (2017), 4: 1387951https://doi.org/10.1080/23311916.2017.1387951
hulls, but symmetric form has higher response values in speeds of 20, 30 knots. According to Table 4, for responses in combined sailing speeds, the 20-year long-term predictions are about 18, 20 and 19% larger than the 1-year for beam, bow quartering, and head seas, respectively. Responses of asymmetric side hulls in the beam seas and bow quartering seas condition are 37 and 34% larger than the symmetric side hull configuration, respectively. In head seas long-term predictions of asymmetric form responses are 12.5% lower than the symmetric side hull form. Figures 10 and 11 represent the changing of transverse bending moments due to various wave heading and hull configurations.
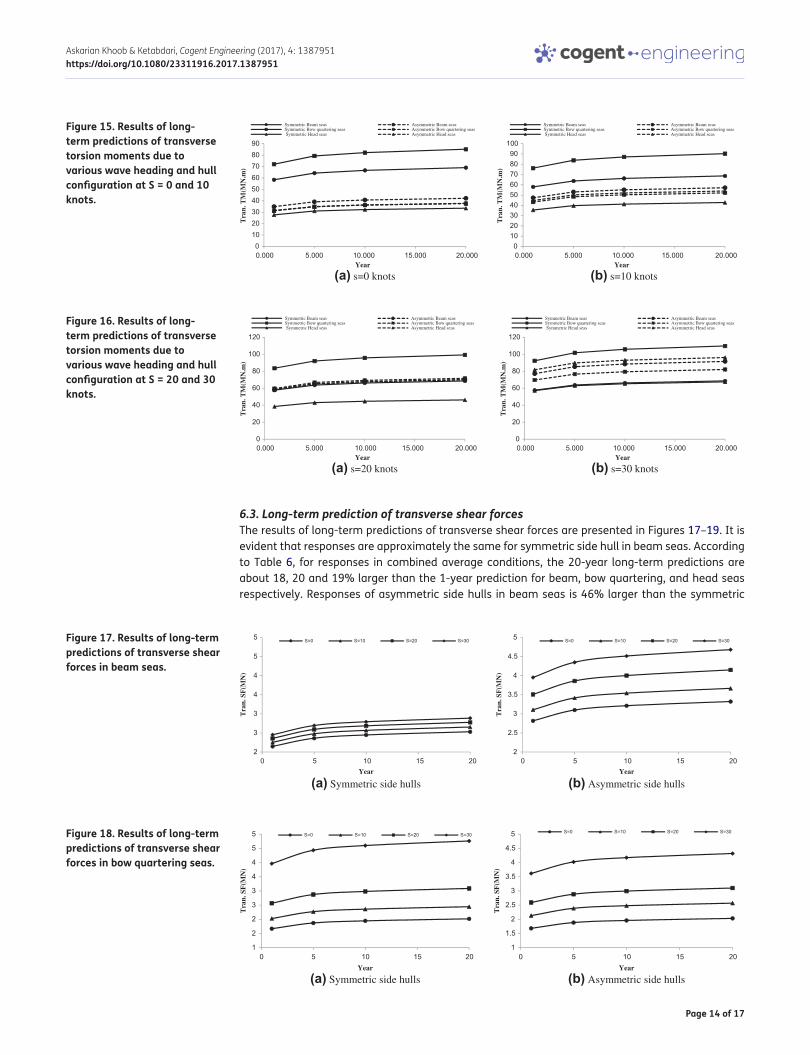
6.2. Long-term prediction of transverse torsion momentsFigures 12–14 display the long-term prediction results of transverse torsion moments. Figure 12(a) presents responses of symmetric side hull in beam seas. It is evident that trends and magnitudes of responses remain the same at all the vessel speeds. In this condition, responses appear to be less
Figure 7. Results of long-term predictions of transverse bending moments in beam seas.
(a) Symmetric side hulls (b) Asymmetric side hulls
40
50
60
70
80
90
100
0 5 10 15 20
Tra
n. B
M(M
N.m
)
Year
S=0 S=10 S=20 S=30
40
50
60
70
80
90
100
0 5 10 15 20
Tra
n. B
M(M
N.m
)
Year
S=0 S=10 S=20 S=30
Figure 8. Results of long-term predictions of transverse bending moments in bow quartering seas.
(a) Symmetric side hulls (b) Asymmetric side hulls
20
30
40
50
60
70
80
90
100
0 5 10 15 20
Tra
n. B
M(M
N.m
)
Year
S=0 S=10 S=20 S=30
40
50
60
70
80
90
100
0 5 10 15 20
Tra
n. B
M(M
N.m
)
Year
S=0 S=10 S=20 S=30
Figure 9. Results of long-term predictions of transverse bending moments in head seas.
(a) Symmetric side hulls (b) Asymmetric side hulls
0
5
10
15
20
25
30
35
0 5 10 15 20
Tra
n. B
M(M
N.m
)
Year
S=0 S=10 S=20 S=30
0
5
10
15
20
25
30
35
0 5 10 15 20
Tra
n. B
M(M
N.m
)
Year
S=0 S=10 S=20 S=30

Page 12 of 17
Askarian Khoob & Ketabdari, Cogent Engineering (2017), 4: 1387951https://doi.org/10.1080/23311916.2017.1387951
Table 4. Results of long-term predictions of transverse bending moments (MN.m)Speed (knot)
Bea seas Bow quartering seas Head seas1-Year 20-Year 1-Year 20-Year 1-Year 20-Year
Sym Asym Sym Asym Sym Asym Sym Asym Sym Asym Sym Asym0 46.12 53.79 54.52 63.39 35.40 44.58 42.83 53.55 9.11 8.45 10.92 10.13
10 47.04 59.85 55.69 70.55 42.53 48.20 51.39 58.25 12.24 11.82 14.76 14.22
20 47.93 68.28 56.809 80.55 47.90 69.40 57.11 82.81 15.35 12.50 18.48 14.88
30 48.49 77.62 57.529 91.67 46.89 68.87 55.88 82.13 20.46 18.18 24.12 21.41
Combined 47.39 64.88 56.137 76.54 43.18 57.76 51.802 69.18 14.29 12.73 17.07 15.16
Figure 10. Results of long-term predictions of transverse bending moments due to various wave heading and hull configuration at S = 0 and 10 knots.
(a) s=0 knots (b) s=10 knots
0
10
20
30
40
50
60
70
0.000 5.000 10.000 15.000 20.000
Ver
t. B
M(M
N.m
)
Year
Symmetric Beam seas Asymmetric Beam seasSymmetric Bow quartering seas Asymmetric Bow quartering seas Symmetric Head seas Asymmetric Head seas
0
10
20
30
40
50
60
70
80
0.000 5.000 10.000 15.000 20.000
Ver
t. B
M(M
N.m
)
Year
Symmetric Beam seas Asymmetric Beam seasSymmetric Bow quartering seas Asymmetric Bow quartering seas Symmetric Head seas Asymmetric Head seas
Figure 11. Results of long-term predictions of transverse bending moments due to various wave heading and hull configuration at S = 20 and 30 knots.
(a) s=20 knots (b) s=30 knots
0102030405060708090
0.000 5.000 10.000 15.000 20.000
Ver
t. B
M(M
N.m
)
Year
Symmetric Beam seas Asymmetric Beam seasSymmetric Bow quartering seas Asymmetric Bow quartering seas Symmetric Head seas Asymmetric Head seas
0102030405060708090
100
0.000 5.000 10.000 15.000 20.000
Ver
t. B
M(M
N.m
)
Year
Symmetric Beam seas Asymmetric Beam seasSymmetric Bow quartering seas Asymmetric Bow quartering seas Symmetric Head seas Asymmetric Head seas
Figure 12. Results of long-term predictions of transverse torsion moments in beam seas.
(a) Symmetric side hulls (b) Asymmetric side hulls
50
60
70
80
90
100
110
120
0 5 10 15 20
Tra
n. T
M(M
N.m
)
Year
S=0 S=10 S=20 S=30
50
60
70
80
90
100
110
120
0 5 10 15 20
Tra
n. T
M(M
N.m
)
Year
S=0 S=10 S=20 S=30

Page 13 of 17
Askarian Khoob & Ketabdari, Cogent Engineering (2017), 4: 1387951https://doi.org/10.1080/23311916.2017.1387951
sensitive to the vessel speeds. According to Table 5, for responses in combined average conditions, the 20-year long-term predictions were about 18, 19.5 and 19% larger than the 1-year prediction for beam seas, bow quartering seas, and head seas respectively. Responses of asymmetric side hulls were 40, 38, and 6% larger than the symmetric side hull configuration for beam seas, bow quarter-ing seas, and head seas respectively. Figures 15 and 16 represent the changing of transverse torsion moments due to various wave heading and hull configurations.
Figure 13. Results of long-term predictions of transverse torsion moments in bow quartering seas.
(a) Symmetric side hulls (b) Asymmetric side hulls
20
30
40
50
60
70
80
90
100
0 5 10 15 20
Tra
n. T
M(M
N.m
)
Year
S=0 S=10 S=20 S=30
20
30
40
50
60
70
80
90
100
0 5 10 15 20
Tra
n. T
M(M
N.m
)
Year
S=0 S=10 S=20 S=30
Figure 14. Results of long-term predictions of transverse torsion moments in head seas.
(a) Symmetric side hulls (b) Asymmetric side hulls
20
30
40
50
60
70
80
90
100
0 5 10 15 20
Tra
n. T
M(M
N.m
)
Year
S=0 S=10 S=20 S=30
20
30
40
50
60
70
80
90
100
0 5 10 15 20
Tra
n. T
M(M
N.m
)
Year
S=0 S=10 S=20 S=30
Table 5. Results of long-term predictions of transverse torsion moments (MN.m)Speed (knot)
Bea seas Bow quartering seas Head seas1-Year 20-Year 1-Year 20-Year 1-Year 20-Year
Sym Asym Sym Asym Sym Asym Sym Asym Sym Asym Sym Asym0 58.42 72.06 69.07 85.19 27.67 34.90 33.46 42.18 31.50 31.33 37.76 37.62
10 57.96 76.24 68.66 90.35 35.47 47.39 42.72 57.17 43.22 44.77 52.14 54.00
20 57.75 83.61 68.58 99.28 38.48 58.89 46.21 70.12 59.66 58.16 71.72 69.94
30 57.70 92.32 68.69 109.77 57.26 77.20 67.54 91.67 69.73 81.75 82.15 96.22
Combined 57.95 81.05 68.75 96.147 39.72 54.595 47.482 65.28 51.02 54.00 60.942 64.445
Page 14 of 17
Askarian Khoob & Ketabdari, Cogent Engineering (2017), 4: 1387951https://doi.org/10.1080/23311916.2017.1387951
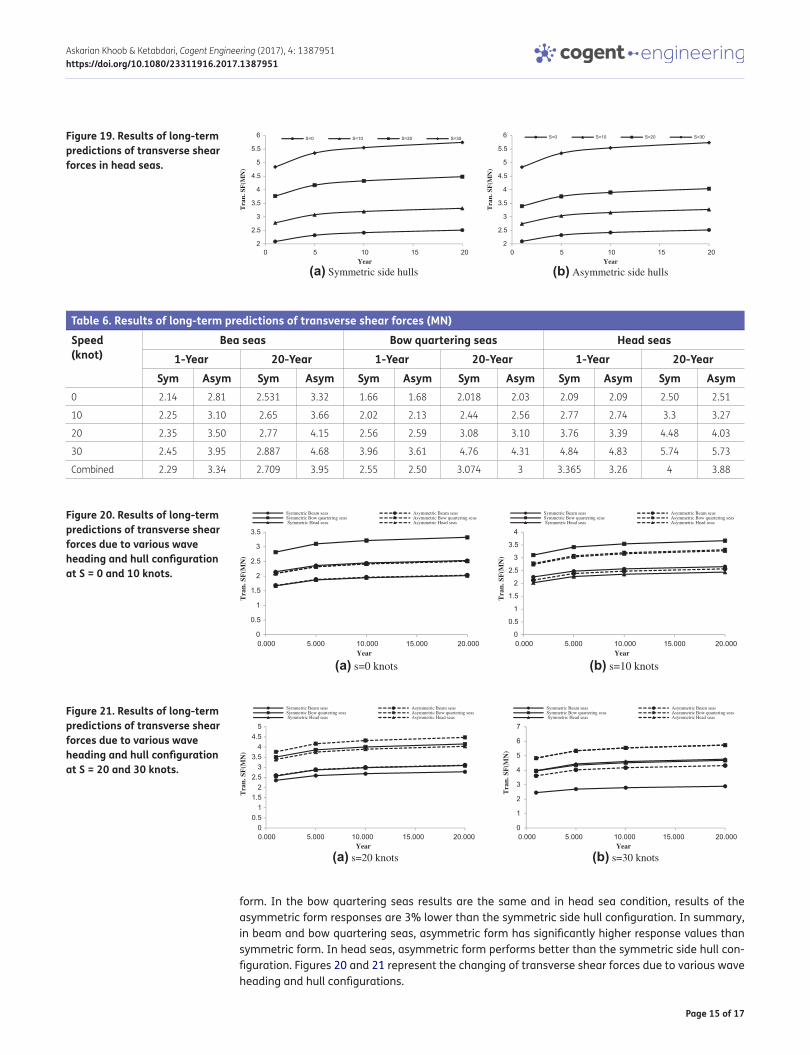
6.3. Long-term prediction of transverse shear forcesThe results of long-term predictions of transverse shear forces are presented in Figures 17–19. It is evident that responses are approximately the same for symmetric side hull in beam seas. According to Table 6, for responses in combined average conditions, the 20-year long-term predictions are about 18, 20 and 19% larger than the 1-year prediction for beam, bow quartering, and head seas respectively. Responses of asymmetric side hulls in beam seas is 46% larger than the symmetric
Figure 15. Results of long-term predictions of transverse torsion moments due to various wave heading and hull configuration at S = 0 and 10 knots.
(a) s=0 knots (b) s=10 knots
0102030405060708090
0.000 5.000 10.000 15.000 20.000
Tra
n. T
M(M
N.m
)
Year
Symmetric Beam seas Asymmetric Beam seasSymmetric Bow quartering seas Asymmetric Bow quartering seas Symmetric Head seas Asymmetric Head seas
0102030405060708090
100
0.000 5.000 10.000 15.000 20.000
Tra
n. T
M(M
N.m
)
Year
Symmetric Beam seas Asymmetric Beam seasSymmetric Bow quartering seas Asymmetric Bow quartering seas Symmetric Head seas Asymmetric Head seas
Figure 16. Results of long-term predictions of transverse torsion moments due to various wave heading and hull configuration at S = 20 and 30 knots.
(a) s=20 knots (b) s=30 knots
0
20
40
60
80
100
120
0.000 5.000 10.000 15.000 20.000
Tra
n. T
M(M
N.m
)
Year
Symmetric Beam seas Asymmetric Beam seasSymmetric Bow quartering seas Asymmetric Bow quartering seas Symmetric Head seas Asymmetric Head seas
0
20
40
60
80
100
120
0.000 5.000 10.000 15.000 20.000
Tra
n. T
M(M
N.m
)
Year
Symmetric Beam seas Asymmetric Beam seasSymmetric Bow quartering seas Asymmetric Bow quartering seas Symmetric Head seas Asymmetric Head seas
Figure 17. Results of long-term predictions of transverse shear forces in beam seas.
(a) Symmetric side hulls (b) Asymmetric side hulls
2
3
3
4
4
5
5
0 5 10 15 20
Tra
n. S
F(M
N)
Year
S=0 S=10 S=20 S=30
2
2.5
3
3.5
4
4.5
5
0 5 10 15 20
Tra
n. S
F(M
N)
Year
S=0 S=10 S=20 S=30
Figure 18. Results of long-term predictions of transverse shear forces in bow quartering seas.
(a) Symmetric side hulls (b) Asymmetric side hulls
1
2
2
3
3
4
4
5
5
0 5 10 15 20
Tra
n. S
F(M
N)
Year
S=0 S=10 S=20 S=30
1
1.5
2
2.5
3
3.5
4
4.5
5
0 5 10 15 20
Tra
n. S
F(M
N)
Year
S=0 S=10 S=20 S=30
Page 15 of 17
Askarian Khoob & Ketabdari, Cogent Engineering (2017), 4: 1387951https://doi.org/10.1080/23311916.2017.1387951
form. In the bow quartering seas results are the same and in head sea condition, results of the asymmetric form responses are 3% lower than the symmetric side hull configuration. In summary, in beam and bow quartering seas, asymmetric form has significantly higher response values than symmetric form. In head seas, asymmetric form performs better than the symmetric side hull con-figuration. Figures 20 and 21 represent the changing of transverse shear forces due to various wave heading and hull configurations.
Figure 19. Results of long-term predictions of transverse shear forces in head seas.
(a) Symmetric side hulls (b) Asymmetric side hulls
2
2.5
3
3.5
4
4.5
5
5.5
6
0 5 10 15 20T
ran.
SF
(MN
)
Year
S=0 S=10 S=20 S=30
2
2.5
3
3.5
4
4.5
5
5.5
6
0 5 10 15 20
Tra
n. S
F(M
N)
Year
S=0 S=10 S=20 S=30
Table 6. Results of long-term predictions of transverse shear forces (MN)Speed (knot)
Bea seas Bow quartering seas Head seas1-Year 20-Year 1-Year 20-Year 1-Year 20-Year
Sym Asym Sym Asym Sym Asym Sym Asym Sym Asym Sym Asym0 2.14 2.81 2.531 3.32 1.66 1.68 2.018 2.03 2.09 2.09 2.50 2.51
10 2.25 3.10 2.65 3.66 2.02 2.13 2.44 2.56 2.77 2.74 3.3 3.27
20 2.35 3.50 2.77 4.15 2.56 2.59 3.08 3.10 3.76 3.39 4.48 4.03
30 2.45 3.95 2.887 4.68 3.96 3.61 4.76 4.31 4.84 4.83 5.74 5.73
Combined 2.29 3.34 2.709 3.95 2.55 2.50 3.074 3 3.365 3.26 4 3.88
Figure 20. Results of long-term predictions of transverse shear forces due to various wave heading and hull configuration at S = 0 and 10 knots.
(a) s=0 knots (b) s=10 knots
0
0.5
1
1.5
2
2.5
3
3.5
0.000 5.000 10.000 15.000 20.000
Tra
n. S
F(M
N)
Year
Symmetric Beam seas Asymmetric Beam seasSymmetric Bow quartering seas Asymmetric Bow quartering seas Symmetric Head seas Asymmetric Head seas
0
0.5
1
1.5
2
2.5
3
3.5
4
0.000 5.000 10.000 15.000 20.000
Tra
n. S
F(M
N)
Year
Symmetric Beam seas Asymmetric Beam seasSymmetric Bow quartering seas Asymmetric Bow quartering seas Symmetric Head seas Asymmetric Head seas
Figure 21. Results of long-term predictions of transverse shear forces due to various wave heading and hull configuration at S = 20 and 30 knots.
(a) s=20 knots (b) s=30 knots
00.5
11.5
22.5
33.5
44.5
5
0.000 5.000 10.000 15.000 20.000
Tra
n. S
F(M
N)
Year
Symmetric Beam seas Asymmetric Beam seasSymmetric Bow quartering seas Asymmetric Bow quartering seas Symmetric Head seas Asymmetric Head seas
0
1
2
3
4
5
6
7
0.000 5.000 10.000 15.000 20.000
Tra
n. S
F(M
N)
Year
Symmetric Beam seas Asymmetric Beam seasSymmetric Bow quartering seas Asymmetric Bow quartering seas Symmetric Head seas Asymmetric Head seas

Page 16 of 17
Askarian Khoob & Ketabdari, Cogent Engineering (2017), 4: 1387951https://doi.org/10.1080/23311916.2017.1387951
7. ConclusionsIn this study, the long-term prediction of wave-induced loads affecting a trimaran ship was made using a linear sea-keeping analysis code called MAESTRO Wave. Based on the results of the study, the following conclusions can be drawn:
• Trimaran is an uncommon ship about which there are not sufficient experiments. Thus, using direct calculations seem more feasible to predict the effects of wave-induced long-term ex-treme loads on it.
• Since short-term analysis refers to a specific sea state, prediction of wave-induced loads is not sufficient for a reliable analysis. Therefore, the long-term prediction of extreme values under exceeding probability is more valuable.
• The 20-year, long-term predictions are about 20% larger than the 1-year predictions for re-sponses in combined sailing speeds.
• The highest response values of wave loads emerge in beam sea condition. It was also evident from the results that changes in the speed of the vessel do not affect the responses of the sym-metric side hull configuration in head seas.
• In the beam and bow quartering seas, asymmetric form has significantly higher response values than symmetric form and in head seas, asymmetric form performs better than the symmetric side hull configuration.
FundingThe authors received no direct funding for this research.
Author detailsAbolfath Askarian Khoob1
E-mail: [email protected] Javad Ketabdari1
E-mail: [email protected] Department of Marine Technology, Amirkabir University of
Technology, Tehran, Iran.
Citation informationCite this article as: A numerical investigation into the effects of long-term wave-induced loads on the cross structure of a wave-piercing trimaran, Abolfath Askarian Khoob & Mohammad Javad Ketabdari, Cogent Engineering (2017), 4: 1387951.
ReferencesAkbari Vakilabadi, K., Khatami, M. R., & Seif, M. S. (2014).
Experimental study on heave and pitch motion characteristics of a wave-piercing trimaran. Journal of Transactions of FAMENA, 38, 13–26.
Bashir, M. B., Tao, L., Atlar, M., & Dow, R. S. (2013). Experimental and numerical investigation of the wave-induced loads on a Deep-V catamaran in regular waves. International Conference on Ocean, Offshore and Arctic Engineering, Nantes.
Dai, Y. S., Sheen, J. W., & Song, J. Z. (2007). Ship wave loads. Beijing: National Defense Industry Press.
Dobashi, J. (2014). Wave loads acting on cross deck of trimaran in oblique waves. Journal of Naval Architects and Ocean Engineers, 20, 69–75.
Fang, M. C., & Chen, T. Y. (2008). A parametric study of wave loads on trimaran ships traveling in waves. Ocean Engineering, 35, 749–762. https://doi.org/10.1016/j.oceaneng.2008.02.001
Guedes Soares, C., Fonseca, N., & Pascoal, R. (2004). Long term prediction of non-linear vertical bending moments on a fast monohull. Applied Ocean Research, 26, 288–297. https://doi.org/10.1016/j.apor.2005.08.002
Guedes Soares, C., & Schellin, T. E. (1996). Long term distribution of non-linear wave induced vertical bending
moments on a containership. Marine Structures, 9, 333–352. https://doi.org/10.1016/0951-8339(95)00028-3
Hagen, N., Dacha, N. M. C., & Olliver, G. F. (1986). Global wave statistics. Feltham: British Maritime Technology.
Hirdaris, S. E., & Temarel, P. (2009). Hydroelasticity of Ships - recent advances and future trends. Proceedings of the IMechE, Part M: Journal of Engineering for the Maritime Environment, 223(3), 305–330.
Hirdaris, S. E., Bai, W., Dessi, D., Ergin, A., Gu, X., Hermundstad, O. A., … Incecik, A. (2014). Loads for use in the design of ships and offshore structures. Ocean Engineering, 78, 131–174. https://doi.org/10.1016/j.oceaneng.2013.09.012
IACS Recommendation. (2000, June). IACS recommendation no.34, standard wave data, Rev. 1.
Jiao, J., Sun, S., & Ren, H. (2016). Predictions of wave induced ship motions and load by large scaled of model measurement at sea and numerical analysis. Journal of Brodogradnja/Shipbuilding, 67(2), 81–100.
Ma, M., Zhao, C., & Hughes, O. (2014). A practical method to apply hull girder sectional loads to full-ship 3D finite-element models using quadratic programming. Ships and Offshore Structures, 9, 257–265. https://doi.org/10.1080/17445302.2013.770725
MAESTRO. (2012). MAESTRO: Version 10.0 users’ manual. Stevensville, MD: Advanced Marine Technology Centre. Retrieved from http://www.MAESTROmarine.com
Min, X., & Shi-Lian, Z. (2011). A numerical study on side hull optimization for trimaran. Journal of Hydrodynamics, 23, 265–272.
Mohammadi, M., Khedmati, M. R., & Akbari Vakilabadi, K. (2014). Effects of hull damage on global loads acting on a trimaran ship. Journal of Ships and Offshore Structures, 10, 635–652.
Parunov, J., Senjanović, I., & Pavićević, M. (2004). Use Of vertical wave bending moments from hydrodynamic analysis in design of oil tankers. Journal of RINA Transactions, 146, 247–260.
Pei, Z., Zhu, Z., & Wu, W. (2015). Research of load and structural direct calculation on flat-type river-sea-going ship. Journal of Traffic and Transportation Engineering, 3, 266–276.
Schellin, T. E., & de Lucas, A. P. (2004). Longitudinal strength of a high-speed ferry. Applied Ocean Research, 26(6), 298–308. https://doi.org/10.1016/j.apor.2005.08.004

Page 17 of 17
Askarian Khoob & Ketabdari, Cogent Engineering (2017), 4: 1387951https://doi.org/10.1080/23311916.2017.1387951
© 2017 The Author(s). This open access article is distributed under a Creative Commons Attribution (CC-BY) 4.0 license.You are free to: Share — copy and redistribute the material in any medium or format Adapt — remix, transform, and build upon the material for any purpose, even commercially.The licensor cannot revoke these freedoms as long as you follow the license terms.
Under the following terms:Attribution — You must give appropriate credit, provide a link to the license, and indicate if changes were made. You may do so in any reasonable manner, but not in any way that suggests the licensor endorses you or your use. No additional restrictions You may not apply legal terms or technological measures that legally restrict others from doing anything the license permits.
Cogent Engineering (ISSN: 2331-1916) is published by Cogent OA, part of Taylor & Francis Group. Publishing with Cogent OA ensures:• Immediate, universal access to your article on publication• High visibility and discoverability via the Cogent OA website as well as Taylor & Francis Online• Download and citation statistics for your article• Rapid online publication• Input from, and dialog with, expert editors and editorial boards• Retention of full copyright of your article• Guaranteed legacy preservation of your article• Discounts and waivers for authors in developing regionsSubmit your manuscript to a Cogent OA journal at www.CogentOA.com