Embed Size (px)
Citation preview

UNLV Retrospective Theses & Dissertations
1-1-2008
A novel RGBW pixel for LED displays A novel RGBW pixel for LED displays
Neveen Shlayan University of Nevada, Las Vegas
Follow this and additional works at: https://digitalscholarship.unlv.edu/rtds
Repository Citation Repository Citation Shlayan, Neveen, "A novel RGBW pixel for LED displays" (2008). UNLV Retrospective Theses & Dissertations. 2431. http://dx.doi.org/10.25669/hs8n-296m
This Thesis is protected by copyright and/or related rights. It has been brought to you by Digital Scholarship@UNLV with permission from the rights-holder(s). You are free to use this Thesis in any way that is permitted by the copyright and related rights legislation that applies to your use. For other uses you need to obtain permission from the rights-holder(s) directly, unless additional rights are indicated by a Creative Commons license in the record and/or on the work itself. This Thesis has been accepted for inclusion in UNLV Retrospective Theses & Dissertations by an authorized administrator of Digital Scholarship@UNLV. For more information, please contact [email protected].

A NOVEL RGBW PIXEL FOR
LED DISPLAYS
by
Neveen Shlayan
Bachelor o f Science University o f Nevada, Las Vegas
2006
A thesis submitted in partial fulfillment o f the requirements for the
Master of Science Degree in Electrical and Computer Engineering Department of Electrical and Computer Engineering
Howard R. Hughes College of Engineering
Graduate College University of Nevada, Las Vegas
December 2008

UMI Number: 1463534
Copyright 2009 by Shlayan, Neveen
All rights reserved.
INFORMATION TO USERS
The quality of this reproduction is dependent upon the quality of the copy submitted. Broken or indistinct print, colored or poor quality illustrations and photographs, print bleed-through, substandard margins, and improper alignment can adversely affect reproduction.
In the unlikely event that the author did not send a complete manuscript and there are missing pages, these will be noted. Also, if unauthorized copyright material had to be removed, a note will indicate the deletion.
UMIUMI Microform 1463534
Copyright 2009 by ProQuest LLC.
All rights reserved. This microform edition is protected against
unauthorized copying under Title 17, United States Code.
ProQuest LLC 789 E. Eisenhower Parkway
PC Box 1346 Ann Arbor, Ml 48106-1346

Copyright by Neveen Shlayan 2009 All Rights Reserved

Thesis ApprovalThe Graduate College University of Nevada, Las Vegas
November 10 .20 08
The Thesis prepared by
Neveen Shlayan
Entitled
A Novel RGBW Pixel for LED Displays
is approved in partial fulfillment of the requirements for the degree of
Master of Science in Electrical Engineering
Examination Contfnittee Chair>nj^^pmmi
Dean of the Graduate College
amination Committee Member
Exammdtion Committee Member
Graduate College Faculty Representative
11

ABSTRACT
A Novel RGBW Pixel for LED Displays
by
Neveen Shlayan
Dr. Rama Venkat, Examination Committee Chair Professor o f Electrical Engineering University o f Nevada, Las Vegas
In this work, a novel pixel configuration RGBW, consisting o f red (R), green (G),
blue (B), and white (W) LEDs, is employed and investigated for color generation. Energy
consumption and various hues o f new pixels are compared to standard pixels consisting
o f RGB LEDs. Human perception experiments are conducted in order to study the
perceptual difference between the two architectures when the same colors are generated
using RGBW vs. RGB. Power measurements for an 8x8 pixel LED display has
demonstrated up to 49% power savings for gray scale, over 30% power savings for low
saturated colors, and up to 12% for high saturated colors using RGBW as an alternative.
Furthermore, human perception studies has shown that vast majority o f test subjects
could not distinguish between most colors displayed using RGB and RGBW showing that
RGBW is an excellent substitute for RGB. Statistics has shown that 44% o f test subjects
found the colors in gray scale to he the same, whereas 82% and 95% o f test subject found
low saturated colors and high saturated colors, respectively, to he identical.
Ill

TABLE OF CONTENTS
A B ST R A C T ........................................................................................................................................iii
LIST OF FIGU RES............................................................................................................................vi
LIST OF T A B L E S .......................................................................................................................... viii
ACKNOW LEDGM ENTS............................. ix
CHAPTER 1 INTRODUCTION......................................................................................................1
CHAPTER 2 DIFFERENT DISPLAY TECH N O LO G IES..................................................... 52.1 Liquid Crystal Display (LC D ).............................................................................................5
2.1.1 Recent Trends in LCD T echnology........................................................................ 92.2 Plasma D isp lay ..................................................................................................................... 10
2.2.1 Current Trends in Plasma Technology..................................................................142.3 LED D isp lays........................................................................................................................15
2.3.1 Recent Developments in LED D isplays............................................................... 18
CHAPTER 3 UNDERSTANDING COLORS...........................................................................203.1 Definitions o f Basic Colorimetric Concepts...................................................................203.2 The Eye and Perception.......................................................... 22
3.2.1 Photoptic and Scotopic V ision................................................................................253.3 The Nature o f C o lo r............................................................................................................ 273.4 Color in the Brain....................................................................................................... 28
3.4.1 Reproduction o f C o lo rs ............................................................................................283.4.2 Luminous F lu x ........................................................................................................... 293.4.3 Matching F unction .................................................................................................... 29
3.5 Color Spaces..........................................................................................................................323.5.1 HVS Color Spaces..................................................................................................... 323.5.2 Application Specific Color Spaces.........................................................................353.5.3 The CIE Color Spaces.............................................................................................. 36
CHAPTER 4 THEORETICAL AND PRACTICAL MODELING OF RGBW PIXELBASED LED DISPLAY.......................................................................................44
4.1 Introduction o f the new pixel with a white L E D .......................................................... 444.2 Issues with R G B ........................................................ 454.3 Theoretical Analysis o f the New RGBW P ixel.............................................................464.4 The RGBW LED Display Prototype and D river.......................................................... 49
4.4.1 Hardware....................................................................................................................49
IV

4.4.2 The LED driver..........................................................................................................504.4.3 The Display D river.................................................................................................... 544.4.4 Softw are....................................................................................................................... 54
CHAPTER 5 EXPERIMENTS, RESULTS, AND DISCUSSION.......................................705.1 Spectroscopic M easurem ents..........................................................................................705.2Human Perception Experim ents........................................................................................ 76
5.2.1 Experimental P rocedure.......................................................................................... 765.2.2 Results and D iscussion.............................................................................................785.2.3 Statistical A nalysis.................................................................................................... 81
5.2.3.1 Theory o f Statistical A nalysis...................................................................... 815.2.3.2 Data A nalysis...................................................................................................82
5.3 Energy M easurements and C alculations.........................................................................865.3.1 Experimental P rocedure...........................................................................................865.3.2 Results and D iscussion.............................................................................................865.3.3 Data A nalysis..............................................................................................................87
5.4 Colors from D isplay............................................................................................................ 88
CHAPTER 6 CONCLUSIONS AND RECOM M END ATIO NS......................................... 92
APPENDIX 1 AHDL CODE OF THE SOFTWARE IM PLIM ENTATIO N...................94
APPENDIX 11 BIOMEDICAL IRB EXPEDITED REVIEW APPROVAL NOTICE.. 105
APPENDIX 111 INFORMED C O N SE N T ........................................ 106
APPENDIX IV HUMAN EXPERIMENT QUESTIONNAIRE.........................................108
BIBLIO G RAPH Y ........................................................................................................................... I l l
V ITA........................................................................................... 114

LIST OF FIGURES
Figure 2.1 A schematic diagram showing a liquid crystal cell in the (a) off state(b) on state.................................................................................................................. 6
Figure 2.2 A schematic diagram showing simple TFT Active M atrix Array..................8Figure 2.3 A schematic diagram showing a composition o f plasma display p an e l.... 11Figure 2.4 A schematic diagram showing the structure of the three-electrode
AC plasma d isp lay .................................................................................................12Figure 2.5 A schematic showing a PDF driving system .................................................... 13Figure 2.6 A schematic picture showing (a) 4x4 LED display matrix (b) LED
pixel m odules.......................................................................................................... 16Figure 3.1 A schematic diagram showing different parts o f the e y e .............................. 23Figure 3.2 A schematic diagram showing rods and co n es ................................................ 24Figure 3.3 A schematic diagram showing the different response curves for cones
and rods......................... 25Figure 3.4 A schematic diagram o f the spectral luminous efficacy for human
v is io n ........................................................................................................................ 26Figure 3.5 Color- matching functions, , g ^ i n the primary system R, G, B ....... 31Figure 3.6 A schematic diagram representing the phenomenal color space .................34Figure 3.7 A schematic diagram showing the three-dimensional RGB vector space
and the (r g) chromaticity d iagram .....................................................................37Figure 3.8 The CIE 1931 color space (x y)chromaticity d iag ram ..................................39Figure 3.9 The CIE 1976 color space (u v ) chromaticity diagram ............................... 41Figure 3.10 The CIELAB chromaticity diagram {a* b*) plane..........................................42Figure 4.1 RGBW chart. Y axis represents 255 different possible levels o f digital
color intensities that correspond to an eight bit data bus for each color ...47 Figure 4.2 A schematic diagram showing the square pixel configuration with
RGB and W LEDs used for this research and the prototypefrom TecnoVision...................................................................................................50
Figure 4.3 A schematic diagram showing the 8-bit constant current LED sink driver(STP08CDC596).................................................................................................... 51
Figure 4.4 A timing diagram showing the pin’s statuses o f the LED driver c h ip ....... 52Figure 4.5 A schematic diagram showing the circuit layout o f the prototype...............53Figure 4.6 A timing diagram showing the (a) horizontal timing (b) vertical timing ..55Figure 4.7 A diagram showing the order o f the white and the red o f the pixels o f the
first two rows of the display without reordering............................................. 56Figure 4.8 A block diagram where S (0-3) allow variety o f solid colors to be
displayed, S(v/g) selects pattern generator or video, and S(w/rgb)turns the RGB to RGBW conversion on or o ff................................................56
Figure 4.9.a A schematic diagram showing the implementation o f the pattern
VI

G enerator................................................................................................................. 58Figure 4.9.b A schematic diagram showing the video input source.................................... 60Figure 4.9.c A schematic diagram showing the interface between the input sources
and the converter.................................................................................................... 61Figure 4.9.d A schematic diagram showing the implementation o f the RGB to
RGBW converter.................................................................................................... 62Figure 4.9.e A schematic diagram showing the implementation o f the control
signals generator..................................................................................................... 63Figure 4.9 .f A schematic diagram showing the implementation o f the pixel
reordering b lo ck ..................................................................................................... 64Figure 4.9.g A schematic diagram showing the implementation o f the RGBW
data processing- stage 1 and 2 ............................................................................. 65Figure 4.9.h A schematic diagram showing the implementation o f the RGBW
data processing- stage 3 ........................................................................................ 66Figure 4.9.i A schematic diagram showing the implementation o f the PWM o f the
RGBW data ............................................................................ 67Figure 4.10 A sample AHDL code showing the settings o f the LE, OE, and data
output lines for bit 0 .............................................................................................. 68Figure 4.11 A graph showing the intensity response of the (a) red (b) green (c) blue
(d) white L F D .........................................................................................................69Figure 5.1 Spectrum o f white, intensity with respect to wave length, using (a)
RGBW and (b) R G B .............................................................................................71Figure 5.2 Spectrum o f Navy Blue using (a) RGBW and (b) R G B ................ 73Figure 5.3 Spectrum o f Light Blue using (a) RGBW and (b) RG B................................ 74Figure 5.4 Spectrum o f Yellow using (a) RGB W and (b) R G B ...................................... 75Figure 5.5 Estimate, p , with 95% confidence interval for White, Gray, & Dark
G ray ...........................................................................................................................82Figure 5.6 Estimate, p , with 95% confidence interval for Purple, Purplish blue,
and M edium G reen................................................................................................ 83Figure 5.7 Estimate, p , with 95% confidence interval for Yellow, Rose, and
vio le t..........................................................................................................................84Figure 5.8 Estimate, p , with 95% confidence interval for Cyan, Green, and
Orange....................................................................................................................... 85Figure 5.9 The % power savings for twelve co lo rs ..............................................................88Figure 5.10 A photograph of gray scale colors from (a) RGB (b) RGBW (i) white (ii)
gray (iii) dark gray.................................................................................................89Figure 5.11 A photograph of low saturated colors from (a) RGB (b) RGBW (i) purple
(ii) purplish blue (iii) medium green ( iv ) .........................................................90Figure 5.12 A photograph o f high saturated colors from (a) RGB (b) RGBW (i) rose
(ii) violate (iii) cyan (iv) green (v) orange......................................................91
vii

LIST OF TABLES
Table 3.1 The colors of the visible light spectrum ............................................................27Table 5.1 Peak intensities in radiant flux units corresponding to R (612nm),
G (547nm) and B(460nm) for RGB and RGBW configurations................ 76Table 5.2 Human Perception data for gray scale (i) White (ii) Gray and (iii)
Dark Gray................................................................................................................. 78Table 5.3 Human Perception data for low saturated colors (i) Purple (ii) Purplish
Blue (iii) M edium Green and (iv) Y ellow ........................................................79Table 5.4 Human Perception data for high saturated colors (i) Rose (ii) Violet
(iii) Cyan (iv) Green and (v) O range............................................................... 80Table 5.5 p , L95, and U95 values after the statistical analysis of the data for
gray sc a le ................................................................................................................. 82Table 5.6 p , L95, and U95 values after the statistical analysis o f the data for
low saturated c o lo rs .............................................................................................. 83Table 5.7 p , L95, and U95 values after the statistical analysis o f the data for
yellow and high saturated colors.........................................................................84Table 5.8 p , L95, and U95 values after the statistical analysis o f the data for
high saturated colors.............................................................................................. 85Table 5.9 Table 5.9 Measured currents for RGB, R G B W ............................................... 86Table 5.10 Power consumed by pixels for RGB, RGBW and % power savings
of RGBW over R G B .............................................................................................87
Vlll

ACKNOWLEDGMENTS
I would like to acknowledge my advisor and committee chair. Dr. Rama Venkat, for
his thesis guidance, the technical and editorial help and for being devoted to his students.
I would also like to thank. Dr. Paolo Ginobbi, for the practical teaching and training o f
concepts and hardware implementation o f the project. In addition, 1 would like to thank
Dr. Ashok Singh for the statistical counseling and help. 1 would like to acknowledge. Dr.
Emma Regentova and Dr. Mohamed Trabia, for being members in my committee. Last
but not least, 1 would like to acknowledge TecnoVision for providing the LED Display
and the Department o f Energy support under grant # RF-06-PRD-001 (7156APP131).
IX

CHAPTER 1
INTRODUCTION
Every year, the display industry introduces many innovations to improve quality and
economy o f displays. The factors, which contribute to the superiority o f various displays,
are: response time, size, weight, viewing angle, brightness, screen life, and power
consumption. The current market places very high expectations in terms o f the quality o f
the display. The limitations o f the liquid crystal display (LCD), size and brightness, and
that o f the Plasma display, image retention and size [1] render them unsuitable for certain
applications such as billboards and entertainment displays [2,3,4]. LED displays, which
are perfect fit for such applications, just like any other technology have some issues, such
as cost, power consumption, and achromatic point (AP) maintenance.
LEDs are semiconductor devices that are capable of fast switching with the addition
o f appropriate electronics [5]. Different types o f LED displays were initially introduced
in the early 70s such as LED array with silicon micro reflector and integrated circuits for
driving LEDs. The reflector is formed on a silicon wafer by anisotropic chemical etching.
LEDs on the unit are arrayed in a matrix structure and the brightness is controlled by the
pulse width o f the current into the LEDs [6]. In the other type o f display, the LED chips
are mounted on the driving circuits that allow holding and controlling o f the selected
LED currents. Integrated circuit drivers are superior in brightness to the silicon micro

reflector displays and therefore are still used for the current LED display technologies.
In the early seventies, when LED displays were first originated, red was the only
color available. By the late seventies, the color variety became wider to include green,
yellow, orange and red [7]. Solid state has witnessed significant advancements to
improve LED ’s brightness by up to 40% per year [7]. Shuji Nakamura o f Nichia
Corporation o f Japan demonstrated the first high-brightness blue LED based on InGaN
which quickly led to the development o f the first white LED, which is basically a blue
LED with a phosphors coating to produce a white light. The mixture o f yellow and blue
lights produces a white light.
Advancements o f LED technology tremendously improved LED display technology.
The fact that obtaining light o f the colors red, green, and blue was feasible, LED displays
went through a revolutionary phase. RGB are monochromatic colors or centered about a
.single wavelength with a small bandwidth. The mixture o f the three lights with the
different possible intensities for each light results in a forth unique color perceptible to
the human eye. The possible range o f colors that can be produced using RGB is called the
color gamut. Thus, LED display technology uses RGB LEDs to form a pixel in order to
produce any color in the gamut. The LEDs in the display are connected to an integrated
driver chip that controls each and every LED individually and hence the pixel.
In LEDs, colors are produced by a recombination process where electrons and holes
are recombined. As a result, the electron falls into a lower energy level and the excess
energy is released in a form o f photons with a certain wavelength which determines the
color to be perceived after the emission. This process is power consuming. There are
many factors that affect the efficiency o f LEDs such as the wavelength o f the emitted

photon and the human visual perception. The human eye, for example, is more sensitive
to green in day vision than red and blue. It is, however, more sensitive to blue in night
vision. Taking these factors into consideration, efficiency of LED displays could be
further improved.
Since LE D ’s 1-V characteristics are not identical due to manufacturing imperfections,
usage, weather conditions, and heat dissipation, it is a challenge to maintain a uniform
color throughout the display throughout its life time. The difference between the colors
becomes more noticeable in gray scale or, in other words, when LEDs are at equal
intensity. This may be noticed as different shades of the color displayed or as spots of
discoloration at random locations on the display.
High cost is one o f the disadvantages in LED displays due to the expensive process
used. Thus, maintenance costs are one o f the major issues o f LED displays. Therefore,
one o f the purposes of this work is to increase the life time of LED displays as much as
possible in order to avoid these maintenance costs.
The three major drawbacks identified in the current RGB LED display technology
are: power consumption, degradation o f display, and cost. In order to address these three
issues, a new pixel architecture including a white LED in the traditional RGB LEDs
configuration is proposed. A 5”x5” board containing RGBW LEDs placed in a square
configuration is used for the investigation.
In chapter 2, a survey o f different types o f display technologies and the current state
o f the art advancements are presented. Theoretical foundation o f this work is presented in
chapter 3. Chapter 4 presents the design o f the front end software and hardware. The
proposed technology is introduced and discussed theoretically as well. Results and

discussions o f human experiment and energy measurements are in chapter 5. Then
conclusions and recommendations are in chapter 6.

CHAPTER 2
DIFFERENT DISPLAY TECHNOLOGIES
In this chapter, different display technologies with state o f the art technological
developments are presented. A detailed survey o f LED technology and recent trends are
also presented.
2.1 Liquid Crystal Display (LCD)
LCDs have come into prominence in the last few years because o f their low power
consumption and picture quality. LCDs are power efficient since they either reflect or
transmit light efficiently [8]. Therefore, LCDs are very suitable for battery-powered
electronics such as: cell phones, ipods, laptops, calculators, and digital watches.
In LCDs, every pixel is composed o f a cell between two glass plates coated with a
conductive material as shown in figure 2.1. The light utilized by the LCD display goes
through a polarizer before going through the cell. The cell is basically filled with liquid
crystal material which is a phase o f matter over a certain temperature range. At the lowest
end o f the range, the material becomes crystalline with a set o f optical and electrical
properties; whereas, at the upper end o f the range, this material becomes clear liquid with
a different set o f electrical and optical properties. However, within this range the material
combines some o f the optical properties o f solids with the fluidity o f liquids [8]. One of

the most important characteristic o f the liquid crystal material is the rod shape o f its
molecule. These rods can take a certain orientation with respect to each other and to the
surface o f the cell. The most widely used orientation in LCD technology is twisted
nematic. In nematic ordering, all the rod shaped molecules (directors) are parallel to each
other. The direction o f this ordering can be changed by applying an electric field to the
liquid crystal material. A schematic Diagram illustrating the operation o f an LCD cell is
shown in Figures 2.1 a and b.
Lin At Pvlanzti Glass wflTD Elect! odesfurnace
Aligned L
wfiTO Eiedrûdfs Lmear Pclahzct
RandomlyPolarized
Ughl
Uncar Polanzcr
LC Forms90Deg Ttpsi
0 - " -(a)
Glass wfiTO ElcctiodcsGlass WITO Electrodes
Suh&ce Alimcd LC
L C AhgnsW dh H ectncF id d
LinearPolahzer
PandomlyPolarized
U ght
(b)Figure 2.1 A schematic diagram showing a liquid crystal cell in the (a) off state (b) on
state [9].

There are two types o f LCDs: reflective and transmissive. The first o f which utilizes
front illumination. M ost displays o f the reflective type use ambient light with provision
for secondary illumination such as an incandescent lamp or LED when ambient light
becomes insufficient. On the other hand, the transmissive type requires rear illumination.
There are two types o f architectures for LCD displays: passive matrix and active
matrix. In passive-matrix addressed topology, each row or column o f the display has a
single electrical circuit. The pixels are addressed one at a time by row and column
addresses. The pixel must retain its state between refreshes without the benefit o f a
steady electrical charge. This becomes less feasible as the number o f pixels increases,
since the response time will increase as well, resulting in a poor contrast which is typical
o f passive-matrix addressed LCDs.
Active matrix architecture results from adding a matrix o f thin film transistors (TFT)
to the polarizing and color filters. Each pixel is controlled by a single transistor. A
schematic diagram showing the TFT active matrix array is shown in Figure 2.2. W hen a
row line is activated, all the columns connect to the pixels in the selected row driving the
appropriate voltage while the rest o f the rows are electrically isolated which reduces cross
talk. The row lines are activated in sequence during the refresh period in order to charge
the capacitors that belong to each pixel with the desired amount given by the column
voltage [10]. This method has largely improved the quality o f LCD displays guaranteeing
a brighter and sharper image than passive matrix. M ost importantly, active matrix has
significantly improved the response time.

mew
A,V A, A, A,
'a » A,
A»—%» A,
Figure 2.2. A schematic diagram showing simple TFT Active Matrix Array [11]
TFT technology, however, is very complex and the cost increases rapidly with
increasing the area o f the matrix [10]. Another disadvantage o f TFT displays is that the
transistor blocks part of the light-path which limits the resolution which requires a
brighter backlight [10].
LCD technology, however, has its drawbacks such as low contrast ratio, image
scaling, ghosting (resulting from low response time), limited viewing angle, fragile, and
dead pixels. This limits their usage to certain application such as billboards. LCD
displays are equipped with an illuminator called a backlight system disposed at the rear
surface. Thus, the amount o f light from the backlight which transmits through the liquid
crystal panel is controlled by the liquid crystal panel in order to realize images, which
makes it more challenging to obtain dark colors. Low contrast ratio is a result o f the
unwanted light leakage in dark areas and passive full-on backlight control [12]. LCD
screens can only display native resolution which is the number o f pixels in every vertical
and horizontal line that make up the LCD matrix. Changing the resolution settings o f the

display will cause it to use a reduced visible area o f the screen or to extrapolate in which
multiple pixels are blended together. This can result in a fuzzy image [13].
In an LCD, there are two different time responses describing two different transitions.
Rising time response, which is the amount o f time required to turn on the cell from an
off-state and falling time response, which is the amount o f time required to turn off the
cell from an on-state. Rising time is much smaller than falling time. Thus, a blurring
action will occur on bright moving images on black background or in other words
ghosting effect.
Images in LCDs are produced by having a film that will turn on the desired shade o f
color when a current is applied to the pixel. This color can only be accurately represented
when viewed straight on which could be problematic. The color tends to wash out when
viewed further away from a perpendicular viewing angle [13].
2.1.1 Recent Trends in LCD Technology
LCD monitors are very desirable in the current market especially for applications like
computer monitors, portable electronics, laptops, etc. Thus, recent market has been
witnessing many competitors such as Gateway, Samsung, Dell, and Lenovo attempting to
come up with the best LCD in the market by improving viewing angle, contrast ratio,
resolution, and size.
Gateway has recently launched their XHD3000 monitor. It offers a wide-range o f
connectivity options along with bright picture and an up-scaler [14]. Then Samsung's
brand new 743B offers a 1280x1024 resolution, fast 5ms response time and a 7000:1
contrast ratio [14]. Dell has recently developed an award winning LCD monitor
sandwiched between layers o f clear glass are significant advancements in LCD display;

protruding elegantly from the rear o f the monitor are minimal speaker housings. All o f
the electronic wiring for the capacitive touch controls, digital camera, and the speakers
has visible wire traces [15]. Lenovo has produced a 22" LCD monitor that offers a 1920 x
1200 native resolution [14].
2.2 Plasma Display
Plasma technology was invented at the University o f Illinois in 1964 by Donald
Bitzer, H. Gene Slottow, and graduate student Robert W illson [16]. Larry Weber
developed the first prototype o f a 60-inch plasma display that combines many o f the
industry’s desirable features such as large size, high definition, and thickness.
Plasma has many characteristics that increased the demand for plasma technology in
the display industry especially home entertainment. Plasma displays are bright, have a
wide viewing angle, have a wide color gamut, and can be produced in large sizes, up to
150 inches diagonally [17]. Compared to the LCD, plasma displays have a better low
luminance black level. The total thickness o f a plasma display, including electronics, is
less than 4 inches; the display panel by itself is only about 2.5 inches thick [17]. Power
consumption differs with the brightness level o f the image displayed, with bright scenes
drawing significantly more power than darker ones. Nominal power rating is typically
400 watts for a 50-inch screen. Newer models (after 2006) consume 220 to 310 watts for
a 50-inch display. The lifetime o f the latest generation o f plasma displays is estimated at
60,000 hours o f actual display time [17].
Plasma displays are based on light generation. When an electrical current passes
through gas, the electrons acquire a high kinetic energy, and when they collide with the
10

gas atoms, they transfer their kinetic energy to the atoms exciting them into energy levels
above their ground state. Either direct or alternating currents can be used in order to
generate an internal electric field. A plasma element is composed o f a gas cavity with
transparent electrodes on the outside o f the containing dielectric layer as shown in Figure
2.3. The gas is normally neon that is electrically turned into plasma which, then, excites
the phosphors to emit white light.
D isplay electrodes
Dielectric layer (Inside the dielectric layer)M agnesium oxide coating
R ear plate g lass
Front plate g lass
A schem atic matrix electrode configuration in an AC PDF
. Dielectric layer
A ddress electrode
Pixel
P hosphor coating in plasm a cells
Figure 2.3. A schematic diagram showing a composition o f plasma display panel [17]
The driving circuitry o f the plasma display technology has been a major issue due to
its complexity. To drive a plasma display, the driving circuit must apply high voltage and
11

high frequency pulses to the scan electrodes [18]. The address-electrodes are located
under the cells perpendicular to the X and Y electrodes. A schematic diagram showing
the 3-electrods o f AC plasma display is shown in Figure 2.4. As mentioned, cells in a
plasma display emit visible lights via a plasma discharge induced by a pseudo square
alternating electric field applied between the X and Y electrodes [19]. For charging the
panel capacitance and supporting the plasma discharge, a large amount o f displacement
and discharge current is required. Hence, it is necessary to use the switches that can cope
with high peak and root mean square (RMS) currents, which means a high cost driving
system [19].
Front Glass
DielectricLayer
Electrode
Barrier Rib
Address Electrode"^^^Rear GlassPhosphors
Figure 2.4. A schematic diagram showing the structure o f the three-electrode AC plasmadisplay [19].
12

Address Display period Separation (ADS) scheme as illustrated in Figure 5 that is a
commonly used driving method for commercialized plasma display TV sets. In the ADS
scheme, there are 9-11 subfields in one TV field o f 1/60 or 1/50 second, and one subfield
is divided into three operational periods such as reset, scan (or address), and sustain.
Since the ADS scheme requires three different operations, conventional plasma display
panel (PDF) schemes have three different circuit blocks corresponding to each operation
[19]. For the sustain operation, a half bridge structure with energy recovery circuits
(ERC) o f the W eber type, which is based on an LC series resonance between an inductor
and a panel capacitor, is typically used [19]. The ramp reset is widely adopted, which
initializes RGB cells to have the same wall charge conditions by a weak gas regardless of
the previous on/off state o f cells. In the address period, scanning pulses from scan ICs are
sequentially applied to the Y electrodes, and data pulses are given to the cells to be
addressed while the scan switch Ysc is turned on to offer a negative scan voltage [19]. A
circuit schematic for the panel driving system is shown in Figure 2.5.
Scan/C;
4J- xr\ Address Buffers
X BoardSustain Circuit
Figure 2.5. A schematic showing a PDF driving system [19].
13

Advantages o f plasma display technology are the possibility o f producing very large
and thin screen, and very bright image and a wide viewing angle. Contrast ratios for
plasma displays are as high as 30,000:1, which is a significant advantage o f plasma
technology over most other display technologies other than LED [19]. However, just like
any other technology, plasma display technology has its challenges. Each cell on a
plasma display has to be precharged before it is illuminated so that the cell would
respond quickly enough. Due to precharging, the cells cannot achieve a true black [19].
Also, with phosphor-based electronic displays, the phosphor compounds, which emit the
light, lose their capacity to emit light with use, which causes burn in [19]. W hen a group
o f pixels are run at high brightness for an extended period o f time, a charge build-up in
the pixel structure occurs, which results in a ghost image [19].
2.2.1 Current Trends in Plasma Technology
The size o f plasma display has been one o f the key advantages that attract electronic
consumers to them. However, the complex and expensive circuitry that is involved in this
technology is a major downside. Thus, most recent researchers and plasma manufacturers
have been focused on reducing this aspect o f plasma displays. Pioneer, Samsung and
Panasonic have recently come up with the latest plasma display technology. Pioneer has
developed a 50-inch plasma TV. The KURO PDP-5010FD is the best in cinematic image
quality. The colors are rich and well-saturated, with great black levels [20]. The Pioneer
TV is also packed with features, and an anti-glare screen coating helps reduce shine. The
big downside is cost compared to other plasma TV sets [20]. The latest Samsung’s 50-
inch plasma HDTV has a great blend o f image quahty and value. Colors in Samsung
PN50A550 are very accurate, and video processing is one o f the best. However, Top
14
rated Pioneer and Panasonic plasma TVs have slightly deeper blacks [20]. Like most
plasma TVs, the Samsung PN50A550 has a reflective screen, but reports say that glare is
worse than most, which could pose a problem in bright rooms [20]. Panasonic’s best 46-
inch plasma TV when it comes to color accuracy, shadow detail and screen uniformity
rank among the best [20].
2.3 LED Displays
In LED displays every pixel consists o f three LEDs that are o f the colors red, green,
and blue, normally formed in a shape o f a square as shown in Figure 2.6.a. These pixels
are spaced evenly apart and are measured from center to center for absolute pixel
resolution. There are two types o f LED panels conventional, and surface mounted device
panel (SMD) panels. Conventional panels use discrete LEDs (individually mounted
LEDs) and are usually used for outdoor displays and sometimes indoor. M ost indoor
screens on the market are built using SMD technology that has a minimum brightness o f
600 candelas per square meter. SMD technology is currently reaching the outdoor market
as well, but under high ambient-brightness conditions, higher brightness may be required
for visibility. M inimum o f 2,000cd/m^ is required in most for outdoor use; however,
higher brightness is recommended up to 5,000cd/m^ since they cope better with direct
sunlight on the screen. An SMD pixel also consists o f red, green, and blue diodes
mounted on a chipset, which is then, mounted on the driver PC board as shown in Figure
2.6.a and 2.6.b. The individual diodes are very small and are set very close together. The
difference is that the maximum viewing distance is reduced by 25% from the discrete
LED display with the same resolution [21].
15

(a)
(b)
Figure 2.6 A schematic picture showing (a) 4x4 LED display matrix (b) LEDpixel Modules [22].
The first recorded fiat panel LED television screen was developed in 1977 by J. P.
Mitchell in 1977 [21]. The modular, scalable display array was initially enabled by
hundreds o f MV50 LEDs and a newly available TTL (transistor transistor logic) memory
16

addressing circuit from National Semiconductor [21]. In Anaheim M ay 1978, at the 29th
Engineering Exposition organized by the Science Service in W ashington D.C. the 1/4
inch thin flat panel prototype was displayed and a related scientific paper was presented.
However, efficient blue LEDs were missing in order to develop a color display which
they did not emerge until the early 1990s completing the desired RGB color triad [21]. In
the 1990s, LEDs with high brightness colors progressively developed allowing new
innovations for such as huge video displays for billboards and stadiums [21].
Using LEDs for displays has many advantages. LEDs can emit light o f an intended
color, which is more efficient and less costly than the use of color filters that traditional
lighting methods require. In order to display a moving image frequent on-off cycling is
required; LEDs are ideal for use in such applications because o f the fast response time o f
LEDs. LEDs have a very fast response time which is its advantage over other display
technologies such as LCD and Plasma. LEDs light up very quickly. A typical red LED
will achieve full brightness in microseconds. LEDs can be dimmed very easily either by
Pulse width modulation or lowering the forward current. Saving power or achieving an
apparent higher brightness for a given power input is also feasible when pulse width or
duty cycle modulated. Furthermore, LEDs mostly fail by dimming over time, rather than
the abrupt burn out o f incandescent bulbs. LEDs can have a relatively long useful life
estimated to be 35,000 to 50,000 hours where fluorescent tubes, typically, are rated at
about 30,000 hours, and incandescent light bulbs at 1,000-2,000 hours [21]. LEDs, being
solid state components, are difficult to damage with external shock. They can also be
very small and are easily mounted onto printed circuit boards.
On the other hand, LED displays are currently more expensive than most
17

conventional lighting technologies. M ost o f its expense partially stems from the relatively
low lumen output and the drive circuitry and power supplies needed. LED performance
largely depends on the ambient temperature o f the operating environment. Over driving
the LED in high ambient temperatures may result in overheating o f the LED package,
eventually leading to device failure [21]. Adequate heat sinking is required to maintain
long life [21]. Since white LEDs emit much more blue light than conventional outdoor
light sources such as high pressure sodium lamps, the strong wavelength dependence o f
Rayleigh scattering means that LEDs can cause more light pollution than other light
sources. It is, therefore, very important that LEDs are fully shielded when used outdoors
[21].
LEDs have become very popular in certain applications such as display boards
because they offer significant advantages in brightness, energy efficiency and product
lifetime over traditional illumination choices.
2.3.1 Recent Developments in LED Displays
LED display industry has started in the early 1990s and has rapidly and steadily
developed. Each year, the LED display market shows a growth o f 15-20% [23]. There is
a high demand for LED displays especially for outdoor screens such as sign displays and
billboards, and also for indoor screens. W ith the improving LED technology, LED
displays have developed to meet high industry standards when it comes to color
variability, quality, viewing angle, resolution, etc. Therefore, competitors have found it
very critical to introduce more features that extend even beyond high image quality. For
example, LED display market is headed towards mobile displays in some companies such
as YESCO and GOVISION. W ater proof and flexible LED displays are being produced
18

by Shenzhen Cheng Guangxing Industrial Development Co. and BaoChengXin O pto
electronic Technologies Co. Technology developments o f LED screen in the near future
will target many issues such as improvement o f performance indexes color, brightness,
angle o f view, etc. o f LED screen, development o f color and gray degree control,
improving color regenerating ability and visual quality of a full color screen, and constant
current driving control technology. Development o f the system technology will also be a
target for future developments such as applying automatic checking and remote control
[23]. Improving the product structure technique is also vital for instance LED ’s level,
heat dissipation and protection degree. Definitely, there is always room for improving the
overall stability and reUability o f the display [23].
19

CHAPTER 3
UNDERSTANDING COLORS
3.1 Definitions o f Basic Colorimetric Concepts
Psychological concepts related to color perception as defined by the authors in [24]:
Light:
Color:
Hue:
Saturation:
Chromaticness:
Brightness:
is a facet o f radiant energy o f which a human observer is
responsive through the visual sensations that occur from the
incentive o f the retina o f the eye by the radiant energy,
is an aspect o f visual perception by which an observer may
differentiate between identical structure shapes, which may
be a result of variations in the spectral composition o f the
radiant energy concerned in the observation,
is the feature o f a color perception.
is the feature o f a color perception determining the degree
o f its difference from the monochromatic color perception
most resembling it.
is the feature o f a color perception composed o f the features
hue and saturation.
is the feature o f a color perception ranging from very dim
or black to very bright.
20

Spectrum color:
Achromatic color:
Lightness: is the feature o f a color perception ranging for hght
diffusing objects from black to white.
Psychophysical Concepts Related to Color-Matching as defined by the authors in [24]:
Color stimulus: is radiant energy o f given intensity and spectral
composition, producing a sensation o f color when entering
the eye.
is the color o f monochromatic light, light o f a single
frequency.
is a color o f a light chosen because it usually yields an
achromatic color perception under the desired observing
conditions.
Primary colors: are the colors o f three reference lights. The additive
mixture o f such colors produces nearly all other colors in
the color gamut visible to the human eye.
Tristimulus values: are the relative amounts o f the three reference lights
required to give by a linear combination a match with the
color or light considered.
Color-m atching functions: are the tristimulus values, with respect to three primary
colors, o f monochromatic lights o f equal radiant energy,
regarded as functions o f the wavelength that depend on the
human eye sensitivity.
Chromaticity coordinates: are the ratios o f each tristimulus value needed to produce a
certain desired color by a linear combination.
21

Dominant wavelength: is the wavelength o f the spectrum color that, when
additively mixed in suitable magnitudes with a specified
achromatic color, yields a match with the color considered.
Basic photometric concepts and units as defined by the authors in [24]:
Luminous flux:
Lumen (Im):
Luminous intensity:
Candela (cd):
is the magnitude derived from radiant flux by evaluating
the radiant energy according to the human eye sensitivity
which is determined by its action upon a selective receptor
in the eye, the spectral sensitivity o f which is defined by a
standard relative luminous efficiency function,
the unit o f luminous flux is defined by the luminous flux
emitted within unit solid angle by a point source having a
uniform luminous intensity o f one candela,
is the proportion o f the luminous flux emitted by a point
source in an infinitesimal cone containing the given
direction, by the solid angle o f that cone,
the unit o f luminous intensity.
3.2 The Eye and Perception
The external stimulus is the visible radiant flux incident on the eye. The ability o f the
human eye to distinguish colors is based on the varying sensitivity o f different cells in the
retina (rods and cones) to different wavelengths o f visible light.
22

Macula
Retina
Nerve
To the
Figure 3.1. A schematic diagram showing different parts o f the eye [25].
The vision is an optical process up to a certain point, the critical point. This point is
reached when the radiant flux, originated from the external stimulus, is absorbed by the
light sensitive visual pigments o f the retinal end organs the rods and the cones [24]. The
internal stimulus is defined as the quality and intensity o f the radiant flux at each point
occupied by a visual pigment.
There are two different sensors in the retina: the cones which are sensitive to the
colors concentrated in the fovea (macula), as shown in Figure 1, and the rods which are
sensitive to low levels o f light. Cones are coated with pigments that are sensitive to
different wavelengths. There are about seven million cones in every eye; each o f which is
connected with single neuron. However, rods are grouped in bunches and every bunch is
connected to a neuron. There are about 120 million Rods in each eye. A schematic
diagram in Figure 3.2 pictorially depicts the nature o f the retina.
23

Figure 3.2. A schematic diagram showing rods and cones [26]
No matter how complex light is, the composition of wavelengths is reduced to three
color components by the eye which are red, green and blue. For each location in the
visual field, the three types o f cones yield three signals based on the extent to which each
is stimulated. These values are called tristimulus values. The "green" and "red" cones are
mostly packed into the fovea centralis. Approximately, 64% of the cones are sensitive to
red, 32% green sensitive, and about 2% are blue sensitive [24]. The "blue" cones have the
highest sensitivity and are mostly found outside the fovea. A schematic diagram shoeing
response o f the retina versus wavelength o f light is shown in figure 3.3. These curves are
obtained by measurement o f the absorption by the cones, but the relative heights for the
three types are set equal for lack o f detailed data. There are fewer blue cones, but the blue
sensitivity is comparable to the others, so there must be some boosting mechanism [24].
In the final overall visual perception, the three colors appear comparable. Light may be
24

precisely characterized by giving the pow er o f the light at each wavelength in the visible
spectrum, and this function is called the spectral power distribution (SPD).
Blue Green RedRode Cones Cone#
I380nm ^Onm SOCmm «Ciri asonm TOOftm TSOnm
Wewebngih of LIghf (nm)
Figure 3.3. A schematic diagram showing the different response curves for cones androds [27].
3.2.1 Photoptic and Scotoptic Vision
Scotopic vision is the eye's nighttime sensitivity; at night the vision shifts toward the
blue end o f the visible hght. It is at its peak at 507 nm and falls to 10" at 340 and 670 nm
as shown in figure3.4. The eye’s daytime sensitivity is called photopic vision which shifts
toward the green end o f the visible light with a peak at 555 nm. It falls to 10^ at 380 and
750 nm. In other words, human vision is more sensitive to blue at night; where it is more
sensitive to green in day vision.
25

The scotopic vision is primarily rod vision, and the photopic vision includes the
cones. The response curve o f the eye, shown in Figure 3.4, together with the spectral
power distribution o f a luminous object determines the perceived color o f the object. The
curves represent the spectral luminous efficacy for human vision. The lumen is defined
such that the peak o f the photopic vision curve has a luminous efficacy o f 683
lumens/watt. The efficacy o f the scotopic vision equals the efficacy o f the photopic value
at 555 nm [27]. This was done by taking a person with normal vision, and having them
compare the brightness o f monochromatic light at 555 nm, where the eye is most
sensitive, with the brightness o f another monochromatic source o f differing wavelength.
To achieve a balance, the brightness o f the 555 nm source was reduced until the observer
felt that the two sources were equal in brightness. The fraction by which the 555 nm
source is reduced measures the observer's sensitivity to the second wavelength [27].
j 1700
600^ P»iotoj)lc Melon
400 700Wavelengih (nm)
Figure 3.4. A schematic diagram of the spectral luminous efficacy for human vision [27]
26

3.3 The Nature o f Color
Color is a visual perceptual property that steams from the spectrum of light, which is
the distribution o f light energy versus wavelength, interacting with the light receptors of
the eye that is featured by spectral sensitivities [28]. Visible light is when the wavelength
is within the visible spectrum which is the range o f wavelengths humans can perceive,
approximately from 380 nm to 740 nm. Table 1 shows the colors that can be produced by
visible light o f a single wavelength only, the pure spectral or monochromatic colors.
Different hght sources emit light at many different wavelengths; a source's spectrum
represents the intensity distribution at each wavelength. The spectrum o f light arriving at
the eye from a given direction determines the color sensation in that direction.
Table 3.1. The colors o f the visible light spectrum [26]
C olorW avelength
In terva lFrequency
In terva lRed 700-630 nm 430-480 THzOrange 630-590 nm 480-510 THzYellow 590-560 nm 510-540 THzGreen 560-490 nm 540-610 THzBlue 490-450 nm 610-670 THzViolet 450-400 nm 670-750 THz
A common list identifying six main bands: red, orange, yellow, green, blue, and
violet; their wavelengths and frequencies are presented in Table 3.1. Newton's conception
included a seventh color, indigo, between blue and violet. The intensity o f a spectral
color may alter its perception considerably; for example, a low-intensity orange-yellow is
27

brown, and a low-intensity yellow-green is olive-green.
3.4 Color Interpreted by the Brain
3.4.1 Reproduction of Colors
Light sources are either monochromatic or mixtures o f various wavelengths o f light.
Some monochromatic colors can be reproduced as combination o f other light sources.
Orange, for instance, is a monochromatic color that is also obtained as a combination of
red and green light. In New ton’s experiment [29], he investigated what happens when
mirrors are placed so as to superimpose on a white screen, two beams o f monochromatic
light from different regions o f the spectrum. He found that a different third color was
seen. This intermingled light was not monochromatic, because Newton found that when it
passed through another prism two beams emerged with the two original monochromatic
colors. From these observations Newton deduced that the notion o f color applies to the
perception we have, not to the light itself [29]. Two different light spectra which have the
same effect on the three color receptors in the human eye will be perceived as the same
color. This is exemplified by the white light that is emitted by fluorescent lamps, which
typically has a spectrum consisting o f a few narrow bands, while daylight has a
continuous spectrum but human beings perceive them as very similar. The human eye
cannot tell the difference between such light spectra just by looking into the light source,
although reflected colors from objects can look different, because the absorption behavior
o f the object may be different for different parts o f the spectrum.
28

3.4.2 Luminous Flux
Luminous flux is a weighted average o f the Radiant Flux in the visible spectrum. It is
a weighted average since the human eye responds unequally (it has different sensitivity)
to the different visible wavelengths [24]. For conversion o f Radiant Flux to Luminous
Flux at any wavelength a weighing factor (Vx) has to be taken into consideration; this
weighing factor is the luminance efficacy, which is the response o f the eye as a function
of frequency. Further discussion is in section 3.3.
3.4.3 Matching Function
Given that Q is the vector representing a particular color and R, G, and B are the unit
vectors representing three fixed primaries, then the vector equation
Q=RR+GG+RB (3.4.1)
states that the given color is matched by a linear combination o f quantities R, G, B o f the
respective primaries [29]. The scalar multipliers R, G, and B are the tristimulus values o f
the given color with respect to the set o f primaries R, G, and B. This three dimensional
vector space is called the RGB tristimulus space. Given that is the spectral energy
distribution o f color Q, then Q can be considered as an additive mixture o f colors whose
corresponding stimuli are the monochromatic components Px o f the original stimulus out
o f which the color Q is composed. If Rx dX, Gx dX, and Bx dX are the tristimulus values o f
Qx dÀ and R, G, B are those o f Q, then [24]
Q=k6id% (3.4.2)
29

and
R = lx R x d l , G = k G x d l , B = k B x d l (3.4.3)
Using Equation 3.4.2 and 3.4.3, Equation 3.4.1 can be written as
Q = k & d X = R k R i d X + G k G i d X + B k R i d X (3.4.4)
Given that is the tristimulus value o f spectrum for the color Q, one can conclude
that the corresponding stimuli are monochromatic and contain the same constant radiant
flux. These values are denoted by which represent the color matching
properties o f the human eye in the particular primary system, R, G, B, and are called
color matching functions as shown in Figure 3.5. Therefore, the set o f equations in (3.4.2)
and (3.4.3) above can be rewritten as follows:
Q = k P iÿ _ ,d l (3.4.5)
^ = k P i F ^ d X , G= k P x dk, B = kP x b ^d X (3.4.6)
This implies that the tristimulus values R, G, B, the coefficients o f the unit vectors R,
G, B in the linear equation (3.4.1), can be represented as the multiplication o f two
amounts the spectral energy distribution and the matching function which adapts the
radiant flux observed by the human eye to the corresponding, wave length dependent,
luminance flux. In other words, R, G, and B are the weighted average o f the spectral
energy distribution. Thus, Q is the summation o f the product o f those weighted averages
30
by the RGB unit vectors.
0.3
0.2
700
435.8 546.1
400 500 600 700W a v e l e n g t h ( n m )
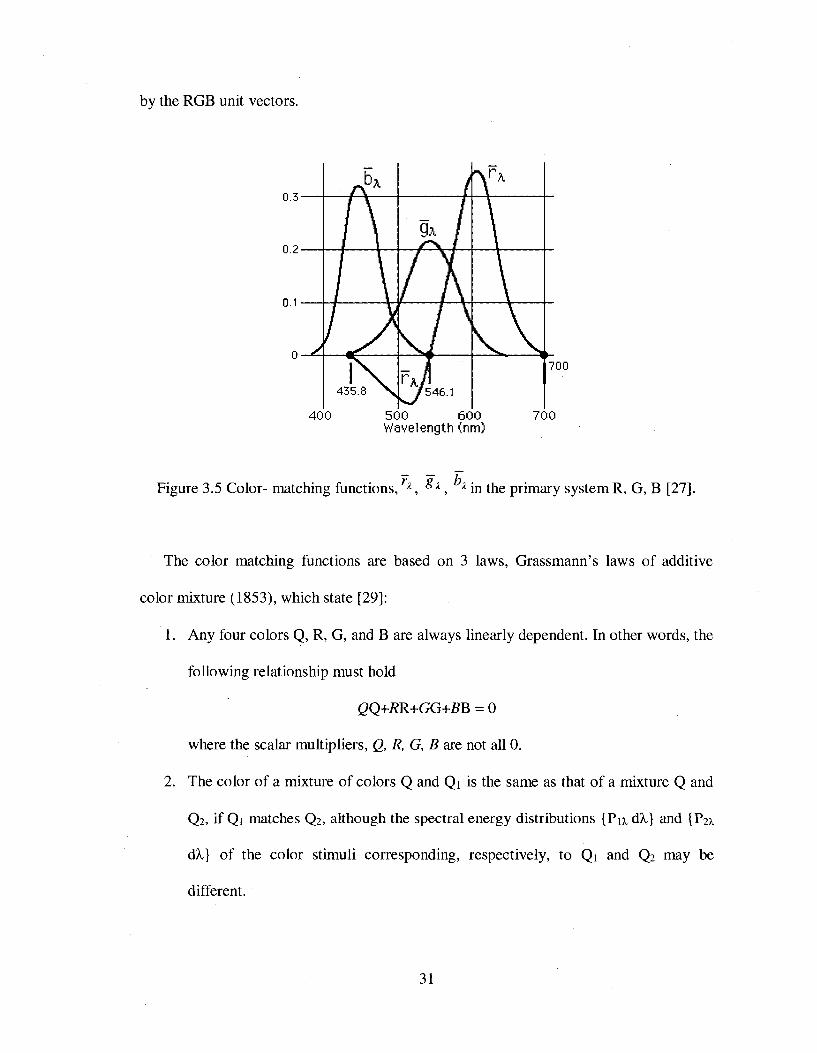
Figure 3.5 Color- matching f u n c t i o n s , i n the primary system R , G, B [27].
The color matching functions are based on 3 laws, Grassm ann’s laws o f additive
color mixture (1853), which state [29]:
1. Any four colors Q, R, G, and B are always linearly dependent. In other words, the
following relationship must hold
gQ+RR+GG+RB = 0
where the scalar multipliers, Q, R, G, B are not all 0.
2. The color o f a mixture o f colors Q and Qi is the same as that o f a mixture Q and
Q2 , if Qi matches Q 2 , although the spectral energy distributions [ P a dA,} and [P 2 1
dX] o f the color stimuli corresponding, respectively, to Qi and Q2 may be
different.
31
3. A continuous change in the spectral energy distribution {P;, d).} o f the color
stimulus o f color Q results in a continuous change o f Q.
3.5 Color Spaces
A color space is a notation, by which we can quantify colors. There are many
different color spaces that are used for different apphcations specifically in image
processing. The choice of a color space can be a very important decision, which can
largely influence the results o f the processing [30]. Color spaces can be categorized in 3
different categories: human visual system (HVS) based color spaces. Application specific
color spaces, and CIE color spaces.
3.5.1 HVS Color Spaces
The HVS based color spaces fall under three categories: the RGB color spaces, the
opponent colors theory based color spaces, and the phenomenal color spaces. The RGB
color space is the first attempt to simulate light in the human eye based on the HVS. The
color is described with three components: R, G and B. The value o f these components is
the sum of the respective sensitivity functions S i and the light spectrums R i dX, Gi dX,
and B i dX.
R =kS;,R ;,dX , G= j;, S;, G;, d)., B= j;, S;, 5;, dX (3.5.1)
The RGB color space is device dependent since the RGB values depend on the
specific sensitivity function. Capturing, printing, and displaying devices are based on the
RGB color space.
The German physiologist Ewald Hering proposed the opponent colors theory in the
32
late 19th century [30]. He noted that certain hues were never perceived to occur together;
for example, reddish-green or yellowish-blue are not visually possible, while all other
combinations are possible such as bluish-green or reddish-yellow. Researchers found out
that there is a layer in the HVS that converts the RGB values from the cones into an
opponent color vector. This vector has an achromatic component White-Black (WhBl)
and two chromatic components Red-Green (RG) and Yellow-Blue (YeB) [30]. The
transformation between RGB values and RG, YeR, and WhBl is done according to the
following model:
RG = R - G
YeB = 2B - R - G
WhBl = R 4 - G 4 - B (3.5.2)
Isaac Newton [24] arranged colors in a circle, called the Newton’s color circle, which
belongs to the phenomenal color spaces. This uses the attributes o f hue and saturation for
describing colors as shown in Figure 3.6, where the hue is represented by the angle,
saturation by the radius, and value or luminance by the hypotenuse formed by the line
that extends on the surface o f the cone from zero brightness, the pointy part o f the cone.
Naturally, the human brain tends to organize colors by hue, saturation and brightness.
This is the mind’s representation o f colors - the highest level in human visual processing
[30]. Hue is the attribute which tells us whether the color is red, green, yellow, blue,
purple, etc which is represented by the angle. Saturation is the level o f non-whiteness
which is represented by the radial length o f the point from the center. Brightness is a
measure o f the intensity o f light which is represented by the tangent o f the cone. The
Munsell color space is a phenomenal color space and an atlas o f 1500 systematically
33

ordered color samples. These samples are chosen in such a way that the steps are
perceptually equal [30].
Hue
Value
Satuiation
Figure 3.6 A schematic diagram representing the phenomenal color space [31]
HSV (hue, saturation, and value) color spaces are also phenomenal color spaces.
They are a linear transformation from the RGB space. There are many o f HSV spaces
defined in literature [30]. In the following, one o f the models used for HSV
transformation is described below:
Saturation is presented as:
S =
Value is defined as:
max( R ,G ,B ) ~ min( R ,G ,B )
m ax(R ,G ,B)(3.5.3)
V = m ax(R ,G ,fi)
Hue is defined as:
H = 5 + B ' when R = max(R, G,B), G = min(R, G,B )
(3.5.4)
34

where
/ / = 1 - G ' when R = max(R,G,5),G 6= min(R, G,B)
H = R' + 1 when G = ma\(R,G,B),B = min(R,G,5)
H = 3 - B ' when G = max(R,G,B),B 6= min(R, G,B)
H = 3 + G' when B = max(R,G,R)
H - 5 - R' otherwise (3.5.5)
m a x (R ,G ,R )-Rmax(R, G, B) - min(R, G, B)
_ m a x ( R ,G ,B ) - G max(R, G, B) - min(R, G, B)
g , _ m a x ( R ,G ,B ) - Bmax(R, G , B ) ~ mm(R ,G ,B )
then H is converted to degrees by multiplying by 60.
Phenomenal color spaces do not take into account the human perception. There is also
a bad correlation between the computed and the perceived lightness [30]. Thus, using
phenomenal color spaces becomes inaccurate in many applications.
3.5.2 Application Specific Color Spaces
The two main applications, where the usage o f color spaces is essential, are printing
and television. In printing, subtractive mixing o f colors is used, which is a way to
produce colors by selectively removing a portion o f the visual spectrum. The CMY (Cyan
M agenta Yellow) color space is a subtractive color space and is mainly used in printing
35

applications [30]. It is perceptually non-linear. The three components represent three
reflection filters. There is also the CMYK color space, where the fourth component K
represents the amount o f black ink [30]. There are two types o f transformation to the
CMYK color space, a simple one and a more complicated one that uses complicated
polynomial arithmetic or three-dimensional interpolations o f lookup tables.
Simple transformation from RGB to CMY color space is given by:
C = 1 - R
M = 1 - G
7 = 1 - R (3.5.6)
Transformation from C' M ' Y ' to the CMYK color space is given by:
K = min (C,M, 7 )
(1-r)
'■Ç3 ?The YUV color space is one o f the color spaces used for TV application. The RGB
signals are encoded in the YUV space with the following equations:
7 = 0.299R + 0.587G + 0.114R
U = -0 .147R - 0.289G + 0.437R = 0.493 (R - Y)
V = 0 .6 1 5 R -0 .5 1 5 G -0 .1 R = 0 .8 7 7 (R - 7) (3.5.8)
The YUV space can be transformed in a phenomenal color space, with Y representing
36

the V (value) component, as:
H jjy — tan -1(3.5.9)
3.5.3 The CIE Color Spaces
The CIE, the international Commission on Illumination, laid down the CIE 1931
standard colorimetric observer in 1931. This is the data on the ideal observer on which all
colorimetric is based [30]. As shown in equation 3.4.1, colors can be expressed as vectors
that are geometrically represented as a three-dimensional vector space where R, G, and B
are the axis, color o f vector Q is a point with the coordinates o f R, G, and B [24]. The unit
plane that satisfies the condition R+G+B = 1 is considered as the two dimensional (r, g)
chromaticity diagram as shown in Figure 3.7.
G
G G=1
R=1
B=1
g
B Rf
RUnit Plane, (r ^ Chromaticity Diagram
B
Figure 3.7 A schematic diagram showing the three-dimensional RGB vector space and the (r g) chromaticity diagram.
The following set o f equations is used for the transformation o f the tristimulus values
37

R, G, B to the chromaticity coordinates r, g, b:
Rr = ■
R + G + B
The CIE standardized the XYZ values as tristimulus values that can describe any
color that can be perceived by an average human observer. This color space is defined by
the color matching functions , ÿ,!, [24]. These values, which were experimentally
obtained, are tabulated with the corresponding chromaticity c o o r d i n a t e s T h e
CIE color space chromaticity presented in Figure 3.8 is showing the color gamut for the
(x y) chromaticity coordinates; the wavelengths are denoted by the values surrounding
the color gamut.
The tristimulus values X, Y, and Z are obtained by the summation o f the spectral
distribution o f its radiant flux dA.] as shown in the following equations:
X
Z = (3.5.11)
where the color matching functions , Z; are obtained from the tabulated data, and k
is a normalizing factor. After obtaining the tristimulus values, the chromaticity
coordinates are obtained by using the following equations:
XX = -----------------------
X + Y + Z
38

z -■
X + F + Z
Z ____
X + F + Z(3.5.12)
0.9
0.7
0.6
«)0
620
700
0.2
480
O.Ô0.0 0.2 0.3 0.4 0.5 0.6 0.7 0.8
X
Figure 3.8 The CIE 1931 color space (x y)chromaticity diagram [27]
For any given stimulus, the transformation between r, g, b and x, y, z is given by the
following set o f equations:
39
0.49r + 0.31g+ 0.26 " 0.66697r + 1.1324g +1.200636 ^
0.17697r + 0.8124g +0.010636y = ---------------------------------------------, (3.5.13)
0.66697r + 1 .1324g +1.200636
O.Or + O.Olg + 0.996z = '
0.66697r + 1 .1324g +1.200636
In 1976, the CIE introduced the color spaces CIELUV and CIELAB. Perceptual
uniformity is what distinguishes the CIELUV and CIELAB color spaces. Thus, any
change in value corresponds approximately to the same perceptual difference over any
part of the space [30]. The CIELUV space was specifically designed for emissive colors
that are found in various applications such as photography or computer graphics
rendering program. For the ‘a ’ value, CIELAB uses a red/green axis and a blue/yellow
axis for the ‘b ’ value [32]. This model is very similar to the way the human optic system
works. CIELUV uses chromaticity (saturation) for the ‘u ’ value and hue angle for the
‘v’ value. The CIELUV space uses the CIE 1976 (u v ) chromaticity diagram, shown in
Figure 3.9, where L, U, V are the tristimulus values that correspond to the (u v )
coordinates; however, CIELAB uses a modification o f Adam’s chromatic-value diagram,
as shown in Figure 3.10, where L, A, B are the tristimulus values that correspond to the
(a* b*) coordinates [32].
40

520 530 540
500nm 0.5
680nniÎ £ 1 L 6 1 0 62()
490nm 0.4
48011111
G 0.2 CIE 1976u\ v' uniform chromaticity
diagram460 nm450
440 nm I 1
420nm
0.2 0.3 0.4 0.5u ' - chromaticity coordinate
Figure 3.9 The CIE 1976 color space {u v ) chromaticity diagram [28].
In the CIELAB model presented in Figure 3.10, differences in colors perceived,
correspond to measured linear colorimetric distances. The ‘a’ axis extends from green (-
a) to red (+a) and the ‘b ’ axis from blue (-b) to yellow (+b). The brightness (L) increases
from the bottom to the top o f the spherical model [33].
41

I W hite
Figure 3.10 The CIELAB chromaticity diagram (a* b*) plane [33].
The transformation from CIE XYZ to CIELUV is performed with the following
equations
For — > O.OIy
L =116 -1 6
u* = I3L (m -m „)
V* = 1 3 L * (v '-v J
(3.5.14)
else
42

L =903.3 (3.5.15)
where
4%u —■
% + 1 5 7 + 3Z
4% .% . + 1 5 7 . + 3 Z ,
97
(3.5.16)
V =■Z + 1 5 7 + 3Z
97
" Z + 1 5 7 + 3 Z
The transformation from CIE XYZ to CIELAB is performed with the following equations
r =116 -1 6
a = 500r X 1 3
y kJ (3.5.17)
b = 200 f y ] 3 r z ikJwhere L is the lightness scale, which depends only on Y the luminance value, for both
color spaces CIELUV and CIELAB; The tristimulus values X„, Y„, Z„ are those o f the
nominally white object-color stimulus [30].
43

CHAPTER 4
THEORETICAL AND PRACTICAL MODELING OF
RGBW PIXEL BASED LED DISPLAY
4.1 Introduction o f the New Pixel with a White LED
Even though, the rapid development in solid state technology has witnessed
advancements in high power LED obtaining on average 150 lumen/ Watt [34], efficiency
o f LED displays could be further improved by introducing a white LED to the pixel. In
addition, the introduction of the white LED is expected to improve picture quality o f
LED displays. There are several approaches using LEDs to achieve white light. One
approach is to use a blue or UV LED to excite one or more phosphors to produce white
light [35] [36]. Another approach is to use RGB LEDs to give white light. A key
challenge for RGB LEDs is to maintain the desired white point within acceptable
tolerances. This arises from the significant spread in lumen output and wavelength of
manufactured LEDs, and the changes in LED characteristics that occur with temperature
and time. Maintaining the desired white point can only be achieved with feedback
schemes to control the relative contributions o f red, green, and blue to the white light
[36]. This paper focuses on the first method o f white light generation in which a blue
LED is used. The traditional method o f using LED light source composed o f RGB
LEDs is modified to include a white LED. The white LED will be turned on to the level
44

of the appropriate luminance when all three RGB are turned on in order to produce a
certain color. The luminance o f the white LED will be decided based on the minimum
luminance flux (which takes into account human eye response) o f the RGB and
tristimulus values, which are the amounts o f the reference lights necessary for the
additive mixture to provide a close match to the light considered [24].
By introducing the white LED into the pixel, usage o f the green LED will be reduced,
which is the least efficient. Also, usage o f red and blue LEDs will be reduced which
results in a life expectancy increase o f the display on an average. M oreover, less
complicated feedback control schemes for RGB LEDs will be needed in order to
maintain achromatic point (AP) since pure white light is used to achieve the white point
resulting in more uniform white color point integration with the added benefits o f a less
complicated control circuitry. Based on a theoretical modeling and test measurements
(using a prototype) for the new suggested method (RGBW), the advantages compared to
the RGB LED display technology will be demonstrated.
4.2 Issues with RGB
Although RGB has the benefit o f color variability, it also has some challenging issues
such as: Color instability due to temperature changes and the variability in light output of
nominally identical LEDs by over a factor o f two, and the wavelength can vary by many
nanometers due to aging differently and initial spread in the performance o f the LEDs
[36]. A study on thermal effects on RGB LED characteristics was reported in [35]. The
study in [35] shows a 10% decrease in light output for every lOOC increase in
temperature for AUnGaP red LED 5% for InGaN green LED and 2% for InGaN blue
45

LED. It is also shown that as temperature increases the LED shifts towards longer
wavelength. In [36], minimum perceptible-color-difference (MPCD) as an outcome of
changes in light output o f the individual LEDs, due to aging or manufacturing
inconsistency, was studied and reported. Results show the calculated shift in the (u, v)
color coordinates as a result o f a change in the flux o f the red, green, or blue LEDs.
4.3 Theoretical Analysis o f the New RGBW Pixel
In this study, the classical pixel RGB is modified to include a white LED. In a frame,
some pixels will have a certain intensity o f white. In other words, certain hues can be
modeled as the addition o f a certain amount o f white and some intensities o f two o f the
three colors, R, G and B. For every pixel that has some amount of white in it, or the color
is not fully saturated; the maximum luminance flux o f white o f the color is supphed using
the white LED in order to retain the saturation level required. In the process, the intensity
o f one o f the three colors will be completely eliminated and the two others will be
reduced in intensity. Figure 4.1 schematically demonstrates the process o f conversion
from RGB to RGBW through an example, where the source data is chosen to be R = 75,
G = 90, and B = 45. First, the three data sources are compared in order to distinguish the
source with the minimum intensity out o f RGB which in this case is B. Then, the value o f
the minimum intensity will be deducted from all three sources so R would take the value
30, G = 45, and B = 0. Finally, this value will be supplied to the W which becomes 45.
As shown in the example in figure 4.1, the converted data will consist o f four data
sources, RGB and W.
46

Figure 4.1 RGBW chart. Y axis represents 255 different possible levels o f digital color intensities that correspond to an eight bit data bus for each color, (a) Intensity levels for RGB in a pixel (b) Identified intensity o f white in the pixel (c) B completely eliminated,
white LED introduced and R and G reduced.
The combination o f light wavelengths to produce a given perceived color is not
unique. The white intensity in a certain color affects its saturation [24]. In other words, a
perfectly saturated color is missing the element o f white; therefore, only monochromatic
and dual chromatic colors can be perfectly saturated. That given, it is concluded that by
eliminating the white component, the hue will not change but its saturation level will,
which could be compensated by adding a white light from any other light source such as
a white LED. The human eye can not distinguish between similar hues that are produced
by different components o f light wavelengths; however, it may affect the way colors o f
objects are perceived by the human eye if these light sources are used for ambient
lighting purposes. Since this project is only concerned with display systems, one can
47

conclude that using the white LED in order to display colors in such systems will not
affect the colors perceived by the observers.
The following analysis theoretically demonstrates that the hue from RGBW and RGB
will be the same. Using equation 4.1, the new color, Cnew, after reducing the intensities
o f R, G and B by x, is given by:
Cnew = (R-x) R + (R-x)B + (G-x) G
= (RR+BB+GG) - x(R+G+B) = C - xW (4.1)
Note that the rewritten equation 4.2 has two components on the right hand side. The
first term corresponds to the old color with the original intensities o f the R, G and B and
the second term corresponds to the amount of white intensity, which was removed from
the pixel by reducing intensities o f R, G and B by x. The calculations above show that the
process o f reducing an x amount o f luminance from every RGB LED is equivalent to the
process o f reducing the same amount o f white light.
Considering the HSV system, one can also show that the hue can be maintained when
comparing the traditional pixel to the new RGBW pixel set up. Using the set o f
equations 3.5.5 in order to determine the hue, all sub-pixel combinations can be taken
into account as follows:
W hen R is maximum and G is minimum, H given by:
When R is maximum and G is not minimum, H given by:
48

When G is maximum and B is minimum, H^^^is given by:
When G is maximum and B is not minimum, H given by:
When B is maximum, H given by:
(B -m m )- (m m -m m ) B - m m
w h e r e i s the hue obtained from the new RGBW pixel an d //„y is the hue obtained
from the traditional RGB pixel. Equations 4.2.a-4.2.e clearly show that the hues H
(RGBW) and are the same. Using equation 3.5.3, the saturation o f the new pixel is
found to be 1, which means it is fully saturated since the element o f the white is removed.
However, the saturation level can be individually controlled by the white LED to match
the saturation o f the old pixel. The value, as stated in equation 3.5.4, is the maximum
component among RGB which in the new pixel configuration that value will be reduced
by the minimum amount among RGB, which can also be compensated by the value o f the
white.
4.4 The RGBW LED Display Prototype and Driver
4.4.1 Hardware
An 8X8 pixel block display prototype is developed; each pixel consists o f RGBW
LEDs placed in a square configuration as shown in Figure 4.2. LEDs are driven by LED
49

drivers. Each driver drives eight LEDs. The display block has eight parallel inputs, which
implies that every four drivers are serially connected (red and white are serially
connected, green and blue are serially connected). The prototype is driven by an PPG A.
R B R B R B R B R B R B R B R B6 W G W G W G W e W e V e W e IfR B R B R B R B R B R B R B R BG W G W G W G W C V C V C If C IfR B R B R B R B R B R B R B R Be W G W G W G w c V c V c V c VR B R B R B R B R B R B R B R BG W G W G W G H C V C V C V G VR B R B R B R B R R R B R B R BG W G m G W G W 6 V « V « V G VR B R B R B R B R B R B R B R BG W G W G W G W e W fi If V fi IfR B R B R B R B R B R B R B R BG w 6 w G W 6 W C V 6 w 6 w 6 wR B R B R B R B R B R B R B R BG W G W G W G W C V C V C V C V
Figure 4.2 A schematic diagram showing the square pixel configuration with RGB and W LEDs used for this research and the prototype from TecnoVision.
4.4.2 The LED Driver
The STP08CDC596 chip is An 8-bit constant current LED sink driver with full
outputs detection and is used for driving the LEDs that compose the pixels o f the display.
Key features as listed in the data sheet o f the LED driver chip are [37]:
• 8 constant current output channels
• Adjustable output current through one external resistor
• Open and short line, short to GND, short to V-LED supply error detection
• Serial data in/parallel data out
• Serial out change state on the falling edges o f clock
50
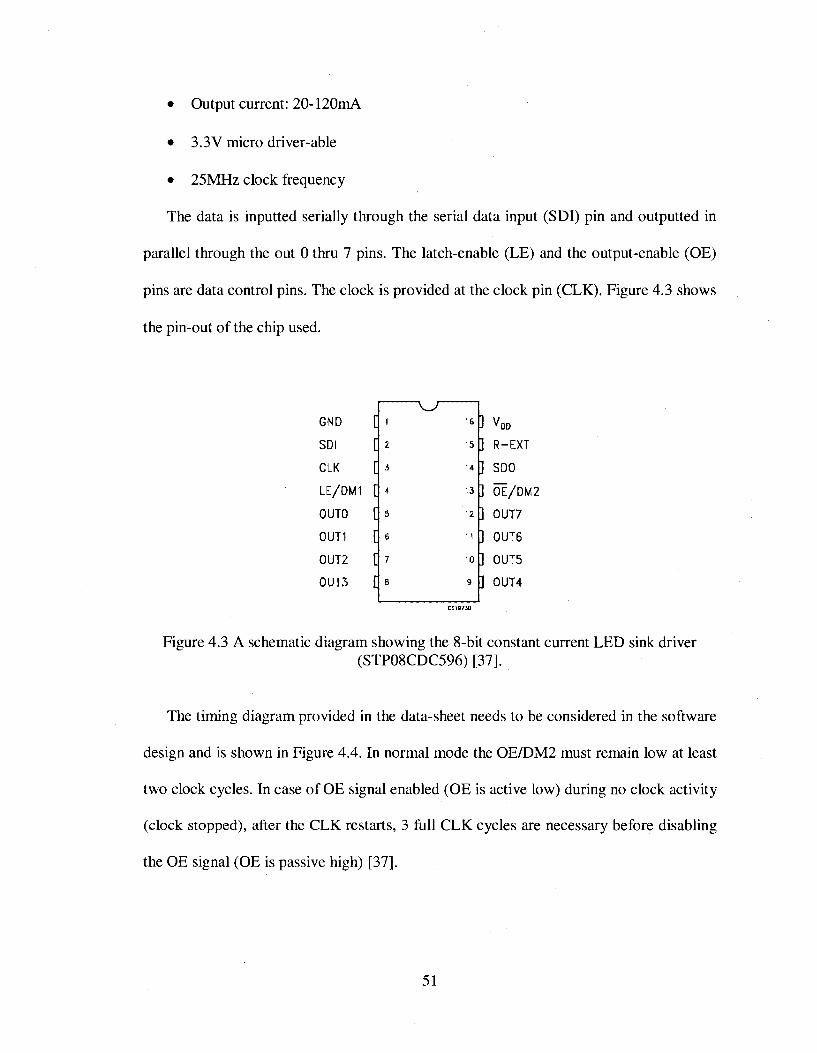
• Output current: 20-120mA
• 3.3V micro driver-able
• 25MHz clock frequency
The data is inputted serially through the serial data input (SDI) pin and outputted in
parallel through the out 0 thru 7 pins. The latch-enable (LE) and the output-enable (OE)
pins are data control pins. The clock is provided at the clock pin (CLK). Figure 4.3 shows
the pin-out o f the chip used.
L E / D M 1 C
DDR-EXTSDO
Ô Ë /D M 2OUT?0U T 60U T 50 U T 4
Figure 4.3 A schematic diagram showing the 8-bit constant current LED sink driver(STP08CDC596) [37].
The timing diagram provided in the data-sheet needs to be considered in the software
design and is shown in Figure 4.4. In normal mode the 0E /D M 2 must remain low at least
two clock cycles. In case o f OE signal enabled (OE is active low) during no clock activity
(clock stopped), after the CLK restarts, 3 full CLK cycles are necessary before disabling
the OE signal (OE is passive high) [37].
51

10 11HIGH
CLKOV
HIGH
_ T 1SDIOV
HIGHLE/DM1
OV
HIGH0E /D M 2
OV
ONOUTO
OFF
ONCUT1
OFF
ONCUT2
OFF
ONOUT?
OFF
HIGHSDO
OV
Figure 4.4 A timing diagram showing the pin’s statuses o f the LED driver chip [37].
There are 32 driver chips used in order to accommodate the number o f LEDs, 256
LEDs, required for an 8x8 pixel display. The schematic in Figure 4.5 shows the layout of
the circuitry supporting the prototype. In the schematics RW pins represent the data for
red and white and the BG represent the blue and green data pins. The rest o f the pins are
described at the beginning o f this section.
52

GND VddSDI R-sxQ..K SDCLE OE’a.JTO a . n ?a.JT1 0UT6a.JT2 OUTSOUT3 a jT 4
1 1— R3
•RWoO
S IX — B C ^
a;rocx;r2
G fD Vddsa R-exCLK SD
OPc-Lrro OLT
0LIT1 0UT60 UT2 c x n0DT3 CXJT4
LJ
4i- G IO VddSO! R ex
CLK SDCLE OE’a./T ü a jT 7
CUTI 0UT6
OUT2 OUTS
CUTS 0UT4
l%4{- GND VddSDI R-ex
Q..K SDCLE OE"OUTO OUT?OUT1 OUTSa J T 2 a /T 5a rrs 0UT4
GND VddSD R-exCLK SDCLE OE"o u ro OUT?c u n oirm0UT2 OUTSo u r s OUT*
GND VddSOI R e*CLK SDCLE O POUTO o u r ?OUT'1 oureOUT? OUTS0UT3 OLn4
^ j
A3•RVVo1
GND SD!CLKLE
cxiTo o u r ? 0 UT1 c u m
— 0UT2 OUT5— 0UT3 0 U f4
j g c j ___Vdd R -ex— Rl SDO — BGolOE- .
BGoO BGo2—
RWoO FWo2 —
GND LE- —
O P CLK- —
BQo1 BGb3RWo1 RWot
GND VddSDI R-exCLK SDOLE O P
OUTO our?OUT! 0L.4BCX1T2 0UT50UT3 OUT4
— Fi (g
VddR-
GNDSDICLK SDOLE O P(XJTQ o u r ?OUT! OLfre 0UT2 O UR
0UT3 01714
GND Vdds a R-ex
a.K SDCLE OE-OUTO OUT?0UT1 OUTS0UT2 OUTS
0UT3 CX1T4
a
GND VddSOI R-exa .K SDC
— LE OE’— a ./T o OUT?— a . m a /T 6— a . h ’? OUTS
— CUTS OUT4
i£
GND Vdd
SOI R-ex
CLK SDOLE OE*a /T C Gl.rT7a j T i OUT'6
0UT2 OUTSOUT3 OUT4
a
GND VddSDi A -«CLK SDOLE O P
CXJT'O o u r ?OUT1 oure0U 12 OUTS
0UT3 0UT4
■B1
Ri X— 5 :% X—iR3
GND VcWSDi R-ex
CLK SDCLE O POUTO our?OUT! cure0UT2 OUTS0UT3 OUT*
a j— F>
GM.) Vdd ^ 1 , < 1 4 - GND Vdd J S L I
SO R-ex — R3 S O R ex — m
CLK SDC — RVVo2 ----- 1 a .K SDC — RW63LE OE* — ----- LE O P —
OUTO o u r ? — ■ ----- 1 a .iT o OUT? —
0UT1 a.)T 6 — ----- 0UT1 0UT6 —
0UT2 a .n & — ----- 1 Ol.iT2 o u r s —
0UT3 0UT4 — OUTS 0UT4
GND Vdd Æ . . Î 1
S B R ex — RlCLK SDC — BGo2IE O P —
OUTO OUT? —
0UT1 OUT6 —
OUT? OUTS —
OUT3 01/T4 —
GM) VddSDI R e xCLK SDOLE OE"OUTO OUT?
OUT1 OUT6OUT? OUTS0UT3 0ÜT4
GKD VddS D R-exCLK SDCLE OE"OUTO o u r ?o u r i OUTOOUT? OUToOUT3 0UT4
I 5
- ? RWlW:g<H- GND Vdds a R-exCLK s o oLE O POUTO OUT?a m 0UT6
0UT2 OUTS0UT3 OUT4
_a
BG! BG2RVV! RW2GND LE
OE CLK
BGO BG3RWO RW3
GND VddSDi R e x
CLK SDCI.E. OE'OUTO OUT?OUT! OLHBOLh’2 0UT50UT3 0UT4
GND VddSDI R-exCLK SDC
OUTO OUT?
o u r i OUTSOUT? o u r s
OUTS o u r *
----- Rl
GND VddSDI R e xCLK SDCLE OE"OUTO OUT?o u r i OUTS0UT2 OUTSo u r e OISTA
-R 1-8 G o 3
GNDSDICLKLE
Vdd
SOOE*
J
— fix -x -
OUTO OUT? OUT! 0UT6
0U 12 O U R0UT3 0ÜT4
GND VddSDI R-exa .K SDOLE O Pa .r r o o u r ?OUT! 0UT6
0UT2 OUTS 0U 13 0 U r4
GM j VddSDI R ex
CLK SDCLE C-POUTO OLTT?
OLTI OUT6OUT? OUTSOUT'3 0UT4
l a
GND VddSDI R e x
CLK SDCLE O Pa . i i o OUT?0UT1 0UT6a /T 2 D i mOLfTO 0UT4
GND VddSD! R e xCLK SOOI E O POUTO our?o u r i OUTSCXJT3 OUTS0UT3 o u r *
_a_— Rl
GND VddSOI R-ex
CLK SDOLE O POUTO OUT?OUT! O lh ’6OUT? OUT&OUT3 OUT*
a
GMTSDi li rw3k^— X-CIK SDOLE OE* OUTO 0UT7 OUT1 a / r e - OUT2 CUTS . CUTS OUT4 -
CM ) VddSDICLK SDOLE O POUTO OUT?o u n OUTSa..iT2 OLTTd
oure o u r *
Figure 4.5 A schematic diagram showing the circuit layout o f the prototype.
53

4.4.3 The Display Driver
In order to drive the LED display prototype, the DE2 development and education
board is used. The DE2 has many key features and contains the appropriate components
for the hardware requirements o f the project. The following is a list o f the DE2
components and features that are used in the project as listed in the user manual o f the
DE2 board [38]:
Altera Cyclone® II 2C35 FPGA device
Altera Serial Configuration device - EPCS16
USB Blaster (on board) for programming and user API control; both IT AG and
Active Serial
512-Kbyte SRAM
8-Mbyte SDRAM
Expansion headers (76 signal pins)
4-Mbyte Flash memory
18 toggle switches
18 red user LEDs
50-MHz oscillator and 27-MHz oscillator for clock sources
VGA DAC (10-bit high-speed triple DACs) with VGA-out connector
4.4.4 Software
As described in the block diagram in Figure 4.8 there are two different RGB sources:
Pattern generator (implemented in memory), and real time serial digital input (SDI) video
signal (outputted from a scalar board that converts video signal to RGB). In the pattern
54

generator, the synchronization signals shown in Figures 4.6.a and 4.6.b are also
generated.
VideoLine
HorizontalSync
HorizontalH ankingInterval
Pixel RGB LevelsHorizontalBlankingInterval_________
Front Porch —-v ^ Back Porch
VideoFrame
VerticalSync
BlankingInterval
Blankingk te r w i
Front PorchA . L :
Back Porch
Figure 4.6 A timing diagram showing the (a) horizontal timing (b)vertical timing [39].
Using an FPGA The signals are decoded and fed into the RGB to RGBW converter.
Then, the RGBW input data (eight bit data bus for every color) is remapped. Due to the
architecture o f the display, the input data looses its order when outputted directly to the
display as shown in Figure 4.7. For optimal hardware design, such configuration was
required.
55

R27 R26 R25 R24 R ll RIO R9 R8
W19 W18 W17 W16 W3 W2 W1 WO
R28 R29 R30 R31 R12 R13 R14 R15
W 20 W21 W22 W23 W 4 W5 W6 W7
Figure 4.7 A diagram showing the order o f the white and the red o f the pixels o f the firsttwo rows o f the display without reordering
Finally, pulse width modulation (PWM) is used to output to the RGBW data to the
display. The color accuracy o f the white point will be maintained by reducing the
variation in white point if the LEDs are driven using PWM [15]. A 5” x 5”of white
plastic diffuser is used in order to properly mix the light o f the pixel in order to perceive a
uniform color.
.ïnSISÎS3
VideoSource
PatternG enerator
PixelReordering
RGB to RGBW Converter
PWM
ΠD D i s p l a y
Figure 4.8 A block diagram where S (0-3) allow variety o f solid colors to be displayed, S(v/g) selects pattern generator or video, and S(w/rgb) turns the RGB to RGBW
conversion on or off.
56

Using the switches o f the development board o f the FPGA, one can choose to bypass
the conversion so that the display will use the classical RGB pixel instead o f RGBW.
Using another set o f switches, the hardware provides the possibility to choose various
solid colors from the pattern generator to be displayed.
The following schematics Figures 4.9 (a thru i) demonstrate the logic implementation
in the FPGA of every part described in the block diagram in Figure 4.8. These are
selected parts o f the schematics file that was split due to its large size.
A 27 M Hz clock from the DE2 evaluation board is used for both synchronization o f
the implemented logic and for the generation o f the signals required for image display
(compatible with a VGA input connector) as shown in Figure 4.9.a. These signals include
the horizontal and vertical syncs (hsync and vsync), horizontal and vertical blanks
(hblank and vblank), and the vertical count (Vent). The logic was implemented with a
16.6 ms refreshing rate requirement assuming a resolution o f 720x 480. Then, an
extraction o f 8x8 pixels was done to match the size o f the prototype.
57

Bloelt \u mVBIankS '/Blanks
HBIanks HBIanks
Vcnt Q. m Vcnt{9..0
r^iyhcin Hsync
H countenHVsyncjp wjiT.er
> clock mcckiiu
lfl9 ..0] INPUTClk INPUTHbik OUTPUTVWk OUTPUTVs OUTPUT insiSSOHSyncIn OUTPUTHBIankS OUTPUTVBIankS OUTPUTVcntI9..01 OUTPUT
P icram 'Iaddress 7..01Block
Conthup C W M He njfttef[3 ,.0] HcQuritotijxtBfP
m s t l S N M * 1y m : A U T l
MemaddiP icram _g
addres£[7-0 | ^
LOUfllV Vcounter[3 ..u| Vcounter[3„0] *ou«erp.,ei]
Picram b9ddress[7..01 p
tpm _m uxl
d a t a i x [7 ..0 lesul [7-01
datauxl7..01
in s t2D B lcck ; v p « : 4U T0
HkichMenior yaodj / . .UJ [Meirior yadd[7 . .0]
PIN P25
Figure 4.9.a A schematic diagram showing the implementation o f the pattern generator.
The hsync and vsync are two o f the signals o f which a VGA connector consists for
RGB video output. They provide the monitor with the timing information necessary to
correctly display the pixel RGB data. VGA video output is a stream o f frames that are
58

refreshed at a certain frequency (refreshing rate). Every frame consists o f a series o f
horizontal lines where each o f which is made up of a series o f pixels [40]. In every frame,
the pixel data is transmitted in order from top left corner to bottom right corner. In order
to locate the ends o f every line and frame, separate horizontal and vertical
synchronization signals are required [40]. There are two regions that every horizontal line
of the display experiences: active video and blanking region. In the active video region,
RGB values are outputted for every pixel in the line. In the blanking region, there is the
front porch where black pixels are transmitted. Then, a horizontal sync pulse is
transmitted which is an indicator o f the end o f the line. The blanking interval after the
sync pulse is called the back porch where black pixels are also transmitted [40]. In order
to display a single frame, all the lines o f which the frame consists are transmitted in the
active region o f the vertical timing. Similar to the horizontal line, black lines will be
transmitted in the front porch. Then, a vertical sync pulse is transmitted indicating the end
o f a frame followed be the back porch. Figure 4.6(a-b) is a timing diagram showing the
appropriate timing o f the vsync and hsync signals to be outputted with the video signal.
The synchronization signals are also used in order to address the RAM, which
contains RGB data which can be manually changed through the software. As shown in
Figure 4.9.a, the memory can be addressed either by the counter that is controlled by the
horizontal and vertical counters or by the switches that can be manually controlled from
the evaluation board by the user. The RGB data is inputted to the other parts o f the
project units from the data generator along with VGA video output. The interface is
shown in Figure 4.9(b-c) where the RGB data from both sources are decoded with 2 to 1
multiplexers that select either source as an input to the next part which is the converter.
59

PINdatai
resudataO
sel«SiifTOïPIN_B8
PIN H19ÆHsync
PIN A7
Csync
PIN B 7 l r P I N K Ï ^
Cbïankû
PIN D6
PIN E10 PIN J2 2JjuTPUTPIN G 10 PIN E25PIN_D9 PIN F23PIN C9 PIN J20PIN A 8 PIN F26PIN H11 PIN P18PIN_H12 PIN_G24PIN F11 PIN G 25
PIN_D25PIN E26
PIN_D12 PIN F24PIN CIO PIN J21PIN_D10PIN B10 PIN_N18PIN_A10 PIN G 23PIN_G11 PIN K22PIN D11 PIN_H26PIN E12 PIN_K18
PIN_K21PIN B12PIN K24PIN F12PIN L20PIN G 12PIN J26P IN J 1 0PIN_L24P I N J I IPIN L19PIN_C11
PIN_B11PIN C l 2
Figure 4.9.b A schematic diagram showing the video input source.
The data o f the video input source is taken directly from the SDI which is an 8 bit
data stream representing RGB. The desired signal, whether it is the generator or the video
is determined by the select line (sel).
60

! !pm_mux4
I dataiidataO
I
result
ijn ee jpFF '6'" I ipm_mux4
i dataiidataOinstla&f
result
seL_
Ipm dfH
data[7..0]OFF
!— > clock q[7.,01
Igm dff4OFF
data[7..01q[7..0)> clock
Ipm dfH
data[7..0]OFF
i— > clock q[7--0]
PIN U4
BN IIOll«9vcv sync VCVsynca
M f WrM llod eVCH îync VCHsynca
V C H sym
Block Nod< Lck NodeVCclk VCclka pcc ]|@nk VCCblank
l o Tv»eVCclk INPUTVCHsync INPUTVCVsync INPUTVCCblank OUTPUTVCcnth[9..0] OUTPUTVCcntvI9..0] OUTPUT
E-Block Bus
VCcnth[9..0] VCcnth[9..0]
VCcnlv[9..0]Bw
VCcntvl9..0]
7 ie'
pm . .
pm_mux1
resultf7..01
Ipm_mux1
datai x[7 ..017.01
in s tl2 I
result[7..01:
sel
Ipm_mux1
Figure 4.9.C A schematic diagram showing the interface between the input sources andthe converter.
61

After receiving the RGB data from the appropriate source, it is passed to the RGB to
RGBW convertor. The data is compared to each other to determine the color with the
minimum value as shown in Figure 4.9.d. The logic levels o f the com parator’s outputs
are used along with a lookup table to set the multiplexer to the value that needs to be
subtracted from RGB and supplied to the white LED.
PIN V2
Ipm com pare ij
dataaI7..0] addre WessS3odress4d84 I7..0J
CondGttal
A
>
>
>CLM?
ir)St320
Ipm compareOimngned compare
dataa(7.,0]
datab(7,.01aeb
alb> clock
a d dre ss j
aadressi
Ipm oompareOwWawdccmpM
dataal7..0)
datab(7..0]
> clock
aeb
alb
Fi_A_>
>
addressO NPUT
addressi INPUTaddress2 INPUT
address3 INPUT
address4 NPUT
addressS INPUT
sw 17 INPUT
9ddroutl5..0) OUTPUT
Blo-.h . H usaddrout(5,.0) addrout|5..0]
Mode B lo ck H odeaddressO addressO
fi
lpm_mu*Q
?
Ipm romO
address(5.,0]
> clock
lpm_add_subG
■ dalaaf7..P1
A.eWiSILa HbJJ
D3t 3rp .,0]
lpm_add_subO
!dgtaai7 ..0]
ldat |7..0]
fpm_add_subO
:dat9a(7..01
idatab|7..Ql
Figure 4.9.d A schematic diagram showing the implementation o f the RGB to RGBWconverter.
62

The block in Figure 4.9.e is an implementation o f the control signals generation for
different parts o f the design. These signals include: FIFO memory read enable
(FIFOrdEn), dual ported memory stage 1 and 2 read enables, D PstlrdEn and DPst2rdEn,
respectively, and the LED display latch and output enables LEDisp and OEDisp,
respectively.
(lock BusC|[9..0] VCc Ttha[9..0]
Block ModfV S y n c V C V s y n c a
V C c n th s IS
VCcntva[Q..03
Blochwfitro]
BusV C c n t 'v a [ 9 :0 ] '
Bloch llOilt-Clk V C clka
Block BusB ltSel[2..0] B ltSel[2..0]
H S y n c V C H sy n ca
block ModeD Pst1 rdE n DPst1 rdE n
EnableG en
l it Tv»eH S y n c INPUTV S y n c INPUTClk INPUTV cn t[9 ..0 ] INPUTq[9 ..0] INPUTD P st2 rdE n OUTPUTFIFO rdEn OUTPUTDPst1 w rE n OUTPUTDPst1 rdE n OUTPUTLEDisp OUTPUTO ED isp OUTPUTB itSel[2..0] OUTPUT
Block
i n s t i c e EO isi
Block:D isp
D P s t l r d & i
FIFOrdEn FIF
F IF O n iE H
OEOisp
Mo le.EDis
DP:
lodeDrdEN
Bloch 'ModeO EDisp 0 EDisp
p oMode
rl2rdE n D P st2 rdE n
Figure 4.9.e A schematic diagram showing the implementation o f the control signalsgenerator.
The order o f the data when directly outputted to the prototype the way it is received
from the video or generator data stream takes a pattern as shown in Figure 4.8. Therefore,
63

it was necessary to implement a pixel reordering mechanism.
add«jr(6..5] Ipm dff1OFF
tlata[1 .0]
p clock
enableq[1 ..0]
p m c o u n te r l
> clockup tourner
— j._ clk_en q[6..0]
pUTKlf ,---- , aiidofLUTI6..0]addiurp..!)]
Ipm rom1
« address{6..01
- > clock
' clken
uir[7.,D]
PER0 Q
4- Era D Q>CLM
uir[5..0]
pUTf'JT I > D3taRe9Select(1,.03i
i
HnstlW
PUT r > LUTAi<10[5..01
Ipm decod eO
■ datall ..O)
-> clock
- clken
eqO
eq1
eq2
eq3
i# a 7 1 : marPKH-D s -
Figure 4.9.f A schematic diagram showing the implementation o f the pixel reorderingblock.
Pixel reordering was done using the enable signals and a lookup table, as shown in
Figure 4.9.f. These signals were used to address the dual ported memory shown in Figure
4.9.g. There are three memory stages one is FIFO and the other two stages are dual
ported memories. After the RGB to RGBW conversion, the RGBW data is inputted to the
FIFO then to the first dual ported memory stage; finally, inputted to the last dual ported
memory stage in the desired order, shown in Figure 4.9.h.
64

data(7..01 q[7.,ÛJi4liteFIF0t%stp..Cl)
= 0 4
Ebijk Î Ï I » : «JTO
rO-
> clock
Block Tvp«; AUTO
!pm fifo l lpm _ram _dpQ
graenFlFOtestjT.C
r d re q (ac*)
> clock
Block Typ*: AL'TO
r d re q
cnt_en
c lken
Ipm dff1
data[1..0] > clock
enable
w
Figure 4.9.g A schematic diagram showing the implementation o f the RGBW dataprocessing- stage 1 and 2 .
65

The 8 bit RGBW data lines are pulse width modulated which provides the ability o f
displaying 256 different intensities. After each bit outputted, latch enable (LE) has to be
pulsed once and then output enable (OE) has to be pulsed. The duration o f the OE pulse
width determines the intensity o f the LED; therefore, OE was doubled for every bit so
that:
OEpwbit(x) ~ 2 X OEpwbit(x-l) (4.3)
The sample code below shows the settings o f the LE, OE, and data output lines for bit
0 (refer to Appendix I for complete code).
DPst2rdv.clk = !HSync;DPst2rdv.j = Vcnt[] == 1DPst2rdv.k = Vcnt[] == 2
LEDispdv.clk = IHSync;LEDispdv.j = Vcnt[] == 1LEDispdv.k = Vcnt[] == 2
OEDispdv.clk = IHSync;OEDispdv.j = Vcnt[] == 2OEDispdv.k = Vcnt[] == 3
Figure 4.10 A sample AHDL code showing the settings o f the LE, OE, and dataoutput lines for bit 0 .
Given that 16.6ms refresh rate has to be maintained, there are access o f 431911
clocks in order to complete modulating 8 bit data lines for 64 pixels taking into account a
clock period o f 0.037ps. the pulse width was increased so that the LEDs will give a linear
response with respect to the binary input o f the data lines.
66

Figure 4.9.h A schematic diagram showing the implementation o f the RGBW dataprocessing- stage 3.
67

tw IcO pps? ' d a t ^
: rw1cO[weS
na1i>!)(we5 : d a t a 4i’«<cO pre4 . d a t a jm '1 cO pre5 ^ d a t a 2
u lo O p rt) ; d a t a ttO p re l idatsÆ )
1pm r?iux2
miîoSpne?
Iptri_muv2
data7
iw2c£-p?ee
IdaM.'dA3
1 ™ ' !d ala 2
jaâiâT«5pi»0 relpsprel
: Ipm _m us2
iüSsîi d a t a S
idataS idata4 ; d a t a 3
.aft'VTPVf " r ’~ ~ > riiiloO I PIN_K25|
Ip m _ m u x2
;d a ta7
I * b 5
llW«4!dat«3
»*4pP,l
IcWc
F "7 ,..» ™ „ ...... ............................................
> i™ .M 20 1
V
>1ST
fitiTPUT p \ rȈ>0
>
IŸUTPUT I > nw4M
Figure 4.9.i A schematic diagram showing the implementation o f the PW M of theRGBW data.
Using an 8 to 1 multiplexer, the appropriate bit is chosen in according to the pulse
width of the OE signal, then, finally outputted to the LED display as demonstrated in
Figure 4.9.i.
The intensity response was tested for the red, green, blue, and white LEDs using a
spectrometer (Ocean Optics USB3000). The spectrometer was placed directly on top o f
the measured LED where complete stillness was maintained in every part for better
accuracy. The results in Figure 4.10(a-d) clearly show a linear response.
68

Input Data (Decimal)
Input Data (Decimal)
Blue
300
Input Data (Decimal)
( d ) i
White
60
50
40
30
20
lOO
50 lOO 150 200
Input Data (Decimal)
250 300
Figure 4.11 A graph showing the intensity response o f the (a) red (b) green (c) blue (d)white LED.
69

CHAPTER 5
EXPERIMENTS, RESULTS, AND DISCUSSION
In this chapter, results and discussion are presented. Spectroscopic measurements of
various colors for RGB and RGBW are shown, compared and contrasted. Details o f the
experimentation with respect to human perception o f color from two different
technologies (RGB and RGBW) and energy calculations based on measured currents are
presented and discussed.
5.1 Spectroscopic Measurements
Using the spectrometer Ocean Optics USB4000, the spectrum, representing the
radiant flux, o f the colors generated by RGB is measured and compared to the spectrum
of color generated by RGBW. The spectrometer was placed directly after the diffuser
attached to the LED display in order to capture the right proportions o f the light mixture.
A static environment was maintained while measurements were taken. Eigure 5.1 shows
the spectra o f the white light generated using the white LED and RGB LEDs,
respectively.
70

12000
lOOOO
^ 8000
6000
4000
2000
400 650 700500 550 600450
Wavelength (mn)
(a)
12000
LOOOO
Ô 8000
6000
4000
2000
400 550 700500 600450
Wavelengtli (mn)
(b)
Figure 5.1. Spectrum o f white, intensity with respect to wave length, using (a) RGBWand (b) RGB.
71

In Figure 5.1 (a), the intensities corresponding to the local maxima wavelengths are
as follows: Red (3267 @ 612nm), Green (3647 @ 547nm), and Blue (2911 @ 460nm).
On the other hand, the intensities corresponding to the local maxima wavelengths in (b)
are: Red (8104 @ 633nm), Green (5297 @ 521nm), and Blue (5729 @ 464nm). The total
brightness o f white generated by the white LEDs is noticeably on an average less than the
total brightness o f white generated by RGB since intensity o f white in the display
prototype used can not be treated as separate from intensity o f red LEDs. Furthermore,
the intensity distribution among the various wavelengths differs slightly which results in
a variation o f the white perceived from the two different sources; even though both are
perceived as white. This has an effect on the rest o f the experimental measurements. The
light spectra for three different colors Navy blue, light blue, and Yellow were also
measured using RGBW and RGB configuration and are shown in Figures 5.2-4. Also
numerical data o f peak intensities o f the R, G and B with RGBW and RGB
configurations are presented in Table 1 confirm our results.
72

fSçS 8000
.é'g 6000
4000
2000
0
/ \ :
400 450 500 550 600
Wavelength (nm)(a)
650 700
12000
lOOOO
8000
6000
A 4000
2000
400 650500 700450 600
Wavelength (mn)(b)
Figure 5.2. Spectrum of Navy Blue using (a) RGBW and (b) RGB
73

12000
^ 6000
►5 4000
2000
650400 700500 550 600450
Waveleiigdi (mn)(a)
12000
10000
5 6000
►=3 4000
2000
650400 700500 550 600450
Wavelength (mn)(b)
Figure 5.3. Spectrum o f Light Blue using (a) RGBW and (b) RGB
74

12000
10000
6000
4000
2000
650400 500 700450 600
W avelength (mn)
(a)
W avelength (mn)
(b)
Figure 5.4. Spectrum of Yellow using (a) RGBW and (b) RGB
12000
iOOOO
5 6000
I 4000
2000
400 650500 700450 600
75

Table 5.1. Peak intensities in radiant flux units corresponding to R (612nm), G (547nm) and B(460nm) for RGB and RGBW configurations.
Navy]Blue Light Rue YellowRGBW RGB RGBW RGB RGBW RGB
R 2471 2910 1742 2330 7018 7621G 1742 2176 4642 4863 4480 5321B 5286 5341 5397 5870 1742 2078
Table 5.1 shows the monochromatic intensity measurements at the primary colors for
RGB and RGBW. These values are obtained from the spectrometer readings shown in
Figures 5.2 - 5.4. From the figures, it is clear that the intensity spectrum distributions of
the measured colors are very similar in wave form. The values in Table 5.1 demonstrate
the colors to have the same proportions among the monochromatic waves for every
primary color (RGB) which shows that the colors displayed using RGB have the same
hue as the colors displayed using RGBW; however, it is noticeable that the overall
intensity o f the spectra exhibits a small difference between the RGB and RGBW. This is
due to the architecture o f the prototype, which does not allow a separate cahbration
control for the white LEDs.
5.2 Human Perception Experiments
5.2.1 Experimental Procedure
This part o f the study required a special approval (refer to Appendix II) since human
subjects were involved. In order to test how people perceive the difference between the
old (RGB) and the new (RGBW) LED display architectures, it was necessary to conduct
76

an experimental survey involving a sample o f people. To obtain the approval, the
Institutional Review Board (IRB) reviews the research project which involves human
subjects to ensure subjects are not at unjustified risk and that test subjects are given
informed consent at the time o f participation. Furthermore, researches have to undergo
IRB training through the collaborative institutional training initiative (CITI) which offers
different types o f training. This requirement is designed to provide information and
guidance to researchers in order to minimize risks.
Subjects were selected at random; recruiting was done at UNLV, an educational
institution; therefore, majority o f subjects were students between the ages o f 18 and 30.
Vast majority o f students were willing to take the survey directly after briefly explaining
to them about the experiment. They were told that they would have to compare colors
displayed using an LED display and make a note o f differences they notice. Upon their
arrival to the laboratory were the experiment was conducted, more detailed instructions
were given to them as well as a handout that contains detailed directions (refer to
Appendix III for the informed consent), the approval and the survey questions (refer to
Appendix IV).
Twelve pairs o f different colors were tested. The colors fall into three groups, gray
scale, low saturation, and high saturation. Every subject was shown pairs o f colors and
asked to determine whether the colors are:
(a) Identical = 98% or more similarity
(b) Almost the same = 90% or more similarity (the same hue)
(c) Not the same at all = less than 90%
(d) Unsure
77
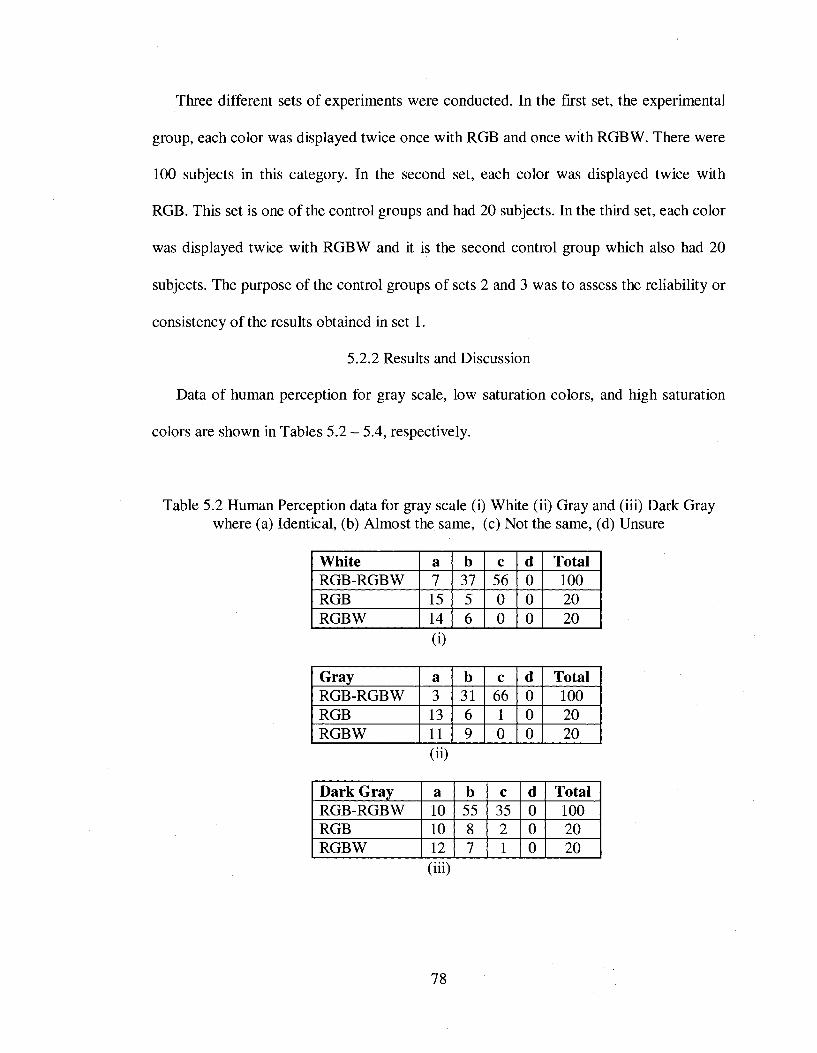
Three different sets o f experiments were conducted. In the first set, the experimental
group, each color was displayed twice once with RGB and once with RGBW. There were
100 subjects in this category. In the second set, each color was displayed twice with
RGB. This set is one o f the control groups and had 20 subjects. In the third set, each color
was displayed twice with RGBW and it is the second control group which also had 20
subjects. The purpose of the control groups o f sets 2 and 3 was to assess the reliability or
consistency o f the results obtained in set 1 .
5.2.2 Results and Discussion
Data o f human perception for gray scale, low saturation colors, and high saturation
colors are shown in Tables 5.2 - 5.4, respectively.
Table 5.2 Human Perception data for gray scale (i) White (ii) Gray and (iii) Dark Gray where (a) Identical, (b) Almost the same, (c) Not the same, (d) Unsure
W hite a b c d T otalRGB-RGBW 7 37 56 0 1 0 0
RGB 15 5 0 0 2 0
RGBW 14 6 0 0 2 0
(i)
G ray a b c d TotalRGB-RGBW 3 31 6 6 0 1 0 0
RGB 13 6 I 0 2 0
RGBW 1 1 9 0 0 2 0
(ii)
D ark G ray a b c d T otalRGB-RGBW 1 0 55 35 0 1 0 0
RGB 1 0 8 2 0 2 0
RGBW 1 2 7 1 0 2 0
(iii)
78

In the experiment involving gray scale, it appears that most subjects perceived colors
to be not the same. For the same reasons mentioned in section 5.1 which confirms the
data obtained from the spectrometer. Due to the architecture o f the prototype, which does
not allow a separate calibration control for the white LEDs, gray scale shows the most
inconsistent data.
Table 5.3 Human Perception data for low saturated colors (i) Purple (ii) Purplish Blue (iii) Medium Green and (iv) Yellow where (a) Identical, (b) Almost the same, (c) Not
the same, (d) Unsure.
Purple a b c d TotalRGB-RGBW 10 72 18 0 100RGB 6 10 4 0 20RGBW 13 6 I 0 20
(i)
Purplisb Blue a b c d TotalRGB-RGBW 16 65 19 0 100RGB 1 1 9 0 0 20RGBW 13 7 0 0 20
(ii)
Medium Green A b c d TotalRGB-RGBW 25 68 7 0 100RGB 12 8 0 0 20RGBW 14 6 0 0 20
(iii)
Yellow a b c d TotalRGB-RGBW 15 68 17 0 1 0 0
RGB 1 2 8 0 0 2 0
RGBW 13 6 1 0 2 0
(iv)
Most subjects found low saturated colors to be almost the same. Keeping in mind that
79

low saturation is equivalent to a high white value in the color, it is expected o f test
subjects to notice a minor difference between the RGB and RGBW colors.
Table 5.4 Human Perception data for high saturated colors (i) Rose (ii) Violet (iii) Cyan (iv) Green and (v) Orange where (a) Identical, (b) Almost the same, (c) Not the
same, (d) Unsure
Rose a b c d TotalRGB-RGBW 59 39 2 0 100RGB 12 8 0 0 20RGBW 12 8 0 0 20
(i)
(ii)
(iii)
(iv)
Violet A b c d TotalRGB-RGBW 62 36 2 0 100RGB 10 9 1 0 20RGBW 15 5 0 0 20
Cyan A b c d TotalRGB-RGBW 73 26 1 0 100RGB 13 7 0 0 20RGBW 16 4 0 0 20
Green A b c d TotalRGB-RGBW 48 52 0 0 100RGB 15 4 1 0 20RGBW 16 4 0 0 20
Orange A b c d TotalRGB-RGBW 35 61 4 0 100RGB 10 9 1 0 20RGBW 17 3 0 0 20
( V )
M ost subjects found high saturated colors to be identical or almost the same. On the
contrary o f low saturation, high saturation means a low white value in the color;
80

therefore, it is expected o f test subjects to hardly notice any difference between the RGB
and RGBW colors.
5.2.3 Statistical Analysis
5.2.3.1 Theory o f Statistical Analysis
The binomial probability model is appropriate for the data collected from
Experiments 1, 2, and 3, as the following will show. Let X denote the number o f subjects
out o f Nj for Experiment j (j = 1, 2, 3) who thought that the colors produced were
‘Identical or Almost the Sam e’. The probability distribution o f X then can be modeled by
the binomial probability distribution:
P{X =x ) = M p j (l - pj , jc = 1,2,..., A (5 .1 )v- y
where pj is the proportion o f subjects in the population who think that the colors
produced in two trails are ‘identical or almost the same’. The population proportion pj is
estimated by the sample proportion
(5.2)
where xj is the number o f subjects who thought the colors in two trials were identical, for
experiment j (j = 1, 2, 3). Confidence intervals for pj can be computed using the following
approximate formula for 95% confidence:
I p , ( i - p . )pj(95%Confidence —Intervals) = p j± \ .9 6 x I— —— (5.3)
Exact confidence intervals can also be calculated using the software package
MINITAB. The later approach is used in this work. The 95% confidence interval for pj
81
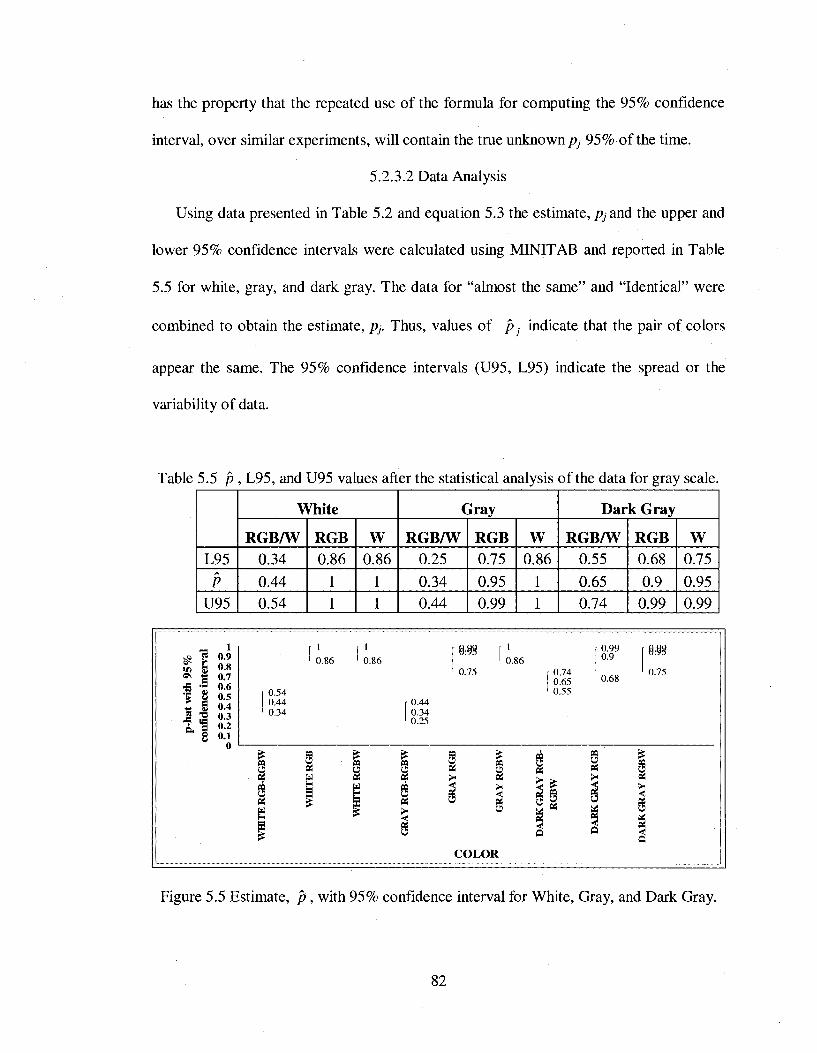
has the property that the repeated use o f the formula for computing the 95% confidence
interval, over similar experiments, will contain the true unknown pj 95% o f the time.
5.2.3.2 Data Analysis
Using data presented in Table 5.2 and equation 5.3 the estimate, and the upper and
lower 95% confidence intervals were calculated using MINITAB and reported in Table
5.5 for white, gray, and dark gray. The data for “almost the same” and “Identical” were
combined to obtain the estimate, pj. Thus, values o f p indicate that the pair of colors
appear the same. The 95% confidence intervals (U95, L95) indicate the spread or the
variability o f data.
Table 5.5 p , L95, and U95 values after the statistical analysis o f the data for gray scale.
White Gray Dark Gray
RGB/W RGB W RGB/W RGB W RGB/W RGB WL95 0.34 0 . 8 6 0 . 8 6 0.25 0.75 0 . 8 6 0.55 0 . 6 8 0.75
P 0.44 1 1 0.34 0.95 1 0.65 0.9 0.95U95 0.54 1 1 0.44 0.99 1 0.74 0.99 0.99
0.990.90.9
0.80.70.60.50.40.30.20.1
0.86 0.86 0.860.75 0.750.74
0.650.55
0.680.540.440.34
r 0.44 0.34
' 0.25
COLOR
Figure 5.5 Estimate, p , with 95% confidence interval for White, Gray, and Dark Gray.
82

It appears that white color created by RGB, as shown in Table and Figure 5.5, is
perceived the same as that by RGBW only to 44% ± 10% o f the subjects and only
34% ± 10% for gray. The reason for obtaining percentages below 50% stems from the
fact that the white LEDs in the prototype that was used for this experiment did not have
independent intensity control; thus, maintaining an equivalent intensity between the two
whites was a challenge. Since gray has low saturation, the amount o f white in it is fairly
high, which explains why the data is below 50%. For dark gray, however, the percentage
o f subjects that found the colors generated by RGB and RGBW to be the same
significantly increased to be 65% +9% /-10% since the white level decreases for high
saturated colors.
Table 5.6 p , L95, and U95 values after the statistical analysis o f the data for lowsaturated colors.
Purple Pur pie Blue Medium Green
RGB/W RGB W RGB/W RGB W RGB/W RGB WL95 0.73 0.56 0.75 0.72 0 . 8 6 0 . 8 6 0 . 8 6 0 . 8 6 0 . 8 6
P 0.82 0 . 8 0.95 0.81 1 1 0.93 1 1
U95 0.89 0.94 0.99 0.88 1 1 0.97 1 1
0.940 .8
0.90.80.70.60.50.40.30.20.1
0.86 0.86 0.86 0.860.73 0.72
0.56
C O L O R
Figure 5.6 Estimate, p , with 95% confidence interval for Purple, Purplish blue, andM edium Green.
83

As shown in Figure 5.2 and Figure 5.3, the percentages are dramatically improved
compared to the gray scale. 82% (+6 % 1-9%) of test subjects for purple, 81% (+7% 1-9%)
for purplish blue, and 93% (+4% 1-1%) for medium green found the difference between
RGB and RGBW to be “almost the same or identical”. This increase in percentage was
expected since adding the right amount o f white, as it was illustrated in the previous
chapter section 4.3, does not change the hue o f the perceived color.
Table 5.7 p , L95, and U95 values after the statistical analysis o f the data for yellow and
Yellow Rose Violet
RGB/W RGB W RGB/W RGB W RGB/W RGB WL95 0.74 0 . 8 6 0.75 0.93 0 . 8 6 0 . 8 6 0.93 0.75 0 . 8 6
P 0.83 1 0.95 0.98 1 1 0.98 0.95 1U95 0.89 1 0.99 0.99 1 1 0.99 0.99 1
I
1
0.90.8
t 0 7«. 5 0.6
S 0.5B01 0.4!BB 0.3Ou 0.2
0.1
0
j 1 1 1 8 ,# 90.890.83
1 0.93 1 0.93' 0.86 ' 0.86 0.86
0.74 0.75
8:3?
0.75
1
0.86
iii li><ii i=l ii i n
CfiH _
S Îi s
COLOR
Figure 5.7 Estimate, p , with 95% confidence interval for Yellow, Rose, and Violet.
The percentages for high saturated colors, as shown in Table 5.7-5 . 8 and Figure 5.7-
84

5.8, seem to be very promising obtaining more than 95%. It is shown that 98% (+0% /-
5%) o f test subjects for rose, 98% (+0% /-5%) for violet, 99% (+0% /-4%) for CYAN,
100% (+0% /-3%) for green, and 96% (+2% 1-6%) for orange found almost no difference
between the colors when displayed using RGB and RGBW. This indicates that it is very
difficult to differentiate between the two architectures (RGB and RGBW) for high
saturated colors since the amount o f white used in high saturated colors is minimal.
Table 5.8 p , L95, and U95 values after the statistical analysis o f the data for highsaturated colors
Cyan Green Orange
RGB/W RGB w RGB/W RGB W RGB/W RGB WL95 0.95 0 . 8 6 0 . 8 6 0.97 0.75 0 . 8 6 0.9 0.75 0 . 8 6
P 0.99 1 1 1 0.95 1 0.96 0.95 1U95 0.99 1 1 1 0.99 1 0.98 0.99 1
COLOR
Figure 5.8 Estimate, p , with 95% confidence interval for Cyan, Green, and Orange.
85

5.3 Energy Measurements and Calculations
5.3.1 Experimental Procedure
Since the power consumed is directly proportional to current supplied due to constant
voltage, twelve pairs o f different colors are tested. The colors are divided into three
groups gray scale, low saturation, and high saturation. For every pair, the current supplied
to the 8 x8 pixel display is measured twice once for RGB and once for RGBW.
5.3.2 Results and Discussion
The currents consumed by the 8 x 8 pixel LED display are measured for the twelve
pairs of colors using RGB and RGBW and listed in Table 5.9. It is noted that the current
values are in the range o f 0.63 - 1.78A where the highest values are consumed by white
and the lowest values by dark gray.
Table 5.9 Measured currents for RGB, RGBW
I (RGB) [A]
I (RGBW) [A]
White 1.78 0.91Gray 1.4 0.93Dark Gray 0 . 6 6 0.39Purple 1.32 0.88Purplish Blue 0.92 0.63Medium Green 1 . 2 1 0.7Yellow 1.27 0 . 8 6
Rose 1.06 0.91Violet 1.16 1.06Cyan 1.27 1.16Green 1.15 1
Orange 1.24 1.16
86

5.3.3 Data Analysis
The power consumed by the LED display, P, is given by:
P = V XI (5.4)
where V is the voltage supplied to the device, and I is the Current through the device. In
this study, the voltage o f operation used was 5v which is the required voltage by the
system.
The percentage o f power savings as a result o f using RGBW instead o f RGB, Pj, is
given by:
% Ps = (P rgb - P rgbw) / P rgb X 1 0 0 (5 .5 )
Table 5.10 Power consumed by pixels for RGB, RGBW and % power savings o f RGBWover RGB.
P (RGB) [W]
P(RGBW)[W]
P savings%
White 5.87 3.00 49Gray 4.62 3.07 34Dark Gray 2.18 1.29 41Purple 4.36 2.90 33Purplish Blue 3.04 2.08 32Medium Green 3.99 2.31 42Yellow 4.19 2.84 32Rose 3.5 3.00 14Violet 3.83 3.5 9Cyan 4.19 3.83 9Green 3.8 3.3 13Orange 4.09 3.83 6
Using the data reported in table 5.9 and the equations 5.4 and 5.5, P rg b , P rg b w , and
% Ps were calculated and reported in Table 5.10 for twelve colors. % power saving for
various eolors is plotted in Figure 5.9
87

60
50 -
40 -
30 - r -20 -
10
C O L O R
Figure 5.9 The % power savings for twelve eolors
The data presented in Figure 5.9 shows power savings that ranges between 30% and
50% for gray seale and low saturated eolors (purple, purplish blue, medium green, and
yellow). Power savings for high saturated eolors, sueh as rose, violet, cyan, green, and
orange, is much lower than power savings for the gray scale and the low saturated colors.
The low percentages for high saturated eolors stems from the fact that the compensating
white level o f sueh eolors is minimal. As expected, using the new RGBW pixel
architecture saves power in most eases, i.e., gray scale, high saturation, and low
saturation colors.
5.4 Colors from Display
Photographs were taken o f twelve different colors generated by RGB and RGBW and
are displayed next to one another in Figures 5.10-5.12. Photograph in (a) corresponds to
88

RGB and that in (b) corresponds to RGBW.
(i)
(ii)
(iii)
(a) (b)
Figure 5.10 A photograph of gray scale colors from (a) RGB (b) RGBW (i) white (ii)gray (iii) dark gray.
For the photograph of gray scale shown in Figure 5.10, it is noted that colors
displayed with RGB seem to be slightly brighter than colors displayed with RGBW. This
is due to the fact that the white generated from RGB and the white generated from
RGBW are some what different as seen in the spectrometer reading in Figure 5.1.
Column (a) seems to be brighter than (b).
89

(i)
(ü)
(Hi)
(iv)
(a) (b)
Figure 5.11 A photograph o f low saturated colors from (a) RGB (b) RGBW (i) purple (ii) purplish blue (iii) medium green (iv) yellow.
Low saturated colors are shown in Figure 5.11. Photographs for RGB and RGBW for
all colors appear to be very close; however, it is noticeable that column (a) is brighter
than column (b) since the component o f white is high in low saturated colors. A
photograph o f high saturated colors is shown in Figure 5.12. Colors in this photograph
are also indistinguishably similar since the white component is low for this category o f
90

colors.
(i)
(ii)
(iii)
(iv)
(v )
(b) (b)
Figure 5.12 A photograph o f high saturated colors from (a) RGB (b) RGBW (i) rose (ii)violate (iii) cyan (iv) green (v) orange.
91

CHAPTER 6
CONCLUSIONS AND RECOMMENDATIONS
In this work, a novel pixel configuration RGBW, consisting o f red (R), green (G),
blue (B), and white (W) LEDs, was employed and investigated for color generation.
Energy consumption and various hues o f new pixels were compared to standard pixels
consisting o f RGB LEDs. Human perception experiments were conducted in order to
study the perceptual difference between the two architectures when colors are generated
using RGBW vs. RGB. Various experimental approaches were considered such as
spectrometric readings, human perception experiment, and theoretical analysis in order to
verify that the hue is maintained with the new architecture. The spectrometer reading has
shown that the spectrum of the colors generated using RGB and RGBW are similar.
Furthermore, statistics has shown that 44% of test subjects found the colors in gray scale
to be the same, whereas 82% and 95% of test subject found low saturated colors and high
saturated colors, respectively, to be identical. Theoretical analysis o f the new RGBW
pixel based on fundamentals o f color theory has shown that using RGBW will not change
the hue when it replaces RGB. Real life captions were included demonstrating that the
colors are almost indistinguishable. Power measurements for an 8 x8 pixel LED display
has demonstrated power savings, in all cases, using RGBW. The percentage o f saved
power, however, differed from one case to another, for instance using RGBW as an
92

alternative achieved up to 49% power savings for gray scale, over 30% power savings for
low saturated colors, and up to 12% for high saturated colors. M ost colors have witnessed
over 30% power savings.
Future research may include:
• Using the white LED in the pixel along with the RGB in order to create a brighter
and sharper image.
• Testing efficiency and perception o f real video using RGB and RGBW.
• The resolution o f the RGBW LED display can improve by studying different
LED configurations for pixels such as RGB surrounding the white LED.
• Using the centered triangle configuration o f RGBW with a white LED at the
center o f an equilateral triangle and study its performance against square
configuration studied in this thesis.
93

APPENDIX I
AHDL CODE OF THE SOFTWARE IM PLIMENTATION
SUBDESIGN HVsync (
Clk, q[9..0] -.INPUT;HSyncIn, Hbik, Vs, Vblk, Vcnt[9..0], HBlankg : OUTPUT;VBlankg :OUTPUT;
)variable
Hsff, Hblank, Vsff, Vblank, Shb, Svb, Shbg, Svbg :JKFF; vcount[9..0] :DFF;
begin
Hsff.clk = Clk;Hsff.j = q[] == 736;Hsff.k = q []= = 7 8 1 ;
Hblank.clk = Clk;Hblank.j = q[] == 0;Hblank.k = q[] == 720;
Shb.clk = ClkShb.j = q[] == 360Shb.k = q[] == 376
Shbg.clk = Clk;Shbg.j = q[] == 362;Shbg.k = q[] == 370;
HSyncIn = IHsff;%Hblk = Hblank ;%
94

HblkHBlankS
vcount[].clk = if vcount[] = vcount[] else vcount[].d end if;
Vsff.clkVsff.jVsff.k
Vblank.clk =Vblank.j =Vblank.k =
Svb.clkSvb.j =Svb.k
SvbS.cIkSvbS.jSvbS.k =
Vs%HblkVblkVBlankS
Vcnt[] =
end;
Shb;ShbS;
Hsff;= 525 then
= 0;: vcount[].q + 1 ;
Hsff;vcountvcount
Hsff;vcountvcount
vcountvcount
vcountvcount
== 495; == 498;
== 0; == 479;
Hsff;== 240; == 256;
Hsff;== 244; == 252;
Vsff; Vblank; % Svb;
SvbS;
Vcount[];
SUBDESIGN VChbvbGEN (
- {{ ALTERA_I0_BEGIN} } DO NOT REMOVE THIS LINE! VCclk : INPUT;VCHsync : INPUT;VCVsync : INPUT ;VCCblank : OUTPUT;VCcnth[9..0] : OUTPUT;VCcntv[9..0] ; OUTPUT;- {{ALTERA_IO_END}} DO NOT REMOVE THIS LINE!
95

variable
cnth[9..0]cntv[9..0]blankhblankv
dff;dff;jkff;jkff;
begin
cnth[].clk = VCclk; cnth[].clrn = VCHsync; cnth[].d = cn th [].q+ l;
VCcnth[9..0] = cnth;
blankh.clkblankh.jblankh.k
= VCclk;= cnth[] == 362; = cnth[] == 370;
end;
cntv[].clkcntv[].d
= VCHsync; = cntv[].q + l;
cntv[].Glrn = VCVsync;
VCcntv[9..0] = cntv;
blankv.clkblankv.jblankv.k
= VCHsync;= cntv[] == 244; = cntv[] == 252;
VCCblank = blankv and blankh;
SUBDESIGN Condottal (
- {{ALTERA_IO_BEGIN}} DO NOT REMOVE THIS LINE!addressO : INPUT;address 1 : INPUT;address2 : INPUT ;address3 : INPUT ;address4 : INPUT ;address5 : INPUT;sw l7 : INPUT ;addrout[5..0] : OUTPUT ;
96

- {{ALTERA_IO_END}} DO NOT REMOVE THIS LINE!)
Beginif sw l7 == 1 then
addrout[5..0] = address[5..0];else
addrout[5..0] = 56;end;
—if sw l7= = l thenaddrout[5..0] = address[5..0];
—end;
End;
SUBDESIGN EnableGen(
- {{ALTERA_IO_BEGIN}} DO NOT REMOVE THIS LINE! HSync : INPUT;VSync : INPUT ;Clk : INPUT;Vcnt[9..0] : INPUT; q[9..0] : INPUT;DPst2rdEn : OUTPUT;FIFOrdEn : OUTPUT;D Pstlw rEn ; OUTPUT;D PstlrdEn : OUTPUT;LEDisp : OUTPUT;OEDisp : OUTPUT;BitSel[2..0] : OUTPUT;- {{ALTERA_IO_END}} DO NOT REMOVE THIS LINE!
)
variable
counth[9..0], countv[9..0], FIFOrd, delay 1, D Pstlrd , DPst2rd, LEDispd,OEDispd, BitSelC[2..0] :dff;FIFOrdh, FIFOrdv, D Pstlrdh, D Pstlrdv, DPst2rdh, DPst2rdv, LEDispdh, LEDispdv, OEDispdh, OEDispdv :jkff;
begin—Main counters
97

—counth[].clk = Clk;—counth[].clrn= HSync;—counth[].d = counth[].q + 1 ;
—countv[].cIk = HSync;—countv []. clrn = ! VS ync ;—countv[].d = countv[].q + 1 ;
BitSelC[].clk = Clk;
if Vcnt[] >= 1 and Vcnt[] < 3 then BitSelC[].d = 0;
elsif Vcnt[] >= 3 and Vcnt[] < 6 then B itSelC [].d= 1;
elsif Vcnt[] >= 6 and Vcnt[] < 11 then BitSelC[].d = 2;
elsif Vcnt[] >=11 and Vcnt[] < 20 then BitSelC[].d = 3;
elsif Vcnt[] >= 20 and Vcnt[] < 37 then BitSelC[].d = 4;
elsif Vcnt[] >= 37 and Vcnt[] < 71 then BitSelC[].d = 5;
elsif Vcnt[] >= 71 and Vcnt[] < 139 then BitSelC[].d = 6 ;
elsif Vcnt[] >= 139 and Vcnt[] < 273 then BitSelC[].d = 7;
end if;
BitSel = BitSelC;
FIFOrdh.clk = Clk;—FIFOrdh.clrn= HSync;FIFOrdh. j = q[] == 400;FIFOrdh.k = q[] == 464;
98

FIFOrdv.clk = IHSync;—FIFOrdv.clrn= !VSync;FlFOrdv.j = Vcnt[] == 255;FIFOrdv.k = Vcnt[] == 256;
FIFOrd.clk = Clk;FIFOrd.d = FIFOrdh and FIFOrdv;
FIFOrdEn = FIFOrd;
delay 1 . clk Clk;delay l.d = FIFOrd;
D Pstlw rEn = delay 1 ;
D Pstlrdh. clk = Clk;—D Pstlrdh. clrn = HSync;D Pstlrdh.j = q[] ==471;D Pstlrdh.k = q[] == 599;
D Pstlrdv.clk = IHSync;—D Pstlrdv.clrn = !VSync;D Pstlrdv.j = Vcnt[] == 256;D Pstlrdv.k = Vcnt[] == 257;
DPstlrd.cIk — Clk;D Pstlrd .d = D Pstlrdh and D Pstlrdv;
D PstlrdEn = D Pstlrd ;
D Pst2rdh.dk = Clk;—DPst2rdh.clrn = HSync;DPst2rdh.j = q[] == 1 ;DPst2rdh.k = q[] == 33;
LED ispdh.dk = Clk;—LEDispdh.drn = HSync;LEDispdh.j = q[] == 137;LEDispdh.k = q[] == 138;
OEDispdh.clk = Clk;
99

—LEDispdh.clrn = HSync;OEDispdh.j q[] == 0 ;OEDispdh.k = q[] == 858;
-BitO
D Pst2rdv.dk = IHSync;—DPst2rdv.drn = IVSync;DPst2rdv.j = Vcnt[] == 1;DPst2rdv.k = Vcnt[] == 2;
LEDispdv.dk = IHSync;—LED ispdv.drn = IVSync;LEDispdv.j = Vcnt[] == 1;LEDispdv.k = Vcnt[] == 2;
O ED ispdv.dk = IHSync;—LED ispdv.drn = IVSync;OEDispdv.j = Vcnt[] == 2;OEDispdv.k = Vcnt[] == 3;
—B itl
D Pst2rdv.dk = IHSync;—D Pst2rdv.drn = IVSync;DPst2rdv.j = Vcnt[] == 3;DPst2rdv.k = Vcnt[] == 4;
LED ispdv.dk = IHSync;—LED ispdv.drn = IVSync;LEDispdv.j = Vcnt[] == 3;LEDispdv.k = Vcnt[] == 4;
O ED ispdv.dk = IHSync;—LED ispdv.drn = IVSync;OEDispdv.j = Vcnt[] == 4;OEDispdv.k = Vcnt[] == 6 ;
100

-B it2
DPst2rdv.clk = IHSync;—DPst2rdv.clrn = IVSync;DPst2rdv.j = Vcnt[] == 6 ;DPst2rdv.k = Vcnt[] == 7;
LED ispdv.dk = IHSync;—LED ispdv.drn = IVSync;LEDispdv.j = Vcnt[] == 6 ;LEDispdv.k = Vcnt[] == 7;
O ED ispdv.dk = IHSync;—LED ispdv.drn = IVSync;OEDispdv.j = Vcnt[] == 7;OEDispdv.k = V c n t[ ]= = ll ;
—Bits
D Pst2rdv.dk = IHSync;—D Pst2rdv.drn = IVSync;DPst2rdv.j = Vcnt[] = = 11;DPst2rdv.k = Vcnt[] == 12;
LEDispdv.dk = IHSync;—LED ispdv.drn = IVSync;LEDispdv.j = V c n t[ ]= = ll ;LEDispdv.k = Vcnt[] == 12;
OED ispdv.dk = IHSync;—LED ispdv.drn = IVSync;OEDispdv.j = Vcnt[] == 12;OEDispdv.k = Vcnt[] == 20;
—Bit4
101

DPst2rdv.clk = IHSync;—DPst2rdv.clrn = IVSync;DPst2rdv.j = Vcnt[] == 20;DPst2rdv.k = V cn t[]= = 21 ;
LEDispdv.dk = IHSync;—LED ispdv.drn = IVSync;LEDispdv.j = Vcnt[] == 20;LEDispdv.k = V cn t[]= = 21 ;
O ED ispdv.dk = IHSync;—LED ispdv.drn = IVSync;OEDispdv.j = Vcnt[] == 21;OEDispdv.k = Vcnt[] == 37;
—Bits
D Pst2rdv.dk = IHSync;—D Pst2rdv.drn = IVSync;DPst2rdv.j = Vcnt[] == 37;DPst2rdv.k = Vcnt[] == 38;
LED ispdv.dk = IHSync;—LEDispdv.drn = IVSync;LEDispdv.j = V cn t[]= = 37 ;LEDispdv.k = Vcnt[] == 38;
O ED ispdv.dk = IHSync;—LEDispdv.drn = IVSync;OEDispdv.j = Vcnt[] == 38;OEDispdv.k = V cn t[]= = 71 ;
—Bit6
D Pst2rdv.dk = IHSync;—DPst2rdv.drn = IVSync;
102

D Pstlrdv.j = V cn t[]= = 71 ;D Pstlrdv.k =. Vcnt[] == 72;
LED ispdv.dk = IHSync;—LED ispdv.drn = IVSync;LEDispdv.j = V cn t[]= = 71 ;LEDispdv.k = Vcnt[] == 72;
OED ispdv.dk = IHSync;—LED ispdv.drn = IVSync;OEDispdv.j = Vcnt[] == 72;OEDispdv.k = Vcnt[] == 139;
—Bit?
D Pst2rdv.dk = IHSync;—D Pstlrdv.clrn = IVSync;D Pstlrdv.j = Vcnt[] == 139;D Pstlrdv.k = Vcnt[] == 140;
LED ispdv.dk = IHSync;—LED ispdv.drn = IVSync;LEDispdv.j = Vcnt[] == 139;LEDispdv.k = Vcnt[] == 140;
O ED ispdv.dk = IHSync;—LEDispdv.drn = IVSync;OEDispdv.j = Vcnt[] == 140;OEDispdv.k = Vcnt[] == 273;
D Pst2rd.dk Clk;D Pstlrd .d = D Pstlrdh and D Pstlrdv;D PstlrdEn = D Pstlrd;
LEDispd.clkLEDispd.dLEDispOEDispd.clk
Clk;LEDispdh and LEDispdv; = LEDispd;Clk;
103

OEDispd.d = OEDispdh and OEDispdv;OEDisp = OEDispd;
end;
104

APPENDIX II
BIOMEDICAL IRB - EXPEDITED REVIEW APPROVAL NOTICE
N O T IC E TO A L L R E SE A R C H E R S:P lease be aw are tha t a p ro to co l v io la tion (e.g., fa ilu re to su b m it a m od ifica tion fo r a n y change) o f an IR B a p p ro ved p ro to co l m ay resu lt in m anda tory rem edia l education, add itiona l audits, re -consen ting subjects, researcher p ro b a tio n su spension o f any research p ro to co l a t issue, su spension o f add itio n a l ex is ting research pro toco ls, inva lida tion o f a ll research co nduc ted under the research p ro to co l a t issue, a n d fu r th e r appropria te consequences a s d e te rm in ed b y the IR B a n d the In s titu tiona l O fficer.
DATE: July 9, 2008
TO: Dr. Rama Venkat, Electrical and Computer Engineering
FROM: O ffice for the Protection o f Research Subjects
RE: N otification o f IRB A ction by Dr. John Mercer, ChairProtocol Title: U niversity o f N evada Light Em itting D iode D isplay Engineering (N Y ) Protocol #: 0805-2740
This memorandum is notification that the project referenced above has been review ed by the U N L V B iom edical Institutional R eview Board (IRB) as indicated in regulatory statutes 45 CFR 46. The protocol has been review ed and approved.
The protocol is approved for a period o f one year from the date o f IRB approval. The expiration date o f this protocol is July 6, 2009. W ork on the project m ay begin as soon as you receive written notification from the O ffice for the Protection o f Research Subjects (GPRS).
PLEA SE NOTE:A ttached to this approval notice is the official Informed C onsent/A ssent (IC/IA) Form for this study. The IC/IA contains an official approval stamp. O nly copies o f this official IC/IA form m ay be used when obtaining consent. P lease keep the original for your records.
Should there be any change to the protocol, it w ill be necessary to subm it a M odification Form through OPRS. N o changes may be made to the existing protocol until m odifications have been approved by the IRB.
Should the use o f human subjects described in this protocol continue beyond July 6, 2009 it would be necessary to subm it a Continuing R eview R equest Form 60 days before the expiration date.
I f you have questions or require any assistance, p lease contact the O ffice for the Protection o f Research Subjects at OPRSH um anSubiects@ unlv.edu or call 895-2794.
105

APPENDIX III
INFORMED CONSENT
9C FJJ.B R A T IN G FIFTY YEARS
IN FO R M ED C O N SE N T
Department o f Electrical and Computer Engineering
TITLE OE STUD Y: U n iversity of N e v a d a Light Em itting D iod e D isp lay E n g in eer in g (NV)
IN VESTIG ATO R (S): Dr. Rama Venkat
Contact Phone Number: 895-1094
Purpose o f the StudvYou are invited to participate, in a research study. The purpose o f this study is to obtain data “how human beings perceive a variety o f colors generated by two methods o f LED Display lighting (Ref-Green-Blue (RGB) & Red-Green-Blue-W hite (RGBW ))”.
ParticipantsYou are being asked to participate in the study because the quality o f display is a perceived characteristics and hence data based on human perception is absolutely necessary. I f you know that you are color-blind, please let us know as the research involves viewing various colors generated by two different technologies we are comparing.
ProceduresI f you volunteer to participate in this study, you w ill be asked to do the follow ing:
• S it 5 feet aw ay from a 6 inch x 6 inch w hite screen w here sam e color from tw o different technologies and som etim es the sam e technology w ill be displayed. Som e o f you w ill be assigned to the control group and others to experim ental group. You w ill not know w hich group you belong to. Only the researcher w ill know.
• Observe the color and record on a form if the colors are:o (i) identical o (ii) alm ost the sam e o (iii) not at all the same.
• I f you are not sure, then you can ask the researcher to repeat the procedure for another v iew ing o f
106

the colors.• I f you are uncomfortable with v iew ing the colors or any other part o f the experim entation, you can
withdraw by letting the researcher know.
Benefits o f ParticipationThere may not be direct benefits to you as a participant in this study. H ow ever, w e hope to leant if the new technology w e are developing, which w e know saves energy, provides the sam e quality o f colors in a display.
Risks o f ParticipationThere are risks involved in all research studies. This study may include only minim al risks. State the level o f anticipated risks (i.e. you may becom e uncom fortable when answering som e questions). T e study involves minimal risk only as the subjects w ill be v iew ing colors o f sam e brightness as they see in real life. At any tim e during the experim entation, i f the subject is uncomfortable and does not want to continue, he/she can withdraw by letting the researcher know.
Cost /C om pensation
There will not be financial cost to you to participate in this study. The study will take 30 minutes o f your time. You will not be compensated for your time.
Contact InformationIf you have any questions or concerns about the study, you m ay contact Dr. Rama Venkat at 895 1094. For questions regarding the rights o f research subjects, any com plaints or com m ents regarding the manner in w hich the study is being conducted you m ay contact the U N L V O ffice for the Protection o f Research Subjects at 702-895-2794 .
Voluntarv ParticipationYour participation in this study is voluntary. You may refuse to participate in this study or in any part o f this study. You may withdraw at any time without prejudice to your relations with the university. You are encouraged to ask questions about this study at the beginning or any time during the research study.
ConfidentialitvA ll information gathered in this study w ill be kept com pletely confidential. N o reference w ill be m ade in written or oral materials that could link you to this study. All records w ill be stored in a locked facility at U N L V for at least 3 years after com pletion o f the study. After the storage tim e the information gathered w ill be deleted.
Participant Consent:
I have read the above information and agree to participate in this study. I am at least 18 years o f age. A copy o f this form has been given to me.
Signature o f Participant D ate
Participant N am e (Please Print)
P a rtic ip a n t N ote: P lease d o no t sign this do cu m en t i f the A p p ro va l S tam p is m issing o r is expired.
107

APPENDIX IV
HUMAN EXPERIM ENT QUESTIONNAIRE
Questionnaire for the SubjectsPart 1
Tes” or “No” for the following questions.1. Are you 18 years or older (adult)? Yes No2 . Are you color-blind (if know)? Yes No3. Are you sensitive to any colors? Yes No4. Are you sensitive to normal day-to-day light intensity? Yes No
Part 2For each pair of colors that you are asked to view, please circle the appropriate answer of the three choices. If you are not sure, please ask the researcher to repeat the experiment.Pair 1Describe color 1 : ______________________________Describe color 2 : ______________________________Compare the colors:
a. Identicalb. Almost the samec. Not at all the samed. Unsure
Pair 2Describe color 1 :______________________________Describe color 2 : ______________________________Compare the colors:
a. Identicalb. Almost the samec. Not at all the samed. Unsure
Pair 3Describe color 1 : ______________________________Describe color 2 : ______________________________Compare the colors:
108

a. Identicalb. Almost the samec. Not at all the samed. Unsure
Pair 4Describe color 1 : Describe color 2:Compare the colors:
a. Identicalb. Almost the samec. Not at all the samed. Unsure
Pair 5Describe color 1 : Describe color 2:Compare the colors:
a. Identicalb. Almost the samec. Not at all the samed. Unsure
Pair 6Describe color 1 : Describe color 2:Compare the colors:
a. Identicalb. Almost the samec. Not at all the samed. Unsure
Pair 7Describe color 1 : Describe color 2:Compare the colors:
a. Identicalb. Almost the samec. Not at all the samed. Unsure
PairsDescribe color 1: Describe color 2;
109

Compare the colors:a. Identicalb. Almost the samec. Not at all the samed. Unsure
Pair 9Describe color 1: Describe color 2:Compare the colors:
a. Identicalb. Almost the samec. Not at all the samed. Unsure
Pair 10Describe color 1: Describe color 2:Compare the colors:
a. Identicalb. Almost the samec. Not at all the samed. Unsure
Pair 11Describe color 1: Describe color 2:Compare the colors:
a. Identicalb. Almost the samec. Not at all the samed. Unsure
Pair 12Describe color 1: Describe color 2:Compare the colors:
a. Identicalb. Almost the samec. Not at all the samed. Unsure
110

BIBLIOGRAPHY
[1] Souk, J.H., Jongseo Lee, “Recent Picture Quality Enhancement Technology Based on Human Visual Perception in LCD TVs”, Journal o f Display Technology, Volume 3, Issue 4, Pages: 371 - 376, Dec,2007.
[2] http://www.audiohoHcs.com/education/display-formatstechnology/displaj4echnologi- esguide-lcd-plasma-dlp-lcosd-ila-crt
[3] http://www.plasma.com/classroom/LCD_tv_versus_plasma_tv.htm
[4] http://www.unbeatable.co.uk/buyingguides/PlasmaVsLcd-Televisions/32.html
[5] Grantham K. H. Pang, Chi-Ho Chan, and Thomas T. O. Kwan , “Tricolor Light-Emitting Diode Dot Matrix Display System with Audio O utput” IEEE Transaction on Industry Applications, Volume. 37, No. 2, March/April 2001.
[6 ] Kohrou Takahashi, Nobujmki Tadokoro and Satoshi Takeuchi, “High Density LED Display Panel on Silicon M icroreflector and Integrated Circuit”, Electronic Manufacturing Technology Sym posium lSth lEEE/CPM TInternational, Page(s): 212-215, December 1995.
[7] R. E. Brown, “LED Displays Past, Present, Future”, IEEE Transactions on Consumer Electronics, Vol. CE-24, No. 3, August 1978.
[8 ] J. Wilson, J.F.B Hawkes, Optoelectronics, Prentice Hall, UK, 1989.
[9] http://www.lctecdisplays.com/TN_LCD_technology_side_2.asp
[10] http://www.mc2.chalmers.se/pl/lc/engelska/applications/Displays.html
[11] htpp://www.wtec.org/loyola/dsply_jp/c5_s2.html
[12] Chun-Ho Chen, Han-Ping D. Shieh, “Effects o f Backlight Profiles on Perceived Image Quality for High Dynamic Range LCDs”, Journal o f Display Technology, Volume. 4, No. 2, June 2008.
[ 13] http://compreviews.about.eom/od/multimedia/a/LCDSpecs.htm
[14] http://techgage.com/articles/displays/lcd-monitors/
111

[15] http://www.businessweek.eom/magazine/content/08_30/b4093044731823.htm
[16] http://www.ece.uiuc.edu/alumni/w02-03/plasma_history.html
[17] http://www.plasma-display-composition.svg
[18] Y. Kim, S. Park, “Simple driving waveform and circuit for plasma display”. Electronics Letters, Volume 44, Issue 9, Page(s):572 - 572 April 24, 2008.
[19] Dong-Myung Lee, Dong-Seok Hyun, “A New Driving Scheme for Plasma TVs Using M ulti-Functional Gate Driver”, IEEE Transactions on Consumer Electronics, Volume 53, Issue 4, Page(s):1553 - 1559, November 2007
[2 0 ] http://www.consumersearch.com/www/electronics/plasma-tv/
[2 1 ] http://palami.eu/screen-adv.html
[22] http://www.neutekled.com/cms/index.php?option=com_content&task=view&id=27- & Itemid =102
[23] http://www.coema.org.cn/E_LEDdisplay.htm
[24] Wyszecki & Stiles, Color Science, John Wiley, USA, 1967.
[25] http://www.northdevonhealth.nhs.uk/patientinformation/ophthalmology/understandi- ng_ c ataracts.htm.
[26] http://www.hamwaves.com/antennas/diel-rod.html.
[27] http://www.hyperphysics.phyastr.gsu.edu/hbase/vision/colper.html
[28] http://www.LightEmittingDiodes.org
[29] Williamson, Samuel J., Light and Color in nature and art, John Wiley, Canada.
[30] Marko Tkalcic, Jurij F. Tasic, “Colour spaces - perceptual, historical and applicational background”, EUROCON 2003. Computer as a Tool. The IEEE Region 8 ,Volume I, page(s): 304- 308, September 2003
[31] http://www.mathworks.com
[32] Gaurav Sharma, Digital Color Imaging Handbook, CRC Press, 2003
[33] http://www.cit.dixie.edu/vt/reading/gamuts.asp
[34] http://www.nichia.com
112

[35] Muthu, S., Schuurmans, F.J., Pashley, M.D. “Red, green, and blue LED based white light generation: issues and control” Industry Applications Conference, Volume 1, Issue Pages: 327 - 333, 2002.
[36] S.Muthu, F. Schuurmans, and M. Pashley, “Red, Green and Blue LEDs for white light illumination”, IEEE journal on selected topics in quatum electronics,pp. Vol. 8, No. 2, March/April 2002.
[37] STMicroelectronics, STP08CDC596 An 8-bit constant current LED sink driver with full outputs detection datasheet.
[38] Altera Corporation, DE2 Development and Education Board, User Manual version 1.4
[39] http://www.eecg.toronto.edu/~tm4/rgbout.html
[40] http://web.mit.edu/6.111 /www/s2004/NEW KIT/vga.shtml
113

VITA
Graduate College University o f Nevada, Las Vegas
Neveen Shlayan
Local Address:11101 Calder Ave Las Vegas, NV 89144
Degrees:Bachelor o f Science, Electrical Engineering, 2006 University o f Nevada, Las Vegas
Special Honors and Awards:Tan Beta Pi, Engineering honor society Cum Laude, Fall 2006 Best Engineering project award. Fall 2006 Outstanding ECE senior student. Fall 2006 D ean’s List award
Publications:A Novel RGBW Pixel for LED Displays, icseng,pp.407-411, 2008 19th International Conference on Systems Engineering, 2008
Review o f Packet Switching Technologies for Future NoC, icseng,pp.306-3II, 2008 19th International Conference on Systems Engineering, 2008
Thesis Title: A Novel RGBW Pixel for LED Displays
Thesis Examination Committee:Chairperson, Dr. Rama Venkat, Ph. D.Committee Member, Dr. Paolo Ginnobi, Ph. D.Committee Member, Dr. Emma Regentova, Ph. D.Graduate Faculty Representative, Dr. Mohamed Trabia, Ph. D.
114


![Interactive Public Ambient Displays: Transitioning from ...ravin/papers/uist2004_ambient.pdf · emphasis on evaluating non-pixel ambient displays. Kimura [15] is an augmented office](https://img.dokumen.tips/doc/110x75/5fb6eb298b876d489c389069/interactive-public-ambient-displays-transitioning-from-ravinpapersuist2004ambientpdf.jpg)