Embed Size (px)
Citation preview

1
A Novel Multi-Resolution Wavelet Transform forOnline Power Grid Waveform Classification
Shiyuan Wang, Student Member, IEEE, Payman Dehghanian, Member, IEEE, and Yingzhong Gu, Member, IEEE
Abstract—Power grid operation continuously undergoes sev-eral state transitions over time primarily driven by the internal(e.g., equipment failures) and external (e.g., weather-driven faults,and/or loading and generation variations) uncertainties. Thisengenders an observation of different types of waveforms at themeasurement points (substations) in power systems captured bythe phasor measurement units (PMUs) and intelligent electronicdevices (IEDs) embedded with PMU functionality, e.g., digitalrelays and fault recorders. The PMU should be, hence, equippedwith either one synchrophasor estimation algorithm (SEA) that isaccurate and robust to many different types of signals that may beinputted at different time intervals across the network, or shouldadaptively select the promising SEA, among an embedded suiteof algorithms, that can best capture an unfolding event. Thispaper suggests a novel wavelet transform, the pseudo continuousquadrature wavelet transform (PCQ-WT) algorithm, for onlinepower grid events and waveform classification, enabling designor selection of the right SEA when exposed to different events,thus resulting in a more accurate synchrophasor estimation andheightened situational awareness spatially and temporally. Testsignals generated from different prevailing events in the IEEE34-bus test system are applied to verify the robust performanceof the proposed classification approach.
Index Terms—Phasor Measurement Unit (PMU); Synchropha-sor Estimation Algorithm (SEA); Waveform classification;Wavelet transform.
I. INTRODUCTION
The wide deployment of the synchrophasor technology inrecent years has revolutionized the traditional measurementsetting in power grids into a new paradigm with high-resolution measurements via which an enhanced system-widesituational awareness is achieved. Synchrophasor measure-ments, captured across the network via phasor measurementunits (PMUs), have transformed many applications, e.g., powersystem model validation, state-estimation, dynamic stability,real-time monitoring, protection, and control of the grid,and post-event analysis, among many others [1]–[6]. IEEEstandard C37.118.1-2011 [7], has defined the expected PMUoutputs—i.e., magnitude, phase angle, frequency, and rateof change of frequency (ROCOF)—and their correspondingdesirable accuracy which have been deemed to be sufficientto capture the power grid steady-state and dynamic behaviourwhen transitioning through different operating states over time[8]. Depending on the type of the PMU, whether it is anM-Class with highly-accurate measurement requirements for
S. Wang and P. Dehghanian are with the Department of Electrical andComputer Engineering, The George Washington University, Washington, DC20052 USA (e-mail: [email protected]; [email protected]).
Y. Gu is with the GEIRI North America, San Jose, CA 95134 USA (email:[email protected]).
operation applications (e.g., state estimation) or P-Class withhigh-speed low-latency requirements for real-time protectionand control applications (e.g., fault detection and location),several algorithms have been proposed in the literature.
The synchrophasor estimation algorithms (SEA) are pri-marily driven by mathematical approximations, e.g., DiscreteFourier Transform (DFT) [9], Kalman filtering [10], adaptivefiltering [11], Newton approximations [12], zero-crossing tech-niques [13], phase locked loops (PLL) [14], and many othervariations of these algorithms. In most cases, and irrespectiveof the focused end-use applications, marketplace PMUs aretypically furnished with one of the above SEA tools, eachunleashing distinctive advantages and limitations, solely validto one or a few certain applications. Laboratory tests andfield observations have revealed how inefficient the PMUmeasurements could be if this ”one-size-fits-all” approachusing only one SEA is applied in the face of different operatingstates in the system to capture both static and dynamic featuresand peculiarities [15]–[17]. The growing demand for high-speed low-latency, and yet absolutely accurate, measurementsacross the grid calls for a more efficient mechanism that canselectively adapt to various evolving operating states by optingthe right SEA at the right time.
Recent research efforts have been directed toward dynamicSEA through time-domain signal processing techniques. Suchalgorithms, although revealing a promising performance underslow-transient conditions (e.g., modulation) [18], quite fail inthe presence of abrupt changes in the waveforms (e.g.,faults)[17]. In response, some references have proposed one singlePMU equipped with a suite of multiple algorithms inside, socalled P/M-Class PMU, which is deemed to be effective inresponse to various prevailing conditions in the grid. Suchan approach requires an advanced feature extraction andwaveform classification mechanism that can accurately captureand harness the signal peculiarities corresponding to differentevents and unfolding conditions, and subsequently a selectionmechanism to choose the best SEA within the PMU dependingon the focused application and the measurement performancerequirements over time.
Waveforms in power grid typically reveal a certain patternwith specific features and peculiarities driven by the systemoperating conditions. For instance, phasor magnitudes andphase angles go through step changes during faults [19]and the measurements can be noisy [10]. Unbalanced load,voltage surge or sag, harmonics, and frequency drift are alsocommon phenomena in electrical power networks [20]–[22].Many research efforts can be found in the literature on patternrecognition and waveform classification for power quality and
978-1-7281-1607-5/19/$31.00 c©2019 IEEE
2
fault analysis [23]–[28]. To the best of the authors’ knowl-edge, however, only a few have been focused on waveformclassification for PMU applications and online event detec-tion [3], [18]. In this paper, a pseudo continuous quadraturewavelet transform (PCQ-WT) is proposed dedicated to featureextraction and waveform classification of PMU input signalscoming from the power grid. The proposed PCQ-WT ensures afast feature extraction well within the standard requirements,wide range of frequency coverage through a reduced num-ber of scaling factors, and distinguished performance duringdifferent events. The performance of the proposed PCQ-WTapproach has been tested and verified under various spatiallyand temporally categorical conditions in a test system.
The rest of the paper is structured as follows. SectionII presents the problem statement on the waveform featureextraction and classification through various signal transformssuch as continuous wavelet transform (CWT) and the pseudo-continuous wavelet transform (PCWT). Section III introducesthe 1-D PCWT, and accordingly the novel PCQ-WT, withthe corresponding formulations. Numerical case studies andperformance evaluation results are reported in Section IV,followed by the conclusions in Section V.
II. WAVEFORM FEATURE EXTRACTION ANDCLASSIFICATION
Short-time Fourier transform (STFT) and continuouswavelet transform (CWT) are two most commonly used multi-resolution waveform classification techniques in many engi-neering disciplines [29], [30]. During the feature extractionprocess, both transforms require a window (buffer) of samplesand therefore, a latency effect indeed exists. Selection of aproper window size could minimize the latency effect, butat the cost of trading off the frequency resolution. Note thatthe frequency is actually estimated from the synchrophasors.With no additional latency, the classification will enable anadaptive selection of the SEA within a PMU, and hence, theinstantaneous synchrophasor measurement would be theoreti-cally ensured.
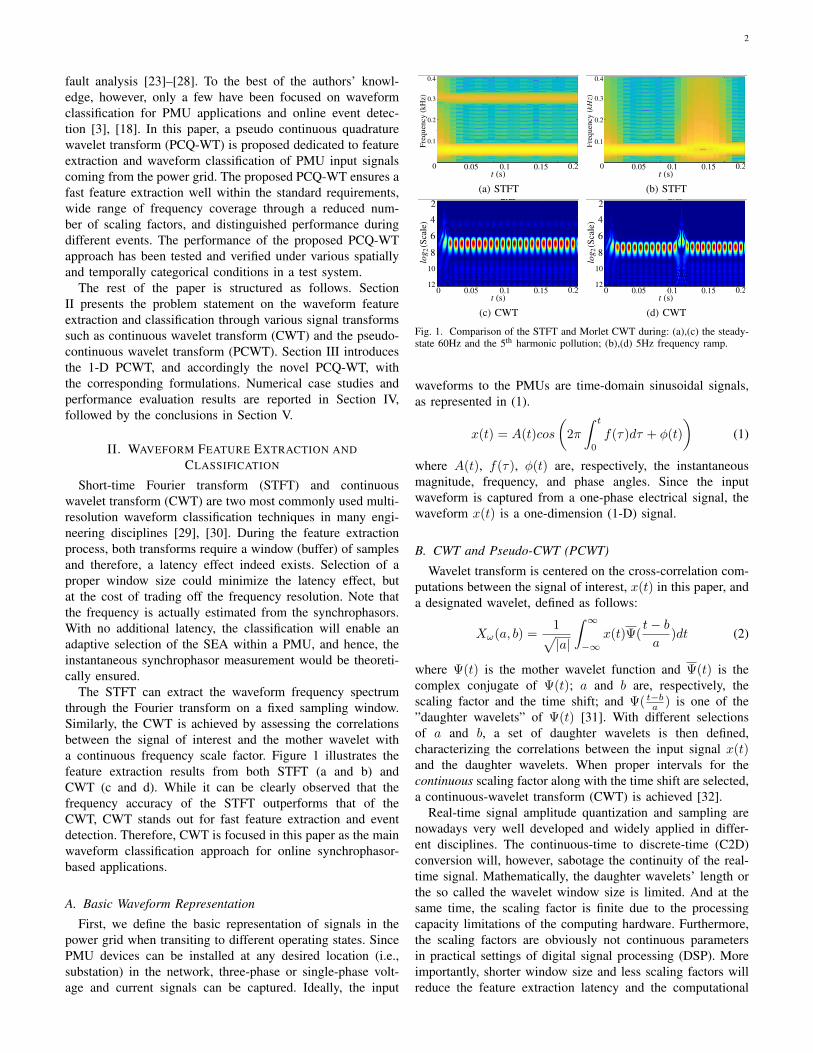
The STFT can extract the waveform frequency spectrumthrough the Fourier transform on a fixed sampling window.Similarly, the CWT is achieved by assessing the correlationsbetween the signal of interest and the mother wavelet witha continuous frequency scale factor. Figure 1 illustrates thefeature extraction results from both STFT (a and b) andCWT (c and d). While it can be clearly observed that thefrequency accuracy of the STFT outperforms that of theCWT, CWT stands out for fast feature extraction and eventdetection. Therefore, CWT is focused in this paper as the mainwaveform classification approach for online synchrophasor-based applications.
A. Basic Waveform Representation
First, we define the basic representation of signals in thepower grid when transiting to different operating states. SincePMU devices can be installed at any desired location (i.e.,substation) in the network, three-phase or single-phase volt-age and current signals can be captured. Ideally, the input
(a) STFT (b) STFT
(c) CWT (d) CWT
Fig. 1. Comparison of the STFT and Morlet CWT during: (a),(c) the steady-state 60Hz and the 5th harmonic pollution; (b),(d) 5Hz frequency ramp.
waveforms to the PMUs are time-domain sinusoidal signals,as represented in (1).
x(t) = A(t)cos
(2π
∫ t
0
f(τ)dτ + φ(t)
)(1)
where A(t), f(τ), φ(t) are, respectively, the instantaneousmagnitude, frequency, and phase angles. Since the inputwaveform is captured from a one-phase electrical signal, thewaveform x(t) is a one-dimension (1-D) signal.
B. CWT and Pseudo-CWT (PCWT)
Wavelet transform is centered on the cross-correlation com-putations between the signal of interest, x(t) in this paper, anda designated wavelet, defined as follows:
Xω(a, b) =1√|a|
∫ ∞−∞
x(t)Ψ(t− ba
)dt (2)
where Ψ(t) is the mother wavelet function and Ψ(t) is thecomplex conjugate of Ψ(t); a and b are, respectively, thescaling factor and the time shift; and Ψ( t−ba ) is one of the”daughter wavelets” of Ψ(t) [31]. With different selectionsof a and b, a set of daughter wavelets is then defined,characterizing the correlations between the input signal x(t)and the daughter wavelets. When proper intervals for thecontinuous scaling factor along with the time shift are selected,a continuous-wavelet transform (CWT) is achieved [32].
Real-time signal amplitude quantization and sampling arenowadays very well developed and widely applied in differ-ent disciplines. The continuous-time to discrete-time (C2D)conversion will, however, sabotage the continuity of the real-time signal. Mathematically, the daughter wavelets’ length orthe so called the wavelet window size is limited. And at thesame time, the scaling factor is finite due to the processingcapacity limitations of the computing hardware. Furthermore,the scaling factors are obviously not continuous parametersin practical settings of digital signal processing (DSP). Moreimportantly, shorter window size and less scaling factors willreduce the feature extraction latency and the computational
3
burden; however, the performance of the discrete wavelettransform must not be compromised comparing to the continu-ous time application. For all these reasons, the actual behaviorof the CWT is pseudo-continuous, even with less discretescaling factors used, but the performance needs to be closeto the discrete implementation of the CWT. Here, the pseudo-CWT (PCWT) is defined as
Xω[a, b] =1√|a|
W−1∑n=0
x[n]Ψ[nTs − b
a] (3)
where Ts is the sampling interval; W is the window length. Incontrast with the discrete wavelet transform (DWT)’s dyadicincrease of the scaling factor, the scaling factor increment inthe PCWT is preset to be linear, but still plotted in a reversed-dyadic format. The central frequency of the daughter wavelethas the following relationship with the scaling factor:
f = Fc/a (4)
where Fc is the central frequency of the mother wavelet [32].Hence, as a increases, the position of the WT output decreasesin the frequency domain. In order to match the frequencypositive increment along the Y-axis, all scales in WT plotsillustrate a descending trend in all figures.
C. PCWT’s Feature Extraction Mechanism
The proposed waveform classification approach is centeredon the extraction of distinct features in the input powerwaveform. To reveal the signal composition at any givenoperating condition, the ”frequency spectrum” or the PCWToutput must be featured with a redundant range in order toprovide sufficient pattern information. Therefore, in additionto the fundamental frequency, a proper selection of the centralfrequency and a sufficient length of the scaling factor arerequisite. Strict mathematical derivations are pursued to findthe central frequency Fc and the scaling factors. To serve theresearch focus on the feature extraction wavelet, Fc is chosenarbitrarily from a frequency range higher than the fundamentalfrequency, scaled down by a.
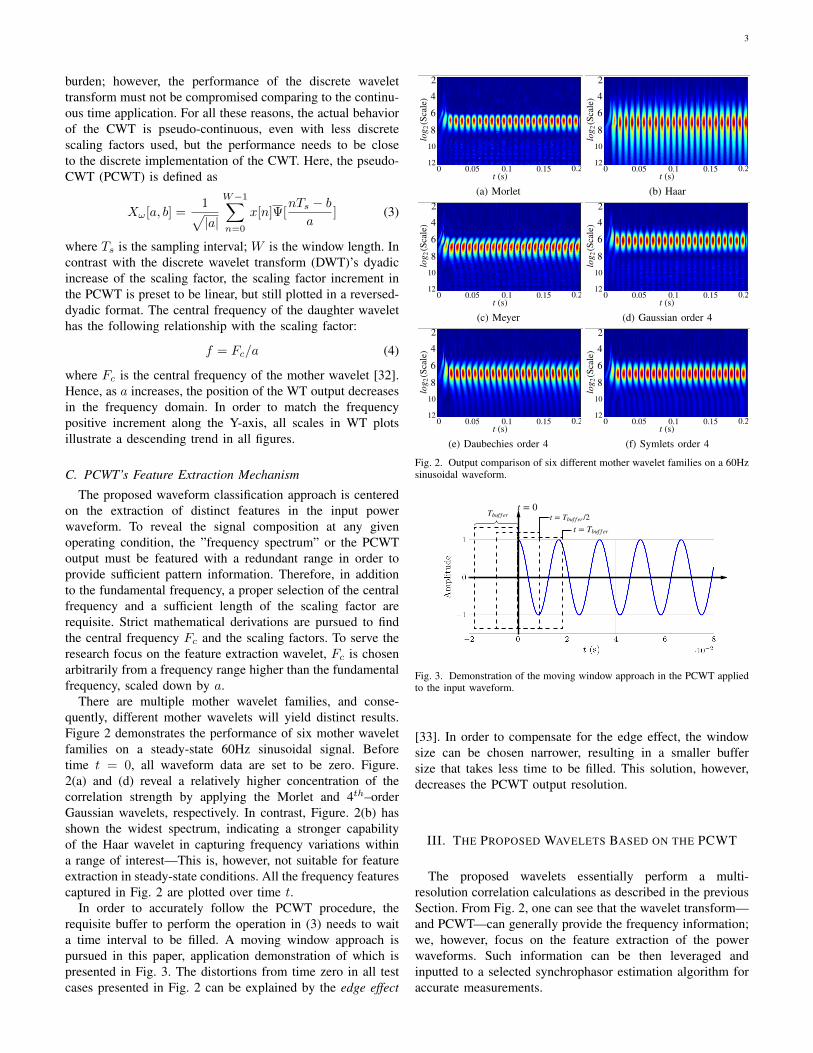
There are multiple mother wavelet families, and conse-quently, different mother wavelets will yield distinct results.Figure 2 demonstrates the performance of six mother waveletfamilies on a steady-state 60Hz sinusoidal signal. Beforetime t = 0, all waveform data are set to be zero. Figure.2(a) and (d) reveal a relatively higher concentration of thecorrelation strength by applying the Morlet and 4th–orderGaussian wavelets, respectively. In contrast, Figure. 2(b) hasshown the widest spectrum, indicating a stronger capabilityof the Haar wavelet in capturing frequency variations withina range of interest—This is, however, not suitable for featureextraction in steady-state conditions. All the frequency featurescaptured in Fig. 2 are plotted over time t.
In order to accurately follow the PCWT procedure, therequisite buffer to perform the operation in (3) needs to waita time interval to be filled. A moving window approach ispursued in this paper, application demonstration of which ispresented in Fig. 3. The distortions from time zero in all testcases presented in Fig. 2 can be explained by the edge effect
(a) Morlet (b) Haar
(c) Meyer (d) Gaussian order 4
(e) Daubechies order 4 (f) Symlets order 4
Fig. 2. Output comparison of six different mother wavelet families on a 60Hzsinusoidal waveform.
Fig. 3. Demonstration of the moving window approach in the PCWT appliedto the input waveform.
[33]. In order to compensate for the edge effect, the windowsize can be chosen narrower, resulting in a smaller buffersize that takes less time to be filled. This solution, however,decreases the PCWT output resolution.
III. THE PROPOSED WAVELETS BASED ON THE PCWT
The proposed wavelets essentially perform a multi-resolution correlation calculations as described in the previousSection. From Fig. 2, one can see that the wavelet transform—and PCWT—can generally provide the frequency information;we, however, focus on the feature extraction of the powerwaveforms. Such information can be then leveraged andinputted to a selected synchrophasor estimation algorithm foraccurate measurements.
4
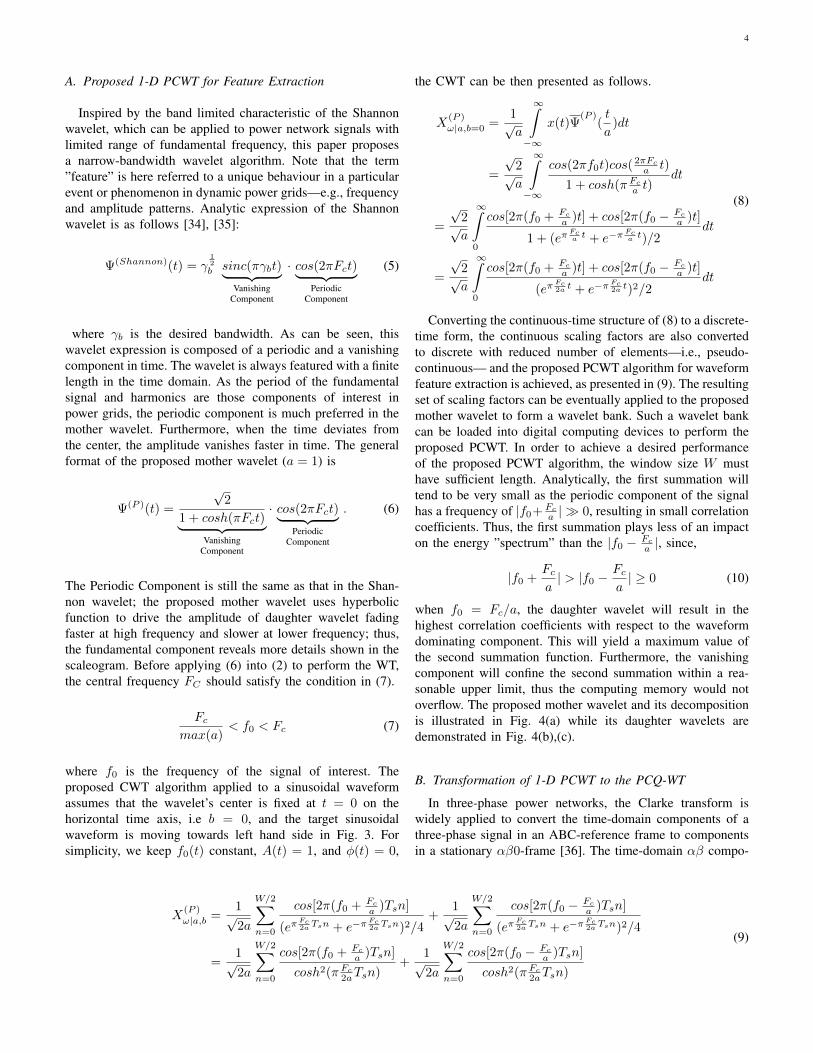
A. Proposed 1-D PCWT for Feature Extraction
Inspired by the band limited characteristic of the Shannonwavelet, which can be applied to power network signals withlimited range of fundamental frequency, this paper proposesa narrow-bandwidth wavelet algorithm. Note that the term”feature” is here referred to a unique behaviour in a particularevent or phenomenon in dynamic power grids—e.g., frequencyand amplitude patterns. Analytic expression of the Shannonwavelet is as follows [34], [35]:
Ψ(Shannon)(t) = γ12
b sinc(πγbt)︸ ︷︷ ︸Vanishing
Component
· cos(2πFct)︸ ︷︷ ︸Periodic
Component
(5)
where γb is the desired bandwidth. As can be seen, thiswavelet expression is composed of a periodic and a vanishingcomponent in time. The wavelet is always featured with a finitelength in the time domain. As the period of the fundamentalsignal and harmonics are those components of interest inpower grids, the periodic component is much preferred in themother wavelet. Furthermore, when the time deviates fromthe center, the amplitude vanishes faster in time. The generalformat of the proposed mother wavelet (a = 1) is
Ψ(P )(t) =
√2
1 + cosh(πFct)︸ ︷︷ ︸Vanishing
Component
· cos(2πFct)︸ ︷︷ ︸Periodic
Component
. (6)
The Periodic Component is still the same as that in the Shan-non wavelet; the proposed mother wavelet uses hyperbolicfunction to drive the amplitude of daughter wavelet fadingfaster at high frequency and slower at lower frequency; thus,the fundamental component reveals more details shown in thescaleogram. Before applying (6) into (2) to perform the WT,the central frequency FC should satisfy the condition in (7).
Fcmax(a)
< f0 < Fc (7)
where f0 is the frequency of the signal of interest. Theproposed CWT algorithm applied to a sinusoidal waveformassumes that the wavelet’s center is fixed at t = 0 on thehorizontal time axis, i.e b = 0, and the target sinusoidalwaveform is moving towards left hand side in Fig. 3. Forsimplicity, we keep f0(t) constant, A(t) = 1, and φ(t) = 0,
the CWT can be then presented as follows.
X(P )ω|a,b=0 =
1√a
∞∫−∞
x(t)Ψ(P )
(t
a)dt
=
√2√a
∞∫−∞
cos(2πf0t)cos(2πFc
a t)
1 + cosh(π Fc
a t)dt
=
√2√a
∞∫0
cos[2π(f0 + Fc
a )t] + cos[2π(f0 − Fc
a )t]
1 + (eπFca t + e−π
Fca t)/2
dt
=
√2√a
∞∫0
cos[2π(f0 + Fc
a )t] + cos[2π(f0 − Fc
a )t]
(eπFc2a t + e−π
Fc2a t)2/2
dt
(8)
Converting the continuous-time structure of (8) to a discrete-time form, the continuous scaling factors are also convertedto discrete with reduced number of elements—i.e., pseudo-continuous— and the proposed PCWT algorithm for waveformfeature extraction is achieved, as presented in (9). The resultingset of scaling factors can be eventually applied to the proposedmother wavelet to form a wavelet bank. Such a wavelet bankcan be loaded into digital computing devices to perform theproposed PCWT. In order to achieve a desired performanceof the proposed PCWT algorithm, the window size W musthave sufficient length. Analytically, the first summation willtend to be very small as the periodic component of the signalhas a frequency of |f0+ Fc
a | 0, resulting in small correlationcoefficients. Thus, the first summation plays less of an impacton the energy ”spectrum” than the |f0 − Fc
a |, since,
|f0 +Fca| > |f0 −
Fca| ≥ 0 (10)
when f0 = Fc/a, the daughter wavelet will result in thehighest correlation coefficients with respect to the waveformdominating component. This will yield a maximum value ofthe second summation function. Furthermore, the vanishingcomponent will confine the second summation within a rea-sonable upper limit, thus the computing memory would notoverflow. The proposed mother wavelet and its decompositionis illustrated in Fig. 4(a) while its daughter wavelets aredemonstrated in Fig. 4(b),(c).
B. Transformation of 1-D PCWT to the PCQ-WT
In three-phase power networks, the Clarke transform iswidely applied to convert the time-domain components of athree-phase signal in an ABC-reference frame to componentsin a stationary αβ0-frame [36]. The time-domain αβ compo-
X(P )ω|a,b =
1√2a
W/2∑n=0
cos[2π(f0 + Fc
a )Tsn]
(eπFc2a Tsn + e−π
Fc2a Tsn)2/4
+1√2a
W/2∑n=0
cos[2π(f0 − Fc
a )Tsn]
(eπFc2a Tsn + e−π
Fc2a Tsn)2/4
=1√2a
W/2∑n=0
cos[2π(f0 + Fc
a )Tsn]
cosh2(π Fc
2aTsn)+
1√2a
W/2∑n=0
cos[2π(f0 − Fc
a )Tsn]
cosh2(π Fc
2aTsn)
(9)

5
0 0.15 3-0.5
-0.25
0
0.25
0.5
Gain
f(H
z)
-0.5 -0.25 0 0.25 0.5-1
- 12
0
12
1
Time windowA
mpl
itude
Mother waveletVanishing trend
(a)
0 0.2 0.4 0.6-0.5
-0.25
0
0.25
0.5
Gain
f(H
z)
-0.5 -0.25 0 0.25 0.5-1
- 12
0
12
1
Time window
Am
plitu
de
Daugter waveletInput signal
(b)
0 0.003 0.006-0.5
-0.25
0
0.25
0.5
Gain
f(H
z)
-0.5 -0.25 0 0.25 0.5-1
- 12
0
12
1
Time window
Am
plitu
de
(c)
Fig. 4. Proposed wavelets for waveform online feature extraction; left figure:spectrum; right figure: wavelet. (a) mother wavelet, (b) daughter wavelet withscaling factor 11, (c) daughter wavelet with scaling factor 26.
nents will be utilized to generate a complex time signal aspresented in (11) and (12).
xαβ(t) = xα(t) + jxβ(t) (11)[xα(t)xβ(t)
]=
[ 23 − 1
3 − 13
0√33 −
√33
]xA(t)xB(t)xC(t)
(12)
To have a complex rotating component, one can replacethe periodic component by a rotating phasor in (6), thus theproposed PCQ-WT is achieved as presented in (13).
#»
Ψ(P )(t) =
√2
1 + cosh(2πFct)· ej2πFct (13)
Similar analytics from (9) can be applied to the proposedPCQ-WT, which is
#»
X(P )ω|a,b=0 =
1√2a
W/2∑n=0
ej2π(f0−Fc
a )Tsn
(eπFc2a Tsn + e−π
Fc2a Tsn)2/4
=1√2a
W/2∑n=0
ej2π(f0−Fc
a )Tsn
cosh2(π Fc
2aTsn)
(14)
When f0 = Fc/a, the correlation coefficients at the numera-tor reach their maximum value, i.e., unity. Hence, the complexformat of the proposed PCQ-WT focuses on the frequency ofinterest, f0. The following Section will investigate the feature
Fig. 5. IEEE 34-Bus test system, with faults and switch locations. Theanalyzed waveforms are captured at Bus 850.
extraction performance of the proposed wavelets: 1-D PCWTand PCQ-WT.
IV. NUMERICAL CASE STUDIES AND WAVEFORMFEATURE EXTRACTION PERFORMANCE EVALUATION
This paper proposed novel wavelet transforms to extractand classify unique features of the input power waveformsand correlate them with various events and grid operatingstates, in an online setting. In order to evaluate the waveletperformance, the frequency information and patterns extractedfrom the input waveform are visualized and plotted in the timedomain. The evaluation is conducted on the following aspects:
1) Frequency Extraction Sensitivity: which focuses onexamining the frequency resolution of the proposedwavelets where the corresponding pattern appears ifthere is an off-nominal frequency.
2) Magnitude Sensitivity: which captures the voltage vari-ation patterns such as voltage swelling and sags.
3) Unbalance Sensitivity: which focuses on PCQ-WT onthree-phase signals during load unbalance or faults.
The following test cases are studied. The time efficiency of theproposed wavelets is evaluated by measuring the time whenthe event occurs and that when a deformed pattern is detected.• Test Case 1: 5Hz/s frequency ramp.• Test Case 2: 2o phase jump.• Test Case 3: 0.02pu magnitude jump.• Test Case 4: Fault and sudden load change detection.The IEEE 34-bus test system configuration is illustrated
in Fig. 5, where several fault locations are pinpointed inred. Waveforms are captured at Bus 850 and the faulttypes—single-line-to-ground (SLG), line-line (LL), line-line-to-ground (LLG), and the 3-phase faults—are tabulated inTable I. Each event described in Table I occurred solely atone time, each lasting for 0.2 second.
The frequency response of the PCWT bank which is usedfor feature extraction in the experiment is shown in Fig. 6,where only 256 scaling factors are utilized to cover up to3200Hz with sampling rate of Fs=9600Hz. Note that for PCQ-WT, only the positive range of frequency is valid. Patternvariations indicated in Fig. 7 demonstrate that the Test Case1 event is captured within 0.02s and the proposed PCQ-WTcould extract a more obvious feature from the waveform than

6
TABLE IDETAILED INFORMATION ON THE SIMULATED FAULTS AND SWITCH
SETTINGS IN THE IEEE 34-BUS TEST SYSTEM
(a) Fault Data
Fault # Type ResistanceF1 SLG 0.01 ΩF2 LL 0.01 ΩF3 LLG 0.01 ΩF4 3φG 1 Ω
(b) Switch Settings
Breaker # Initial StatusBRK1 closeBRK2 open
* Only one event occurs at one time interval.
(a) (b)
Fig. 6. The impulse response of the PCWT bank in this studied experiment.The frequency and gain is normalized into 1 in X-axis and Z-axis.
the 1-D PCWT. Similar observations can by found in TestCase 2 and Test Case 3 in Fig. 8 and Fig. 9: the featurecorresponding to a phase and amplitude jump can also beobserved within one cycle which can be more clearly illus-trated through the contours. In Test Case 2(b) and Test Case3(b), the two plots demonstrate that both proposed waveletscan distinguish patterns in different events: distortions in TestCase 2 is symmetric while being asymmetric in Test Case 3.
(a)
(b)
Fig. 7. Simulation results in Test Case 1 where a frequency ramp starts att = 0.12s, (a) 1-D PCWT, (b) PCQ-WT.
(a)
(b)
Fig. 8. Simulation results in Test Case 2 where a phase jump occurs att = 0.12s, (a) contour of 1-D PCWT, (b) contour of the PCQ-WT.
(a)
(b)
Fig. 9. Simulation results in Test Case 3 where a magnitude jump occurs att = 0.12s, (a) contour of 1-D PCWT, (b) contour of the PCQ-WT.
The 1-D PCWT can still capture all the features in theevents that are normally hard to be observed. The reason liesin the fact that the 1-D signal amplitude is not fixed overtime, thus there are always periodic energy concentrations in1-D PCWT. One can realize, by comparing the 1-D featureextraction approach in [18], that the proposed 1-D PCWT notonly reveals the features around fundamental frequency, but
7
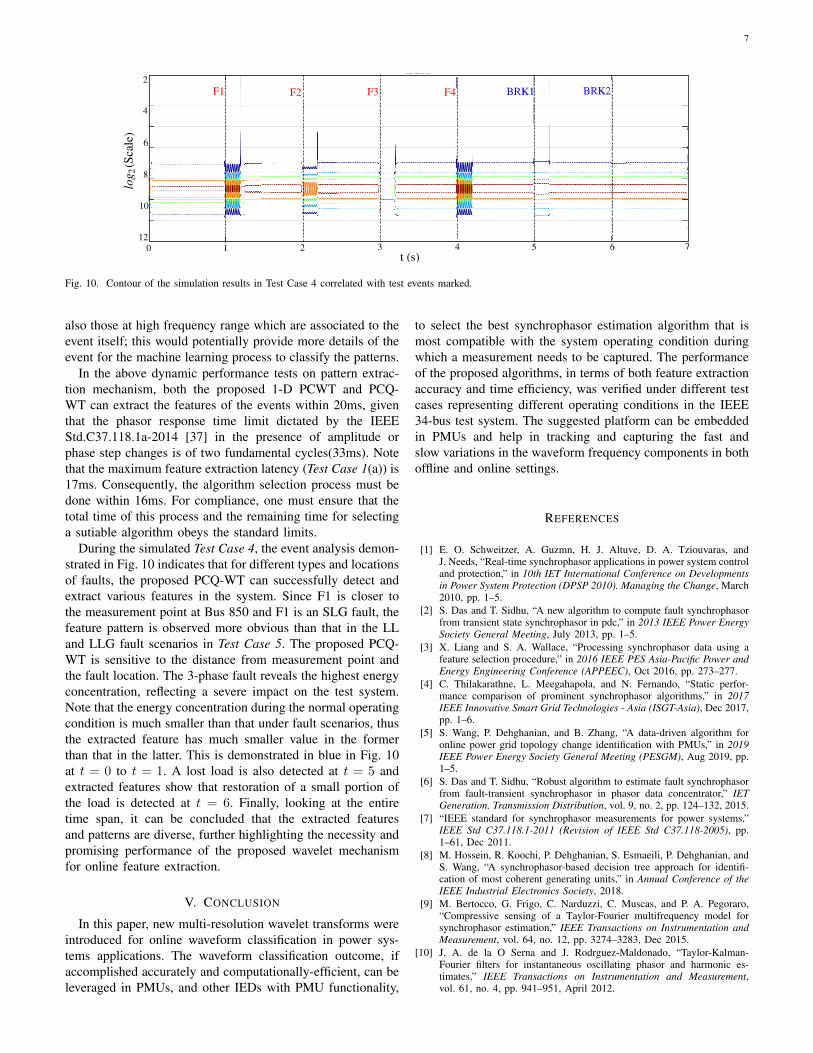
Fig. 10. Contour of the simulation results in Test Case 4 correlated with test events marked.
also those at high frequency range which are associated to theevent itself; this would potentially provide more details of theevent for the machine learning process to classify the patterns.
In the above dynamic performance tests on pattern extrac-tion mechanism, both the proposed 1-D PCWT and PCQ-WT can extract the features of the events within 20ms, giventhat the phasor response time limit dictated by the IEEEStd.C37.118.1a-2014 [37] in the presence of amplitude orphase step changes is of two fundamental cycles(33ms). Notethat the maximum feature extraction latency (Test Case 1(a)) is17ms. Consequently, the algorithm selection process must bedone within 16ms. For compliance, one must ensure that thetotal time of this process and the remaining time for selectinga sutiable algorithm obeys the standard limits.
During the simulated Test Case 4, the event analysis demon-strated in Fig. 10 indicates that for different types and locationsof faults, the proposed PCQ-WT can successfully detect andextract various features in the system. Since F1 is closer tothe measurement point at Bus 850 and F1 is an SLG fault, thefeature pattern is observed more obvious than that in the LLand LLG fault scenarios in Test Case 5. The proposed PCQ-WT is sensitive to the distance from measurement point andthe fault location. The 3-phase fault reveals the highest energyconcentration, reflecting a severe impact on the test system.Note that the energy concentration during the normal operatingcondition is much smaller than that under fault scenarios, thusthe extracted feature has much smaller value in the formerthan that in the latter. This is demonstrated in blue in Fig. 10at t = 0 to t = 1. A lost load is also detected at t = 5 andextracted features show that restoration of a small portion ofthe load is detected at t = 6. Finally, looking at the entiretime span, it can be concluded that the extracted featuresand patterns are diverse, further highlighting the necessity andpromising performance of the proposed wavelet mechanismfor online feature extraction.
V. CONCLUSION
In this paper, new multi-resolution wavelet transforms wereintroduced for online waveform classification in power sys-tems applications. The waveform classification outcome, ifaccomplished accurately and computationally-efficient, can beleveraged in PMUs, and other IEDs with PMU functionality,
to select the best synchrophasor estimation algorithm that ismost compatible with the system operating condition duringwhich a measurement needs to be captured. The performanceof the proposed algorithms, in terms of both feature extractionaccuracy and time efficiency, was verified under different testcases representing different operating conditions in the IEEE34-bus test system. The suggested platform can be embeddedin PMUs and help in tracking and capturing the fast andslow variations in the waveform frequency components in bothoffline and online settings.
REFERENCES
[1] E. O. Schweitzer, A. Guzmn, H. J. Altuve, D. A. Tziouvaras, andJ. Needs, “Real-time synchrophasor applications in power system controland protection,” in 10th IET International Conference on Developmentsin Power System Protection (DPSP 2010). Managing the Change, March2010, pp. 1–5.
[2] S. Das and T. Sidhu, “A new algorithm to compute fault synchrophasorfrom transient state synchrophasor in pdc,” in 2013 IEEE Power EnergySociety General Meeting, July 2013, pp. 1–5.
[3] X. Liang and S. A. Wallace, “Processing synchrophasor data using afeature selection procedure,” in 2016 IEEE PES Asia-Pacific Power andEnergy Engineering Conference (APPEEC), Oct 2016, pp. 273–277.
[4] C. Thilakarathne, L. Meegahapola, and N. Fernando, “Static perfor-mance comparison of prominent synchrophasor algorithms,” in 2017IEEE Innovative Smart Grid Technologies - Asia (ISGT-Asia), Dec 2017,pp. 1–6.
[5] S. Wang, P. Dehghanian, and B. Zhang, “A data-driven algorithm foronline power grid topology change identification with PMUs,” in 2019IEEE Power Energy Society General Meeting (PESGM), Aug 2019, pp.1–5.
[6] S. Das and T. Sidhu, “Robust algorithm to estimate fault synchrophasorfrom fault-transient synchrophasor in phasor data concentrator,” IETGeneration, Transmission Distribution, vol. 9, no. 2, pp. 124–132, 2015.
[7] “IEEE standard for synchrophasor measurements for power systems,”IEEE Std C37.118.1-2011 (Revision of IEEE Std C37.118-2005), pp.1–61, Dec 2011.
[8] M. Hossein, R. Koochi, P. Dehghanian, S. Esmaeili, P. Dehghanian, andS. Wang, “A synchrophasor-based decision tree approach for identifi-cation of most coherent generating units,” in Annual Conference of theIEEE Industrial Electronics Society, 2018.
[9] M. Bertocco, G. Frigo, C. Narduzzi, C. Muscas, and P. A. Pegoraro,“Compressive sensing of a Taylor-Fourier multifrequency model forsynchrophasor estimation,” IEEE Transactions on Instrumentation andMeasurement, vol. 64, no. 12, pp. 3274–3283, Dec 2015.
[10] J. A. de la O Serna and J. Rodrguez-Maldonado, “Taylor-Kalman-Fourier filters for instantaneous oscillating phasor and harmonic es-timates,” IEEE Transactions on Instrumentation and Measurement,vol. 61, no. 4, pp. 941–951, April 2012.

8
[11] A. J. Roscoe, I. F. Abdulhadi, and G. M. Burt, “P and M class phasormeasurement unit algorithms using adaptive cascaded filters,” IEEETransactions on Power Delivery, vol. 28, no. 3, pp. 1447–1459, July2013.
[12] P. K. Dash, K. R. Krishnanand, and M. Padhee, “Fast recursive Gauss-Newton adaptive filter for the estimation of power system frequencyand harmonics in a noisy environment,” IET Generation, TransmissionDistribution, vol. 5, no. 12, pp. 1277–1289, December 2011.
[13] A. Z. Amanci and F. P. Dawson, “Synchronization system with zero-crossing peak detection algorithm for power system applications,” inPower Electronics Conference (IPEC), 2010 International. IEEE, 2010,pp. 2984–2991.
[14] A. Ortega and F. Milano, “Comparison of different pll implementationsfor frequency estimation and control,” in Harmonics and Quality ofPower (ICHQP), 2018 18th International Conference on. IEEE, 2018,pp. 1–6.
[15] T. Becejac, P. Dehghanian, and M. Kezunovic, “Analysis of PMUalgorithm errors during fault transients and out-of-step disturbances,”in IEEE PES Transmission & Distribution Conference and Exposition-Latin America, 2016, pp. 1–6.
[16] ——, “Probabilistic assessment of PMU integrity for planning of pe-riodic maintenance and testing,” in IEEE International Conference onProbabilistic Methods Applied to Power Systems (PMAPS), 2016, pp.1–6.
[17] ——, “Impact of the errors in the PMU response on synchrophasor-based fault location algorithms,” in 2016 North American Power Sym-posium (NAPS), 2016, pp. 1–6.
[18] C. Qian and M. Kezunovic, “A power waveform classification methodfor adaptive synchrophasor estimation,” IEEE Transactions on Instru-mentation and Measurement, vol. 67, no. 7, pp. 1646–1658, July 2018.
[19] F. R. Gomez, A. D. Rajapakse, U. D. Annakkage, and I. T. Fer-nando, “Support vector machine-based algorithm for post-fault transientstability status prediction using synchronized measurements,” IEEETransactions on Power Systems, vol. 26, no. 3, pp. 1474–1483, Aug2011.
[20] R. C. Dugan, M. F. McGranaghan, H. W. Beaty, and S. Santoso,Electrical power systems quality. mcgraw-Hill New York, 1996, vol. 2.
[21] S. Wang, P. Dehghanian, M. Alhazmi, J. Su, and B. Shinde, “Resilience-assured protective control of dc/ac inverters under unbalanced and faultscenarios,” in 2019 IEEE Power Energy Society Innovative Smart GridTechnologies (ISGT), Feb 2019, pp. 1–6.
[22] S. Khalid and B. Dwivedi, “Power quality issues, problems, standards& their effects in industry with corrective means,” International Journalof Advances in Engineering & Technology, vol. 1, no. 2, p. 1, 2011.
[23] F. A. S. Borges, R. A. S. Fernandes, I. N. Silva, and C. B. S. Silva,“Feature extraction and power quality disturbances classification usingsmart meters signals,” IEEE Transactions on Industrial Informatics,vol. 12, no. 2, pp. 824–833, April 2016.
[24] M. S. Manikandan, S. R. Samantaray, and I. Kamwa, “Detection andclassification of power quality disturbances using sparse signal decom-position on hybrid dictionaries,” IEEE Transactions on Instrumentationand Measurement, vol. 64, no. 1, pp. 27–38, Jan 2015.
[25] K. Thirumala, M. S. Prasad, T. Jain, and A. C. Umarikar, “Tunable-qwavelet transform and dual multiclass svm for online automatic detectionof power quality disturbances,” IEEE Transactions on Smart Grid, vol. 9,no. 4, pp. 3018–3028, July 2018.
[26] M. H. R. Koochi, P. Dehghanian, S. Esmaeili, P. Dehghanian, andS. Wang, “A synchrophasor-based decision tree approach for identifica-tion of most coherent generating units,” in IECON 2018 - 44th AnnualConference of the IEEE Industrial Electronics Society, Oct 2018, pp.71–76.
[27] D. P. Mishra, S. R. Samantaray, and G. Joos, “A combined wavelet anddata-mining based intelligent protection scheme for microgrid,” IEEETransactions on Smart Grid, vol. 7, no. 5, pp. 2295–2304, Sept 2016.
[28] P. Rajaraman, N. A. Sundaravaradan, R. Meyur, M. J. B. Reddy, andD. K. Mohanta, “Fault classification in transmission lines using waveletmultiresolution analysis,” IEEE Potentials, vol. 35, no. 1, pp. 38–44, Jan2016.
[29] C. Torrence and G. P. Compo, “A practical guide to wavelet analysis,”Bulletin of the American Meteorological society, vol. 79, no. 1, pp. 61–78, 1998.
[30] P. S. Addison, The illustrated wavelet transform handbook: introductorytheory and applications in science, engineering, medicine and finance.CRC press, 2017.
[31] M. Stephane, A wavelet tour of signal processing. Elsevier, 1999.
[32] S. Mallat and W. L. Hwang, “Singularity detection and processing withwavelets,” IEEE Transactions on Information Theory, vol. 38, no. 2, pp.617–643, March 1992.
[33] J. R. Williams and K. Amaratunga, “A discrete wavelet transformwithout edge effects using wavelet extrapolation,” Journal of FourierAnalysis and Applications, vol. 3, no. 4, pp. 435–449, 1997.
[34] B. Tang, T. Song, F. Li, and L. Deng, “Fault diagnosis for a wind turbinetransmission system based on manifold learning and shannon waveletsupport vector machine,” Renewable Energy, vol. 62, pp. 1–9, 2014.
[35] C. Cattani, “Shannon wavelets theory,” Mathematical Problems in En-gineering, vol. 2008, 2008.
[36] W. Duesterhoeft, M. W. Schulz, and E. Clarke, “Determination ofinstantaneous currents and voltages by means of alpha, beta, andzero components,” Transactions of the American Institute of ElectricalEngineers, vol. 2, no. 70, pp. 1248–1255, 1951.
[37] “IEEE standard for synchrophasor measurements for power systems– amendment 1: Modification of selected performance requirements,”IEEE Std C37.118.1a-2014 (Amendment to IEEE Std C37.118.1-2011),pp. 1–25, April 2014.