Embed Size (px)
Citation preview

A novel method for determination of occurrence order ofstabilization reactions in carbon fiber precursor
S Arbab1, H Mirbaha2, A Zeinolebadi3 and P Nourpanah2
1Amirkabir University of Technology, Department of Textile Engineering, ATMTResearch Institute, Tehran, Iran2Amirkabir University of Technology, Department of Textile Engineering, Tehran,Iran3Hamburg University Department of Chemistry TMC Institute, Hamburg, Germany
Email: [email protected]
Abstract. Thermal stabilization is an important step in production of carbon fiber frompolyacrylonitrile (PAN) precursors. During thermal stabilization step different thermochemicalreactions take place almost simultaneously. Understanding the onset and temperature range ofthe stabilization reactions is a key for adjusting processing parameters such as tension,stretching, etc. However, stabilization reactions are very complex and overlap with each other.In order to separate the stabilization reactions, we combined the results of different thermalanalysis techniques, namely Differential Scanning Calorimetry (DSC), Thermogravimetry(TGA) and Thermomechanical Analysis (TMA), to study behaviour of PAN precursors duringstabilization. By means of combining the results of these techniques, we were able todetermine the temperature range and occurrence order of each of stabilization reactionsregardless of the composition of initial PAN fibers and history of fiber formation.
1. IntroductionCarbon fibers are good candidates for high performance applications requiring both great mechanicalproperties and light weight [1,2]. Among different production steps, thermal stabilization is animportant step in production of carbon fibers from PAN precursors, during which different reactionsincluding cyclization, dehydrogenation and oxidation take place [3]. Thermal stabilization converts thelinear structure of PAN fibers to an intermediate cyclic structure. This structure has a critical role insubsequent processing steps such as carbonization and graphitization [4,5].
Thermal stabilization reactions are very complex and depend on the chemical composition of theinitial PAN fibers and stabilization conditions such as atmosphere and heating rate. In differentatmospheres different reactions occur. Changing the heating rate causes a shift in initiationtemperature of chemical reactions. With an increase in the heating rate, initiation temperature ofchemical reactions shifts to higher values. Increasing heating rate has also been shown to enhanceweight loss in the form of chain fragmentation [6,7].
Understanding the onset and temperature range of the stabilization reactions is a key for adjustingprocessing parameters. Despite numerous studies, still there is not a certain agreement on theoccurrence-order and temperature range of each of stabilization reactions. Using different analysismethods, researchers have presented different interpretations regarding the occurrence order ofreactions. The discrepancy originates mainly from the differences in the chemical composition of thestudied fibers, which is one of the main factors determining the mechanism of reactions [8].
Due to concurrent occurrence of stabilization reactions and the effect of structure and chemicalcomposition of precursor fiber on these reactions, a clear approach for their separation, independentfrom chemical and physical structure of precursor fibers, is not proposed. In this paper we applydifferent characterization techniques, namely DSC, TGA and TMA, in order to shed some light on thestabilization reactions.
2. ExperimentalPAN fibers containing Itaconic acid (IA) and Methyl acrylate (MA) comonomers were used.Exothermic reactions of PAN precursor were studied in a DSC 2010, TA Instrument (both in air andnitrogen atmospheres) at a heating rate of 2 °C/min in temperature range of 40 to 400 °C. Weight lossof fibers during stabilization process was measured in a TGA, Perkin-Elmer. Heating rate of 2 °C/minwas employed and fibers were heated from room temperature to 450 °C. Thermomechanical analysis(TMA) of PAN fibers was done in a Mettler Toledo TMA SDTA 840. The samples were scannedduring the heating process from 30 to 400 °C at heating rates of 2 °C/min under air atmosphere. 0.022CN/tex tension was applied to the fibers.
3. Results and DiscussionThe main changes occurring during thermal stabilization of PAN fibers include intramolecularcyclization of linear structure which leads to formation of ladder polymer and development ofintermolecular cross-links of nitrile groups, dehydrogenation and chain fragmentation and oxygenuptake [8,9]. The occurrence order of stabilization reactions is determined by studying and couplingthe results of DSC, TGA and TMA curves.
Since oxidation reactions do not occur in neutral atmosphere, we compared thermal behaviour offibers in both neutral and oxidative atmosphere as an approach to separate oxidation from otherstabilization reactions. DSC thermograms in both air and nitrogen atmospheres and TGA graph in airatmosphere are shown in figure 1. According to DSC thermograms, onset of exothermic peak in airand nitrogen is at 175 °C and 210 °C, respectively (Table 1). Since oxidation reactions do not occur innitrogen atmosphere during heating process, primary reactions from 175 to 210 °C are considered tobe oxidation and probably dehydrogenation resulting from oxidation. The first peak temperature (Tpk1)in air atmosphere is 250 °C. Tpk1 shifts to 258 °C in nitrogen atmosphere due to the absence ofoxidation reactions. Second exothermic peak at 302 °C which is eliminated in nitrogen atmosphere isdue to oxidation reactions in this temperature range.
Weight loss of PAN fibers at different temperatures is a multi-stage process due to elimination ofHydrogen, HCN, NH3, H2O and so forth. Chain fragmentation is another possible source of weightloss. Limited weight gain during heating is due to the oxidation reactions which introduce carbonyl(C=O) and hydroxyl (OH) groups into the polymer backbone. However, hydroxyl groups may undergodehydrogenation reactions at higher temperatures, which finally contribute to total weight-loss.Cyclization reactions do not contribute in weight loss of fibers [8].

Figure 1. DSC in air (a) and nitrogen atmospheres (b) and TGA thermograms of PAN fibers in air (c)
TGA was performed to realize the temperature range of dehydrogenation reactions. TGA graphshows a limited weight loss at 175 °C (0.2%), which can be attributed to moisture evaporation anddecomposition of sizing. There is not any significant weight-loss in the range of 175 - 210 °C (Ti ofDSC peak in air and nitrogen atmospheres, respectively), which indicates absence of reactions thatcause weight loss, namely dehydrogenation. According to DSC results in both air and nitrogenatmospheres, it is approved that oxidation reactions are dominant in this temperature range (175 - 210°C). Weight-loss of fibers shows 1.5% increase from 210 to 258 °C (Tpk in nitrogen atmosphere). 1%of this weight loss has occurred in a wide range of 210 - 250 °C, while 0.5% has occurred in thenarrow range between 250 and 258 °C. Since the temperature range of 210 - 258 °C is the range thatDSC curves exist in both atmospheres, it can be concluded that dominant reaction in this temperaturerange is cyclization, which is intensified in the air atmosphere. Given the more intense weight loss inthe range of 250 - 258 °C, it seems that dehydrogenation reactions also occur in this range and overlapwith cyclization reactions. Weight loss increases to 4.8% at 302 °C. This indicates thatdehydrogenation reactions along with limited chain fragmentation are present in this range. However,the presence of second exothermic peak in DSC thermogram in air atmosphere shows the presence ofoxidation reactions in final region of the curve. After 274 °C (Tf of first exothermic peak in airatmosphere) the weight loss becomes less steep due to oxygen uptake.
TMA curves of PAN fibers and their first derivative (DTMA) are shown in Figure 2. DuringThermal stabilization of PAN fibers, two steps of shrinkage occur, namely physical shrinkage (due tophysical relaxation of stressed molecules) and chemical shrinkage (due to chemical reactions) [6,10].TMA is also used for determination of temperature range of cyclization reactions and its results arecoupled with DSC and TGA. Physical shrinkage (10.4%) in this type of PAN fibers occurs below 210°C and chemical shrinkage (17.6%) occurs in the range of 210 - 264 °C. Onset of chemical shrinkageat 210 °C is ascribed to initiation of cyclization reactions, which confirms the results of DSC andTGA.

Figure 2. TMA and DTMA curves of PAN fibers
Therefore, it can be concluded that in this type of PAN fibers stabilization reactions occur in thefollowing order: 1- Oxidation (above 175 °C), 2- Cyclization (above 210 °C), 3- Dehydrogenation(above 250 °C). It should be noted that chemical reactions are dominant in the mentioned ranges, butoverlap with each other in the other ranges. Furthermore, it should be mentioned that this determinedorder can be altered by a change in chemical composition and spinning conditions of PAN. Inaddition, the change in heating rate during stabilization would shift the mentioned temperature tohigher or lower values.
Table 1. DSC data of PAN fibers in air and nitrogen atmosphere
Air Nitrogen
Ti a
(°C)Tpk1 b
(°C)Tpk2 c
(°C)∆T =Tf d –Ti
(°C)Ti
(°C)Tpk
(°C)∆T =Tf –Ti
(°C)
175 250 302 181 210 258 92
a Ti : Initiation Temperature of Exothermic Peakb Tpk1 : First Peak Temperaturec Tpk2 : Second Peak Temperatured Tf : Finish Temperature of Exothermic Peak
4. ConclusionBy designing a series of experiments using DSC, TGA and TMA analysis, the occurrence order ofchemical reactions during thermal stabilization of PAN fibers was investigated. According to theresults obtained from comparison of DSC graphs in air and nitrogen atmosphere and coupling theresults with TGA, reactions starting after 175 °C in PAN fibers containing itaconic acid and methylacrylate comonomers, were oxidation. TMA results showed the shrinkage of fibers due to cyclizationreactions, which started above 210 °C. Comparison of DSC graphs in air and nitrogen atmospheresand TGA results also showed that cyclization reactions of PAN fibers started above 210 °C. TGAresults showed the presence of dehydrogenation reactions above 250 °C. It should be noted thatchemical reactions are dominant in the mentioned ranges, but overlap with each other in the other
ranges. Using the method explained here, it is possible to determine the occurrence order ofstabilization reactions of different types of PAN fibers independent from structure and history ofspinning. This approach can be used to design the heat treatment temperature and stress duringstabilization process accurately and efficiently.
5. References[1] Frank E, Hermanutz F, Buchmeiser M R 2012 Macromol. Mater. Eng. 297 493-501[2] Wangxi Z, Jie L, Gang W, 2003 Carbon 41 2805-2812[3] Arbab S and Zeinolebadi A 2013 Polym. Degrad. Stabil. 98 2537-2545[4] Yusof N and Ismail A F 2012 J. Anal. Appl. Pyrol. 93 1-13[5] Ouyang Q, Cheng L, Wang H, Li K 2008 Polym. Degrad. Stabil. 93 1415-1421[6] Fitzer E, Frohs W, Heine M 1986 Carbon. 24 387-395[7] Mirbaha H, Arbab S, Zeinolebadi A, Nourpanah P 2013 Smart Mater. Struct. 22 045019[8] Sen K, Bajaj P, Sreekumar T V 2001 Polymer 42 1707-1718[9] Duan Q, Wang B, Wang H 2012 J. Macromol. Sci., Part B: Physics. 51 2428–2437[10] Xiao S, Lv H, Tong Y, Xu L, Chen B, 2011 J. Appl. Polym. Sci. 122 480-488

Mechanical and durability characteristics of externally GFRPreinforced unsaturated polyester polymer concrete
H Bouguessir1, E Harkati1, M Rokbi2, G Priniotakis3, S Vassiliadis3
1Department of Civil Engineering, Faculty of Sciences and Technology, Larbi TebessiTEBESSA University 12002 Constantine’s Road, TEBESSA, Algeria2 Mechanical Engineering Department, Faculty of Sciences and Technology,Mohamed Boudiaf M’SILA University, 28000, M’SILA, Algeria3 Department of Textile Engineering, Piraeus University of Applied Sciences,Thivon250, Egaleo 122 41, Greece.
Email: [email protected]
Abstract. The last decades of the XXe century cognized a huge extent of composite materialsuses to almost all everyday life’s applications, replacing the conventional materials, due totheir outstanding properties especially highest strength-to-weight ratio and the ability to bedesigned to satisfy specific performance requirements. To get the most out of these wondermaterials, a new concept, combining polymer concrete and composite laminates, is currentlyused in Algeria. This research work has the aim to investigate applicability of this concept incivil engineering through tensile and bending tests. On the other hand, the influence of variouschemicals (Sodium hydroxide, Potassium Hydroxide and Calcium Carbonates) on our materialand its tensile properties retention over long-time exposure was examined. The mechanicalproperties obtained indicate the convenience of this material for use in civil engineering thanksto its very good tensile and flexural performances in addition to its sufficient residual strengthafter theoretically 56 years.
1. Introduction:The composite materials have been imposed since the second half of the past century thanks to theirspecific mechanical characteristics [1]. These materials are emerging quickly in number ofapplications including: automotive, aerospace, marine, sporting goods, electronic industries and forretrofitting the corrosion-damaged reinforced concrete elements [2, 3]. These wonder materials withlightweight, high strength-to-weight ratio and stiffness properties have come a long way in replacing,technically and economically, the conventional materials like metals, wood etc. Moreover, their costhas significantly decreased over the past years due to improvement of manufacturing [4].
The most used fibers are: Carbon, aramid and glass ones. Although strength characteristics of Glassfibers are somewhat lower than carbon fiber and it is less stiff, the material is typically far less brittleand its raw materials are too much cheaper [5].Polymer concrete (PC) is a composite material formed by combining mineral aggregates with athermoset resin mixed with a hardener. Since late 70s, epoxy and acrylic polymer concrete have beenused to replace traditional materials due to rapid curing and excellent bond to cement concrete [6-8].
The polymer concrete has widespread applications owing to its remarkable qualities in comparisonwith conventional cement concrete [9]. Among the advantages offered: fast hardening, very goodadhesion with the aggregates and great resistance to chemical aggressions [10] excellent mechanicalstrength and good corrosion resistance [11], resistance to abrasion and weathering [12],

waterproofness and good sound and thermal insulation properties [13] fatigue resistance [14] andexcellent bonding with steel reinforcement and to old concrete [15].
Although 3-5 times stronger than ordinary Portland cement concrete, polymer concrete (PC)displays brittle characteristics that have limited its usefulness for load-bearing applications [16] anddue to the limited tensile strength values and its brittle failure [17], these concretes have been oftenreinforced with GFRP or CFRP rods [18], [19].
Pipe systems have presented to improve human beings’ standard of living since the dawn ofcivilization. Nowadays, there are many types of piping materials ranging from rigid concrete toflexible thermal plastic. Pipes must have adequate strength to perform their intended function and,also, must be durable enough to last for their lifetime. The steel pipes are detrimentally affected bycorrosion phenomena [20]. In the other hand, the concrete pipes are exposed to various harmful effectsduring their service life. The high cost of structures repair due to aging and corrosion of steel has ledto a worldwide interest in the feasibility of using alternative fiber reinforced polymer (FRP) materials[21].
To avoid these disadvantages, a new concept is currently used in Algeria combining polymerconcrete and composite materials. Typically polymer concrete has a longer maintenance-free servicelife and possesses also other aforementioned advantages compared to Portland cement concrete.This new concept assembles many advantages: (a). Satisfactory mechanical tensile and bendingcharacteristics. (b). better durability than steel and ordinary concrete pipes attending even 100 years ofguarantee. (c). the middle layer made with polymer concrete is up to decrease significantly the wholeprice and to ensure sufficient characteristics.
However, researches show that GFRP composites are not immune to long-term environmentaldegradation and are susceptible to varying amounts of strength and stiffness changes in the presence ofenvironments such as water, ultraviolet exposure, elevated temperature, alkaline or acidic solutionsand saline solutions. Beyond the cost issues, the most significant technical obstacle preventing theextended use of this concept of materials in civil engineering is a lack of long-term and durabilityperformance data comparable to that available for traditional construction materials. That is why thelong-term performances have to be investigated before they can be widely applied to the field [22].
This research work investigated the applicability of this concept in civil engineering through tensileand bending tests. Furthermore, the influence of various chemicals (Sodium hydroxide, PotassiumHydroxide and Calcium Carbonates) on our materials and its tensile properties retention over long-time exposure was examined.
2. Experimental Procedure2.1. Materials2.1.1. Polymer BinderThe thermosetting Isophtalic unsaturated polyester UPE resin has a density of 1200 kg/m3, viscosity at25° equals 426 mPas and a gel time at 25° equals 14’30’’`. The UPE are the most frequently usedthermosetting matrices owing to their low cost and adaptability to be transformed into large compositestructures. The Catalyst and accelerator used for this investigation are Methyl Ethyl Ketone Peroxide(MEKP) and Cobalt in weight ratios 1:0.03:0.2 respectively.
2.1.2. Combined Mat/Woven fabric E-Glass:Fiber glass is a lightweight, extremely strong and robust material. Its bulk strength and weightproperties are also very favorable when compared to metals and it can be easily formed using moldingprocess.
The reinforcement fibers type was E-Glass combined stitched mat/woven fabric with a mass persurface unit of 600g/m2. Also we used chopped mat E-glass to reinforce the inner polymer concretelayer with 1% per weight.
2.2. Fabrication Method

The composite laminates used for the present investigation were fabricated by hand lay-up process.The plate was constituted of 4 layers of reinforcement fabrics impregnated in pre-catalyzed binderbetween them a medium layer constituted of polyester polymer concrete. This latter, was reinforced bychopped E-Glass fibers of 50-70 mm length. Before Hand lay-up process begins, it is important totreat the mold surface with a release to ease removal of the fabricated laminates after their hardening.Release agent in a form of sheet (commercial name is Mylar sheet) painted with lubricant was used inorder to avoid the above mentioned problem. After manufacture, the composites stayed 24 hours tohave a total polymerization [23]
Figure 1. GFRP tensile and flexural specimens
After curing, the GFRP specimens sawn with a water-cooled diamond saw were characterized fortheir tensile and flexural mechanical properties ‘Figure.1’ according to universal standards asdescribed in the table below:
Table 1. Trials and their Standards.
Trial Type ASTM StandardTensile test D 3039
3 Pts Bending D 790
2.3. Mechanical CharacterizationA larger number of tests give a higher confidence in data that is why at least four samples have beentaken for each test to obtain average value. All the tests were done at an ambient temperature.
2.3.1. Equipment:The manufactured GFRP composites were subjected to tensile and flexural quasi-static tests performedon a computerized Universal Testing machine UTM YLE 25 capable to loading to 250 KN withdisplacement control.
2.3.2. Tensile strength testThe tensile strength of virgin and harsh liquid aged composites were determined with a crossheadspeed of 1.5 mm/min. The specimens of dimensions 250mmx25mmx14mm were used foranalysis in accordance with ASTM D3039 for constant head-speed tests ‘Standard Test Method forTensile Properties of Polymer Matrix Composite Materials’ [24] As shown on Figure.2
The force was applied until the failure of the sample and stress-strain curve was obtained.The tensile strengths were calculated through the formula:
Rt = Fu / A (1)
Where: FU: ultimate load (N).A: Transverse section.
Figure 2. Tensile Test Set-Up
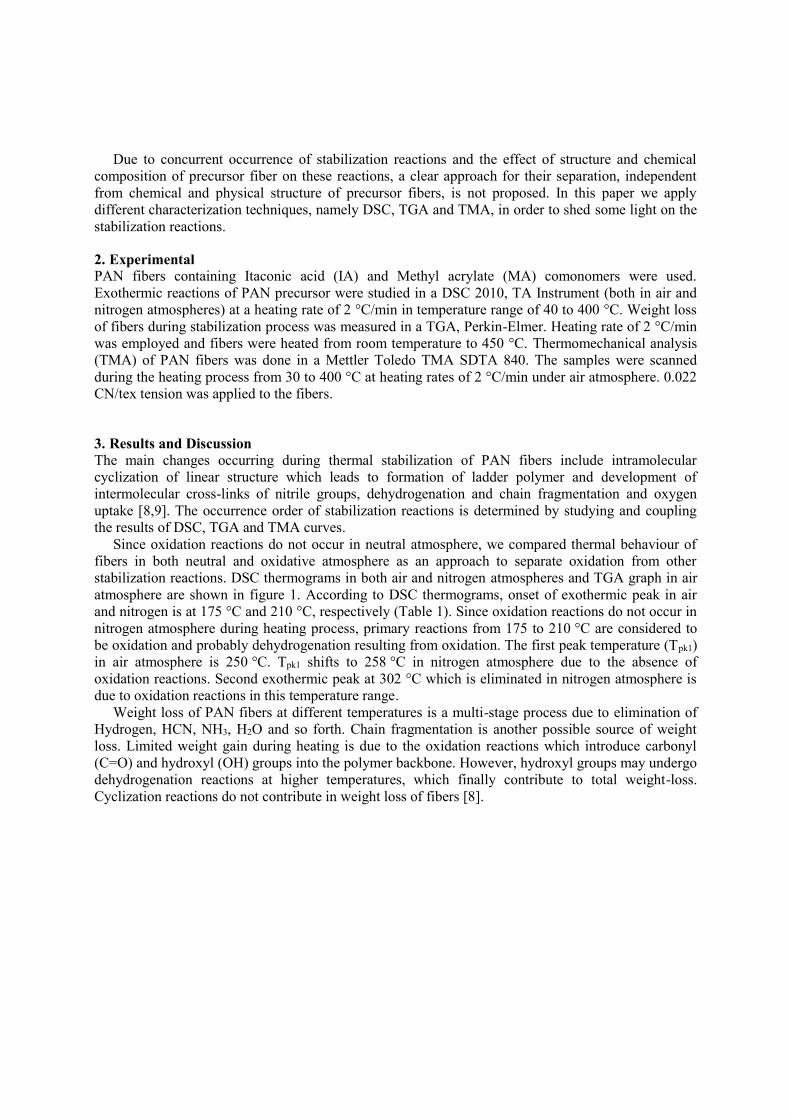
2.3.3. Flexural strength testThe Flexural properties of samples were measured according to ASTM D790 at a cross head speed of2 mm/min Fig 3. Flexural strengths are determined from the formula given below:
Rf = 3FL/ 2b.d2 (2)
Where: F: Ultimate load (N), L: Span length (mm), b: wide (mm),d:Thickness (mm).
Figure 3. Flexural Test Set-Up
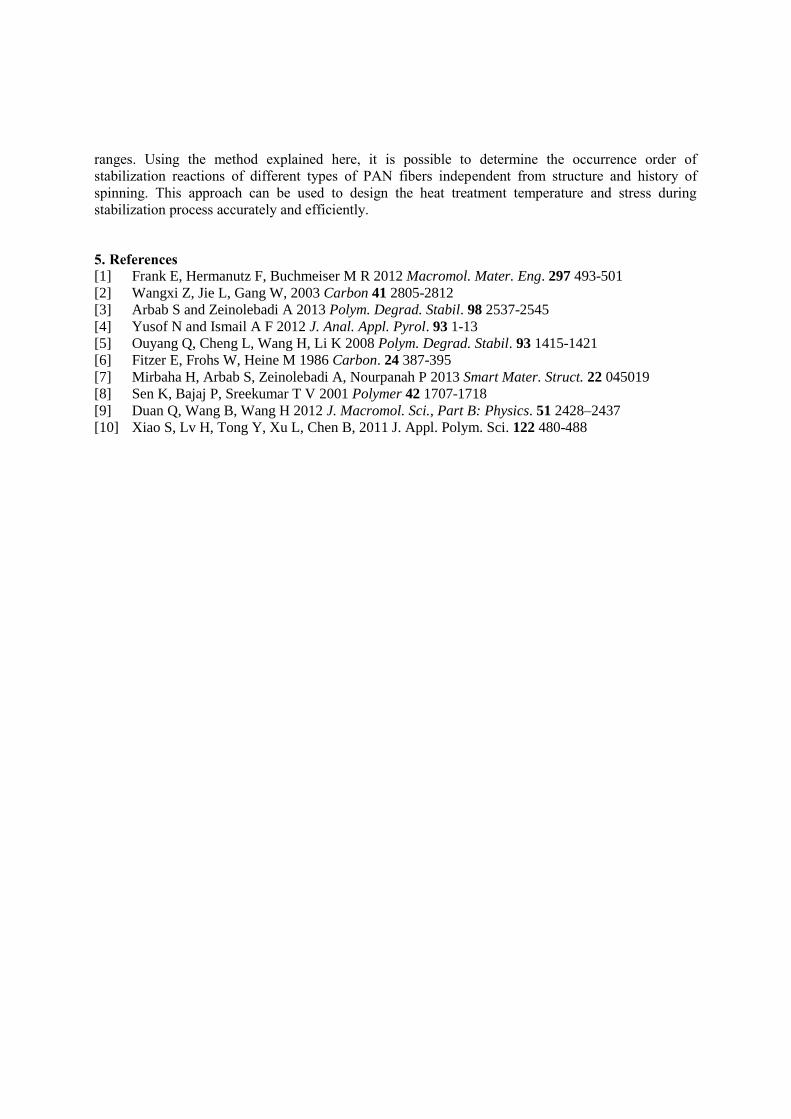
3. Results and discussionGenerally, the mechanical properties of composites are mainly governed by: number of layers, fiberdirection, mass per area of fabric, strength and modulus of the fibers and the effectiveness of thebonding strength between matrix and fibers in transferring stress across the interface.
3.1. Tensile strength testThe tensile load for a composite is very much dependent on the strength properties of thereinforcement fibers since they are high compared to the resin system on its own.
The tensile strengths were assessed of the developed GFRP composites and average propertiesvalues are presented in Figure 4. From the behavior observed the material shows a linear responseproportionally to the load applied and the strain increases till reaching the maximum load where itexhibits a little non-linearity before its failure by progressive breaking of the fibers.
Figure 4. Stress as a function of strain for tensile test of GFRP composites
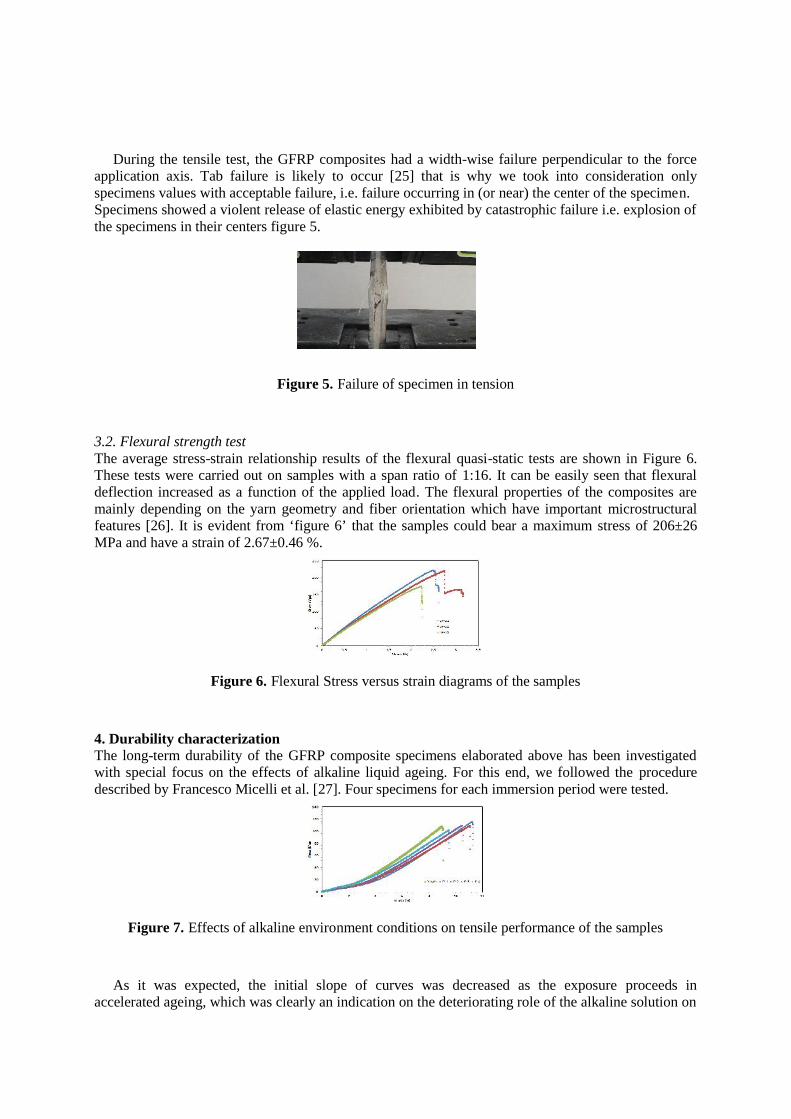
During the tensile test, the GFRP composites had a width-wise failure perpendicular to the forceapplication axis. Tab failure is likely to occur [25] that is why we took into consideration onlyspecimens values with acceptable failure, i.e. failure occurring in (or near) the center of the specimen.Specimens showed a violent release of elastic energy exhibited by catastrophic failure i.e. explosion ofthe specimens in their centers figure 5.
Figure 5. Failure of specimen in tension
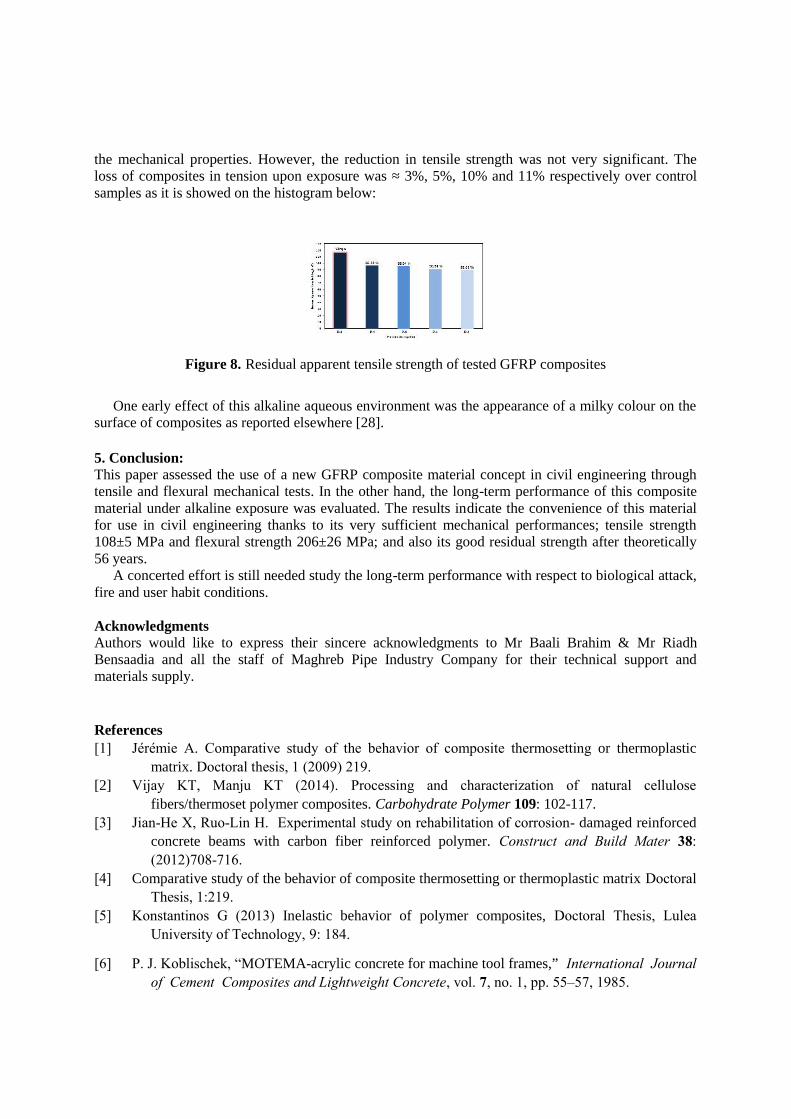
3.2. Flexural strength testThe average stress-strain relationship results of the flexural quasi-static tests are shown in Figure 6.These tests were carried out on samples with a span ratio of 1:16. It can be easily seen that flexuraldeflection increased as a function of the applied load. The flexural properties of the composites aremainly depending on the yarn geometry and fiber orientation which have important microstructuralfeatures [26]. It is evident from ‘figure 6’ that the samples could bear a maximum stress of 206±26MPa and have a strain of 2.67±0.46 %.
Figure 6. Flexural Stress versus strain diagrams of the samples
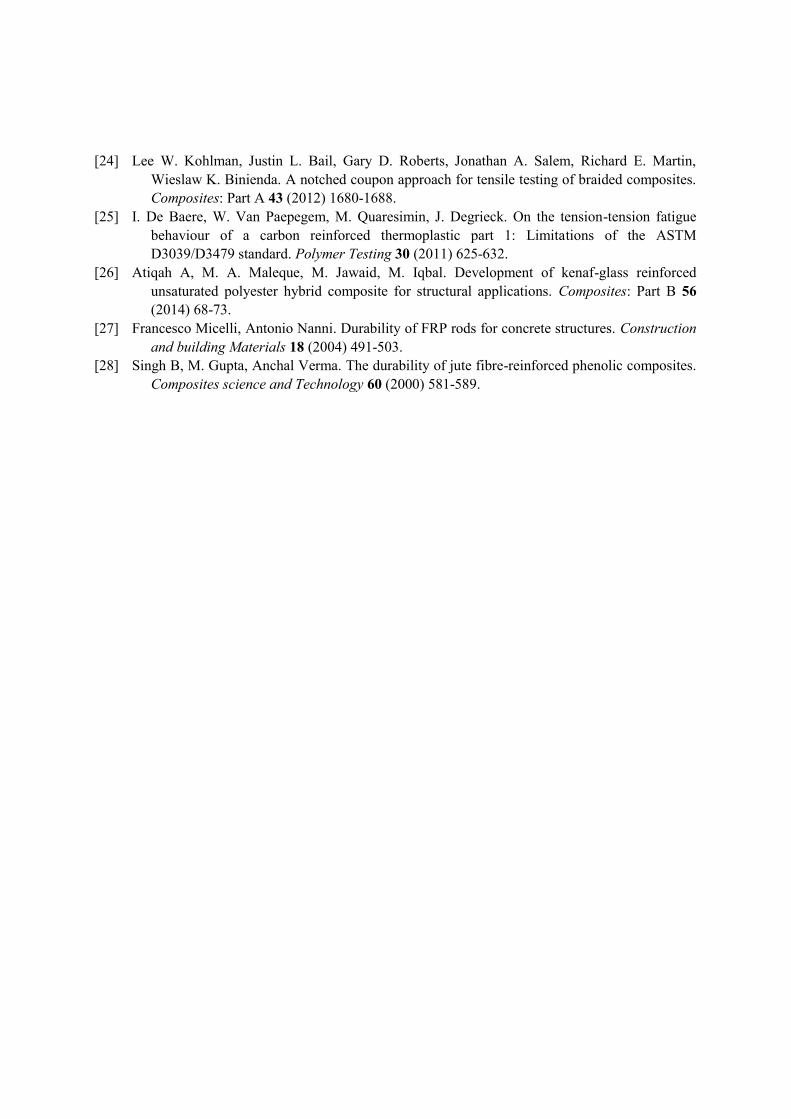
4. Durability characterizationThe long-term durability of the GFRP composite specimens elaborated above has been investigatedwith special focus on the effects of alkaline liquid ageing. For this end, we followed the proceduredescribed by Francesco Micelli et al. [27]. Four specimens for each immersion period were tested.
Figure 7. Effects of alkaline environment conditions on tensile performance of the samples
As it was expected, the initial slope of curves was decreased as the exposure proceeds inaccelerated ageing, which was clearly an indication on the deteriorating role of the alkaline solution on
the mechanical properties. However, the reduction in tensile strength was not very significant. Theloss of composites in tension upon exposure was ≈ 3%, 5%, 10% and 11% respectively over controlsamples as it is showed on the histogram below:
Figure 8. Residual apparent tensile strength of tested GFRP composites
One early effect of this alkaline aqueous environment was the appearance of a milky colour on thesurface of composites as reported elsewhere [28].
5. Conclusion:This paper assessed the use of a new GFRP composite material concept in civil engineering throughtensile and flexural mechanical tests. In the other hand, the long-term performance of this compositematerial under alkaline exposure was evaluated. The results indicate the convenience of this materialfor use in civil engineering thanks to its very sufficient mechanical performances; tensile strength108±5 MPa and flexural strength 206±26 MPa; and also its good residual strength after theoretically56 years.
A concerted effort is still needed study the long-term performance with respect to biological attack,fire and user habit conditions.
AcknowledgmentsAuthors would like to express their sincere acknowledgments to Mr Baali Brahim & Mr RiadhBensaadia and all the staff of Maghreb Pipe Industry Company for their technical support andmaterials supply.
References[1] Jérémie A. Comparative study of the behavior of composite thermosetting or thermoplastic
matrix. Doctoral thesis, 1 (2009) 219.[2] Vijay KT, Manju KT (2014). Processing and characterization of natural cellulose
fibers/thermoset polymer composites. Carbohydrate Polymer 109: 102-117.[3] Jian-He X, Ruo-Lin H. Experimental study on rehabilitation of corrosion- damaged reinforced
concrete beams with carbon fiber reinforced polymer. Construct and Build Mater 38:(2012)708-716.
[4] Comparative study of the behavior of composite thermosetting or thermoplastic matrix DoctoralThesis, 1:219.
[5] Konstantinos G (2013) Inelastic behavior of polymer composites, Doctoral Thesis, LuleaUniversity of Technology, 9: 184.
[6] P. J. Koblischek, “MOTEMA-acrylic concrete for machine tool frames,” International Journalof Cement Composites and Lightweight Concrete, vol. 7, no. 1, pp. 55–57, 1985.

[7] P. A. McKeown and G. H. Morgan, “Epoxy granite: a structural material for precisionmachines,” Precision Engineering, vol. 1, no. 4, pp. 227–229, 1979.
[8] K. Paderewski, “Use of polymer concretes in machine tool con- struction,” PrzegladMechaniczny, vol. 43, no. 13, pp. 12–15, 1984.
[9] Cresson L. ’Improved Manufacture of rubber road-facing, rubber-flooring rubber-tiling or otherrubber lining', British Patent 191, 474, 12 Jan. 1923, Cited by (Ohama Y. 'Polymer-BasedAdmixtures'. Cement and Concrete composites J. 1998, 20, pp 189-212.
[10] Bayan S. Al-Nu'man, Abdulkader Ismail al-Hadithi. Flexural Behaviour of polymer modifiedreinforced concrete beams. Journal of engineering and development, vol 13 No 1 march2009. ISSN 1813-7822.
[11] Novoa.P.J.R.O, M.C.S. Ribeiro, A.J.M. Ferreira, A.T. Marques. Mechanical Characterizationof lightweight polymer mortar modified with cork granulates. Composites science andtechnology 64 (2004) 2197-2205.
[12] Oussama Elalaoui. Optimisation de la formulation et de la tenue aux hautes températures d'unbéton à base d'époxyde. Thèse de Doctorat. Université de Cergy Pontoise. 2012.
[13] Guedes R.M, C.M.L Tavares, A.J.M.Ferreira. Experimental and theoretical study of the creepbehavior of GFRP-reinforced polymer concrete. Composites science and technology 64(2004) 1251-1259.
[14] Karina Guerra Tonet, Jane Proszek Gorninski. Polymer concrete with recycled PET: Theinfluence of the addition of industrial waste on flammability. Construction and buildingmaterials 40 (2013) 378-389.
[15] Leon Agavriloaie et al. Characterization of polymer concrete with epoxy polyurethane acrylmatrix. Construction and building materials. 37 (2012) 190-196.
[16] Reis J.M.L. Fracture and flexural characterization of natural fiber-reinforced polymer concrete.Construction and building materials 20 (2006) 673-678.
[17] Lawrence E. Kukacka. Concrete-Polymer Composites; Current Status and Future researchNeeds. International Symposium Plastics in Material And Structural Engineering. Prague,June 23-25.1981.
[18] Reis J.M.L Fracture assessment of polymer concrete in chemical degradation solutions.Construction and building Materials 24 (2010) 1708-1712.
[19] Reis J.M.L, Ferreira A.J.M. Assessment of fracture properties of epoxy polymer concretereinforced with short carbon and glass fibers. Construction and building 18 (2004) 523-528.
[20] Valentino Paolo Berardi, Geminiano Mancusi. A mechanical model for predicting the long termbehavior of reinforced polymer concretes. Mechanics research Communications 50 (2013)1-7
[21] Huanzi Wang, Abdeldjelil Belarbi. Flexural durability of FRP bars embedded in fiber-reinforced concrete. Construction and Building materials 44 (2013) 541-550.
[22] Francesca ceroni, edoardo cosenza, manfredi gaetano, marisa pecce. Durability issues of frprebars in reinforced concrete memebers. Cement & concrete composites 28 (2006) 857-868.
[23] Mustapha Bouakba, Abderrezak Bezazi, Katarzyna Boba, Fabrizio Scarpa, Stuart Bellamy.Cactus fiber/polyester biocomposites: Manufacturing, quasi-static mechanical and fatiguecharacterization. Composites Science and technology 74 (2013) 150-159.
[24] Lee W. Kohlman, Justin L. Bail, Gary D. Roberts, Jonathan A. Salem, Richard E. Martin,Wieslaw K. Binienda. A notched coupon approach for tensile testing of braided composites.Composites: Part A 43 (2012) 1680-1688.
[25] I. De Baere, W. Van Paepegem, M. Quaresimin, J. Degrieck. On the tension-tension fatiguebehaviour of a carbon reinforced thermoplastic part 1: Limitations of the ASTMD3039/D3479 standard. Polymer Testing 30 (2011) 625-632.
[26] Atiqah A, M. A. Maleque, M. Jawaid, M. Iqbal. Development of kenaf-glass reinforcedunsaturated polyester hybrid composite for structural applications. Composites: Part B 56(2014) 68-73.
[27] Francesco Micelli, Antonio Nanni. Durability of FRP rods for concrete structures. Constructionand building Materials 18 (2004) 491-503.
[28] Singh B, M. Gupta, Anchal Verma. The durability of jute fibre-reinforced phenolic composites.Composites science and Technology 60 (2000) 581-589.

Exergy analysis of encapsulation of photochromic dye by
spray drying
A Çay, E P Akçakoca Kumbasar and S Morsunbul Department of Textile Engineering, Faculty of Engineering, Ege University, Bornova
35100, İzmir, Turkey
E-mail: [email protected] Abstract. Application of exergy analysis methodology for encapsulation of photochromic dyes
by spray drying was presented. Spray drying system was investigated considering two
subsystems, the heater and the dryer sections. Exergy models for each subsystem were
proposed and exergy destruction rate and exergy efficiency of each subsystem and the whole
system were computed. Energy and exergy efficiency of the system were calculated to be
5.28% and 3.40%, respectively. It was found that 90% of the total exergy inlet was destroyed
during encapsulation by spray drying and the exergy destruction of the heater was found to be
higher.
1. Introduction
Efficient use of natural resources such as energy and water is one of the main prerequisites of
sustainable development to protect our common future. Therefore, energy consumption of industrial
processes, particularly thermal systems, should be analysed and possible energy saving measures
should be investigated. Exergy analysis methodology is an effective method based on the evaluation of
thermodynamic losses follows from the Second Law [1]. Exergy is defined as “the work potential of a
system in a specified environment” and represents the maximum amount of useful work that can be
obtained as the system is brought to equilibrium with the environment [2]. It can be used as an
essential tool for system design, analysis and optimisation of thermal systems [3].
Textile production processes have high rates of energy consumption, and even higher when
technical and functional properties are desired. UV protection is an important class of these functional
properties of late years due to global warming and ozone layer depletion. Recently the use of
photochromic dyes to develop UV protective textile materials has been appeared in research phase, in
which the first results were presented by the authors of present contribution [4]. Direct application of
photochromic dyes onto textile materials is problematic due to insolubility in water, low heat
resistance and poor wash fastness. Thus, photochromic dyes for textiles can be produced in
encapsulated form to overcome these problems. Within various encapsulation methods, spray drying
method is often used for industrial applications. The process of spray drying is also a thermal process
since it is based on drying. Drying processes are energy-intensive with a great industrial significance.
Moreover, it has been reported that spray drying is the most energy-intensive drying method
subsequent to freeze drying [5]. Therefore, to reveal an optimum and sustainable photochromic textile
production process, investigation of exergy efficiency of spray drying during production of
phochromic microcapsules is of importance as well as product properties such as microcapsule yield,
homogeneity and dimensions of microcapsules and colour build-up properties when applied onto
photochromic textiles.
Although numerous studies have been performed on the exergy analysis of drying processes,
studies on the exergy analysis of spray drying process are still limited. Exergy analysis of fish oil
encapsulation [6-10], cheese powder production [11-14], drying of milk droplets [15] and drying of
cornelian cherry puree [16] by spray drying have been appeared in the literature. Besides, application
of exergy analysis methodology to the encapsulation of photochromic dyes by spray drying has been
carried out for the first time in this study.
2. Method and Analysis
A spirooxazine based photochromic dye was encapsulated with ethyl cellulose using laboratory scale
spray dryer (Buchi B-290). 3% w/v photochromic dye and 3% w/v ethyl cellulose were dissolved in
water/ethanol mixture (80/20%). During spray drying, prepared solution was fed to the spray dryer,
atomised into the drying cabinet through which a stream of hot air (150 oC) passes and microcapsules
were produced. Mass flow rate of drying air and feeding rate of the solution was set to be 95% and
10%, respectively.
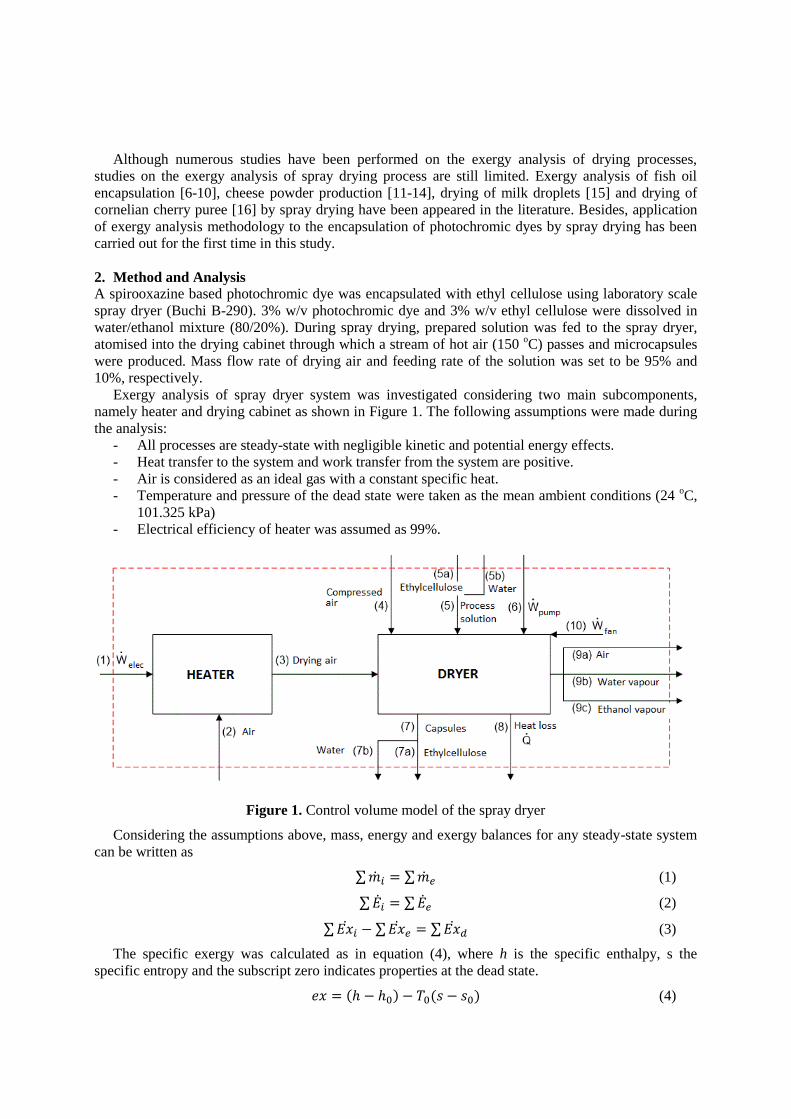
Exergy analysis of spray dryer system was investigated considering two main subcomponents,
namely heater and drying cabinet as shown in Figure 1. The following assumptions were made during
the analysis:
- All processes are steady-state with negligible kinetic and potential energy effects.
- Heat transfer to the system and work transfer from the system are positive.
- Air is considered as an ideal gas with a constant specific heat.
- Temperature and pressure of the dead state were taken as the mean ambient conditions (24 oC,
101.325 kPa)
- Electrical efficiency of heater was assumed as 99%.
Figure 1. Control volume model of the spray dryer
Considering the assumptions above, mass, energy and exergy balances for any steady-state system
can be written as
∑ ��𝑖 = ∑ ��𝑒 (1)
∑ ��𝑖 = ∑ ��𝑒 (2)
∑ 𝐸��𝑖 − ∑ 𝐸��𝑒 = ∑ 𝐸��𝑑 (3)
The specific exergy was calculated as in equation (4), where h is the specific enthalpy, s the
specific entropy and the subscript zero indicates properties at the dead state.
𝑒𝑥 = (ℎ − ℎ0) − 𝑇0(𝑠 − 𝑠0) (4)

The exergy rate of each stream was evaluated as
𝐸�� = �� ∙ 𝑒𝑥 (5)
Exergy balance equations for heater and dryer sub-system of the spray dryer were calculated
according to equations (6) and (7), respectively, considering the notations of each stream given in
Figure 1.
��1 + ��𝑥2 = ��𝑥3 + ��𝑥𝑑,ℎ𝑒𝑎𝑡𝑒𝑟 (6)
��𝑥3 + ��𝑥4 + ∑ ��𝑥5 + ��6 + ��10 = ∑ ��𝑥7 + ∑ ��𝑥9 + ��𝑥𝑞 + ��𝑥𝑑,𝑑𝑟𝑦𝑒𝑟 (7)
Mass flow rate of drying air, compresses air and solution were taken from the device catalogue
depending on the machine settings. The inlet and outlet drying air temperatures were obtained directly
from the screens of the device. Spray dryer surface temperature and material temperatures were
measured with an IR thermometer (Proscan 520). Other data was calculated by the energy balance
equations. Thermodynamic properties of air, water and ethanol were obtained from thermodynamic
tables. Enthalpy and entropy values for water vapour and ethanol vapour were calculated according to
equations (8) and (9), where Tm is the mean material temperature, hfg and sfg are the enthalpy and
entropy of vaporisation at mean material temperature, respectively.
ℎ𝑔 = 𝑐𝑝,𝑓(𝑇𝑚 − 𝑇0) + ℎ𝑓𝑔(𝑇𝑚, 𝑃) + 𝑐𝑝,𝑔(𝑇𝑔 − 𝑇𝑔) (8)
𝑠𝑔 = 𝑐𝑝,𝑓𝑙𝑛 (𝑇𝑚
𝑇0) + 𝑠𝑓𝑔(𝑇𝑚, 𝑃) + 𝑐𝑝,𝑔𝑙𝑛(
𝑇𝑔
𝑇𝑚) (9)
Specific exergy of air was calculated as follows [1]:
𝑒𝑥 = 𝑐𝑝(𝑇 − 𝑇0) − 𝑇0(𝑐𝑝𝑙𝑛𝑇
𝑇0− 𝑅𝑙𝑛
𝑃
𝑃0) (10)
Prepared solution and resultant capsules contain ethyl cellulose and photochromic dye. It is stated
in the literature that the change in the solids content in the spray drying process has no effect on the
exergy parameters [9, 16]. Hence, since the specific heat of photochromic dye is unknown, the exergy
change in the photochromic dye was neglected in the exergy analysis.
Exergy efficiency of dryers depends on the ratio of the exergy use in the drying of the product to
the exergy supplied to the system. The product term is the exergy rate of the evaporated fluids (water
and ethanol in this case). Exergy supply is the sum of the electric power and the compresses air
entering the system. Therefore, the total exergy efficiency of the spray dryer system was calculated as
in equation (11) [17].
𝜀𝑡 =∑ Exfg
∑ Exf=
∑ Exfg
W1+W6+W10+Ex4 (11)
��𝑥𝑓𝑔 = (1 −𝑇0
𝑇𝑚)��𝑓𝑔 (11a)
��𝑓𝑔 = ��𝑤ℎ𝑓𝑔,𝑤 + ��𝑒ℎ𝑓𝑔,𝑒 (11b)
Exergy efficiency of each sub-system (heater and dryer) was calculated as follows:
𝜀ℎ𝑒𝑎𝑡𝑒𝑟 =��𝑥3−��𝑥2
𝑊1 (12)
𝜀𝑑𝑟𝑦𝑒𝑟 =∑ ��𝑥𝑓𝑔
∑ ��𝑥𝑎=
∑ ��𝑥𝑓𝑔
��𝑥3+��𝑥4 (13)
Energy efficiency of the system was calculated by the ratio of the energy required to evaporate the
water and ethanol to the energy inlet.
𝜂 =��𝑓𝑔
𝐸𝑖 (14)
Sustainability index, proposed by Rosen et al. [18] was calculated according to equation (15). This
relationship shows how the change in the exergy efficiency of a process or a system influences
sustainability.
ε = 1 −1
𝑆𝐼 (15)
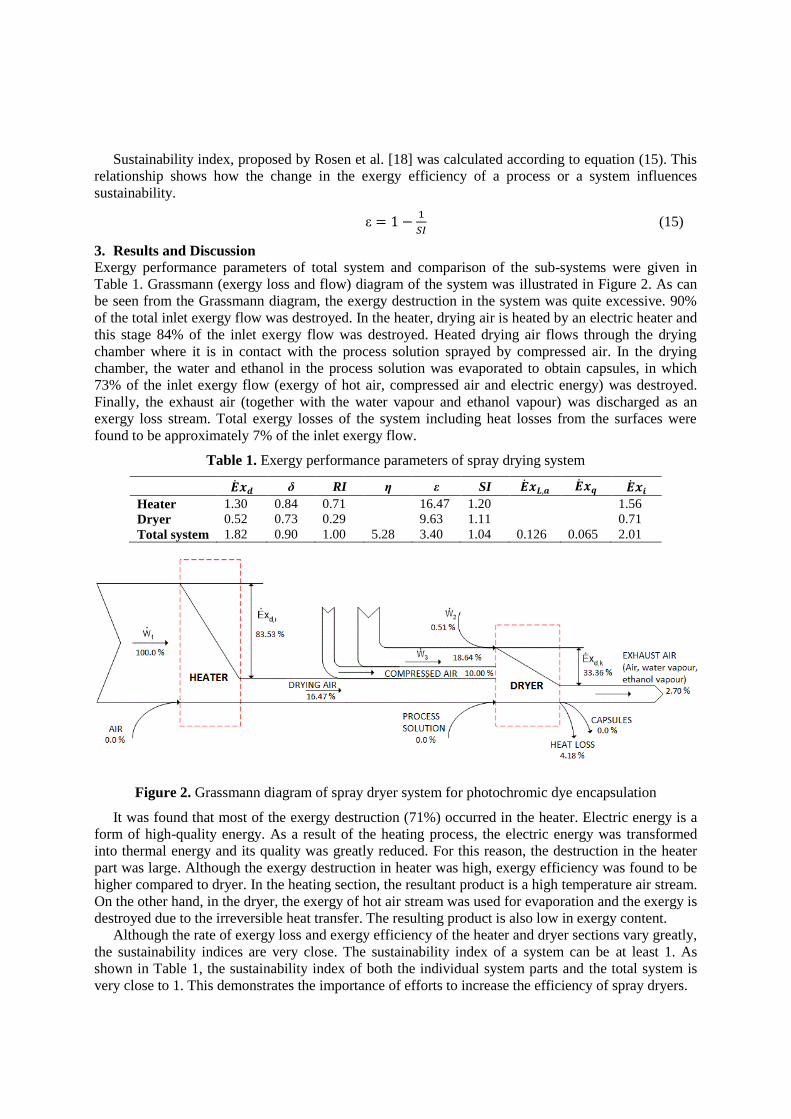
3. Results and Discussion
Exergy performance parameters of total system and comparison of the sub-systems were given in
Table 1. Grassmann (exergy loss and flow) diagram of the system was illustrated in Figure 2. As can
be seen from the Grassmann diagram, the exergy destruction in the system was quite excessive. 90%
of the total inlet exergy flow was destroyed. In the heater, drying air is heated by an electric heater and
this stage 84% of the inlet exergy flow was destroyed. Heated drying air flows through the drying
chamber where it is in contact with the process solution sprayed by compressed air. In the drying
chamber, the water and ethanol in the process solution was evaporated to obtain capsules, in which
73% of the inlet exergy flow (exergy of hot air, compressed air and electric energy) was destroyed.
Finally, the exhaust air (together with the water vapour and ethanol vapour) was discharged as an
exergy loss stream. Total exergy losses of the system including heat losses from the surfaces were
found to be approximately 7% of the inlet exergy flow.
Table 1. Exergy performance parameters of spray drying system
��𝒙𝒅 δ RI η ε SI ��𝒙𝑳,𝒂 ��𝒙𝒒 ��𝒙𝒊
Heater 1.30 0.84 0.71 16.47 1.20 1.56
Dryer 0.52 0.73 0.29 9.63 1.11 0.71
Total system 1.82 0.90 1.00 5.28 3.40 1.04 0.126 0.065 2.01
Figure 2. Grassmann diagram of spray dryer system for photochromic dye encapsulation
It was found that most of the exergy destruction (71%) occurred in the heater. Electric energy is a
form of high-quality energy. As a result of the heating process, the electric energy was transformed
into thermal energy and its quality was greatly reduced. For this reason, the destruction in the heater
part was large. Although the exergy destruction in heater was high, exergy efficiency was found to be
higher compared to dryer. In the heating section, the resultant product is a high temperature air stream.
On the other hand, in the dryer, the exergy of hot air stream was used for evaporation and the exergy is
destroyed due to the irreversible heat transfer. The resulting product is also low in exergy content.
Although the rate of exergy loss and exergy efficiency of the heater and dryer sections vary greatly,
the sustainability indices are very close. The sustainability index of a system can be at least 1. As
shown in Table 1, the sustainability index of both the individual system parts and the total system is
very close to 1. This demonstrates the importance of efforts to increase the efficiency of spray dryers.

4. Conclusion
Exergetic modelling of photochromic dye encapsulation by spray drying was investigated and exergy
analysis methodology was presented. Exergy parameters of sub-systems and whole drying system
were revealed. Exergy destruction of the heater section was found to be higher. Total system energy
and exergy efficiency was found to be 5.28% and 3.40%, respectively. When the thermal inefficiency
of drying processes is considered, low exergy efficiency values are expected. At this point, it is
important for the machine manufacturers to introduce machine designs to reduce exergy destruction
and improve exergy efficiency. On the other hand, for machine users, it is necessary to determine the
optimum process conditions at which the highest exergy efficiency can be achieved. Preliminary
results showed that the decrease in drying air temperature and mass flow rate decreased the exergy
destruction rate and increased exergy efficiency of the system. Thus, further research on the effects of
the process parameters on the exergy performance parameters of photochromic dye encapsulation
process by spray drying was planned to be investigated as a continuation of this study.
Acknowledgments The authors would like to gratefully acknowledge the financial support for this research received
through Project No. 214M428 of The Scientific and Technical Research Council of Turkey
(TUBITAK).
Nomenclature
cp specific heat (kJ/kgK)
ex specific exergy (kJ/kg)
��𝑥 exergy rate (kJ/s)
h enthalpy (kJ/kg)
�� mass flow rate (kg/s)
P pressure (kPa)
�� heat flow rate (kJ/s)
R gas constant (kJ/kgK)
RI relative irreversibility
s entropy (kJ/kgK)
SI sustainability index
T temperature (K)
�� power (kW)
Greek symbols
δ exergy destruction ratio
ε exergy efficiency
η energy efficiency
Subscripts
0 dead state
a air
d destruction
e exit, ethanol
f fluid, fuel
fg evaporation
g gas
i inlet
L loss
m material
q heat transfer related
t total
w water

References
[1] Kotas T J 1995 The Exergy Method of Thermal Plant Analysis (Malabar: Krieger Publishing)
[2] Çengel Y A, Boles M A 2001 Thermodynamics: An Engineering Approach (New York:
McGraw-Hill)
[3] Dincer I, Sahin A Z 2004 A new model for thermodynamic analysis of a drying process Int J
Heat Mass Tran 47 645-52
[4] Akcakoca Kumbasar E P, Çay A Morsunbul S, Voncina B 2016 Color build-up and UV-
protection performance of encapsulated photochromic dye-treated cotton fabrics AATCC
Journal of Research 3 1-7
[5] Kudra T 2004 Energy aspects in drying Dry Technol 22 917-32
[6] Aghbashlo M, Mobli H, Rafiee S, Madadlou A 2012 Energy and exergy analyses of the spray
drying process of fish oil microencapsulation Biosyst Eng 111 229-41
[7] Aghbashlo M, Mobli H, Madadlou A, Rafiee S 2012 Influence of spray dryer parameters on
exergetic performance of microencapsulation process Int. J. Exergy 10 267-89
[8] Aghbashlo M, Mobli H, Madadlou A, Rafiee S 2012 Integrated optimization of fish oil
microencapsulation process by spray drying J Microencapsulation 29 790-804
[9] Aghbashlo M, Mobli H, Rafiee S, Madadlou A 2012 Optimization of emulsification procedure
for mutual maximizing the encapsulation and exergy efficiencies of fish oil microencapsulation
Powder Technol 225 107-17
[10] Aghbashlo M, Mobli H, Rafiee S, Madadlou A 2012 The use of artificial neural network to
predict exergetic performance of spray drying process: A preliminary study Comput Electron
Agric 88 32-43
[11] Erbay Z, Koca N 2012 Investigating the effects of operating conditions on the exergetic
performance of a pilot-scale spray-drying system Int J Exergy 11 302-21
[12] Erbay Z, Koca N 2012 Energetic, exergetic, and exergoeconomic analyses of spray-drying
process during white cheese powder production Drying Technol 30 435-44
[13] Erbay Z, Koca N 2014 Exergoeconomic performance assessment of a pilot-scale spray dryer
using the specific exergy costing method Biosyst Eng 122 127-38
[14] Erbay Z, Koca N, Kaymak-Ertekin F, Ucuncu M 2015 Optimization of spray drying process in
cheesepowder production Food Bioprod Process 93 156-65
[15] Jin Y, Chen X D 2011 Entropy production during the drying process of milk droplets in an
industrial spray dryer Int J Therm Sci 50 615-625
[16] Saygı G, Erbay Z, Koca N 2015 Energy and exergy analyses of spray drying of a fruit puree
(cornelian cherry puree) Int J Exergy 16 315-336
[17] Syahrul S, Dincer I, Hamdullahpur F 2003 Thermodynamic modeling of fluidized bed drying of
moist particles Int J Therm Sci 42 691-701
[18] Rosen M A, Dincer I, Kanoglu M 2008 Role of exergy in increasing efficiency and
sustainability and reducing environmental impact Energy Policy 36 128-37
Flame-resistant pure and hybrid woven fabrics from basalt
H Jamshaid1,2
, R Mishra 2, J Militky
2
1National Textile University, Faculty of Textile Engineering Faisalabad, Pakistan.
2 Technical University of Liberec, Faculty of Textile Engineering, Liberec, Czech
Republic
E-mail: [email protected]
Abstract. This work has been formulated to investigate the burning behavior of different type
of fabrics. The main concentration is to see how long the fabric resists after it catches the fire
and the propagation of fire can be reduced by using flame resistant fiber i.e basalt. Basalt fiber
is an environmental friendly material with low input, high output, low energy consumption and
less emission. The goal of present investigations is to show the dependence of fabric
flammability on its structure parameters i.e weave type, blend type etc. Fabric weaves have
strong effect on flammability properties. Plain weave has the lowest burning rate as the density
of the plain weave fabric is more and the structure is tight which gives less chances of flame
passing through the fabric. Thermal stability is evaluated with TGA of all hybrid and non-
hybrid fabrics and compared. The thermal stability of the basalt fiber is excellent. When
comparing thermal analysis curves for hybrid samples it demonstrates that thermal stability of
the samples containing basalt is much higher than the non- hybrid samples. Percentage weight
loss is less in hybrid samples as compared to non-hybrid samples. The effectiveness of
hybridization on samples may be indicated by substantial lowering of the decomposition mass.
Correlation was made between flammability with the infrared radiations (IR)
1. Introduction
The safety of human beings has become a prime consideration in recent years. A considerable part of
textile sector is involved with developments of fibers and fabrics. Organic materials which are
generally excellent fuels play a major role in our daily life and textiles. Organic materials mainly
consist of carbon, a dominant majority contains hydrogen, in addition to this, oxygen, nitrogen and
other elements are present in variable quantity. Flammability of a material, considered as a complex
property, consists of a combination of combustion, ignition and fire propagation; organic materials are
flammable and bear potentially high fire risks. An involvement of complex combination of physical
and chemical reactions which involve inter-conversion of condensed and gaseous phases results in
flammability.
A number of new developments involving fibers and fabrics are carried out to cop the challenge of
fire exposure. Flame retardant fabrics are developed with a property of natural resistance against fire
as they may burn or char but won’t propagate flame. The essential requirement is a material that bear
low propensity to ignition and low heat barrier in order to have fire resistance [1]. Textile fabrics are
used in protective clothing, some of the uses are, flexible insulation panel in building construction, fire
blockers for upholstery and seats, brattice cloth in mines used primarily for ventilation, furnishing for
public halls and transport etc. Polypropylene (PP) and Polyester (PET) are two among the top ten
polymers in use with their main uses in battery trays, air ducts, instrument panels etc [2].
When a fabric is exposed to fire, it generates heat energy which leads to heat transfer through
conduction, radiation and convection. Heat generated and transferred varies greatly depending on fiber
content. An addition of heat of burning and fabric weight describes quantity of available heat.
Thermoplastics like polypropylene, polyester and nylon, when heated after melting point, contract by
surface tension which results in minimization of surface area and degree of burning [3].
A mixture of radiant and convective heat creates a hot environment. Flame retardant fibers like
glass provide good protection against heat as they have low coefficient of thermal conductivity i.e.
0.034-0.04 W/m K, the heat passes slowly and spread of flame is reduced leading to decrease in
material destruction. Basalt fibre is mainly composed of SiO2, Al2O3, CaO, MgO, Fe2O3, FeO, Na2O,
and K2O. The main presence of SiO2 results in chemical stability and excellent mechanical properties.
High mass ratio of Al2O3 gives the fibre chemical and thermal stability, durability and higher tensile
properties. Ferric oxide gives fibre brown color and affects melting parameters and conductivity [4].
Low thermal conductivity coefficient of basalt fibres i.e. 0.031-0.038 W/m.K provides good
protection. Their high diameter is irrespirable and they can replace asbestos in many applications
[5].These fibres have also good mechanical strength, non-flammability (LOI value of fibre is 430) and
good electrical and insulation properties.
It is particularly important to determine the extent to which fibre and fabric structure affects the
final burning behaviour of the product. This will allow designing final products with suitable physical
and burning properties for end use. There are studies regarding many flame retarding materials
application on textiles [1-3]. However little work is done on study of effect of hybridization of flame-
resistant fibres with flammable fibres. This study evaluates the influence of hybridization on the
flammability and thermal stability of fabrics. The presence of inherent flame resistant material in
fabrics is expected to improve flammability properties. In addition effect of weave structures on
flammability characteristics were also taken into account. A correlation was established between the
flammability and IR radiations which opens new horizon for flame resistant fabrics.
2. Material &Methods
The polyester (PET) and jute yarn used in our study were available commercially. Polypropylene yarn
was taken from Synthetic (Pakistan). The basalt yarn was used as received from Kamenny Vek (KV)
(Russia). The research was focused on the flammable properties of hybrid fabrics with Basalt (B) in
warp /weft and Polypropylene (PP), Polyester (PET) and Jute (J) yarns in weft and vice versa. Fabrics
were prepared in three type of weaves i.e. Plain weave, Matt weave and 1/3 Twill. Pure fabrics were
made for the comparison with other fabrics. All fabrics were made on the CCI sample loom with the
same density, 12 threads/cm in warp and 8 threads/cm in weft. The flammability of the samples was
investigated using the horizontal test method according to standard DIN 50050- 1:1986, which is
applicable to all textile materials. The thermal behavior of hybrid and non- hybrid woven fabrics were
studied under thermo gravimetric analysis (TGA). The thermo gravimetric analysis was performed on
Mettler Toledo in air from 30 °C to 600 °C at a heating rate of 10 °C/min. SEM was used for
investigating the degradation of samples. Attenuated total reflection (ATR) infrared spectroscopy
(NicoletiZ10, Thermo Fisher Scientific Corporation) was used in order to understand the co-relation of
IR and flammability for PP and PET fiber.
3. Results and discussion
3.1. Flammability Analysis
Ignition and flammability are not the same; ignition typically refers to how quickly a fabric will ignite
if exposed to an ignition source, while flammability or rate of flame refers to how quickly the fire will
spread. For textiles, the critical factor in determining flammability ratings for varying construction
techniques is the availability of oxygen. Combustion is accelerated if air can permeate a fabric easily.

Porosity has significant effect on availability of oxygen. The weight, thickness, fabric density and
weave of fabric can affect the material to ignite and burn. Fabrics with more of the fiber surface area
exposed to air have more oxygen available to support burning and therefore burn more easily. The
plain weave shows the highest weave factor of the order of 1 as compared to remaining weave (i.e
0.84 for both matt and twill) . Plain weave fabric has a maximum number of interlacement per unit
area. Hence the empty spaces are less as compared to other weaves, as the empty spaces between
yarns decrease, the weave structure become tight. Plain weave structure is tightly woven structure due
to less float, so it will burn more slowly as compared to other fabrics of the same material. Matt and
twill has same weave factor but matt has less burning rate because of its structural parameters. When
the length of float increases, the ignition decreases [6-7]. Thickness has also effect in single layer
fabric [8]. Twill weave take more time to ignite as it has long float than other weaves and it may be
because of thickness as twill has more thickness because of its diagonal line structure. Although this
difference is not so significant. A comparison of burning rate of different type of fabrics is shown in
Figure 1. The flammability of textiles is influenced by the inherent characteristics of different types of
fibers. Fiber combustion is decided by two conditions, first the composition and structure of fiber
directly affects its thermal decomposition temperature and second the Oxygen supply circumstance,
the fiber combustion performance is judged by LOI [6]. The chemical composition of the polymer
exerts the greatest influence on its burning behavior. Mode of decomposition and the nature of the
decomposition products (solid, liquid, and gaseous products) depend on the chemical nature of the
fiber. The thermal decomposition products determine the flammability of polymers (e.g., fibers or
modified fibers).
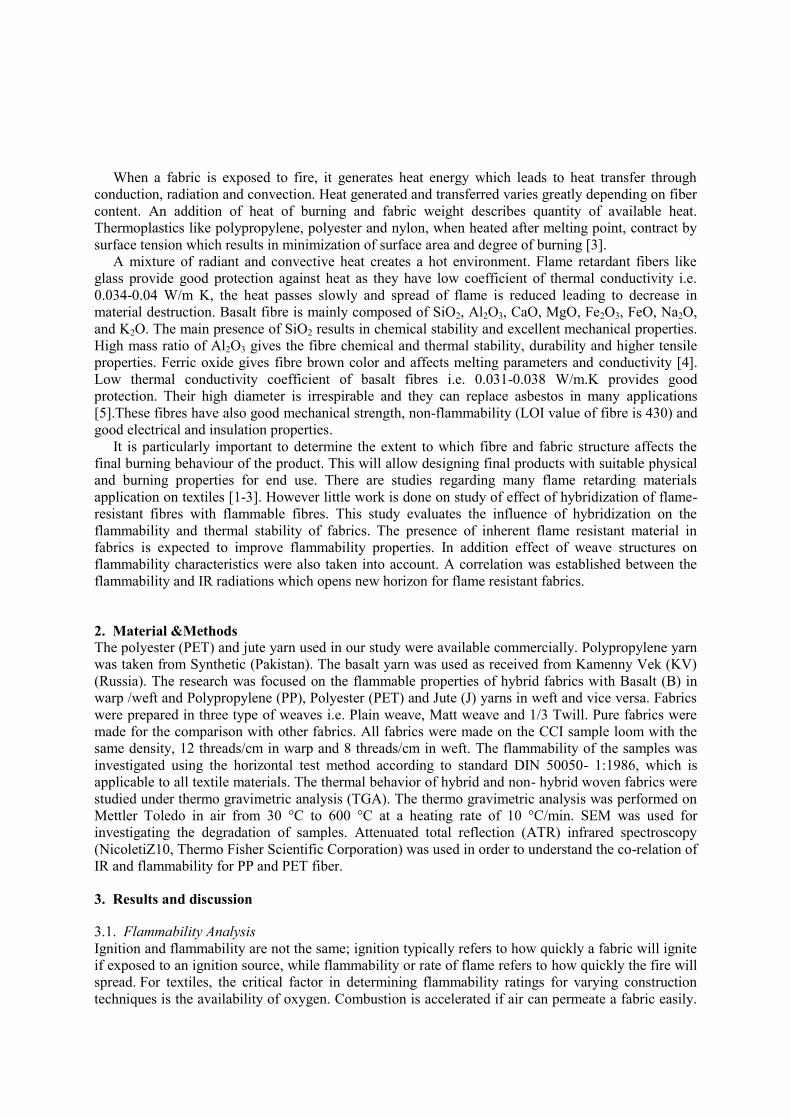
As mentioned in Table 1 and in Figure 1 , basalt fibre does not melt and shrink when it approaches
flame. It will curl slightly and redden like an iron wire when it is contacted with the flame [8] so B/B
structures has no effect of flame.
Table 1: Behavior of fabrics on application of flame.
Sample
name
Flame
formatio
n
Melt dripping Smoke
formatio
n
Char
formatio
n
Time
to
ignitio
n (sec)
Burnin
g rate
(sec)
Comment
s
B/B PW X X X X X X Not Burn
B/B BW X X X X X X Not Burn
B/B TW X X X X X X Not Burn
PP/PP PW Late Higher Almost
No
No 15 120 Totally
Melt
PP/PP BW Late Higher Almost
No
No 16 110 Totally
Melt
PP/PP TW Late Higher Almost
No
No 17 100 Totally
Melt
PET/PET
PW
Moderate Moderate Moderate Lower 10 110 Totally
Melt
PET/PET
BW
Moderate Moderate Moderate Lower 11 107 Totally
Melt
PET/PET/T
W
Moderate Moderate Moderate Lower 12 105 Totally
Melt
J/J PW Higher No Lower Higher 2 95 Only Char
Left
J/J BW Higher No Lower Higher 3 90 Only Char

Left
J/J TW Higher No Lower Higher 4 84 Only Char
Left
B/PP PW Late Moderate Medium No 18 180 Only
Basalt
Left
B/PP BW Late Moderate(Mor
e Then Pw)
Medium No 18.5 169 Only
Basalt
Left
B/PP TW Late Moderate Medium No 19 152 Only
Basalt
Left
B/PET PW Moderate Lower Moderate Lower 13 162 Stick
Together
B/PET BW Moderate Lower Moderate Lower 14 150 Stick
Together
B/PET TW Moderate Lower Moderate Lower 15 145 Stick
Together
B/J PW High No Lower Higher 5 120 Basalt
With Char
Left
B/J BW High No Lower Higher 5.5 110 Basalt
With Char
Left
B/J TW High No Lower Higher 5.7 105 Basalt
With Char
Left
PP/B PW Late Higher Low No 17 158 Only
Basalt
Left
PP/B BW Late Higher Low No 18 152 Only
Basalt
Left
PP/B TW Late Higher Low No 17.5 135 Only
Basalt
Left
PET/B PW Moderate Lower Moderate Lower 12 132 Stick
Together
PET/B BW Moderate Lower Moderate Lower 12.5 128 Stick
Together
PET/B TW Moderate Lower Moderate Lower 12 125 Stick
Together
PP/PP J/J B/PET B/J
Figure 1. Samples behavior during flame application
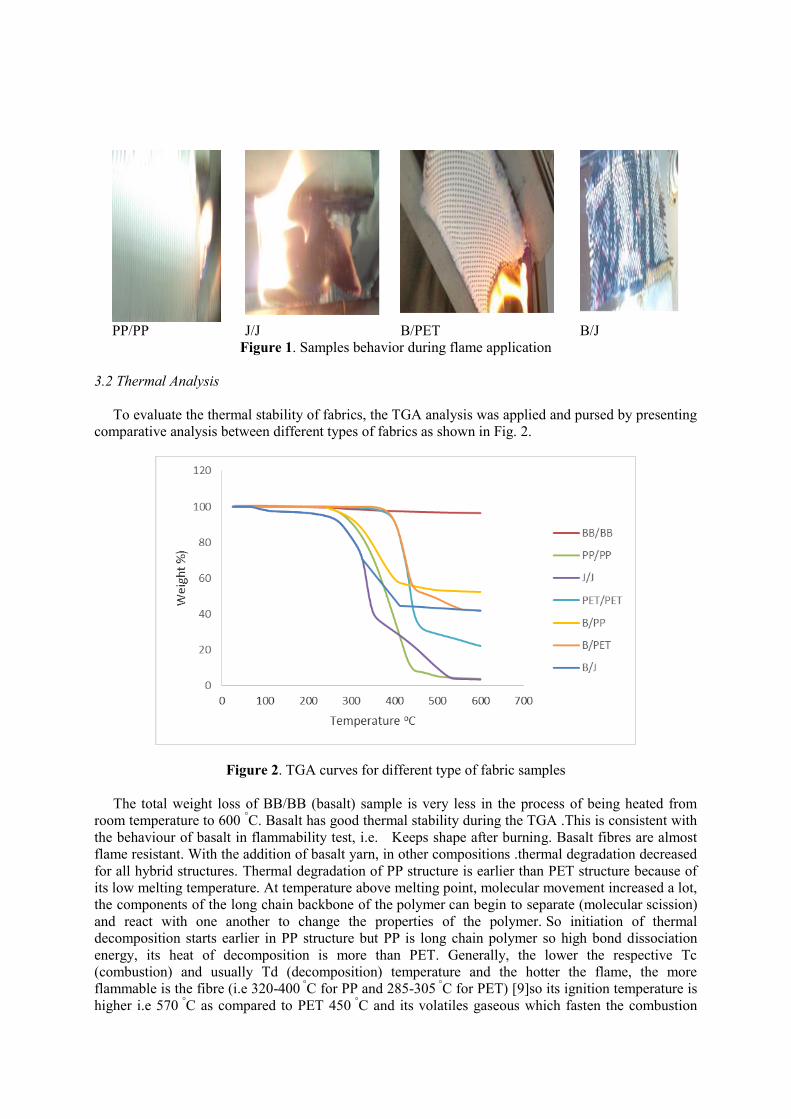
3.2 Thermal Analysis
To evaluate the thermal stability of fabrics, the TGA analysis was applied and pursed by presenting
comparative analysis between different types of fabrics as shown in Fig. 2.
Figure 2. TGA curves for different type of fabric samples
The total weight loss of BB/BB (basalt) sample is very less in the process of being heated from
room temperature to 600 °C. Basalt has good thermal stability during the TGA .This is consistent with
the behaviour of basalt in flammability test, i.e. Keeps shape after burning. Basalt fibres are almost
flame resistant. With the addition of basalt yarn, in other compositions .thermal degradation decreased
for all hybrid structures. Thermal degradation of PP structure is earlier than PET structure because of
its low melting temperature. At temperature above melting point, molecular movement increased a lot,
the components of the long chain backbone of the polymer can begin to separate (molecular scission)
and react with one another to change the properties of the polymer. So initiation of thermal
decomposition starts earlier in PP structure but PP is long chain polymer so high bond dissociation
energy, its heat of decomposition is more than PET. Generally, the lower the respective Tc
(combustion) and usually Td (decomposition) temperature and the hotter the flame, the more
flammable is the fibre (i.e 320-400 °C for PP and 285-305
°C for PET) [9]so its ignition temperature is
higher i.e 570 °
C as compared to PET 450 °
C and its volatiles gaseous which fasten the combustion

process are less as compared to PET so its flammability is less[7]. This is also verified by FTIR
analysis.
3.3 ATR–FTIR analysis
The flammability is correlated with the infrared radiations. The total energy absorbed by the PET is
two times greater than PP by calculation. Beer-Lambert law was applied to support the results. On the
basis of this equation, the total energy absorbed by the samples under IR radiations was calculated.
The results from this equation follow the same trend. The total energy absorbed by PET is two times
greater than PP. So, it is concluded on the basis of results obtained that PET is more flammable as it
absorbs more energy than PP and there is a correlation between the flammability and IR radiations.
(a) (b)
Figure 3. (a) IR Spectra of fabric samples (b) Total energy absorbed by fabric samples
4. Conclusions
Given its importance to consumer safety, fire resistant textiles/fire retardant textiles are one of the
fastest growing sectors in industrial textiles. Fabric weaves have strong effect on flammability
properties. Plain weave has least burning rate as the density of the plain weave fabric is more and the
structure is tight which gives less chances of flame passing through the fabric. The thermal stability of
the basalt fiber is excellent. When comparing thermal analysis curves for hybrid samples it
demonstrates that thermal stability of the samples containing basalt is much higher than the non-
hybrid samples. Percentage weight loss is less in hybrid samples as compared to non-hybrid samples.
Thermal analysis results were compared with flammability parameters. Good agreement was observed
between two except PP and PET due to material properties. It is also verified by co-relation between
flammability and IR. In all hybrid samples burning rate is less than their non- hybrid samples as high
thermal stability also reduces the burning (heat release) rate. It is novel approach to reduce
flammability and thermal degradation by fire resistance materials.
References
[1] Horrocks AR and Price D. Fire retardant materials. Cambridge woodhead Publishing Limited,
2001.

[2] Tewarson A, Abu-Isa IA, Cummings DR and LaDue DE. Characterization of the ignition
behaviour of polymers commonly used in the automotive industry. Fire Safety Science-
Proceedings of the Sixth International Symosium 2000, p. 991-1002.
[3] Chouinard M, Knodel D and Arnold H. Heat transfer from flammable fabrics. Textile Research
Journal. 1973; 43: 166-75.
[4] Swink M. Continuous filament basalt a unique fiber capable of leadership in high temperature
applications. Techtextil North America Symposium Atlanta, GA, USA. 2002.
[5] Jamshaid H and Mishra R. A green material from rock: basalt fiber–a review. The Journal of
The Textile Institute. 2016; 107: 923-37.
[6] Gotipamul RL, Dandgole PB, Dudagi IB, et al. Effect of cover factor and weave factor on
flammability characteristics of 100% cotton fabric. Melliand International. 2014; 20.
[7] Shi FJ. A Study on Structure and Properties of Basalt Fiber. Applied Mechanics and Materials.
2012; 238: 17-21.
[8] Baltušnikaitė J, Šuminskienė R and Milašius R. Influence of Woven Fabrics Structure upon
Flammability Properties. Materials Science (MEDŽIAGOTYRA). 2006; 12: 167-70.
[9] Vigo TL. Textile processing and properties: Preparation, dyeing, finishing and performance.
Elsevier, 2013

Enhancement of Spartium junceum L. fibres properties
Z Kovačević1, S Bischof1 and A Antonović2
1University of Zagreb, Faculty of Textile Technology, Department of Textile
Chemistry and Ecology, Prilaz baruna Filipovica 28 a, 10000 Zagreb, Croatia 2 University of Zagreb, Faculty of Forestry, Department of Materials Technology,
Svetosimunska 25, 10000 Zagreb, Croatia
E-mail: [email protected]
Abstract. Properties of lignocellulosic Spartium junceum L. (SJL) fibres were investigated in
order to use them as reinforcement in composite material production. The fibres were obtained
by microwave maceration process and additionally modified with NaOH, nanoclay and citric
acid with the aim to improve their mechanical, thermal and other physical-chemical properties.
Tensile and thermal properties of these natural fibres were enhanced by the different
modification treatment which is investigated by the Vibrodyn/Vibroskop method and
thermogravimetric analysis (TGA), whilst determination of chemical composition and fibre’s
surface properties were explored using scanning electron microscope (SEM), electron dispersive
spectroscopy (EDS) and elektrokinetic analyser. All the results show great improvement of
nanoclay/citric acid modified SJL properties.
1. Introduction
The rapidly increasing environmental awareness and growing global waste problem affected the
development concepts of sustainability and renewable materials. Due to the need for finding renewable
solutions in the development of new materials, the usage of composite materials made of biopolymer
matrices and natural fibres that are in the service of reinforcement is increasing significantly.
Considering they are durable, safe and have excellent mechanical properties [1], composite materials
reinforced with natural fibers are mostly used in automotive industry [2] in the function of panels, seats,
etc. Usage of such materials is favored by the Directive 2000/53/EC of European Union which requires
that by 2015th, member countries have to reuse a minimum of 95 % of waste vehicle which ensure that
less than 5 % of the waste vehicle would be landfilled [3, 4].
Although, bast fibres have been grown for centuries throughout the world, their production is
nowadays much higher in order to meet the demands of global market and to produce recyclable,
renewable, ‘green’ products. Some of the most used bast plants are: flax, hemp, kenaf, ramie, jute, etc.
Whilst flax and hemp have mostly been used as textile raw material of cellulosic origin in plains, in
coastal areas of the Mediterranean wild Spartium junceum L. - SJL has been used as textile raw material
since ancient times [5]. Aim of this research was to investigate modified SJL fibres in order to use them
as reinforcement in composite materials.
2. Experimental
2.1. Materials
Spartium junceum L. fibers were obtained from the SJL plant which was harvested in the area of town
Šibenik, Croatia. NaOH pellets (purity ≥ 97 %), Nanoclay (MMT modified with 25 - 30 wt %
octadecylamine), Citric acid (CA) and Sodyum Hypophosphite Hydrate (NaH2PO2) used for this study
were obtained from Sigma-Aldrich Company Ltd., UK.
2.2. Methods
Methods for determining the content of cellulose, lignin and hemicellulose were conducted in
compliance with the regulations previously described in Antonović et al. 2007 [6]. Chemical analysis of
modified fibres was conducted with scanning electron microscope (Mira, Tescan) and Quantax EDS
(Bruker). Breaking tenacity and fineness of individual fibres were examined using the Vibroskop and
Vibrodyn devices (Lenzing Instruments). Pyris 1 TGA (Perkin Elmer) thermogravimetric analyzer was
used for determination of thermal degradation on samples we were investigated. Additional
characterization of fibres surface before and after modification was collected by zeta potential
determined using the electrokinetic analyzer SurPASS (Anton Paar GmbH) based on the streaming
potential method.
3. Results and discussion
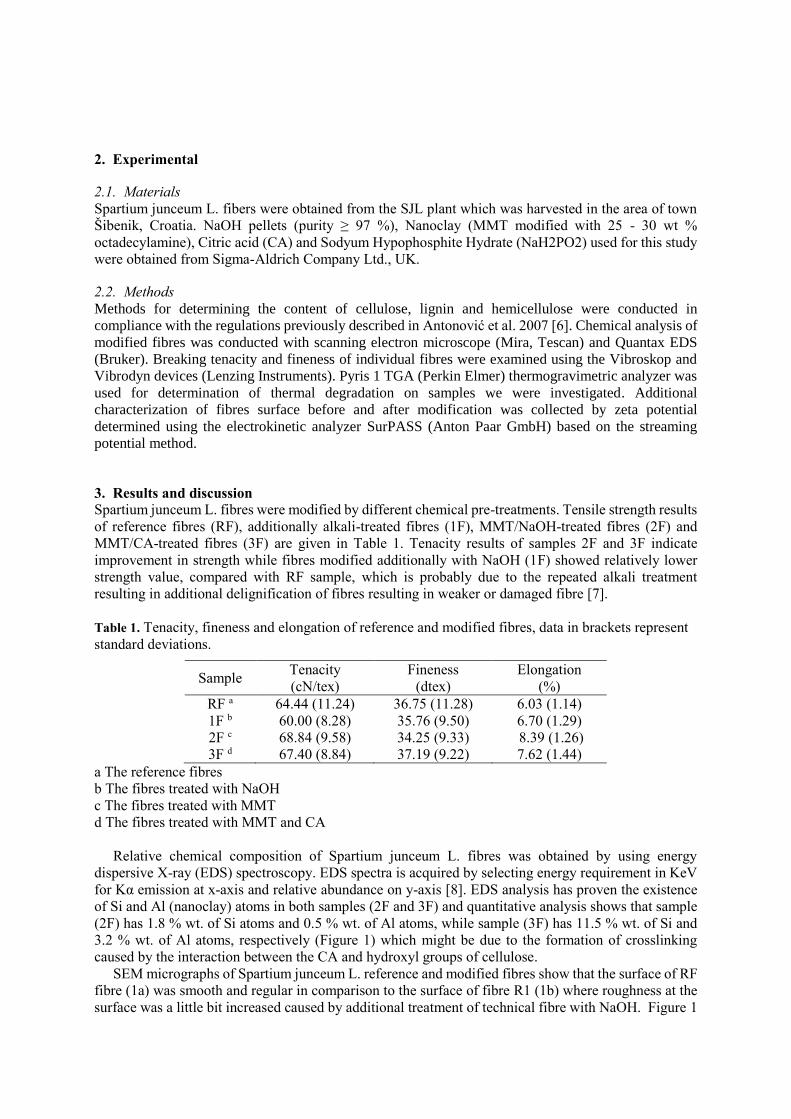
Spartium junceum L. fibres were modified by different chemical pre-treatments. Tensile strength results
of reference fibres (RF), additionally alkali-treated fibres (1F), MMT/NaOH-treated fibres (2F) and
MMT/CA-treated fibres (3F) are given in Table 1. Tenacity results of samples 2F and 3F indicate
improvement in strength while fibres modified additionally with NaOH (1F) showed relatively lower
strength value, compared with RF sample, which is probably due to the repeated alkali treatment
resulting in additional delignification of fibres resulting in weaker or damaged fibre [7].
Table 1. Tenacity, fineness and elongation of reference and modified fibres, data in brackets represent
standard deviations.
Sample Tenacity
(cN/tex)
Fineness
(dtex)
Elongation
(%)
RF a 64.44 (11.24) 36.75 (11.28) 6.03 (1.14)
1F b 60.00 (8.28) 35.76 (9.50) 6.70 (1.29)
2F c 68.84 (9.58) 34.25 (9.33) 8.39 (1.26)
3F d 67.40 (8.84) 37.19 (9.22) 7.62 (1.44)
a The reference fibres
b The fibres treated with NaOH
c The fibres treated with MMT
d The fibres treated with MMT and CA
Relative chemical composition of Spartium junceum L. fibres was obtained by using energy
dispersive X-ray (EDS) spectroscopy. EDS spectra is acquired by selecting energy requirement in KeV
for Kα emission at x-axis and relative abundance on y-axis [8]. EDS analysis has proven the existence
of Si and Al (nanoclay) atoms in both samples (2F and 3F) and quantitative analysis shows that sample
(2F) has 1.8 % wt. of Si atoms and 0.5 % wt. of Al atoms, while sample (3F) has 11.5 % wt. of Si and
3.2 % wt. of Al atoms, respectively (Figure 1) which might be due to the formation of crosslinking
caused by the interaction between the CA and hydroxyl groups of cellulose.
SEM micrographs of Spartium junceum L. reference and modified fibres show that the surface of RF
fibre (1a) was smooth and regular in comparison to the surface of fibre R1 (1b) where roughness at the
surface was a little bit increased caused by additional treatment of technical fibre with NaOH. Figure 1

c) and 1 d) show fibres treated with MMT and MMT/CA respectively. The roughness of the fibres
surface was increased with the addition of nanoclay which is especially visible in the 3F sample.
a) b)
c) d)
Figure 1. EDS spectra and SEM images of a) RF; b) 1F; c) 2F and, d) 3F.
In order to investigate hydrophilic/hydrophobic nature of Spartium junceum L. fibres, their ζ-
potential- pH dependence was determined in 1 mM KCl electrolyte solution. Figure 2 shows different
ζ-potential plateau values for all the tested fibres regarding their different treatment (modification).
Variation of electrokinetic properties within investigated SJL fibres is expected since any treatment of
fibres will affect the chemical fibre composition (cellulose, hemicellulose, pectine, lignin, waxes, etc.)
and increase the accessibility of dissociable hydroxyl groups [9, 10], therefore causing more negative ζ-
plateau value compared to RF. RF and 2F fibres have a small negative ζ-potential plateau values and
both of them display a rapid increase of the negative ζ-potential below pH 5. Rapid increment of ζ-
potential of 2F goes to more negative values indicating presence of nanoclay particles on the fibre
surface, also visible by the scanning electron microscope observations, Figure 1c [7]. Cellulosic fibres
have isoelectric point (IEP) values, where ζ-potential=0, at low pH values (around pH 2, extrapolated)
and the ζ-plateau values in the alkaline range. Modification of RF fibres additionally with NaOH (1F)
resulted in a shift in the IEP to slightly higher pH values (IEP 2.15) but also to slightly increased negative
ζ-potential values in the alkaline range. Since all the tested fibres have nearly the same chemical
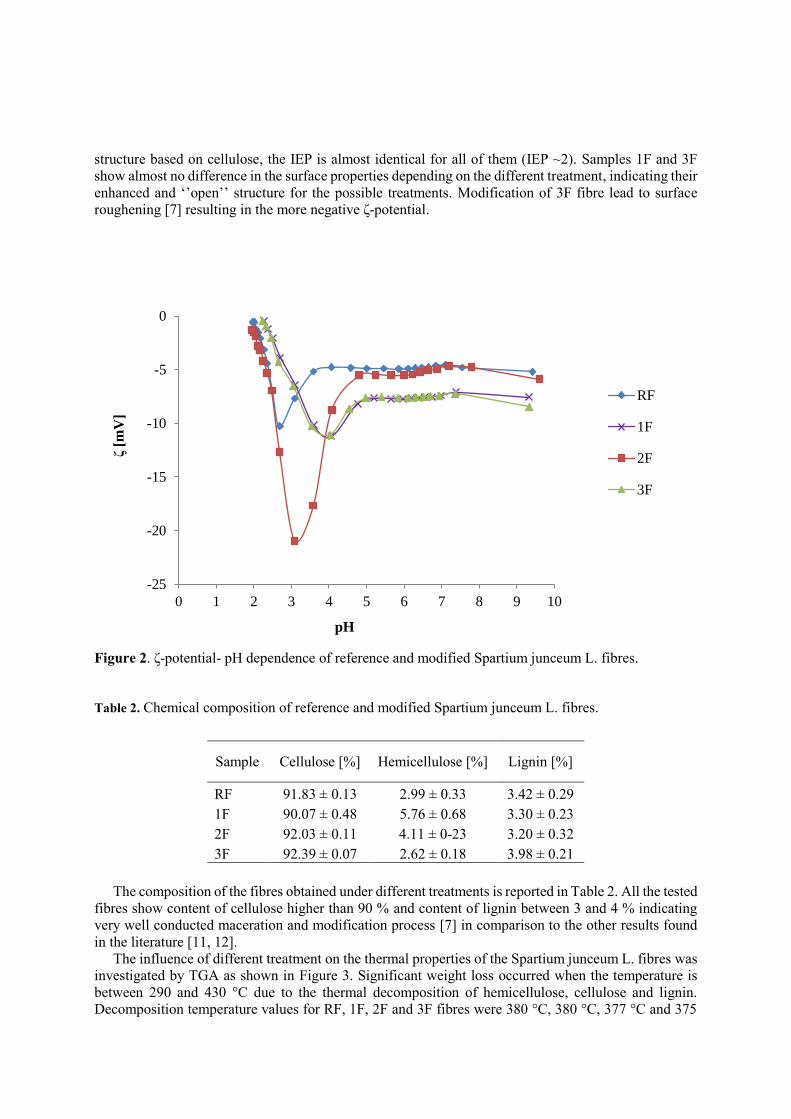
structure based on cellulose, the IEP is almost identical for all of them (IEP ~2). Samples 1F and 3F
show almost no difference in the surface properties depending on the different treatment, indicating their
enhanced and ‘’open’’ structure for the possible treatments. Modification of 3F fibre lead to surface
roughening [7] resulting in the more negative ζ-potential.
Figure 2. ζ-potential- pH dependence of reference and modified Spartium junceum L. fibres.
Table 2. Chemical composition of reference and modified Spartium junceum L. fibres.
Sample Cellulose [%] Hemicellulose [%] Lignin [%]
RF 91.83 ± 0.13 2.99 ± 0.33 3.42 ± 0.29
1F 90.07 ± 0.48 5.76 ± 0.68 3.30 ± 0.23
2F 92.03 ± 0.11 4.11 ± 0-23 3.20 ± 0.32
3F 92.39 ± 0.07 2.62 ± 0.18 3.98 ± 0.21
The composition of the fibres obtained under different treatments is reported in Table 2. All the tested
fibres show content of cellulose higher than 90 % and content of lignin between 3 and 4 % indicating
very well conducted maceration and modification process [7] in comparison to the other results found
in the literature [11, 12].
The influence of different treatment on the thermal properties of the Spartium junceum L. fibres was
investigated by TGA as shown in Figure 3. Significant weight loss occurred when the temperature is
between 290 and 430 °C due to the thermal decomposition of hemicellulose, cellulose and lignin.
Decomposition temperature values for RF, 1F, 2F and 3F fibres were 380 °C, 380 °C, 377 °C and 375
-25
-20
-15
-10
-5
0
0 1 2 3 4 5 6 7 8 9 10
ζ[m
V]
pH
RF
1F
2F
3F

°C, respectively showing earlier start of decomposition temperature for MMT treated fibres. The
analysis of higher temperature (higher than 500 °C) decomposition of fibres showed improved thermal
stability for the MMT treated fibres, regarding their residual weight after thermal treatment at 800 °C.
The improvement could be attributed to the presence of clays in the treated fibres.
Figure 3. TGA curves of reference and modified Spartium junceum L. fibres.
Conclusion
Spartium junceum L. fibres were modified with NaOH, nanoclay and citric acid with the aim of their
usage as reinforcement in the natural fibre reinforced composite materials to improve their mechanical
and thermal properties.
Tensile testing results indicate improvement in strength of MMT treated fibres. Thermal stability
was also enhanced due to different modification treatment, although better flame retardancy was
expected for the MMT treated fibres especially MMT/CA treated fibres regarding their crosslinked
structure.
SEM/EDS analysis of modified fibres proved adsorption of nanoclay particles on the surface of
MMT modified fibres. Nanoclay skeleton is composed mostly of Silicon, second most is oxygen, third
most aluminum and others are: carbon, magnesium, iron and sodium. Morphology of 3F fibres indicates
melioration of nanoclay dispersion thus improvement of further surface properties.
ζ-potential measurements together with other characterization methods provide better insight in the
surface properties of SJL fibres and enable further manipulation during modification process with the
aim of better adhesion between the fibre and the matrix in the composite material.
References
[1] Campilho R D S G 2016 Natural Fiber Composites ed R D S G Campilho (Boca Raton: CRC
Press, Taylor & Francis Group, LLC) chapter 1 pp 1-35
[2] Milardovic G 2011 Polimeri 32 139-142
[3] Fonseca A S, Nunes M I, Matos M and Gomes A P 2013 International Journal of Life Cycle
Assessment 18 1374-1385
[4] Directive 2000/53/EC of the European Parliament and of the Council on end-of-life vehicles,
2000L0053-EN-01.07.2005004.001-1
[5] Bischof S and Kovacevic Z 2013 From Weed to Fabric (Zagreb: University of Zagreb Faculty of
Textile Technology) pp 25-38
[6] Antonović A, Jambreković V, Pervan, S, Ištvanić, J, Moro M and Zule J 2007 Drvna industrija
0
20
40
60
80
100
50 150 250 350 450 550 650 750
Wei
gh
t [%
]
Temperature [° C]
RF
1F
2F
3F

58 119-125
[7] Kovacevic Z, Bischof S, Vujasinovic E and Fan M 2016 Arabian Journal of Chemistry,
http://dx.doi.org/10.1016/j.arabjc.2016.08.004
[8] Nazir M S, Kassim M H M, Mohapatra L, Gilani M A, Raza M R and Majeed K 2016 Nanoclay
Reinforced Polymer Composites ed Jawaid M, Qaiss A el K, Bouhfid R (Singapore: Springer
Science + Business Media) Chapter 2 pp 35-55
[9] Luxbacher T 2012 Handbook of Natural Fibres ed Kozlowski R (United Kingdom: The Textile
Institute and Woodhead Publishing Limited) Chapter 6 pp 185-215
[10] Bismarck A, Aranberri-Askargorta I and Springer J 2002 Polymer Composites 23 872-894
[11] Gabriele B, Cerchiara T, Salerno G, Chidichimo G, Vetere M V, Alampi C, Gallucci M C, Conidi
C and Cassano A 2010 Bioresource Technology 101 724-729
[12] Cerchiara T et al. 2017 European Journal of Pharmaceutical Sciences 99 105-112
ACKNOWLEDGEMENTS
The work has been supported by Croatian Science Foundation under the project 9967 Advanced textile
materials by targeted surface modification.
Evaluation of the morphology of metal particles in intrinsic
conductive polymer dispersions
E Lempa1, C Graßmann
1, M Rabe
1, A Schwarz-Pfeiffer
1, L van Langenhove
2 1 Niederrhein University of Applied Sciences, Research Institute for Textile and
Clothing, Webschulstraße 31, 41065 Mönchengladbach, Germany 2 Ghent University, Department of Textiles, Technologiepark-Zwijnaarde 907, B-9052
Gent, Belgium
Email: [email protected] Abstract. For the production of smart textiles the resistivity of prints and coatings with
intrinsic conductive polymers is often too high and the performance properties not sufficient.
The addition of metal components enhances many characteristics, however the choice of type
of metal, morphology and application method influence results to great extend.
1. Introduction
Flexible and wearable electronic devices are in increasing demand due to simple interaction with the
human body. Advantages of textile structures are combined with electronic functions, such as sensors
and actuators, creating numerous smart textiles [1] The use of intrinsic electrically conductive
polymers (ICP) has been investigated for a number of years, but in many cases the conductivity of
such polymers applied to textile base materials is not sufficient [2, 3]. Currently, manufacturer claim,
that PEDOT:PSS dispersions reach resistivity as low as 0,01 to 0,1 Ohm sq. [4]. However, those
effects can only be obtained with coatings on 2D surfaces such as glass or film. Increasingly prone 3D
structured textile surfaces reduce conductivity substantially [5, 6, 7].
Alternatively, carbon and metal components have been used in combination with polymer binders
to produce conductive textiles. However, those materials often lead to insufficient wash- and wear
behaviour, high weight add-on, enormous cost addition, undesirable colour, questionable ecology etc.
[8, 9] Over and above those negative effects, most particle-based dispersions cannot easily be printed
with digital printers as they block the nozzles within very short time [10, 11]. Therefore, in this work
initially, dispersions were blended for coating processes to define general properties and allow
conclusions towards the requirements for inkjet printing.
2. Experimental
In this work, the influence of differences in morphology of metal components insulating and
conductive polymer dispersions was investigated. Various types of metal particles, based on copper,
silver, glass and aluminium with and without silver coatings, ranging in average size from 4 to 40 µm
were evaluated in combination with a typical textile coating dispersion based on polyacrylate (PAc)
and with a dispersion based on the currently most advanced ICP, poly(3,4-ethylenedioxythiophene)
polystyrene sulfonate (PEDOT:PSS).
Commercially available PAc as well as PEDOT:PSS dispersions were blended with metal
substances of different morphology. The influence of type of metal, size, shape, surface and
aggregation state of the particles was specifically analyzed. Due to the specialty of 3D surfaces,
particles of different size were blended in one dispersion to optimize the coating layers. The change of
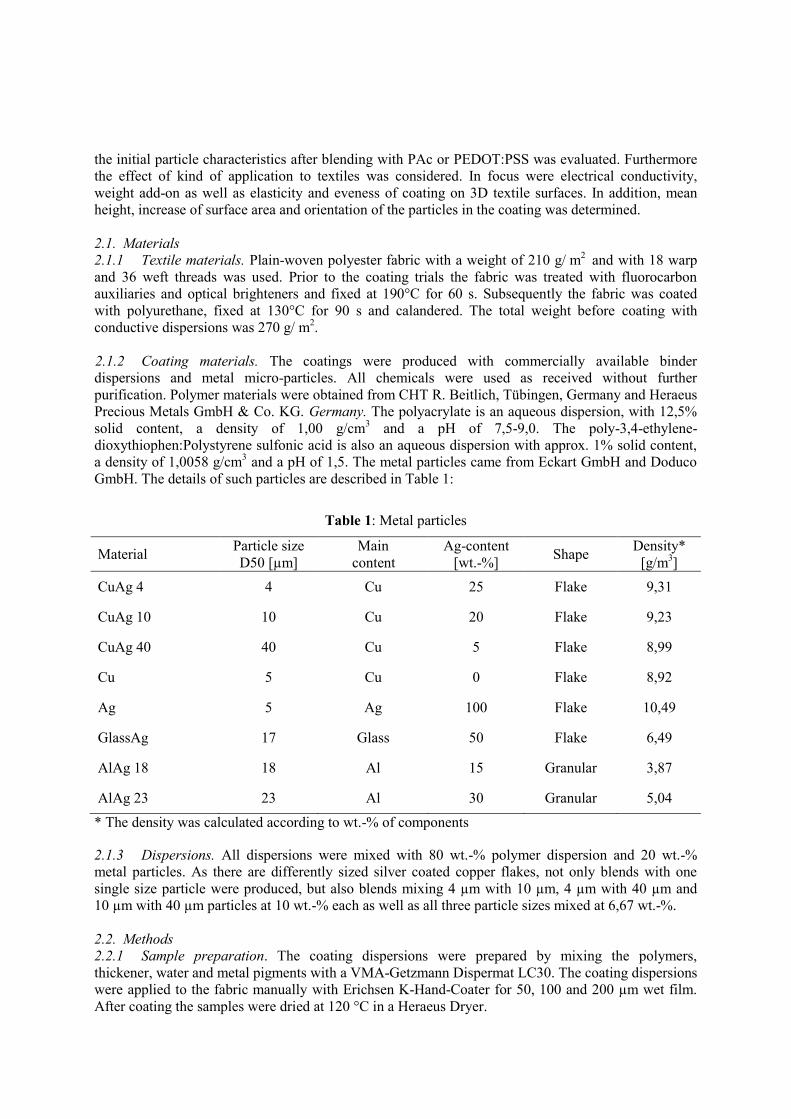
the initial particle characteristics after blending with PAc or PEDOT:PSS was evaluated. Furthermore
the effect of kind of application to textiles was considered. In focus were electrical conductivity,
weight add-on as well as elasticity and eveness of coating on 3D textile surfaces. In addition, mean
height, increase of surface area and orientation of the particles in the coating was determined.
2.1. Materials
2.1.1 Textile materials. Plain-woven polyester fabric with a weight of 210 g/ m
2 and with 18 warp
and 36 weft threads was used. Prior to the coating trials the fabric was treated with fluorocarbon
auxiliaries and optical brighteners and fixed at 190°C for 60 s. Subsequently the fabric was coated
with polyurethane, fixed at 130°C for 90 s and calandered. The total weight before coating with
conductive dispersions was 270 g/ m2.
2.1.2 Coating materials. The coatings were produced with commercially available binder
dispersions and metal micro-particles. All chemicals were used as received without further
purification. Polymer materials were obtained from CHT R. Beitlich, Tübingen, Germany and Heraeus
Precious Metals GmbH & Co. KG. Germany. The polyacrylate is an aqueous dispersion, with 12,5%
solid content, a density of 1,00 g/cm3 and a pH of 7,5-9,0. The poly-3,4-ethylene-
dioxythiophen:Polystyrene sulfonic acid is also an aqueous dispersion with approx. 1% solid content,
a density of 1,0058 g/cm3 and a pH of 1,5. The metal particles came from Eckart GmbH and Doduco
GmbH. The details of such particles are described in Table 1:
Table 1: Metal particles
Material Particle size
D50 [µm]
Main
content
Ag-content
[wt.-%] Shape
Density*
[g/m3]
CuAg 4 4 Cu 25 Flake 9,31
CuAg 10 10 Cu 20 Flake 9,23
CuAg 40 40 Cu 5 Flake 8,99
Cu 5 Cu 0 Flake 8,92
Ag 5 Ag
100 Flake 10,49
GlassAg 17 Glass 50 Flake 6,49
AlAg 18 18 Al 15 Granular 3,87
AlAg 23 23 Al 30 Granular 5,04
* The density was calculated according to wt.-% of components
2.1.3 Dispersions. All dispersions were mixed with 80 wt.-% polymer dispersion and 20 wt.-%
metal particles. As there are differently sized silver coated copper flakes, not only blends with one
single size particle were produced, but also blends mixing 4 µm with 10 µm, 4 µm with 40 µm and
10 µm with 40 µm particles at 10 wt.-% each as well as all three particle sizes mixed at 6,67 wt.-%.
2.2. Methods
2.2.1 Sample preparation. The coating dispersions were prepared by mixing the polymers,
thickener, water and metal pigments with a VMA-Getzmann Dispermat LC30. The coating dispersions
were applied to the fabric manually with Erichsen K-Hand-Coater for 50, 100 and 200 µm wet film.
After coating the samples were dried at 120 °C in a Heraeus Dryer.

2.2.2 Analytical methods. The coated textile samples were evaluated as to physical and conductive
properties, structure and morphology. Samples were always conditioned at 20°C and 65% relative
humidity for 24h before analysis.
The sheet resistivity was measured with a portable Schuetz MR 1 surface resistance meter with a
special 4-pole contact probe with smooth surface for textiles.
With the Keyence laser microscope the topography of the coatings on the textile surface was
analysed. The distribution of the coating dispersion and in particular the metal particles was
investigated by images 10 and 100 times magnified. Furthermore arithmetic mean heights as well as
maximum height differences, increase of surface area and aspect ratio of orientation were identified
with the special software of the laser microscope.
3. Results and Discussion
The size and shape of metal particles as well as the kind of binder system and its solid content have a
substantial influence on layer formation on textiles surfaces. Figure 1 illustrates the laser micrographs
at 100 x magnification of the 200 µm wet film, while figure 2 shows the same layers produced with
PEDOT:PSS dispersions.
Figure 1: Laser microscope images of different particles in PAc dispersion

Figure 2: Laser microscope images of different particles in PEDOT:PSS dispersion
The images show, that the coatings with PAc cover the 3D surface much more even than coatings
with PEDOT:PSS. The particles form a smooth surface when embedded in PAc. The larger particles
are predominantly on the surface; most particles are well in contact. In the PEDOT:PSS film the
particles almost seem to aggregate in islands and smaller particles are found more often on the upper
surface. The textile structure is clearly visible with those coatings, which is mostly due to the lower
solid content in this dispersion.
Figure 3: Sheet resistance of coatings with PEDOT:PSS dispersions and metal particles

The sheet resistance of almost all coatings is much lower with PAc dispersions than PEDOT:PSS.
In figure 3 it is demonstrated, that in the 200 µm wet film the values range as little as 1.90 to 49.00
Ohm in PEDOT:PSS, while 0.15 to 1.10 Ohm in PAc. The differences between the two dispersions are
similar also in 50 µm and 100 µm wet film thickness. As seen in the microscopic images the PAc film
is much more solid and denser which keeps the particles embedded and yet on the upper surface. In
the PEDOT:PSS dispersion the overall surface has increased as the small solid content of the base
dispersion does not cover the particles as solid film well enough. Furthermore the particles seem to
form small islands in the depth of the 3D textile structure. These two factors increase the surface,
which increases the sheet resistance by almost two decimal powers. The resistance of CuAg 40 and
GlassAg 17 is much lower than all other metal particles, even than pure silver Ag 5. In PAc dispersion
those two showed values two to three times lower than all others. There was even no resistance
measurable with AlAg 18 and with AlAg 23, only at 200 µm wet film results came up to the same
values as all other metal particles. In PEDOT:PSS dispersions the differences of all metal particles
were not so strong, also the influence of wet film thickness had not as much impact on sheet resistance
as in PAc. Interestingly, the pure PEDOT:PSS dispersion resulted in better resistance than blends with
CuAg 4 and 10 as well as mix of different sized CuAg particles. This is probably due to the fact that
the surface area is increased so drastically by the particles.
As expected the particle size has an enormous influence on the conductivity of the coatings, as
demonstrated in figure 4. Although it was estimated, that the larger particles could not so easily form a
closed layer on the 3D textile surface, the results were best with 40 µm, 23 µm, 18µm and 17 µm
particles in PEDOT:PSS, while in PAc only CuAg 40 and GlassAg 17 performed outstandingly (all at
200 µm wet film thickness).
The influence of silver content in the various metal particles on sheet resistance of the coatings was
further investigated. Although silver generally resembles the highest conductivity compared to the
metals used in this work, the coatings with the large silver coated copper particle and the silver coated
glass showed much better results than pure silver particles in PAc. In addition the large silver coated
aluminium particle was similarly good in PEDOT:PSS (figure 5).
A third aspect was evaluated regarding the sheet resistance in relation to the add-on weight from
the coatings. All coatings with PEDOT:PSS had much lower weight add-on, as the solid content of the
base polymer is only 1 % compared to PAc with 12,5 %. Although the density of the two AlAg
particles and GlassAg is the lowest, the impact is not substantial in the coating. The sheet resistance
drops in the same way as the add-on increases due to thicker wet films.
Figure 4: Influence of particle size on sheet resistance of 200 µm coatings with PEDOT:PSS

With laser microscope the surface increase was calculated and the coatings’ orientation was
determined. The surface increase was largest with the smallest particle CuAg 4 with 7,35 % in PAc
and 8,12 % in PEDOT:PSS and smallest with granular AlAg 23 particle with 3,04 % and 3,25 %. The
orientation of the metal coatings is regarded optimum at 1 and none existing at 0. All coatings
exhibited values between 0,57 and 0,87. The coating with the blend of all three CuAg particles in PAc
was best with 0,57 followed by GlassAg in PAc with 0,61. The results in PEDOT:PSS were all
slightly less as the polymer does not cover the layer as much as PAc with higher solid content.
4. Conclusions
Depending on application, required conductivity and performance characteristics the morphology of
metal components in polymer dispersions must be considered. The size of particles is a major
contributor to differences in conductivity. Furthermore, the shape substantially influences the
conductivity, as well as the orientation of the coating, spheric or plate forms behave differently to
round or longitudinal forms. The type of metal does not impose as much a difference, at least not at a
concentration of 20 wt.-%. The polymer, whether insulating or intrinsically conductive is required to
fix the metal particles to the textile surface. The solid content as well as the chemistry itself determines
the film further and also plays a great role in wash and wear behavior in use.
Acknowledgement
The authors acknowledge technical support from Miguel Schiller and Christine Steinem.
References
[1] C Hertleer and L Van Langenhove 2016 Autex World Conference 2016 Ljubljana, Slovenia
[2] M Rabe et al. 2013 Man made fibres congress Dornbirn, Sept. 2013, Dornbirn, Austria
[3] M Rabe 2014 Final Report AiF-IGF Project 16949 N
[4] K H Hong, K W Oh and T J Kang 2005 Journal of Applied Polymer Science 97 (3) 1326
[5] M Åkerfeldt, M Strååt and P Walkenström 2013 Text. Res. J. 83 618-627
[6] M D Irwin et al. 2011 Fibres Polym. 12 904-910
[7] E Lempa, C Graßmann, K Topp, C Vorneweg and M Rabe 2014 Coating International 11 5-9
[8] H Kang, S Jung, S Jeong, G Kim and K Lee 2015 Nat. Commun. 6 6503
[9] B K Jang, Y Sakka and S K. Woo 2009 Journal of Physics: Conference Series 156 (1) 12005
[10] R Schneider 2015 Textilplus 9-10 32-33
[11] R Schneider, R Klaas, K Bredereck and M R Buchmeiser 2011 Textilveredlung 3/4 14-18
Figure 5: Influence of silver content on sheet resistance of 200 µm coatings with PEDOT:PSS

Characterization of orange oil microcapsules
for application in textiles
W. Rossi1, M. Bonet-Aracil
2, E. Bou-Belda
2, J. Gisbert-Payá
2, K. Wilson
1 and L.
Roldo1
1 Universidade Federal do Rio Grande do Sul, Escola de Engenharia, Departamento de
Materiais (DEMAT), Av. Osvaldo Aranha, 99 - sala 604, Porto Alegre, RS. CEP
90035-190, Brasil 2Universitat Politècnica de València, Departamento de Ingeniería Textil y Papelera, Pl.
Ferrándiz y Carbonell s/n, 03801, Alcoy, Spain
E-mail: [email protected] Abstract. The use of orange oil presents as an ecological alternative to chemicals, attracting
the attention of the scientific community to the development of eco-friendly antimicrobials.
The microencapsulation technology has been used for the application of orange oil to textiles,
being an economically viable, fast and efficient method by combining core and shell materials,
desirable perceptual and functional characteristics, responsible for properties related to the
nature of the product and provides that the wall materials release the functional substances in a
controlled manner, in addition to effectively protecting and isolating the core material from the
external environment to prevent its volatilization and deterioration, increasing the stability of
the oil, such as non-toxicity. Thus, to better exploit the properties of the orange essential oil
applied to textile products this study presents a characterization of microcapsules of Melamine
formaldehyde obtained by the interfacial polymerization method with variations of proportions
of orange oil (volatile) with fixed oil Medium-Chain Triglycerides (MCT) (non-volatile) to
assist in the stability of the orange essential oil. Scanning electron microscope (SEM) was used
as visualizing tool to characterize microparticles and surface morphology and thermal
characteristics of microcapsules were premeditated by mean Differential scanning calorimetry
(DSC).
1. Introduction
There are significant scientific advances in the field of microencapsulation, which have been used for
the development of innovative textile products, such as the case of fabrics containing long lasting
fragrances [1-7], biocide agents [8-11] and insecticide [12-13].
There are already researches that prove the antifungal properties [14-16] and insecticides of orange
oil [13], which can be added to cotton textiles, helping to protect the microbiological degradation
process that occurs when still in use and can cause serious functional, aesthetic and hygiene problems,
cause of textile deterioration, discoloration and odors [11, 17]. The use of orange oil presents an
ecological alternative to chemicals, attracting the attention of the scientific community to the
development of eco-friendly antimicrobials [13-14, 16, 18-20].
Microencapsulation technology has been used for the application of orange oil to textiles, being an
economically viable, fast and efficient method and leaving minimal waste [18]. This technique has
also been used to microencapsulate a wide range of active, functional, sensitive or volatile substances

[1]. This method combines core and shell materials, desirable perceptual and functional
characteristics, responsible for properties related to the nature of the product [3], [5]. The most
interesting feature of essential oils microencapsulation is that the wall materials release the functional
substances in a controlled manner, in addition to effectively protecting and isolating the core material
from the external environment to prevent its volatilization and deterioration, increasing the stability of
the oil, such as non-toxicity [1].
The challenge for encapsulating orange oil is to keep it inside the microcapsules during storage as
they are mixtures of low molecular weight and base materials are highly frequently reactive, so that
they can disrupt the process of forming the microcapsule or can diffuse easily through its shell. To
solve these restrictions, the microencapsulation of oils: captures the fragrance in its original form with
minimal change and maximum retention; protects the fragrance from interaction with an uncontrolled
environment and from premature release during storage; and completely release the fragrance when
desired. Therefore, the storage properties can be greatly improved by microencapsulation.
Melamine-formaldehyde resin (MF) is one of the preferred coating materials for the manufacture of
microcapsules, because of its superior performance, including high hardness and mechanical strength,
excellent thermal resistance, water resistance, resistance to weathering and free air and increase the
durability of the perfume [6]. There is still the unlimited possibility of staining [1]. The cured MF
resin is non-toxic and can be used in both wet and dry environments [1].
Thus, to better exploit the properties of the orange essential oil applied to textile products this study
presents a characterization of microcapsules of MF obtained by the interfacial polymerization method.
Variations of proportions of volatile orange oil has been fixed with non-volatile oil medium-chain
triglycerides (MCT) to assist in the stability of the orange essential oil. Scanning electron microscope
(SEM) was used as visualizing tool to characterize microparticles and surface morphology. Thermal
characteristics of microcapsules were premeditated by mean Differential scanning calorimetry (DSC).
2. Materials and methods
Materials: Essential orange oil and surfactant polysorbate 20 (Tween 20) both was purchased from
Sigma-Aldrich®.; MF; fixed oil medium-chain triglycerides (MCT) was purchased from Delaware®.
Preparation of microcapsules: Microcapsules containing essential orange oil combined in different
proportions with a fixed oil medium-chain triglycerides (MCT) (1:1, 1:2, 2:1) and surfactant Tween 20
with melamine–formaldehyde (MF) resin as shell material were synthesized by interfacial
polymerization technology. To characterize microcapsules: SEM model TM 3000, brand Hitachi®.
The DSC test was performed on a Metler Toledo DSC 1 Stare System with Stare software
3. Results and discussion
The variations in the proportions of orange oil and MCT (1: 1, 1: 2 and 2: 1) were made to improve the
stabilization of volatility, finding better efficiency in microencapsulation.
3.1. Scanning electron microscope
The variations in the proportions of orange oil and MCT (1: 1, 1: 2 and 2: 1) were made for a better
homogenization of the emulsion, stabilizing the volatility, seeking a better efficiency in the
encapsulation. In ‘Figure 1’ it is shown the image obtained by SEM of the microcapsules of orange
essential oil and MCT in a ratio of 1: 1. It is observed that there was formation of microcapsules, but
they have stick one to another and an agglomerate of microcapsules occurred. ‘Figure 2’ shows the
image obtained from the microcapsules of orange essential oil and MCT in ratio of 1: 2. It is observed
that there was also a formation of microcapsules, but still with the formation of agglomerates,
although the degree of agglomeration is not as high as the one from microcapsules in ratio 1: 1,
‘Figure’1. In ‘Figure 3’ shows the images of the orange essential oil microcapsule and MCT in ratio of
2: 1, aiming to increase the amount of orange oil to be encapsulated. It is observed by the analysis of
the image that there was also formation of microcapsules, but, an improvement in the agglomerate
presence was observed in relation to the ratios 1: 1 and 1: 2, 'Figures 1 and 2'.

It can be observed that independently of the tested combination microcapsules were formed, but the
different proportions of orange oil and MCT represented a variation in a agglomerates presence.
Figure 1. Image obtained by
Scanning electron microscope
(1500x) of the microcapsules
of orange essential oil and
MCT in a ratio of 1: 1.
Figure 2. Image obtained by
Scanning electron microscope
(1500x) of the microcapsules
of orange essential oil and
MCT in a ratio of 1: 2.
Figure 3. Image obtained by
Scanning electron microscope
(1500x) of the microcapsules
of orange essential oil and
MCT in a ratio of 2: 1.
3.2. Differential scanning calorimetry
Thermodynamics property analysis of microcapsules, essential oil and shell was measured by
differential scanning calorimeter. 2 mg microcapsule powders were accurately weighed and placed in
an aluminum pan using a sealed empty pan as reference. The scans were carried out at a heating rate of
10 °C/min.
‘Figure 4’ shows the curve obtained by DSC of the MCT oil. In the DSC curve around 240ºC we
can see the crystallization point of the MCT and its peak temperature of degradation around 390ºC.
Figure 4. Differential scanning calorimetry of the MCT.
'Figure 5"shows the curve obtained by DSC of orange oil. In the DSC curve around 185° C we can
see its peak temperature of degradation.
'Figure 6' shows the curve obtained by DSC only of the MF membrane without essential oil. In the
DSC curve of the MF membrane we can see its peak temperature of degradation around 110°C.
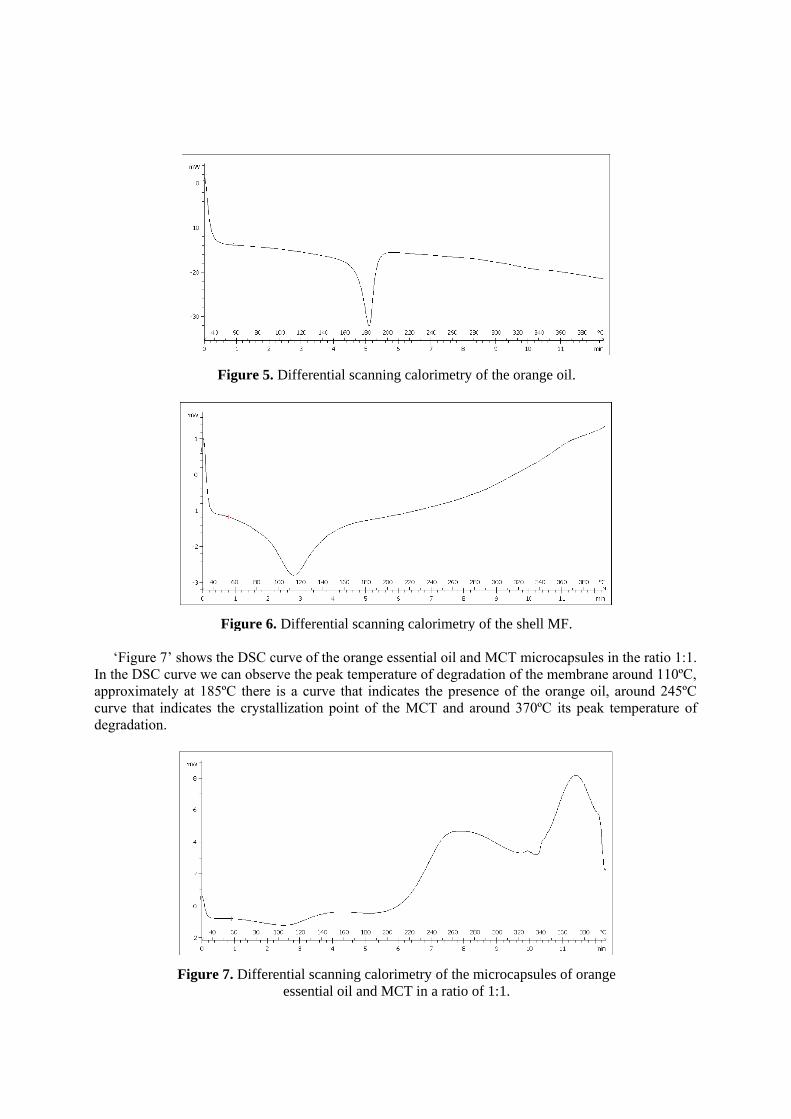
Figure 5. Differential scanning calorimetry of the orange oil.
Figure 6. Differential scanning calorimetry of the shell MF.
‘Figure 7’ shows the DSC curve of the orange essential oil and MCT microcapsules in the ratio 1:1.
In the DSC curve we can observe the peak temperature of degradation of the membrane around 110ºC,
approximately at 185ºC there is a curve that indicates the presence of the orange oil, around 245ºC
curve that indicates the crystallization point of the MCT and around 370ºC its peak temperature of
degradation.
Figure 7. Differential scanning calorimetry of the microcapsules of orange
essential oil and MCT in a ratio of 1:1.

‘Figure 8’ shows the DSC curve of the orange essential oil and MCT microcapsules in the ratio
1:2. In the DSC curve we can observe the peak temperature of degradation of the membrane around
120ºC and at approximately 390ºC the peak temperature of degradation of the MCT. In this analysis it
was not possible to identify the presence of orange oil, since it does not present a significant curve
around its the peak temperature of degradation.
Figure 8. Differential scanning calorimetry of the microcapsules of orange
essential oil and MCT in a ratio of 1:2.
In 'Figure 9' it is shown the curve obtained by DSC from the orange essential oil and MCT
microcapsules in the ratio 2:1. In the DSC curve we can observe the peak temperature of degradation
of the membrane around 120ºC, approximately 190ºC a curve that indicates the presence of the orange
oil, around 250ºC curve that indicates the crystallization point of the MCT and around 390ºC the its
the peak temperature of degradation.
Figure 9. Differential scanning calorimetry of the microcapsules of orange
essential oil and MCT in a ratio of 2:1.
4. Conclusion
In all experiments the addition of MCT in the microcapsule formulation ensure the microcapsules
formation as well as improved the capsules stability.
In the ratio 1: 1 the formation of microcapsules occurred, although they formed agglomerates, as
observed in the SEM images. In the ratio 1: 2 the formation of microcapsules occurred, although they
still present agglomerates When 2: 1 ratio is used, the formation of microcapsules with little formation
of agglomerates occurred.

About, the DSC, regardless the ratio of MCT employed all the curves showed the MCT
degradation, however, due to the overlaying of the curves from the different components which
comprise the microcapsules, it is not possible to observe the orange oil degradation. Consequently, the
DSC technique allows to evidence the presence of MCT but not the orange oil although we can
confirm its presence due to the fragrance which is smelled when rubbing the microcapsules. Thus,
further testing is required to objectively confirm the effectiveness in the encapsulation of the oil.
References
[1] Fei X et al. 2015 Microencapsulation mechanism and size control of fragrance microcapsules
with melamine resin shell. Colloids And Surfaces A 469 300-6.
[2] Hwang X et al. 2016 Preparation and characterization of MF resin microcapsules containing
fragrant oil. Biotechnology And Bioprocess Engineering 11 332-6.
[3] Monllor P, Bonet MA, and Cases F 2007 Characterization of the behaviour of flavour
microcapsules in cotton fabrics European Polymer Journal 43 2481–90.
[4] Peña B et al 2012 Preparation and characterization of polysulfone microcapsules for perfume
release Chemical Engineering Journal 179 394-403.
[5] Rodrigues S N et al 2009 Scentfashion®: Microencapsulated perfumes for textile application
Chemical Engineering Journal 149 463–72.
[6] Rossi W S, Roldo L 2014 Microcápsulas: Aplicações e testes de durabilidade em tecidos.
(Saarbrücken - Alemanha: Novas Edições Acadêmicas).
[7] Sansukcharearnpon A et al. 2010 High loading fragrance encapsulation based on a polymer-
blend: preparation and release behavior Int J Pharm 391 267-73.
[8] Prata A S, Grosso C R F 2015 Production of microparticles with gelatin and chitosan.
Carbohydrate Polymers 116 292-9.
[9] Saraswathi R, Krishnan P N, Dilip C 2010 Antimicrobial activity of cotton and silk fabric with
herbal extract by micro encapsulation Asian Pacific Journal of Tropical Medicine 3 n. 2 128-
32.
[10] Teixeira C S N R et al. 2012 Characterization and evaluation of commercial fragrance
microcapsules for textile application Journal of the Textile Institute 103 n. 3 269-82.
[11] Walentowska J Foksowicz-Flaczyk J 2013 Thyme essential oil for antimicrobial protection of
natural textiles. International Biodeterioration & Biodegradation 84 407-11.
[12] Van Langenhove L, Paul R 2014 Insect repellent finishes for textiles. In: PAUL, R. (Ed.)
Functional Finishes for Textiles: Improving Comfort, Performance and Protection, UK:
Elsevier (Woodhead Publishing) 333–60.
[13] Kim S, Lee D 2014 Toxicity of basil and orange essential oils and their components against two
coleopteran stored products insect pests Journal of Asia-Pacific Entomology 17 13-7.
[14] Nengguo T, Jia L Zhou H 2014 Anti-fungal activity of Citrus reticulata Blanco oil against
Penicillium italicum and Penicillium digitatum Food Chemistry 153 265-71.
[15] Velázquez-Nuñez M J et al. 2013 Antifungal activity of orange (Citrus sinensis var. Valencia)
peel essential oil applied by direct addition or vapor contact Food Control 31 1-4
[16] Viuda-Martos Y M et al. 2008 Antifungal activity of lemon, mandarin, grapefruit and orange
essential oils Food Control 19 1130-8
[17] Tomsic B et al. 2007 Biodegradability of cellulose fabric modified by imidazolidinone
Carbohydrate Polymers 69 478-88.
[18] Prakash B et al. 2015 Plant essential oils as food preservatives to control moulds, mycotoxin
contamination and oxidative deterioration of agri-food commodities – Potentials and
challenges Food Control 47 381-91.
[19] Badawy M E I, Abdelgaleil S A M Composition and antimicrobial activity of essential oils
isolated from Egyptian plants against plant pathogenic bacteria and fungi Industrial Crops
and Products 52 776-82.