Embed Size (px)
Citation preview

MANAGERIAL AND DECISION ECONOMICS, VOL. 18, 335±342 (1997)
A Note on the Pythagorean Theorem ofBaseball Production
John Ruggiero, Lawrence Hadley,* Gerry Ruggiero and Scott Knowles
University of Dayton, OH, USA
Recent analyses of baseball managers' performances have employed the so-called`Pythagorean Theorem' of baseball. This `theorem' states that the ratio of wins to lossescan be approximated by the square of the ratio of team runs scored to opposition runsscored. Recent publications assume this approximate relationship can be used to evaluatemanagers; implicit is the additional assumption that the Pythagorean relationshipconstitutes a production process. It does not. This paper derives the exact relationshipbetween the wins, losses, runs scored and runs allowed. The result is an identity. Weconclude that application of the `Pythagorean Theorem' for manager evaluation isinappropriate. # 1997 by John Wiley & Sons, Ltd.
Manage. Decis. Econ. 18: 335±342 (1997)No. of Figures: 0 No. of Tables: 4 No. of References: 7
INTRODUCTION
There are various models in the baseball economics
literature for the evaluation of managerial perfor-
mance. Porter and Scully (1982) provided the earliest
approach based on an economic model of production.
Speci®cally, they employ linear programming to
measure the production frontier and evaluate team
ef®ciency. Kahn (1993) integrated a salary equation
with a production function to analyze managerial
quality. Ruggiero, Hadley and Gustafson (1996) use
a production function to measure and compare deter-
ministic and stochastic production frontiers. Finally,
Horowitz (1994a,b) applies the Pythagorean Theorem
of baseball (James, 1986) as a tool to evaluate major
league baseball (MLB) managers.
The Pythagorean Theorem states that the ratio of
team wins to losses can be approximated by the
square of the ratio of runs scored to runs allowed.1
Horowitz's application of this theorem views MLB as
a production process. The ratio of runs scored to runs
allowed is a team's input, and the ratio of wins to
losses is its output. Horowitz justi®es the implemen-
tation of this theorem based on its empirical validity,
and he uses the theorem to derive a measure of
managerial performance. This measure is based on
regression coef®cients estimated with career perfor-
mance data for each manager separately.
It is conceptually correct to measure the ef®ciency
of a manager in terms of the games won and lost by
his team while controlling for the quality of his
team's players. The variables speci®ed by
Horowitz, however, do not model a production pro-
cess. Rather, the `Pythagorean Theorem' is only an
identity that links wins and losses with runs scored
and runs allowed. This identity is derived in this
paper.
In a given game, if the ratio of team runs to
opposition runs is greater than one then, by de®nition,
the game is won. If this ratio is less than one, the
game is lost. The number of wins in a given season is
determined by the number of games for which a team
scores more runs than the opposition. The season's
ratio of team runs to opposition runs contains the
information concerning the number of games won.
The relationship, however, is not as obvious as it is
CCC 0143±6570/97/040335±08 $17.50
# 1997 by John Wiley & Sons, Ltd.
* Correspondence to: Lawrence Hadley, Department of Economicsand Finance, University of Dayton, Dayton, OH 45469-2240, USA.E-mail [email protected]

for an individual game due to aggregation. Still, the
exact relationship between team and opposition runs
and team wins and losses can be derived from
de®nitions, and the resulting equation is therefore
an identity. Consequently, the ratio of runs scored to
runs allowed is a proxy for winning percent rather
than an input into a production process. The
Pythagorean Theorem is nothing more than an
approximation of an ex post identity and should not
be used to model a production process nor to evaluate
managers.
The next section derives the identity that links wins
and losses to the aggregate runs scored and allowed
for a particular team in a given season. The
Pythagorean Theorem and the estimating equations
used in Scully (1994) and Horowitz (1994a,b) are
presented and critiqued in the third section.
The fourth section presents an empirical analysis
of the managers considered by Horowitz (1994a).
This analysis will be used to highlight the major
points of this paper. The ®nal section presents con-
clusions.
WINS, LOSSES AND RUNS IN BASEBALL
Before evaluating the Pythagorean approach, it is
useful to derive the exact relationship between
wins, losses and the aggregate runs scored by a
team and by their opposition. For any team playing
G games, let
Rg � the runs scored by the team in game g
Og � the runs scored by the opponent in game g
DRg � Rg ÿ Og � the number of runs by which
game g is won or lost
Eg � the runs in excess of the deciding run2,
TR� the total runs scored by the team in the
season
OR� the total runs allowed by the team in the
season
W� the number of team wins
L� the number of team losses (where
L � G ÿW ).
Total runs scored in a season can be expressed as:
TR � PGg�1
Rg �PGg�1
�DRg � Og� � OR� PGg�1
DRg
� OR�PWi�1
DRi �PLi�1
DRi �1�
For any particular game i won, DRi 5 1 and
DRi � 1� Ei �2�
Also, for any particular game j lost, DRj 4ÿ 1 and
DRj � ÿ1� Ej �3�
Substituting Eqns (2) and (3) into Eqn (1) results in
the following equation:
TR � OR�PWi�1
�1� Ei� ÿPLj�1
�1ÿ Ej�
� OR�W ÿ L� PGg�1
Eg �4�
Rewriting Eqn (4) leads to the following identity:
W ÿ L � TRÿ ORÿ E �5�
where E is the aggregate number of excess runs for a
team in a season. If E� 0, then the team won and lost
each game by one run, on average.
This relationship was derived using only de®ni-
tions; therefore, Eqn (5) is an identity. Estimation of
Eqn (5) omitting E will lead to biased estimates.
Moreover, E is not an error term representing mea-
surement error of any other statistical noise. The
value of E is obtained from the addition of each
individual game's excess runs; it is deterministic (not
stochastic) just as TR and OR. Further, the identity
suggests that the runs ratio is a proxy for the stated
output, ratio of wins to losses.
THE PYTHAGOREAN THEOREM OFBASEBALL
Now consider the Pythagorean Theorem. With a
given level of player skills, the theory maintains
that the ratio of wins to losses in a season can be
approximated by the ratio of runs scored to runs
allowed:
W
L� a
TR
OR
� �b
E �6�
The theory suggests that a � 1 and b � 2. Thus, a
team's win-to-loss ratio is approximated by the
square of the runs scored to runs allowed ratio.
336 J. RUGGIERO ET AL.
Managerial and Decision Economics, 18: 335±342 # 1997 by John Wiley & Sons, Ltd.

Based on identity (5), there are two problems with
the empirical implementation of (6): the functional
form of the equation is misspeci®ed, and E is omitted.
The functional relationship between wins, losses and
runs is derived from identity (5). Also, the omission
of total excess runs scored (E) is expected to generate
biased parameter estimates due to the expected cor-
relation of E and (TR-OR).
Despite these problems, Horowitz (1994a,b) esti-
mates a constrained regression for a sample of
managers based on career data. He estimates a
regression equation for each individual manager
using a related but alternative functional form:
W
L� b1
TR
OR
� �� b2
TR
OR
� �2
� E �7�
where E is a normally distributed error term.3
Horowitz proposes using the parameter estimates b1
and b2 as an index (PH ) measuring managerial
performance, de®ned as:
PH � b1 � b2 �8�PH is the predicted winning percent of a manager's
team assuming that his team scored the same number
of runs that it allowed. Horowitz (1994a, p. 189)
argues that each manager's historic PH is a basis for
evaluation because, `over a full season, all major-
league-quality managers will generate and permit just
about the same number of runs from a given roster,
but the better managers see to it that these runs are
distributed more effectively'.4 In light of identity (5),
however, it is possible that any pair of managers with
equal ability will have different PH values due to
improper functional form speci®cation of Eqn (7) and
the omitted variable (E ).
According to the Pythagorean theorem, better
managers are able to win more games due to an
ability to distribute runs more ef®ciently. Apparently,
the belief is that an ef®cient manager will forgo runs
in a ball game once a lead is obtained, and then use
these forgone runs during future games when his
team is behind. In the course of a given game,
however, the goal of the manager is to score as
many runs as possible because of the uncertainty of
the number of runs that will be scored by the
opposition. For example, if a team scores 4 runs in
the ®rst inning, a manager does not attempt to limit
run production in all other innings. There may be
alternative strategies, such as resting players, depend-
ing on the score during a given game, but a manager
desires more runs, not less. Importantly, resting key
players is not inconsistent with the goal of maximiz-
ing the number of wins during a given season.
The amount of excess runs (E) for a given team
depends not only on the number of runs scored but
also on the number of runs scored by the opposition.
Consider the following hypothetical case where two
teams that are similar, except for the quality of the
manager, play a game. Given the available player
talent, suppose that each team is expected to score 5
runs, but team A has a better manager than team B.
Suppose that team A wins this hypothetical game 5 to
1. Team A scored the expected number of runs;
hence, manager A was ef®cient. Team B, however,
scored only 1 run, suggesting that manager B was
inef®cient. The maximum possible runs given team
B's available talent were not scored. The fact that
team B did not produce the maximum runs should not
implicate manager A. However, the number of runs
scored by team B will impact the amount of excess
runs of team A, and therefore will affect the PH of
team A's manager.
Baseball managers do not have equal player inputs.
But predictions of a team's expected winning percent
can be made on the basis of the quality of the team's
player inputs.5 The best managers are able to win
more ball games than predicted given the quality of
their teams. Therefore, managers should be evaluated
on the basis of wins achieved relative to their pre-
dicted wins, given player quality. The Pythagorean
approach does not consider differences in player
quality.
EMPIRICAL ANALYSIS OF MAJORLEAGUE MANAGERS
Horowitz (1994a) calculated his proposed measure
PH for the 18 individual managers who had at least
10 full seasons of MLB experience. In this section,
we analyze the results for these managers.6 Table 1
reports descriptive statistics for these 18 managers.
Included in the table are the number of seasons
managed, the estimated coef®cients from the con-
strained regressions, the calculated PH (which equals
the sum of the reported parameter estimates), each
managers average win-loss ratio (W=L) and average
runs ratio (TR=OR). Following Horowitz, the
win=loss ratio (W=L) is the dependent variable in
the constrained regression, and the runs ratio and its
square are the independent variables.7 The results
discussed in this section are only reported to demon-
strate the empirical problems with the Pythagorean
approach.
PYTHAGOREAN THEOREM OF BASEBALL PRODUCTION 337
# 1997 by John Wiley & Sons, Ltd. Managerial and Decision Economics, 18: 335±342

Interesting results emerge from the descriptive
statistics reported in Table 1. First, of the managers
analyzed, Al Lopez achieved the highest win±loss
ratio (W=L� 1.463), but he was ranked the lowest by
Horowitz's PH index. Thus, the Pythagorean
approach would have us believe that Lopez is the
worst manager from this group despite the fact that he
has the best win±loss ratio. On average, Lopez had a
similar runs ratio to Earl Weaver (the best manager
according to Horowitz's PH index) and a higher win±
loss ratio. This peculiar result suggests that the
Pythagorean approach does not properly evaluate
managerial performance.
A closer examination of the arithmetic properties
of Horowitz's PH index reveals its inherent ¯aw as a
measure of managerial performance. For any pair of
managers A and B, there is a unique runs ratio that
will equalize the predicted win±loss ratios of both
managers. Let (TR=OR)E be the ratio that equates the
predicted win±loss ratio of managers A and B. This
ratio can be identi®ed as follows:
b1A
TR
OR
� �E
�b2A
TR
OR
� �2
E
� b1B
TR
OR
� �E
�b2B
TR
OR
� �2
E
�9�
which implies
TR
OR
� �E
� b1A ÿ b1B
b2B ÿ b2A
�10�
Once b1 and b2 have been estimated for each manager
(e.g. for each of the 18 managers analyzed by
Horowitz and identi®ed in Table 1), a unique solution
for any pair of managers can be obtained from Eqn
(10).
As an example, consider Al Lopez and Earl
Weaver. A runs ratio of 1.2 approximately equalizes
these two managers' win±loss ratios at 1.45 given the
parameters reported in Table 1. The results indicate
that Lopez has a higher predicted win±loss ratio than
Weaver for any runs ratio greater than 1.2 while
Weaver has a higher predicted win±loss ratio for any
ratio less than 1.2. In other words, Horowitz's index
indicates that Lopez is the better manager as long as a
team is expected to outscore their opponents by 20%;
otherwise Weaver is the better manager. We believe
that this is illogical. If one manager is better than
another, he should be better regardless of the strength
of the team. An index that claims to rank managerial
performance should not systematically generate
opposite rankings depending on the strength of the
team.8
To extend this analysis, we have computed the
predicted win±loss ratios for Horowitz's 18 managers
for each of the 15 full seasons in which Earl Weaver
managed. Each of these managers is `given Weaver's
team' in the sense that Weaver's runs ratios are used
to predict each manager's win±loss ratios for these 15
seasons. In other words, we pretend that all the
managers were managing in the same 15 seasons as
Weaver did, and we pretend that their runs ratios are
Table 1. Descriptive Statistics and Pythagorean Results
Average
Manager Seasons b1 b2 PH W=L TR=OR
Al Lopez 15 ÿ0.281 1.243 0.962 1.463 1.198
Earl Weaver 15 0.714 0.415 1.129 1.457 1.195
Sparky Anderson 22 0.064 0.957 1.021 1.295 1.122
Walter Alston 23 0.897 0.207 1.103 1.295 1.142
Billy Martin 10 0.399 0.662 1.062 1.276 1.113
Tony LaRussa 12 0.007 1.027 1.034 1.261 1.095
Leo Durocher 22 ÿ0.002 0.989 0.986 1.247 1.114
Whitey Herzog 13 0.168 0.871 1.040 1.241 1.096
Danny Murtaugh 12 0.418 0.593 1.011 1.210 1.115
Dick Williams 15 0.396 0.639 1.034 1.191 1.086
Al Dark 10 0.325 0.673 0.998 1.163 1.086
Ralph Houk 19 0.052 1.090 1.038 1.117 1.024
Red Schoendienst 12 ÿ0.133 1.123 0.990 1.117 1.053
Tommy Lasorda 16 0.221 0.751 0.972 1.095 1.095
John McNamara 13 0.388 0.650 1.038 1.039 0.992
Chuck Tanner 17 ÿ0.058 1.057 0.999 1.023 1.006
Gene Mauch 22 0.265 0.737 1.001 0.987 0.985
Bill Rigney 15 0.236 0.771 1.008 0.960 0.967
Managers are ranked according to their average win=loss ratio.
338 J. RUGGIERO ET AL.
Managerial and Decision Economics, 18: 335±342 # 1997 by John Wiley & Sons, Ltd.
the same as Weaver's actual runs ratio for each of
these seasons.
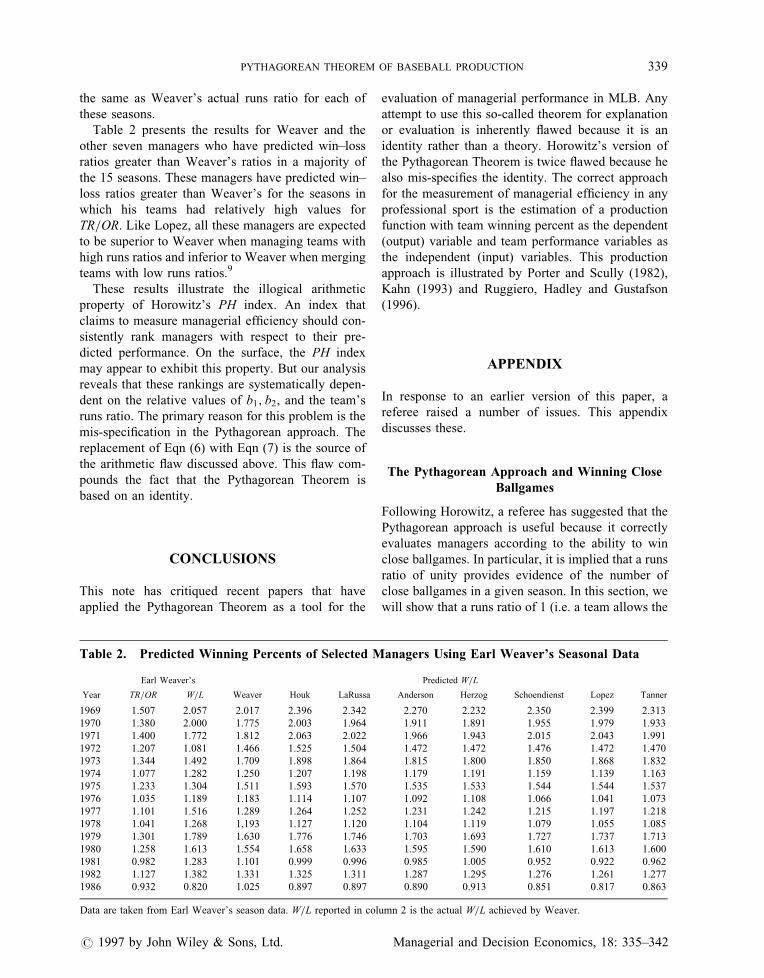
Table 2 presents the results for Weaver and the
other seven managers who have predicted win±loss
ratios greater than Weaver's ratios in a majority of
the 15 seasons. These managers have predicted win±
loss ratios greater than Weaver's for the seasons in
which his teams had relatively high values for
TR=OR. Like Lopez, all these managers are expected
to be superior to Weaver when managing teams with
high runs ratios and inferior to Weaver when merging
teams with low runs ratios.9
These results illustrate the illogical arithmetic
property of Horowitz's PH index. An index that
claims to measure managerial ef®ciency should con-
sistently rank managers with respect to their pre-
dicted performance. On the surface, the PH index
may appear to exhibit this property. But our analysis
reveals that these rankings are systematically depen-
dent on the relative values of b1; b2, and the team's
runs ratio. The primary reason for this problem is the
mis-speci®cation in the Pythagorean approach. The
replacement of Eqn (6) with Eqn (7) is the source of
the arithmetic ¯aw discussed above. This ¯aw com-
pounds the fact that the Pythagorean Theorem is
based on an identity.
CONCLUSIONS
This note has critiqued recent papers that have
applied the Pythagorean Theorem as a tool for the
evaluation of managerial performance in MLB. Any
attempt to use this so-called theorem for explanation
or evaluation is inherently ¯awed because it is an
identity rather than a theory. Horowitz's version of
the Pythagorean Theorem is twice ¯awed because he
also mis-speci®es the identity. The correct approach
for the measurement of managerial ef®ciency in any
professional sport is the estimation of a production
function with team winning percent as the dependent
(output) variable and team performance variables as
the independent (input) variables. This production
approach is illustrated by Porter and Scully (1982),
Kahn (1993) and Ruggiero, Hadley and Gustafson
(1996).
APPENDIX
In response to an earlier version of this paper, a
referee raised a number of issues. This appendix
discusses these.
The Pythagorean Approach and Winning Close
Ballgames
Following Horowitz, a referee has suggested that the
Pythagorean approach is useful because it correctly
evaluates managers according to the ability to win
close ballgames. In particular, it is implied that a runs
ratio of unity provides evidence of the number of
close ballgames in a given season. In this section, we
will show that a runs ratio of 1 (i.e. a team allows the
Table 2. Predicted Winning Percents of Selected Managers Using Earl Weaver's Seasonal Data
Earl Weaver's Predicted W=L
Year TR=OR W=L Weaver Houk LaRussa Anderson Herzog Schoendienst Lopez Tanner
1969 1.507 2.057 2.017 2.396 2.342 2.270 2.232 2.350 2.399 2.313
1970 1.380 2.000 1.775 2.003 1.964 1.911 1.891 1.955 1.979 1.933
1971 1.400 1.772 1.812 2.063 2.022 1.966 1.943 2.015 2.043 1.991
1972 1.207 1.081 1.466 1.525 1.504 1.472 1.472 1.476 1.472 1.470
1973 1.344 1.492 1.709 1.898 1.864 1.815 1.800 1.850 1.868 1.832
1974 1.077 1.282 1.250 1.207 1.198 1.179 1.191 1.159 1.139 1.163
1975 1.233 1.304 1.511 1.593 1.570 1.535 1.533 1.544 1.544 1.537
1976 1.035 1.189 1.183 1.114 1.107 1.092 1.108 1.066 1.041 1.073
1977 1.101 1.516 1.289 1.264 1.252 1.231 1.242 1.215 1.197 1.218
1978 1.041 1.268 1,193 1.127 1.120 1.104 1.119 1.079 1.055 1.085
1979 1.301 1.789 1.630 1.776 1.746 1.703 1.693 1.727 1.737 1.713
1980 1.258 1.613 1.554 1.658 1.633 1.595 1.590 1.610 1.613 1.600
1981 0.982 1.283 1.101 0.999 0.996 0.985 1.005 0.952 0.922 0.962
1982 1.127 1.382 1.331 1.325 1.311 1.287 1.295 1.276 1.261 1.277
1986 0.932 0.820 1.025 0.897 0.897 0.890 0.913 0.851 0.817 0.863
Data are taken from Earl Weaver's season data. W=L reported in column 2 is the actual W=L achieved by Weaver.
PYTHAGOREAN THEOREM OF BASEBALL PRODUCTION 339
# 1997 by John Wiley & Sons, Ltd. Managerial and Decision Economics, 18: 335±342
same number of runs as it scores) does not necessa-
rily correspond to a manager's ability to win close
ballgames. Assume that three different managers
have a season in which TR=OR � W=L � 1. Thus,
each manager wins and loses 81 games in the season.
Also, de®ne a close game (perhaps arbitrarily) as a
game decided by only one run. We now consider
three different cases in terms of the number of close
games that are won.
In case 1, the manager wins and loses 81 games by
a score of 6-1. In this case, the manager has not won
or lost any close games but was still able to win half
of the games. In case 2, suppose the manager wins 40
close games by a score of 3-2. Also, he wins 41
games by a score of 6-1. The team loses 80 games by
a score of 5-2 and one game by a score of 5-0. In this
case, the manager was able to win all close games
that he was involved in. Finally, in case 3, the manger
wins 80 games by a score of 5-2 and one game by a
score of 5-0. The team loses 40 close games by a
score of 3-2 and 41 games by a score of 6-1. The
manager in case 3 has lost all close games.
In all three hypothetical cases a seasonal data point
of TR=OR � W=L � 1 is recorded for the manager.
But this result has nothing to do with the number of
close games that are won. Extending this example to
many seasons, we conclude that the Pythagorean
approach does not evaluate a manager according to
the number of close games that are won. If close
games is the appropriate criterion for managerial
ef®ciency (which it is not, in our view), then a
manager's winning percent in only close games can
be observed directly.
APPLYING THE IDENTITY TOPROFESSIONAL FOOTBALL
In response to an earlier version of this paper, a
referee has suggested that the Pythagorean approach
is a `mysterious fact of baseball life', suggesting that
the approach does not work for other sports. The
reason the Pythagorean approach does not appear to
work in other sports may be attributed (perhaps) to
the number of games played and the number of points
scored. Given the similarities in scoring and the
number of games played, we would expect to see
results for hockey similar to MLB. Regardless, we
will show that the identity developed in the paper
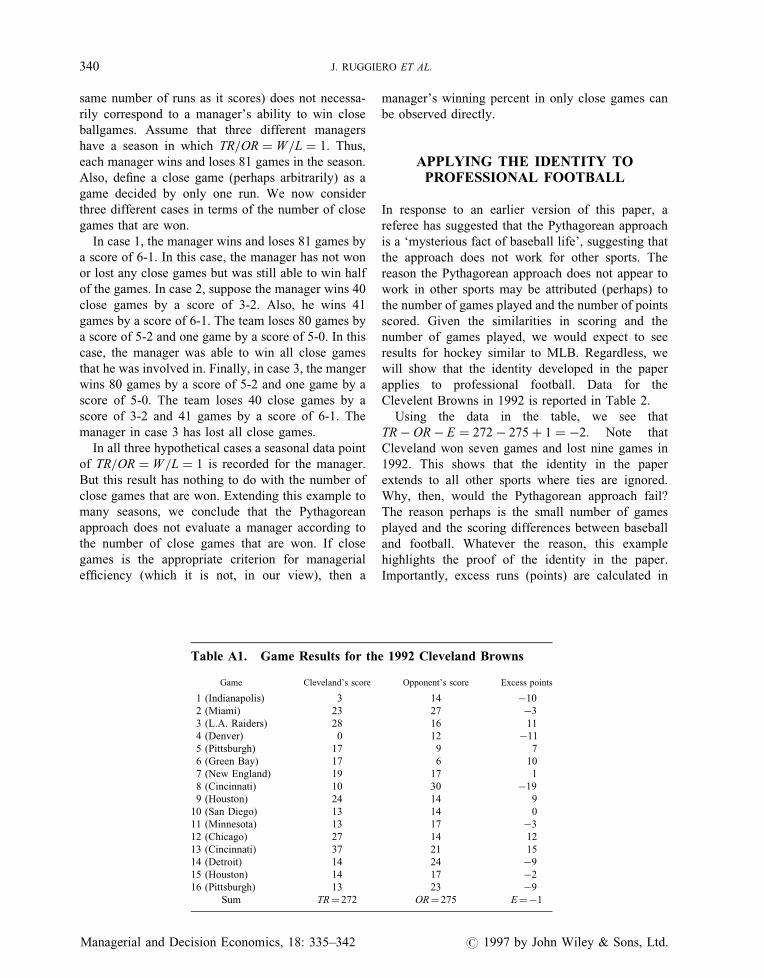
applies to professional football. Data for the
Clevelent Browns in 1992 is reported in Table 2.
Using the data in the table, we see that
TRÿ ORÿ E � 272ÿ 275� 1 � ÿ2. Note that
Cleveland won seven games and lost nine games in
1992. This shows that the identity in the paper
extends to all other sports where ties are ignored.
Why, then, would the Pythagorean approach fail?
The reason perhaps is the small number of games
played and the scoring differences between baseball
and football. Whatever the reason, this example
highlights the proof of the identity in the paper.
Importantly, excess runs (points) are calculated in
Table A1. Game Results for the 1992 Cleveland Browns
Game Cleveland's score Opponent's score Excess points
1 (Indianapolis) 3 14 ÿ10
2 (Miami) 23 27 ÿ3
3 (L.A. Raiders) 28 16 11
4 (Denver) 0 12 ÿ11
5 (Pittsburgh) 17 9 7
6 (Green Bay) 17 6 10
7 (New England) 19 17 1
8 (Cincinnati) 10 30 ÿ19
9 (Houston) 24 14 9
10 (San Diego) 13 14 0
11 (Minnesota) 13 17 ÿ3
12 (Chicago) 27 14 12
13 (Cincinnati) 37 21 15
14 (Detroit) 14 24 ÿ9
15 (Houston) 14 17 ÿ2
16 (Pittsburgh) 13 23 ÿ9
Sum TR� 272 OR� 275 E�ÿ1
340 J. RUGGIERO ET AL.
Managerial and Decision Economics, 18: 335±342 # 1997 by John Wiley & Sons, Ltd.
the same manner as total runs and opposition runs
(points) for a given ballgame.
The Runs Ratio as a Proxy for the Win±loss ratio
In this section we show that the runs ratio can be
considered to be an alternative measure of output. As
such, it is a proxy to the win±loss ratio. Thus, the
Pythagorean approach considers a regression of out-
put on a proxy for output. This is empirically shown
with the following example.
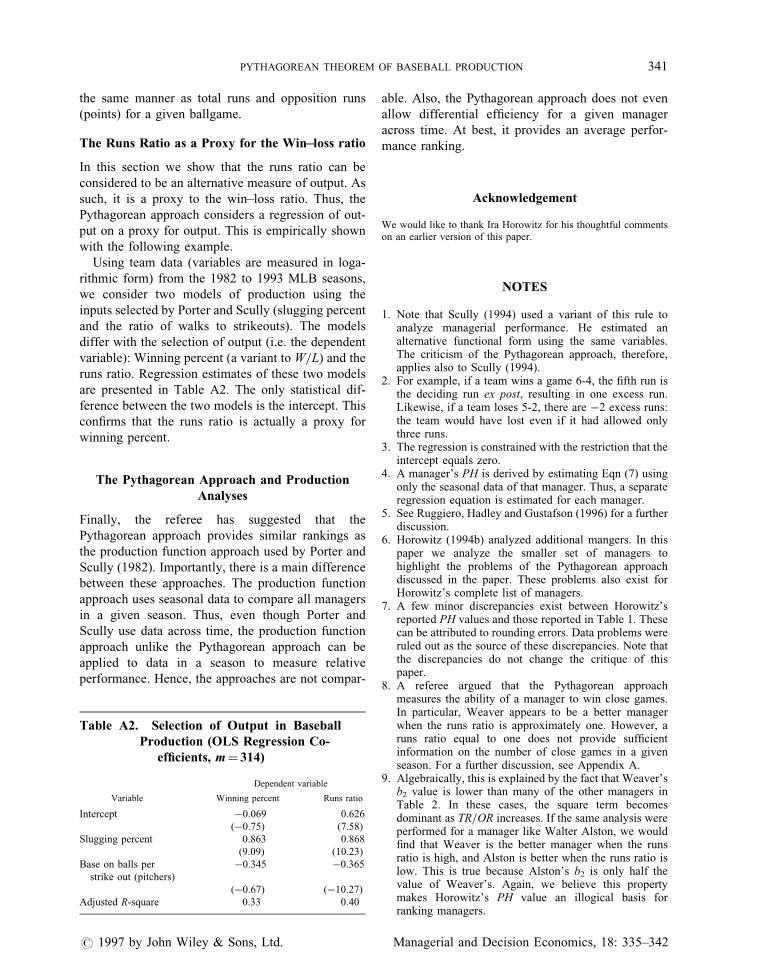
Using team data (variables are measured in loga-
rithmic form) from the 1982 to 1993 MLB seasons,
we consider two models of production using the
inputs selected by Porter and Scully (slugging percent
and the ratio of walks to strikeouts). The models
differ with the selection of output (i.e. the dependent
variable): Winning percent (a variant to W=L) and the
runs ratio. Regression estimates of these two models
are presented in Table A2. The only statistical dif-
ference between the two models is the intercept. This
con®rms that the runs ratio is actually a proxy for
winning percent.
The Pythagorean Approach and Production
Analyses
Finally, the referee has suggested that the
Pythagorean approach provides similar rankings as
the production function approach used by Porter and
Scully (1982). Importantly, there is a main difference
between these approaches. The production function
approach uses seasonal data to compare all managers
in a given season. Thus, even though Porter and
Scully use data across time, the production function
approach unlike the Pythagorean approach can be
applied to data in a season to measure relative
performance. Hence, the approaches are not compar-
able. Also, the Pythagorean approach does not even
allow differential ef®ciency for a given manager
across time. At best, it provides an average perfor-
mance ranking.
Acknowledgement
We would like to thank Ira Horowitz for his thoughtful commentson an earlier version of this paper.
NOTES
1. Note that Scully (1994) used a variant of this rule toanalyze managerial performance. He estimated analternative functional form using the same variables.The criticism of the Pythagorean approach, therefore,applies also to Scully (1994).
2. For example, if a team wins a game 6-4, the ®fth run isthe deciding run ex post, resulting in one excess run.Likewise, if a team loses 5-2, there are ÿ2 excess runs:the team would have lost even if it had allowed onlythree runs.
3. The regression is constrained with the restriction that theintercept equals zero.
4. A manager's PH is derived by estimating Eqn (7) usingonly the seasonal data of that manager. Thus, a separateregression equation is estimated for each manager.
5. See Ruggiero, Hadley and Gustafson (1996) for a furtherdiscussion.
6. Horowitz (1994b) analyzed additional mangers. In thispaper we analyze the smaller set of managers tohighlight the problems of the Pythagorean approachdiscussed in the paper. These problems also exist forHorowitz's complete list of managers.
7. A few minor discrepancies exist between Horowitz'sreported PH values and those reported in Table 1. Thesecan be attributed to rounding errors. Data problems wereruled out as the source of these discrepancies. Note thatthe discrepancies do not change the critique of thispaper.
8. A referee argued that the Pythagorean approachmeasures the ability of a manager to win close games.In particular, Weaver appears to be a better managerwhen the runs ratio is approximately one. However, aruns ratio equal to one does not provide suf®cientinformation on the number of close games in a givenseason. For a further discussion, see Appendix A.
9. Algebraically, this is explained by the fact that Weaver'sb2 value is lower than many of the other managers inTable 2. In these cases, the square term becomesdominant as TR=OR increases. If the same analysis wereperformed for a manager like Walter Alston, we would®nd that Weaver is the better manager when the runsratio is high, and Alston is better when the runs ratio islow. This is true because Alston's b2 is only half thevalue of Weaver's. Again, we believe this propertymakes Horowitz's PH value an illogical basis forranking managers.
Table A2. Selection of Output in Baseball
Production (OLS Regression Co-
ef®cients, m� 314)
Dependent variable
Variable Winning percent Runs ratio
Intercept ÿ0.069 0.626
(ÿ0.75) (7.58)
Slugging percent 0.863 0.868
(9.09) (10.23)
Base on balls per
strike out (pitchers)
ÿ0.345 ÿ0.365
(ÿ0.67) (ÿ10.27)
Adjusted R-square 0.33 0.40
PYTHAGOREAN THEOREM OF BASEBALL PRODUCTION 341
# 1997 by John Wiley & Sons, Ltd. Managerial and Decision Economics, 18: 335±342

REFERENCES
I. Horowitz (1994a). Pythagoras, Tommy Lasorda, and Me:On evaluating baseball managers. Social Science Quar-terly, 75, 187±94.
I. Horowitz (1994b). On the manager is principal clerk.Managerial and Decision Economics, 15, 413±19.
B. James (1986). The Bill James Historical BaseballAbstract, New York: Villard.
L. Kahn (1993). Managerial quality, team success, andindividual player performance in major league baseball.Industrial and Labor Reviews, 46:3, 531±47.
P. K. Porter and G. Scully (1982). Measuring managerialef®ciency: the case of baseball. Southern EconomicJournal, 48, 642±50.
J. Ruggiero, L. Hadley and E. Gustafson (1996). Tech-nical ef®ciency in major league baseball. InBaseball Economics: Current Research (edited by J.Fizel, E. Gustafson and L. Hadley) Westport, CT:Praeger.
G. Scully (1994). Managerial ef®ciency and survivability inprofessional team sports. Managerial and DecisionEconomics, 15, 403±11.
342 J. RUGGIERO ET AL.
Managerial and Decision Economics, 18: 335±342 # 1997 by John Wiley & Sons, Ltd.