Embed Size (px)
Citation preview
A New Standard Volume Indicatorand Reference Level
H. A. Chinn, D. K. Gannett, and R. M. Morris
Copyright © 1940 IRE now IEEE. Reprinted from Proceedings of the I.R.E, Vol. 28, 1940January, pages 1...17.
This material is posted here with permission of the IEEE. Such permission of the IEEE does not inany way imply IEEE endorsement of any of Audio Engineering Society’s products or services.Internal or personal use of this material is permitted. However, permission to reprint/republish thismaterial for advertising or promotional purposes or for creating new collective works for resale orredistribution must be obtained from the IEEE by sending a blank email message [email protected].
By choosing to view this document, you agree to all provisions of the copyright laws protecting it.
John G. (Jay) McKnight, ChairAES Historical Committee2006 Aug 21
A New Standard Volume Indicator and Reference Level*
H. ,4. CHINX?, n n m s r : R , I.R.E., D. K. CANNETT$., MEMBER, I.R.E., AND R. hI. bIORr\lS 5, ASSOCIATE, I.R.E.
~ ~ m t n a r y - I i L rcccnt Tears i t iras b c c o ~ ~ ~ c i ~ ~ c r c n s i ~ l z L y d t f i c l ~ l t to vacuum tubes, transmitted over wire circuits, modu- iGrrclale rcadinss o.,f :roi~l~iie lcclel ~ ~ l a d r by nariozts srorips bccazise of : , t~cre,lccs i n the ciinractcristics and rn l i hmt ions of t i ~ c ~ o l r i ~ i z e i n d i -
lated on carriers, and otherwise handled as required by '_ I L S C ~ . Tl i i s paper drscribcs a j n i n t dcz,clop~l:rnt by tile Colli l~tbia the various cominunicatioi~ services. He needs a prac-
,~rocdcnstinfi Systenr, i\;atio?zal h'roaticasti?2g C o i n p a ? ~ ~ ' , and Bell tical method of measurillg and expressing these mag- 7.,.,,;b/ione Laboratories w l ~ i c h resulted i ? ~ agrccnzei~t u p o n , a m ? staltd- .,d.-a/ton i n tile rcspectkse broadcast and te lepl~one plants c ~ f a n e w ilitudes in simple numerical fashion. :,3Der-oxide-rectificr t y p e rg ; I O ~ I L I I I ~ i?icticator 11nrin,y presrrihcd dy-
7 r H E student of electrical engineerixig, when intro-
, cluced to alternating-current theory, learns t ha t that there are three related values of a sine \\-axre
1,). ivhich its magnitude inay be expressed. 'These are thc average value, the root-mean-square (or effective) \.slue, and the peak (or crest) value. Certain funda- riic~ltal electrical measuring devices provide means for it~ic~mining these values. As the student's experience i,:-!latiens, he becomes familiar ~v i th complex, non- -:!iusoidal periodic n-a\-es and finds that these waves i..ii.c the same three readily measured values. He :< .irus lio\\r , t o determine from the problem. uri-der I ~ ~ ~ ~ s ~ , l e r a t i o n \\-hether the average, the root-mean- .quare. or the peak value of the \\-ave is of primary :~l~portaqce. ". .. . P
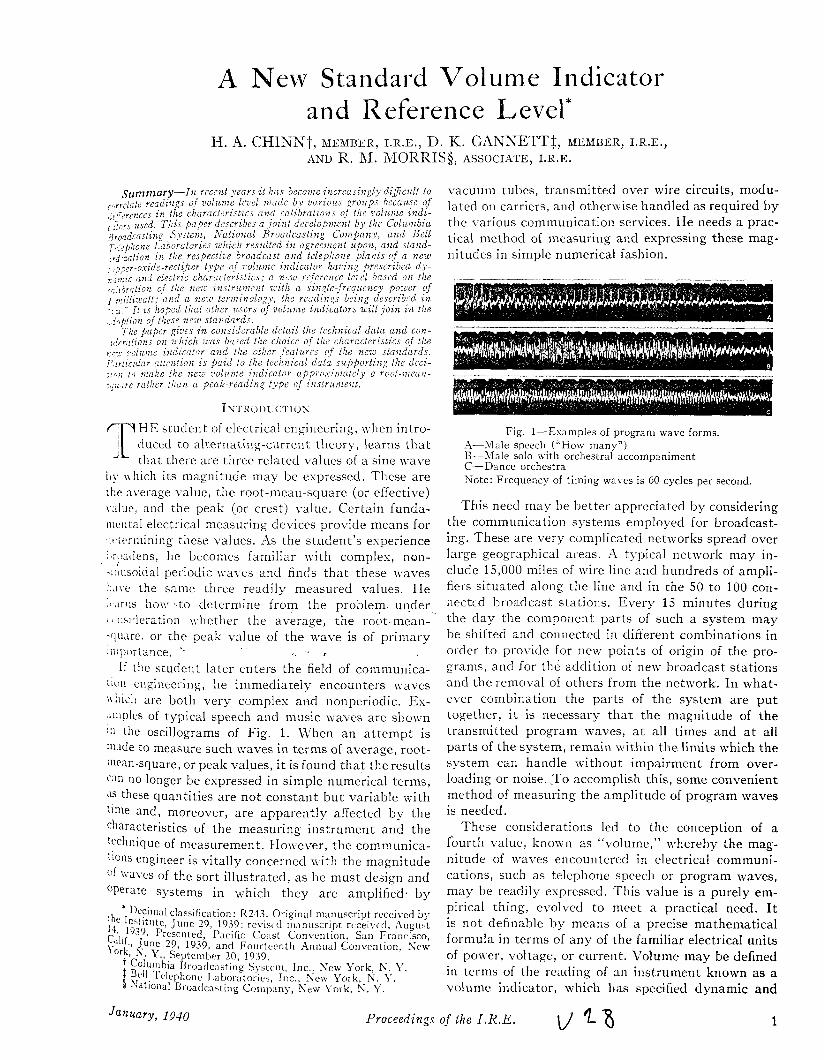
If the student later enters the field of communica- ;I011 engineering, he immediately encounters I\-aves ;\llich are both very comples and nonperiodic. Ex- .i1iiples of typical speech and music Lvaves are shown i:1 the oscillograms of Fig. 1. LVhen an at tempt is :'lade to measure such waves in terms of average, root- l ~ l ~ ~ n - s q u a r e , or peak values, i t is found tha t the results 2.m 110 longer be expressed in simple numerical terms, ''5 these quantities are not constant but variable with tlnle and, moreover, are apparently affected by the characteristics of the measuring instrument and the !'chnique of measurement. Hoa,ever, the communica- I'Ons engineer is vitally concerned lvith the magnitude
'vaves of the sort illustrated, as he must design and Operate systems in which they are amplified- by
* I)ecinlal classification: R2-13. Original manuscript received by 'he Institute, J u n e 29, 1939; revised inanuscript rcceivcd, August
1939. Presented, P;lcific Co,:st Convention, Sari Francisco, G l l f . , June 29, 1939, and Fourteenth Annual Convention, N e w
S. Y. , September 20, 1939. + Colunlbia 13roatlcasting Systenl, Inc. , New York , N. Y . 1 Bell '1.clephonc 1-al~or;itories, Inc., Ncw York, N. 1'. Q National Broadcasting Corrlpany, New York, N. Y.
Fig. 1 - E ~ a m p l e s of program wave forms. A-Rlale speech ("How many") B-hlale solo with orchestral accompaniment C-Dance orchestra Note: Frequency of t iming waves is 60 cycles per second.
This need may be better appreciated by considering the communication systems employed for broadcast- ing. These are very con~plicated netnorks spread over large geographical areas. A typical network may in- clude 15,000 miles of wire line and hundreds of ampli- fiers situated along the line and in the 50 to 100 con- nectcd broadcast stations. Every 15 minutes during the day the component parts of such a system may be shifted and connected in different combinations in order to provide for new points of origin of the pro- grams, and for the addition of ne\\- broadcast stations and the emo oval of others from the network. In what- ever combination the parts of the system are put together, i t is necessary t ha t the magnitude of the transmitted program naves, a t all times and a t all parts of the system, remain \x ithin the limits which the system can handle without impairment from over- loading or noise. T o accomplish this, some convenient method of measuring the amplitude of program waves is needed.
These considerations led to the conception of a fburth value, knonn as "volume," whereby the mag- nitude of \\.ayes encountered in electrical communi- cations, such as telephone speech or program waves, may be readily expressed. This value is a purely em- pirical thing, evolved to meet a practical need. I t is not definable by means of a precise mathematical formula in terms of any of the familiar electrical units of potier, voltage, or current. Volume may be defined in terms of the reading of an instrument known as a volume indicator, which has specified dynamic and
January, 1940 Proceedings of the I.2i.E. u 'Ll 1

9 A. Proceedings of the Z.R.E. J a n u a r y
other characteristics and 11 liich is calikrated and read in a prescrited manner. Because of the rapic'ly cliang- ing character of t l e program nave , tl e dynnnzic char- acteristics of the instrument are fully as important as the value of sine-wave poner used for calil,ration. The readings of volume ha\-e heen customarily expressed in terms of decibels 11 ith respect to some 1-olume level chosen as the "reference" level.
In the past, because of a lack of complete under- standing of the matter, there has beell little uni- formity in the design and use of volume indicators, although attempts have been made by some organiza- tions toward standardization. The devices used were of the root-mean-square and peak-reading t>.pes hav- ing slow, medium, or high pointer speeds; half- or full-wave rectifiers; critically to lightly damped move- ments,and reference to levels based on calibrations n ith
1, 6, 10, 123, or 50 milliaatts in 500 or 600 ohms. This great array of variables led to coilsiderable con- fusion and lack of understanding, especially nhen an attempt n as made to correlate the measurements and results of one group n i th those of another.
T o remedy this situation, the Bell Telephone Labora- tories, the Columbia Broadcastiilg System, and the National Broadcasting Company entered upon a joint development effort during January, 1938, u i t h the object of pooling their kno~~lecige and problems, of pursuing a co-ortlinated development program, and of arriving a t a uniform practice of measuring 1-olume levels. The outcome of this I\ ork is a nen volume inci- cator, a neu reference xolume le\el, and new termi- nology for expressing measurements of volume level. The results of this development nark have been dis- cussed mith, and approved by, more than 24 other organizations, and \\ere presented a t an open round- table conference a t the Annual Conve~ltion of the Institute of I ia i io ~ ; ig inee r s on June 1.7, 1938. During hIay, 1939, i t \\as atlopted as standard practice by the above tii o broadcast cornpallies and the Bell System, and i t is hoped that they nil1 he joined by others. I t is the purpose of this paper to tiescribe the new stand- ards and the considerations \I hich led to their adop- tion.
As a background for understanding the present development, i t n i l l be helpful to review briefly the early history of volume indicators. The particular oc- casion for the development of the first volume indi- cator 1vas the setting up of the public-address system which enabled the ceremonies attendant upon the burial of the Unknown Soldier on Armistice Day, 1921, to be heard by large audiences a t Arlington, New York, and San Francisco.' I t \\.as noted in some of the preliminary tests tha t distortion due to overloading of an amplifier was more ol~jectionable \\.hen heard in
LY. 11. hlart in a n d A. 11 . Clark, "l~.sc. of p ~ ~ b l i c adtlrcss s~.stc.m with tc lc~)hone lincs," Tru71.s. i l . I . l i . I i . , vol. 42, 1). 75 ; I.'c.L~runr!., (1923).
a loud speaker than when heard in an ordinary tele- phone receiver. Consequently, to avoid overloading the telephone repeaters when they were used on the public-address circuits, a device was proposed which would give visual indication on an instrument when the speech level \ \as such as to cause the telephone repeaters to o\rerload.
Further development of this idea led t o the experi- mental dexice ~ h i c h n a s used in the Armistice Day ceremonies and nhich later, n i t h no fundamental change, became the \\ell-known 518 and 203 types of volume indicator. This device consisted of a triode vacuum tube functioning as a detector, to the output of 11 hich xvas col~nected a di~-ect-current milliammeter. Associated 11 ith the input I\ as a potentiometer for adjusting the sensitivity in 2-decibel steps. The meth- od of using the device 11 as to adjust the potentiometer so tha t the maximum movement of the milliam- meter needle reached the mid-scale point on an average of about once every 10 seconds, occasional greater deflections being disregarded. The volume level was then read from the setting of the potentiometer which \\as marked in decibels n i t h respect to a reference volume level.
The reference level was chosen as t ha t level of speech which, when transmitted illto the long tele- phone circuits, x~ould cause the telephone repeaters n ith I\ hich they ere equipped t o be just on the verge of overloac'ing as e l ic'enced by audible distortion. The gains of the telephone repeaters mere normally ad- jueted so tha t the level a t their outputs was 10 c'ecibels higher than a t the sending end of theocircuit. Reference volu~ne was therefore specifically defined as 1-0 decibels below the maximum speech level which could be satisfactorily transmitted through the par- ticular amplifier and vacuum tubes used in the tele- ph'one repeaters. This level x i as determined esperi- mentally and the potentiometer steps of the volume indicator \\ere marked accordingly. This reference volume \vas also approximately the volume delivered o l e r a short loop by the then standard subscriber's telepkone set 11 hen spoken into \i it11 a fairly loud voic-e.
I t is apparent that the volume indicator n a s born in response to a definite need, and it has filled an important niche in the rapidly growing radio broad- cast industry and in other communication fields. Large numbers of volume indicators similar to this early type have continued in service t o the present time.
Frequently, i t is characteristic of a rapidly expand- ing a r t that a t first standards multiply, and finally a
'point is reached \\here simplification and agreement upon a single standard becomes imperative. This has occurred in connection n it11 volume indicators and since the de\elopment of the first one, a variety of in- .t rumc nts habe Leen proc:uccd by the various manu- fncturcrs and have come into service in the plants of the ciiiierent companies. These instruments had differ-

1940 Chinlz, Gannett, and 111 orris: Volume Indicator and Reference Level 3
,,t and characteristics and there was little
between their readings. A further divergence occurred, regarding the philoso-
phy of the calibration of the original type of volume indicator. One view recognized no correlation between
point a t which the galvanometer was normally on peaks (the 30-division point on the scale, Fig.
12) and the power of 6 milliw-atts used for calibration. \t-hen calibrating the instrument on 6 milliwatts of ,ine-u,ave energy In 500 ohms, the galvanometer would read 2 2 divisions with the associated sensitivity switch on step zero. There was not intended to be any correla- tion between this calibrating porn-er and reference volume. Nevertheless, many people were led by this technique of calibration to refer to the volume indica- tor as a 6 -mi l l i~a t t instrument. This idea was fur- thered by the fact that the vacuum tube, t o whose speech-carrying capacity the reference volume was originally referred, has a nominal full-load capacity on sine waves of 60 millin-atts. The reference volume be- ing defined as 10 dedbels below the maximum output of this tube, it was natural to try to relate this refer- ence volume to the corresponding figure of 6 milIi\\-atts lor sine waves.
A second view was based on the experimental fact that when the potentiometer controlling the sensitiv- ity \\.-as set a t "0 decibels," a sine-wave potential of 2.5
.
volts (root-mean-square) applied to the volume indi- cator caused a deflection to mid-scale (scale reading of 30 divisions). This was equivalent .to 12.5 milli~vatts in a 500-ohm circuit, and the supporters of this view rh6refox-e referred to the volume indicator as a 12.5- m~liiwatt instrument.
Thus the same volume indicator, having the same sensitivity and giving the same readings of' volume" level, ..\-as variously referred to as a 6-millin-att and a 12.5-milli~vate device. 'This increased the dificuity of CO-ordination between the plants of the different companies which are interconnected in rendering broadcast service.
Some degree of standardization of the technique of reading volume levels had already been made within different organizations both here and abroad. The im- portance of the present development lies not only in the particular merits of the proposed standards, but also in the fact that they have been jointly developed and adopted by three of the larger users of volume indi- cators, and have been approved by many others. Thus there is a good prospect that the needed standardiza- tion is about to be realized, and that all will shortly use the same instruments, the same reference levels, the same terminology, and the same nominal value of circuit impedance.
CHOICE OF PEAK VERSUS ROOT-~~EAN-SQUARE TYPES genera^
The first important decision to be made and one l~hich would affect the entire character of the develop-
ment was whether the new volume indicator should be of the root-mean-square or of the peak-reading type. These two types of instrument represent two schools of thought. The peak-reading instrument is favored for general use by many European engineers and is specified by the Federal Communications Corn- mission for use as modulation monitors in this country. The root-mean-square type has, however, been com- monly employed in this country on broadcast pro- gram networks and for general telephone use. In view of the importance of the decision and the difference of opinion that has existed, the da ta on which the choice was made are given below in considerable de- tail.
In accord with common practice, the terms "root- mean-squaren and "peak-reading" are used rather loosely throughout this paper. The essential features of a root-mean-square instrument are some kind of rectifier or detector and a direct-current milliammeter. The latter is not especially fast, generally requiring tenths of a second to reach substantially full deflec- tion. If a sufficiently slow wave is applied, say one m-hose frequency is one or two cycles per second, the instrument can follow i t and the true peaks of the wave will be indicated, but when much higher frequency waves are applied, such as the complex speech or program waves, the instrument is too slow to indicate the instantaneous peaks but averages or integrates whole syllables or bvords. As shown by tests and practical experience, i t is of secondary importance whether the detector actually has a root-mean-square (or square-law) characteristic, or has a linear or some intermediate characteristic.
A peak-reading instrument capable of truly indicat- ing the sharpest peak which might occur in a high- quality program wave would have to respond to impulses lasting only a very small fraction of a milli- second. Cathode-ray oscilloscopes or gas-tube trigger circuits are capable of doing this and, therefore, might be used as peak-reading volume indicators. However, the so-called peak-reading volume indicators used in practice, designed to give a visual indication on an instrument, are far from having the above speed al- though they are much faster than the root-mean- square instruments. They generally respond to im- pulses whose duration is measurable in hundredths or thousandths of a second and, therefore, truly in- dicate the peaks of sine-wave voltage whose frequency does not esceed, say, 50 to 100 cycles per second. They are similar t o the root-mean-square instru- ments in that they are not fast enough to indicate the instantaneous peaks of speech or program waves but tend to average or integrate a number of peaks of the wave.
A feature of the usual peak-reading instrument which from the analytical standpoint is of secondary importance, is that it is usually given a characteristic of very slow decay a s well as rapid response. This is

4 Proceedings of tlte I.R.E. J a n u a r y
uua l ly accomplished by a circuit such as illustrated -in Fig. 2 which shows the principle of the experimental instrument used in the tests described later. The 0.01- microfarad condenser is charged through a full-wave vacuum-tube rectifier, the rates of charge and dis- charge being determined by the resistances. The direct-current amplifier and direct-current ~nilliam- meter indicate the charge on the condenser. The ad- vantage of making the discharge rate of the condenser very slow is that the direct-current milliammeter need not then be particularly fast and, moreover, the ease of reading the instrument is greatly increased.
Fig. 2-Schrmatic diagram of experimental peak-reading volume indicator.
From the above analysis i t is seen that the root- mean-square and the peak-reading instruments are essentially similar and differ principally in degree. Both indicate peaks whose durations exceed some value critical t o the instrument and both average or integrate over a number of peaks the shorter, more rapid peaks encountered in speech or program waves. Either may have a linear or a square-law detector, or one of some intermediate characteristic. The im- portant difference between the two types lies in the speed of response as measured by the length of im- pulses to ivhich they will fully respond, that is, in the time over which the complex wave is integrated.
A general-purpose volume indicator may be called upon to serve a number of uses, such as:
(a) Indication of a suitable level for a speech or pro- gram wave to avoid audible distorf.ion \ ~ h e n trans- mitted through an amplifier, program circuit, radio transmitter, or the like.
(b) Checking the transmission losses or g.ains in an ex- tended program net\vork by simultaneous meas- urements at a number of points on particular peaks or impulses of the program wave which is being transmitted.
(c) The indication of the comparative loudness with which programs will be heard when finally con- verted to sound.
(d) The indication of a satisfactory level t o avoid in- terruption of service due to instantaneous over- loads tripping protective devices in a radio trans- mitter, damage to sound recording systems, etc.
(e) Sine-wave transmission measurements.
These services are different in nature and the ideal requirements for an instrument for each may not necessarily be the same. One instrument to serve them all must, therefore, be a compromise. From the stand- point of the companies engaged in this development, items (a), (b), and (c) in the above list were considered
to be the most important and therefore attention was first directed to the relative merits of the two types of volume indicators with respect t o them.
A u r a l Distortion D u e to Overload
Tests of volume indicators as overload indicators with aural distortion as the criterion (item (a)) had previously been made on a number of occasions and more tests were undertaken during the present devel- opment. The general procedure in such tests is to deter- mine for some particular amplifier the volume level a t its output a t which distortion due t o overloading can just be heard by a number of observers on each of a variety of programs. The volume levels thus deter- mined are read on the various volume indicators which are being compared. The best instrument is considered to be the one whose readings are most nearly alike for all the programs when overloading can just be de- tected.
The sole criterion of distortion due to overloading is the judgment of observers, since i t is the final reac- tion on listeners which is of importance. This judgment is not subject to exactness of measurement, but is in fact somewhat of a variable, even with conditions un- changed and with the most experienced observers. For significant results t o be obtained, therefore, a careful technique of conducting the tests is required, many observations must be made, and statistical methods of analyzing the resultant da ta must be employed.
The arrangement of equipment and circuits used in these tests is shown in simplified form in Fig. 3. A source of program, which may be a phonograph pick- up, a direct microphone pickup, or a program circuit, is corlnected through control circuits to the amplifier n hich is to be overloaded, and thence through addi- tional circuits to a loud speaker. The loud speaker em- pl'oyed in the tests reported here was a special high- quality two-unit loud speaker having a response \\rhich is substantially flat from 40 to 15,000 cycles per sec- ~ n d . ~ Including the power amplifier used with it, the over-all response of the system was substantially uni- form from 40 to 11,000 cycles.
The arrangement of the circuit is such tha t the volume level a t the output of the test amplifier may be raised or lowered while keeping the over-all gain of the system constant. Two controls are provided for this purpose. One, operated by a key, transfers a 15- decibel, loss from ahead to behind the test amplifier. This permits comparing a test condition with a refer- ence condition in which the load on the amplifier is 15 decibels loner, while the loudness with which the pro- --. gram is heard remains the same for either condition. The other control, represented in Fig. 3 by the coupled attenuators, permits the load on the amplifier for the test condition to be varied, also without changing the
E. C. Wcntc and A. L. Thuras, "Auditorv perspective-loud speakers and microphones," Elec. Eng., vol. 53, pp. 17-24; Jan- uary, (1934).

1940 Chinn, Gannett, and Aforris: Volume Indicator and Reference Level 5
loudness. The volume indicators t o be compared are connected for convenience, to a point where the vol- ume level is unaffected by the controls. Their readings ,,, corrected for each test by the nieasured loss or gain between the point where they are situated and the output of the test amplifier, so as to express the levels uhich would be read a t the amplifier output.
Two techniques \\-ere employed for conducting tests lvith this equipment. In one, the individual method, a single observer a t a time listens to the program and
the volume level a t the output of the amplifier by means of the coupled attenuator-s, until he deter- mine~ the point a t xvhich distortion due to overloading is just audible, when the key is operated from the reference to the test condition. This is repeated for a number of different programs and observers until a large number of observations have been obtained. The volume levels indicated by the different volume indi- dicators a t the amplifier output are determined for each observation. These are found to have a consider- able spread, due not only to the diflerences in the na- ture of the programs but also to differences in the acuity of perception of the distortion by the various observers. The method of a~lalyzing the data is de- scribed later.
In the second technique, the group method, a group of observers simultaneously listens to a program u-hich is repeated with the key operated alternately to the ttzst and reference positions. The two conditions are distinguished to the observers (but not identified as to sthich is which) by a letter associated \kith each condition in an illuminated sign. The letters A , B, and C are used, two being chosen a t random for each test. A vote is taken as to \+hich.condition, designatkd
2 POSIT ION NI CONDlTlONS 4 AND B
Fig. 3-Arrangements for determining volume level a t which overload of amplifiers is audible.
by one of the two letters employed in the articular test, is preferred with respect to freedom from distor- tion. A number of such tests, covering the range from a level below the point where distortion can be de- tected by anyone to a level high enough for all t o ob- serve distortion, establishes a curve between the per cent of observers correctly chobsing the reference con- dition as having the least distortion, and the amplifier Output level as read by each volume indicator used in the tests. Similar curves are determined for a number of kinds of program material, and for purposes of com- parison the overload point for each program is taken
from the point on the curve for each volume indicator, where 80 per cent3 of the observers voted correctly.
As noted, judgment tests of this sort require many observations and checks to obtain reliable results. A larger volume of da ta is available for the individual method, so the results from tests made by that method have been chosen to be reported here. Some tests have also been made with the group method and, while the results are less conclusive, they substantiate those recorded below.
Tests by the individual method to compare peak- reading and root-mean-square volume indicators have been carried out a number of times during the past two years. In each of these tests a number of observers have taken part and a number of samples of program material of a variety of types have been employed. For the majority of the tests, the sources of program were high-quality recordings, convenient because of the ease and exactness with which the programs could be repeated. For some of the tests, however, actual speak- ers and musical instrurnellts were employed with direct microphone pickup.
A number of the types of volume indicators in com- mon use were represented in these tests. Since the 700A volume indicator was common to all of the tests, i t has been chosen to represent the root-mean-square type of volume indicator in the data presented below. The peak-reading type was represented by the espe- cially constructed experimental instrument, whose fundamental circuit is shown in Fig. 2. The resistances controlling the rates of charge and discharge of the condenser were adjustable, permitting a range of char- acteristics to be obtained, The adjustments for which the da ta ;eferred to below were obtained, correspond to a rate of charge of the condenser such that impulses of single frequency applied to the input for 0.025 sec- ond would give a reading xvithin 2 decibels of the read- ing obtained with a sustained wave of the same ampli- tude. The rate of discharge of the condenser was about 19 decibels per second. These rates are generally simi- lar in magnitude to those specified by the International Consulting Committee on Telephone Transmission (the C.C.I.F.) for broadcast service, and by the Federal Communications Commission for modulation moni- tors.
The direct-current amplifier and direct-current mil. liammeter which indicates the charge on the con- den'ser included features, not shown in the simplified sketch, which made the response logarithmic. The in- strument had a substantially uniform decibel scale covering a range of 50 decibels.
The da ta from four different series of tests, made a t different times, were collected in one body, and dis- tribution curves were plotted showing the relative fre- quency of occurrence among the da ta of the different levels a t which incipient overload was detected.
a W. B. Snow, "Audible frequency ranges of music, speech and noise, Jour. Acous. Sac. Amer., vol. 3, pp. 155-166; July, 1931.

6 Proceedings of the I.R.E. January
Curves for tests on a Western Electric 94B amplifier, which is an amplifier designed with negative feedback and therefore having a relatively sharp cutoff, similar to a radio transmitter, are illustrated in Fig. 4. I t will be noted that the curve obtained with the root-mean- square volume indicator has a slightly greater spread than that for the peak-reading volume indicator. Twelve different observers took part i11 these tests, and 13 samples of progranl I\ ere employed, including male and female speech, dance music, piano, violin, and brass-band selections.
Fig. 4-Distribution of overload points.
The data may more readily be interpreted when plotted in the form of cumulative distribution curves, obtained by integrating the above distribution curves. Cumulative curves for the data just referred to are shown in Fig. 5 . For convenie~lce and ease of interpre- tation, these curves have been plotted on "probability" rather than rectangular co-ordinates, as probability co-ordinates have the property of making data whose distribution follows a normal law4 form a straight line. I t will be noted that the ekperimentally determined points actually fall so nearly on straight lines that i t is reasonable to assume straight lines to represent them.. I t is likely that , with a greater volume of data, stiil greater conformity to the straight lines d r a ~ i 11 \vould be obtained. .. P
In order to superpose the curves for the t ~ v o volume indicators, the levels are plotted in decibels with re- spect to the average overload level determined from the tests. LYhen calibrated to read alike on the same sine-wave power, the experimental peak-reading in- strument (with the adjustments described above) reads on the average 7.4 decibels higher on actual programs than the root-mean-square instrument used in the tests.
Now let i t be imagined that the test amplifier is the one critical link in a broadcast network and that an operator is given the duty of satisfactorily adjusting the volume levels through the amplifier using either of the two volume indicators tested. If he lets the louder portions of the programs just reach the volume level marked '<O decibel" on the curves, it will make no difference which volume indicator he uses. In either case, on the average, half of the listeners will hear distortion when the program is loudest. However, this result would probably be Ansidered too poor, so
The "normal" law has the form y=Ae-"z2.
suppose the maximum level is lowered 3.5 decibels. Referring to the curves, i t is seen that if the peak- reading volume indicator is used, only about 5 per cent of the listeners will now, on the average, hear distortion on the loudest program passages, while if the root- mean-square instrument is used, about 10 per cent will hear distortion. T o reduce the latter figure to 5 per cent \vould require lowering the maximum volume level another decibel. Thus with this criterion, the peak instrument has a slight advantage, as i t would permit the transmission of a 1-decibel higher average volume level for the same likelihood of distortion being heard.
The above statements assume tha t the observers and programs used in the tests just described were representative of the listening public and the programs they hear. Actually, the observers were trained by experience in making many tests and were no doubt much more critical than the average listener. More- over, the conditions under which the tests were per- formed, with the availability of frequent comparison with the undistorted reference condition, were more conducive to critical detection of overload than are average listening conditions. These facts, together
Fig. 5-Comparison of peak trersus root-mean-square volume indi- cators as overload indicators (using Western Electric 94R amplifiers).
with the inevitable inability of the control operator in practice to make his adjustments perfectly in an- ticipation of the coming changes in the programs, tend to make the real practical advantage of one -ihstrument over the other considerably less than shown by the tests. A further factor reducing the im- portance of the small differences shown by the tests is the growing use of volume-limiting amplifiers a t criti- cal points in a broadcast system, such as a t the radio broadcast stations, which automatically prevent the transmission of excessive levels.

" 1940 Chinn, Gannett, and ilforris: Volume Indicator and Reference Level 7
Another cumulative distribution curve is shown in ~ i ~ . 6 , representing similar tests on a Western Electric I J B program amplifier. This is a simple push-pull triode amplifier without negative feedback and there- fore having a more gradual cutoff than the 94B. (The g a i n - v e r s u s - ~ ~ t p ~ t - p ~ w e r - ~ e ~ e ~ curves a t 1000 cycles per second are shown in Fig. 7 for the two amplifiers.) 1t IvilI be seen from Fig. 6 that the data for the two volume indicators show no significant difference and that the single curve equally well represents either set of data in the region of interest. Somewhat fewer data are represented by this curve and the agreement with the normal law is not quite so close as in the pre\ TIOUS '
case. The peak-reading instrument with the adjustment
used in these tests, although having characteristics
Fig. 6-Comparison.of peak versus root-mean-sqaare volume indi- '
cators as overload indicators (using Western Electric 14B pro- gram amplifiers).
similar to those usually proposed for this type of device, is still far too s i o ~ in response to indicate the true instantaneous peaks of the program wave. The question naturally arises, therefore, whether any greater difference would be indicated if the peak- reading instrument were made sufficiently fast in re- sponse to indicate the actual instantaneous peaks. TO check this ~ o i n t , some tests similar to those de- scribed above were made, using a gas-tube trigger circuit capable of measuring the true instantaneous peaks. The results of these tests, using the 94B amplifier, are shown in Fig. 8. Although a smaller number of observations are included in these data;' the results show conclusively that there is no sub- stantial difference between the experimental peak- reading volume indicator and the faster trigger-tube arrangement, in their performance on actual program waves. +
The data from the tests'have been presented above
in the form which most directly indicates the compara- tive performance of the two types of volume indica- tors. However, a breakdown of the data with respect to the types of program may be of interest and is shown in Tables I and I1 for the da ta on the 94B amplifier shown previously in Figs. 4 and 5.
O I R 4 n LEVEL - DB A B W E ONE YlLLlWATT
Fig. 7-Gain-versus-load characteristics of amplifiers.
I t will be observed in Table I tha t the average over- load points for the different types of programs fall within a range of about 2 decibels for either volume
41 OBIERV4TIONI O N 9 4 8 AMPLIFIER
g e m
V C r 0 5 '$ O C 0 : J
m < 0 0
N 8 2 + Cd
e 5 s u r
N
- 6 - 5 - 4 -3 - 2 - I 0 t 2 3 4 5 ' VOLUME LEVEL - 08
Fig. 8-Comparison of esperimental peak-volume indicator with gas-tube-trigger device a s overload indicator.
indicator. However, i t will be noted tha t with the root- mean-square instrument the average overload point for speech is about 2 decibels lower than for music, while there is no significant difference with the peak instrument. This undoubtedly is because speech waves have a higher "peak-factor" (ratio of peak to root- mean-square values) than music.
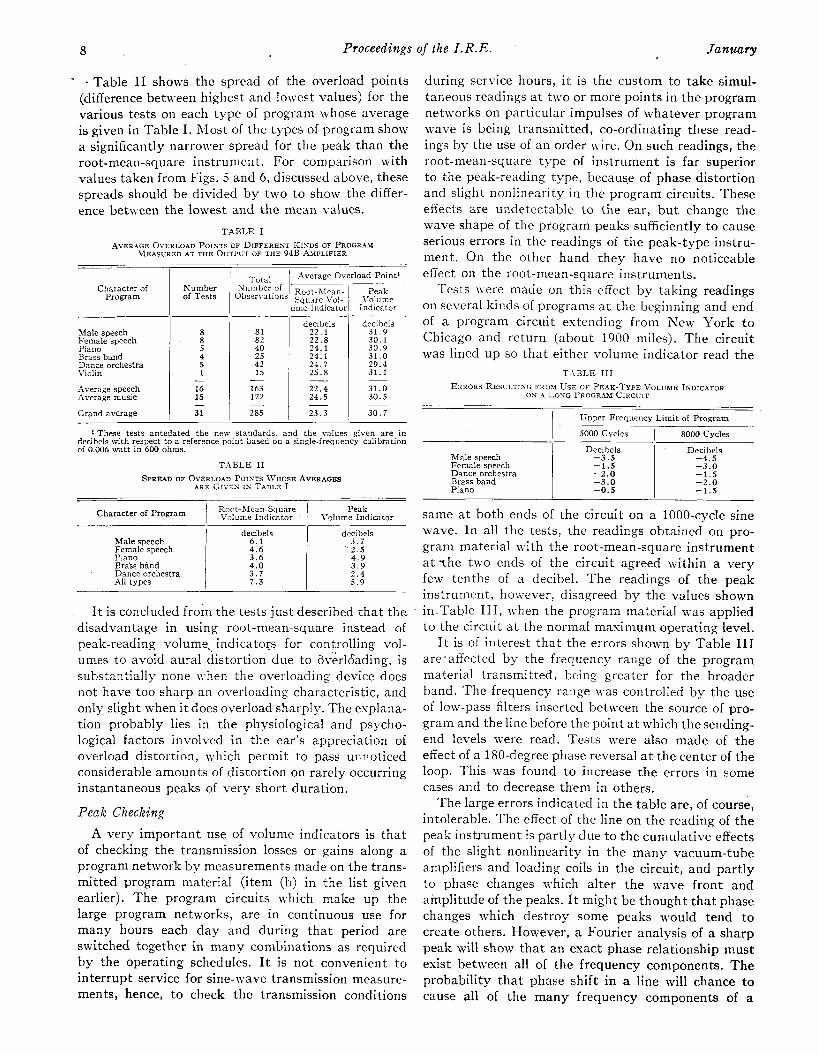
8 Proceedings of the I.R.E. January
- Table 11 shows the spread of the overload points (difference between highest and lowest values) for the various tests on each type of program whose average is given in Table I. hIost of the types of program show a significantly narrower spread for the peak than the root-mean-square ins t run~e~l t . For comparison with values taken from Figs. 5 and 6, discussed above, these spreads should be divided by two to show the differ- ence between the lowest and the mean values.
AVERAGE OVERLOAD POISTS OF DIFFERENT RINDS OF PROGRA!! MEASURED AT THE OUTPUT OF THE 94B AXPLIFIER
I I ,.A_, I Average Overload Point1 Character of NU:;,"; of
pp
Program Observations ~ ~ ~ : " ' ~ $ ~ 1 \::tie ume ~ n d l c a t o r Ind~cator
Male speech 8 8 1 Female speech 8 82 Piano 5 40 Brass band 4 25 Dance orchestra 5 42 Violin 1 15
Average speech Average music 15 122 24.5 30 .5
Grand average 1 31 I ~ / 2 3 . 3 1 ~ 1 These tests antedated the new standards, and the values given are in
decibels with respect to a reference point based on a single-frequency calibration of 0.006 watt in 600 ohms.
Character of Program ' Root-h'ean-Square Peak / Volume Indicator 1 Volume Indicator
Male speech Female speech P ~ a n o Rra'ss band Dance orchestra All types
decibels 6 . 1 4 . 6 3 . 6 4 . 0 3 . 7 7 . 3
decibels 3 . 7 2 . 5 4 . 9 3 . 9 2 . 4 5 . 9
I t is concluded from the tests just described that t h e disadvantage in using root-mean-square instead of peak-reading volume.. indicators for controlling vol- umes to avoid aural distortion due to over16ading, is substantially none \\hen the overloading device does not have too sharp an overloading characteristic, and only slight when i t does overload sharply. The esplana- tion probably lies in the physiological and psycho- logical factors involved in the ear's appreciation of overload distortion, which permit to pass unnoticed considerable amounts of distortion on rarely occurring instantaneous peaks of very short duration.
Peak Checking
A very important use of volume indicators is tha t of checking the transmission losses or gains along a program network by measurements made on the trans- mitted program material (item (b) in the list given earlier). The program circuits which make up the large program networks, are in continuous use for many hours each day and during that period are switched together in many combinations as required by the operating schedules. I t is not convenient to interrupt service for sine-wave transmission measure- ments, hence, to check the transmission conditions
during service hours, i t is the custom to take simul- taneous readings a t t ~ v o or more points in the program networks on particular impulses of whatever program wave is being transmitted, co-ordinating these read- ings by the use of an order wire. On such readings, the root-mean-square type of instrument is far superior to the peak-reading type, becaus.e of phase distortion and slight nonlinearity in the program circuits. These effects are undetectable t o the ear, bu t change the wave shape of the program peaks sufficiently to cause serious errors in the readings of the peak-type instru- ment. On the other hand they have no noticeable effect on the root-mean-square instruments.
Tests \%-ere made on this effect by taking readings on several kinds of programs a t the beginning and end of a program circuit extending from New York t o Chicago and return (about 1900 miles). The circuit was lined up so that either volume indicator read the
TABLE 111
ERRORS RESULTISG FROM USE OF PEAK-TYPE VOLUME INDICATOR ON A LONG PROGRAM CIRCUIT
1 Upper Frequency Limit of Program
1 5000 Cycles 1 8000 Cycles
same a t both ends of the circuit on a 1000-cycle sine wave. In all the tests, the readings obtained on pro- gram material with the root-mean-square instrument a t sthe two ends of the circuit agreed within a very few tenths of a decibel. The readings of the peak instrument, however, disagreed by the values shown in-Table 111, when the program material was applied to the circuit a t the normal maximum operating level.
I t is of interest that the errors shown by Table I11 aresaffected by the frequency range of the program material transmitted, being greater for the broader band. The frequency range \\,as controlled by the use of low-pass filters inserted between the source of pro- gram and the line before the point a t which the sending- end levels were read. Tests were also made of the effect of a 180-degree phase reversal a t the center of the loop. This \\,as found to increase the errors in some cases and to decrease them in others.
The large errors indicated in the table are, of course, intolerable. The effect of the line on the reading of the peak instrument is partly due to the cumulative effects of the slight nonlinearity in the many vacuum-tube amplifiers and loading coils in the circuit, and partly to phase changes which alter the wave front and ainplitude of the peaks. I t might be thought that phase changes which destroy some peaks would tend to create others. However, a Fourier analysis of a sharp peak will show tha t an exact phase relationship must exist between all of the frequency components. The probability tha t phase shift in a line will chance to cause all of the many frequency components of a
Decibels -4 .5 - 3 . 0 - 1 . 5 - 2 . 0 -1 .5
Male speech Female speech Dance orchestra Brass band Piano
Dec~ bels -3 .5 -1.5 - 2 . 0 - 3 . 0 -0 .5

Chinn, Gannett, and Alorris: Volume Indicator and Reference Level
wave to align themselves in the relationship necessary to create a peak where none esisted before; is very slight-illdeed infinitesimal compared to the probability of the occurrence of a peak in the origillal ~vave.
Loudness
~ n ~ t h e r important consideration is the correlation between volume levels and the comparative loudness of different types of programs (item (c) in the list given earlier). This was tested by a method similar to the "group method," described above in connection .;th the tests on aural overload distortion. A group of observers xvas permitted to listen to alternate repeti- tions of a test program and a reference program, and !!as asked to vote upon which appeared the louder. ,4 prticular selection of male speech \%-as used as the
program for all of the tests and its level was kept constant. The test programs included several different types and several samples of each type of program. The samples of program were about 30 seconds in length. Each test program was presented at a number of levels covering a range from a low level where all the observers judged the reference program to be the louder to a higher value where all of them judged the test program to be the louder.
Thus, a curve was established for each type of pro- Rram between the per cent of observers judging the tcst program to be the louder, and the level of the test program. A sample of such a curve is shown in Fig. 9.
, 'Fhe 50 per cent point on the curve is interpreted. as inhicating the level of the test program a t which i t appears to the average observer t o have the same loudness as.the reference program. The test ,program is then set a t this LLequal-loud~ess" volume le\el and the 1e;rels of both test and reference programs are read uith e i t h of the'types of volume indicators.of interest. In this way, the figures given in Table IV were determined.
TABLE IV ..
Volume Indicator Readings for Same Loudness as Male Speech
Type of Program 1 Peak Volume Ind~cator Inrlicator
Male speech Female speech Dance orchestra Symphony orchestra Male singing
It is evident from the figures in the table that there is no significant advantage for either type of volume indicator where loudness is the criterion.
Table IV shows tha t when the new volume indi- cator is used the musical programs must be 2 to 3 decibels higher than speech to sound equally loud. I t is of interest to note that according to Table I this Same difference was shown to exist between the aver- age overload point of the 94B amplifier on speech and music, when measu.red with the root-mean-square
- decibels 0
- 0 . 1 + 2 . 8 +2 .7 + 2 . 0
volume indicator. This would seem to indicate that if allowance is made for this difference between speech and music in controlling the volume levels t o avoid overloading, they will also then sound equally loud to the listeners.
, dccibels 0
- 2 . 2 - 2 . 2 - 2 . 3 - 2 . 5
-10 - 5 0 + 5 r 10 VOLUME LEVEL RELATIVE TO THAT OF MALE SPEECH
Fig. 9-Per cent of observers choosing symphony music a t indi- cated volume levels t o be louder than the male speech refer- ence.
Choice of Type
The tests of aural distortion due t o overload showed so slight a disadvantage for the root-mean-square instrument and the experiments on peak checking showed such a marked advantage for this type as compared with the peak instrument, tha t i t was decided to develop the root-mean-square type of instrument. Other considerations were, tha t with the advances in copper-oxide types of instruments, i t has become possible t o make root-mean-square instru- ments of sufficient sensitivity for most purposes with- out the use of vacuum tubes and their attendant need of power supply, an advantage not shared by peak- reading instruments, a t least a t present. Thus, the root-mean-square instrument has advantages of com- parative low cost, ruggedness, and freedom from the need of power supply, and can, moreover, be readily made in portable forms when desired.
DYNAMIC AND ELECTRICAL CHARACTERISTICS
I t will be appreciated from the earlier discussion that for a volume indicator t o be truly standard, its dynamic and electrical characteristics must be con- trolled and specified so tha t different instruments will iead alike on the rapidly varying speech and program waves. Therefore, the next step in the development was to determine suitable values for these character- istics.
In deciding upon the dynamic characteristics, an important factor included in the consideration was the ease of reading the instrument and the lack of eye- strain in observing i t for long periods.
First, a number of existing instuments were studied, including some experimental models constructed inde-

of the I.1Z.E. January
pendently for the two broadcast companies prior to the s tar t of this joint development. In this, the opin- ions of technicians, accustomed to reading volume indicators as a part of their regularly assigned duties, were sought, as \\-ell as those of the engineers. The instruments studied included a considerable range of speeds of response and of damping. From this ~vork , the folio\\-ing conclusions \\-ere reached:
Fig. 10-Effect of damping on instrument characteristics.
(a) For ease of reading and minimum of eye fa- tigue, the movement should not be too fast. i ls a result of observations under service conditions and other tests the requirement \\-as adopted that the sudden appliciti6n of a 1000-cycle sine \\-ave of such ampli- tude as to give a steady deflection a t the scale point where the instrument is to be read, shall cause the pointer t o read 99 per cent of the final deflection 'in 0.3 second.
(b) The movememt shall be slightly less,than criti- cally damped, so that the pointer \\-ill overslving not less than 1 per cent nor more than 1.5 per cent \\-hen the above sine \\-aye is suddenly applied,
This last point deser\-es further discussion. I t was noted that on speech or program waves, instruments which were critically damped or slightly overdamped had a more "jittery" action than instruments slightly underdamped, and the strain of reading them was greater. The reason for this nil1 be understood by reference to the theoretical curves shown in Fig. 10. These curves represent, for three different degrees of damping, the deflection versus time follor\-ing the sudden application of a steady sine nave . Curve A is for a movement underdamped by the amount spec- ified above. Curve B is for a critically damped move-. ment, while curve C is for a movement \\-hich is over- damped by the same factor that A is underdamped. I t is assumed that the periods of the three movements are so adjusted that all reach a deflection of 99 per cent in the same time and tha t the sensitivities of each are the same.
I t will be noted tha t the velocity of the pointer in curve A is more nearly uniform than in the other curves, and tha t the maximum velocity in A is only about half tha t in C. Because of the lo\\-er and more uniform velocity, there will be much less eyestrain in watching pointer A , as i t dances about in response to program waves, than either of the others. Moreover, the same curves inh~erted will equally well represent the motion of the poi~lters when the applied wave is suddenly stopped. I t is evident, by inspection of the region sho\in near zero, t ha t pointers B and C will s tar t down\\-ard very rapidly whereas pointer A will pause for a moment and then s ta r t downward more slo\\-ly. This is of importance since i t is the maximum excursio~ls of the pointer which must be observed in reading volume levels. The tendency t o pause a t the top of the swing before starting downward makes A easy to read, and the failure t o d o so explains the observed "jittery" motion of instruments such as B and C.
As a further part of this study, high-speed moving pictures were taken of the available volume indicators, sho~ving their response to suddenly applied sine waves. The pictures \\-ere taken a t 400 frames a second and included on the edge of each frame was a photograph of a clock device which indicated time in thousandths of a second. From measurements made on these films, the data plotted in Fig. 11 were obtained. I t is interest- ing to bbserve how lightly damped are the oscillations of the 203C volume indicator, which until the advent ?f the nelv instru~rlent has been in use in considerable numbers. The curve for the peak volume indicator on Fig. 11 must not be mistaken for the true speed of
Fig. 11-Deflection of volume indicators t o suddenly applied sine Jvave.
response but is merely the speed with which the instru- ment reads the charge on the condenser (see Fig. 2).
. The charge builds up quite rapidly, bu t the instrument folio\\-s in more leisurely fashion as shown. The instru- ment, as noted earlier, will actually give a reading of 80 per cent on an impulse of sine I\-ave as short as 0.025 second.
The above characteristics were decided upon only after many tests corroborated by field trials under

m e I7zdicator a n d Re ference Lezlel 11
actual conditions. T h e validity of the con- clusions reached in the tests of earlier root-mean- quare xsOlume indicators \\-as checked ~ v i t h respect to the ne\\: instrument by further tests.
The question of whether the rectifier should be half or full wave needs little discussion. The oscillo-
gram of the speech wave show11 in Fig. 1 slio\\.s a very marked lack of symmetry. Evidently if a volume indi- cator is to give the same reading no matter \\-hich \vay it, input is poled, a balanced full-wave rectifier is required.
1'hroughout this paper, the term '(root-mean- has been used loosely to describe the general
type of instrument under consideration. Some tests uere made to ietermine the actual law of addition of (lie ne\v volume indicator.
'I'he procedure \\-as based on determining the ex- 1,011ent p in the equation i= kep which is equivalent to the actual performance of the instrument for normal deflections. (In the equation i is the instantaneous current in the instrument coil and e is the instantane- ous potential applied to the volume indicator.) Two n~ethods \\.ere employed. One consisted in determining the ratio of the magnitudes of the sine-wave alternat- ing- and the direct-current potentials lvhich when ;il)l)lied to the volume indicator give the same deflec- tion. 'I'he second method consisted in determining the ratio of the single-frequency potential to the potential (JI each of two equal amplitude, ~lo~iharrnonically nlated frequencies which \\-hen simultaneously applied xive the same deflection.
\.f'ithout going into the mathematics involved,"a rlunll)er of the new volume indicators were found to llave exponents of about 1.2. Therefore, their charac- icristics are jntermediate betlveen linear (p - i ) atld > ( I ~1a1-e-Ian. or ('root-mean-square" ( p = 2) character- i>tic. .Applying the second method-,to a \iTestcrn Elec- tric 1G volume indicator, which'is chsidered to be's "rc)()t-mean-square" instrume~lt , the exponent \\-as iound to be 1.89.
Anlong the more important features to be considered ir\ the development of a volume indicator is the design of its scale. In broadcast studios, volume indicators are under observation almost continuously by the control operators, and the ease and accuracy of reading and the degree of eyestrain are of major importance.
Prior to the adoption of the new standard volume indicator there was a n ide variety of volume-level indicator scales in use by the electrical communica- tions industry. This, coupled with the use of a number of different kinds of instruments, reference levels, etc., resulted in considerable confusion u hen volume meas- urements were involved.
Volume-level indicators, as already explained, are (a) as an aid in compressing the wide dynamic
range of an original performa~icc to that of the asso-
ciated transmission medium and (b) for locating the upper part of the dynamic range just within the over- load point of an equipment during its normal opera- tion. For the first of these uses, a scale having a wide decibel range is preferable. For the latter purpose, a scale length of 10 decibels is usually adequate. Since a given instrument may be used for both applications, neither too large nor too small a range is desirable in a volume-level indicator for the above purposes. A usable scale length covering 20 decibels appears t o be a satisfactory compromise.
I t is evident t ha t the instrument scale should be easy to read in order t ha t the peak reached by the needle under the impetus of a given impulse may be accurately determined. The instrument scale, there- fore, should be as large as practical since, in the case of the broadcast and motion-picture applications, a t - tention is divided between the action in the studio and the volume indicator.
The instrument-scale graduations should convey a meaning, if possible, even t o those not technically inclined but who are, nevertheless, concerned with the production of the program material.
Finally, the scale must be properly illuminated so tha t the relative light intensity on the face of the instrument is comparable to that on the sound stage. Unless this condition prevails, the eye xvill have difficulty in accon~modating itself with sufficient rapid- ity to the changes in illumination as the technician glances back and forth from the studio t o the volume- intlicator instrument.
Existing S c a l e s
The volume-indicator scales most commonly em- ployed in the past are shown in Figs. 12, 13, 14, and 15. I t is evident that all these scales differ from each other in one or more respects.
The color combinations employed for the scale shown in Fig. 1 2 and the simplicity of its markings are outstanding virtues. The division markings arid the numerals of the main scale are black on a yellow back- ground. The decibel divisions and associated numerals are in red and considerably less co~ispicuous than the main scale.
Hoxvever, the 0-to-60 scale, which is used on both of the instruments shown in Figs. 12 and 13, is an arbitrary one bearing no simple relation to the elec- trical quantity being measured. Because of this, some of the nontechnical persons concerned with program production are prone to request tha t a certain ('effect" which they desired to transmit a t a louder-than-nor- ma1 level, be permitted to slving the indicating needle beyond the normal reference point of "30" on the scale. I t is not evident to them from the instrument scale tha t the normal reading of "30" corresponds t o maximum "undistorted" output of the system.
'I'lie scale shown in Fig. 14, on the other hand, was primarily intended for steady-state and not volume-

12 Proceedings of the I.1C.E. January
level-measurement purposes. Consequently, this scale has little, if anything, to commend i t for program monitoring use. Nevertheless, the sinlplicity and the fine electrical features of this type of instrunlent, to- gether with its relatively reasonable cost, has resulted in its general applicatio~l to volume-indicator service. I t is evident, hoii-ever, that the scale card which con-
Fig. 12-Scale on 203C volume indicator.
tains all kinds of identification data, is entirely too confusing for quick, accurate observations as the needle swings rapidly back and forth across the scale.
The scale shown in Fig. 15 has the merit of simplic- ity and easy readability. I t is, hoivever, somewhat limited in the decibel range appearing on the scale.
New Scale
Both yu5 and markings proportional t o voltage are incorporated in the neiv instrument scale. The need for the former is obvious, hut the philosophy nhich leads to the inclusi'on of the latter requires an explana- tion.
per cent mark, then subsequent indications show the degree of modulatioll under actual operating condi- tions. In the interests of best operation, i t may be desirable, of course, t o adjust the system for some- what less than conlplete modulation when the 100 per cent indication is reached.
In any event, the indications on the voltage scale alxvays show the percentage utilization of the channel. This is a decided advantage because everyone in- volved has a clear conception of a percentage indica- tion. Furthermore, since the scale does not extend beyond the 100 per cent mark (except in the form of a red warning band) and since i t is impossible to obtain more than 100 per cent utilization of the facilities, there is no incentive on the part of nontechnical people connected with program origination, t o request an extra loud ''effect" on special occasions.
Actually, two scales, each containing both vu and voltage markings, have been devised. One of these knoivn as the type-A scale, Fig. 16, emphasizes the vu markings and has an i~lconspicuous voltage scale. The second, known as the type-B, Fig. 17 , reverses the emphasis on the two scales. This arrangement permits the installation of the instrument which features the scale that is most important t o the user, xvhile retaining the alternate scale for correlation purposes.
The new scale retains the simplicity and the general color scheme of the former Fig. 12 scale. The main divisions markings and the associated numerals are, in each case, in black. The secondary da ta are smaller (2nd in one case, are in red) and therefore less con- spicuous than the others. All irrelevant markings have been omitted from the scale.
The color of the scale card, which is a deep cream,
Fig. 13-Scale on type 21 volume indicator. Fig. 14-Scale on type 586 pan-er-le\rcl indicator.
I t is evident, assuming a linear system, that the seems to be a satisfactory compromise between high voltage scale is directly proportional to percentage contrast and reduced eyestrain and fatigue. This modulation of a radio transmitter upon which the choice is based upon the preference of a large group of program is finally impressetl. If the system is adjusted sltilled observers and upon the reports of certain socie- for complete modulation for a deflection to the 100 ties for the improvement of vision. The use of rnatte-
Defined below. finished instrument cases having fairly high reflection

Chinn, Gannetl, and ilforris: Volume Indicator and Reference Level 13
such as light grey, is also desirable for ,a,e of vision.
The location of the "reference" point is such that 7 1 per cent of the total scale length is utilized as
to only 42 per cent in former instruments. This feature, combined with the use of a larger sized ;,,trument results in a useful scale more than 2.5 . . - times the length of former scales.
.~lthough the reference point is no longer in the traditional vertical or near-vertical position, i t has
found that even those xvho have long been accus- tomed to the old arrangement, soon discover the 3r!\antages of the ne\zr scale. This is attested, in the
of the broadcast application, by the general .:,.ccptance of this scale by the personnel of stations :,r.;ited in all sections of the countl-y.
.A small but important feature of the new scale is :he use of an arc to connect the lower extremities of [he vertical black division marks. This arc affords a !!atural path along xvhich the eye travels as i t watches
needle flash up and down the scale. The omission ,,i this arc would result in a number of vertical division iil,irks, hanging in space, as obstacles to the free back- .,~~tI-lorth motion of the eye.
I t is e\.ident upon comparison of Figs. 12, 13, 14, .ind 15 \\ith Figs. 16 and 1 7 tha t the dynamic volume r.1ng.e visible on the scale is a t least twice as great as o n former instruments. This range, as already ex- pI,iined, is a good median value for general use.
IIe~ition uas made of the opinions of a group of sk~llcd observers. This group consisted of more than *o broadcast technicians xvho, in the performance of'
(a) 83 per cent preferred the cream in place of a white scale card.
(b) 90 per cent preferred the '60-100" scale t o the "0-60" scale.
(c) 92 per cent preferred the longer scale length (3.5" versus-2.36").
Fig. 1 6 N e w volume indicator-A scale.
(d) 97 per cent preferred the numerals placed above the arc.
(e) 50 per cent preferred the spade pointer to the lance type.
(f) 93 per cent agreed on the adequacy of 3-decibel leeway above the reference point.
Having agreed on the characteristics of the new standard volume indicator, the interests of complete standardization call for agreement, as well, upon a uniform method of use and a uniform terminology. -4greement upon a uniform method of use must in- clude establishing the reference-volume or zero-vol-
F 1 ~ . 15-Type of scale used on 1G and 700A volume indicators. Fig. 17-New volume indicator-B scale.
their duties, watch volume-indicator instruments al- ume level to which the readings are to be referred and most continuously throughout the working day. The agreeing upon the technique of reading the volume
of this group were obtained by submitting indicator. Y r h g models for their individual considerations. I t I t is important to appreciate tha t "reference vol-
believed that some of tile results of these observa- ume" is a useful practical concept, bu t one which is hens are of interest. quite arbitrary and not definable in fundamental

14 Proceedings of the I . R.E. January
terms. For example, i t cannot be expres~ed in any simple way in terlns of the ordinary electrical units of power, potential, or current, but is describable only in terms of the electrical and dynamic characteristics of an instrument, its sensitivity as measured by its single-frequency calibration, and the technique of reading i t . In other words, a correct definition of refer- ence volume is that leuel of progranz which causes a standard volume indicator, when calibrated and used i n the accepted way, to read 0 V Z L . ~
I t is especially cautioned tha t reference volume as applied to program material should not be confused with the single-frequency power used to calibrate the zero volume setting of the volume indicator. If a volume indicator is calibrated so as to read zero 011 a sine-\\ave power of, say, 1 millin-att in a stated im- pedance, a speech or program 14 ave in the same im- pedance n hose intensity is such as t o give a reading of zero ii ill have instantaneous peaks of pol$ er n hich are several times 1 millin-att and an average poi\ er n hich is only a small fraction of a milli~vatt. I t is therefore, erroneous to say that reference volume in this case is 1 rnilli~vatt. Only in the case of sine-wave measurements does a reading of 0 vu correspondent to 1 milliu a t t .
I t should be emphasized that although i t is conven- ient to measure the performance of amplifiers and systems by means of single frequencies there is no exact universal relationship betneen the single-fre- quency 1oac'-carrying capacity iniicatec' L;y such mcas- urements, and the load-carrying capacity for speech and program naves expressed in terms of volume level. This relationship depends upon a number of factors such as the rapidity of cutoff a t the overload point, the frequency band a i d t h being transmitted, the quality of service to be rendered, etc.
Ir: has already been brought out tha t in the past there ha\-e been a..multiplicity of refe1;ence volumes differing from each other not 0111~'11ec~use of the various single-frequency calibrations n hich have been employed, but also because of the clissin~ilar dynamic characteristics of the different instruments used to measure volume levels. I t is also apparent that the introduction of a nelv volume indicator whose charac- teristics are not identical n i th ally of its predecessors inherently means the introduction of a neu reference volume no matter how it is calibrated. Therefore, there did not seem to be any compelling reason to make the calibration of the new instrument agree with any of the calibrations used in the past. filoreover, to many there seemed to be some advantage in setting the new reference level a t a sufficiently different order of magnitude from those uhich had been in most corn--- mon use, so that there will be little chance of confusing the new standards with any of those that went before.
After much thought and discussion, i t ivas agreed that the new reference volume should correspond to the reading of the new volume indicator when cali- brated with 1 milliwatt in 600 ohms across which the
volume indicator is bridged. Other Calibrating values considered \\ere 10-'6 watt, 6 milli\vatts, and 10 xnilli- watts, in 600 ohms or in' 500 ohms. The value chosen was preferred by a majority of a large number of people who were consulted and in addition was found to bc the only value to ~vhich all could agree. Some of the reasons for choosing 1 milliwatt watts) were: (a) I t is a simple round number, easy to remember; (t ) loF3 is a preferred number6; (c ) . 1 milliwatt is a much-used value for testing power for transmission measurements, especially in the telephone plant, so tha t choice of this value, therefore, permits the volume indicators t o be used directly for transmission meas- urements.
The choice of the standard impedance of 600 ohms was influenced by the fact that , considering all of the pIants involved, there is more equipment designed to this impedance than to 500 ohms.
The question may very well be raised why the refer- ence volume has been related to a calibrating power rather than to a calibrating voltage, inasmuch as a volume indicator is generally a high-impedance, volt- age-responsive device. A reference level could con- ceivably be established based on voltage and the unit of measurement might be termed "volume-volts.'' However, volume measurements are a part of the general field of transmission measurements, and the same reasons apply here for basing them on power consic'erations as in the case of ordinary transmission measurements using sine LX-aves. If the fundamental concept \$ere voltage, apparent gains or losses would a'ppear wherever impedance-transforming devices, such as transformers, occur in a circuit. This difficulty is avoided by adopting the poll-er concept, making suitable corrections in the readings when the im- petlance is other than 600 ohms.
Hav:ng chosen the zero point t o which the new violulne readings n-ould be referred, the next question to be decided was the terminology to be employed in describing the measurements. As has been pointed out, the past custom or describing the volume meas- urements as so many decibels above or below reference level has been ambiguous because of differences in instruments and standards of calibration. I t was thought, therefore, that there would be less confusion in adopt:ng the new standards if a new name Itrere coined for expressing the measurements. The term selected is "vu," the number of vu being numerically the same as the number of decibels above or below the new reference-volume level. I t is hoped tha t in the future this new term will be restricfed to i ts intended use so that, whenever a volume-level reading i s encountered
%'expressed as so many V Z L , i t will be understood that the reading was made wi th a n instrzl?nent having Ihe char- acteristics of the new volz~me indicator and i s expressed with respect to the 12ew reference level.
6 A. \'an Dyck, "Prcfrrrrcl numbers," PROC. I.R.E., vol. 24, pp. 159-179; Fcl)runry, (1936).
Chinn, Gannett, and Ailorris: Volume Indzcntor and Kejerence Leve~ 13
The procedure for reading the new volume indicator is 6sentially the same as that which has alivays been employed, with the exception that, since the instru- ment is very nearly critically damped, there need be tolerated fe~ver overswings above the prescribed de- flection. One who is familiar lvith the use of volun~e indicators will instinctively read the new instrument
The procedure may be described by stating that the adjustable attenuator, which is a part of the
indicator, should be so adjusted that the ex- treme deflections of the instrument needle will just
a scale reading of 0 on the vu scale or 100 on the per cent voltage scale. The volume level is then given by the designations numbered on the attenuator. I f , for any reason, the deflections cannot he brought r \ a~ t ly to the 0-vu mark or 100 per cent mark, the reading obtained from the setting of the at te~iuator may, i f desired, be corrected by adding the departure from O shown in the vu scale of the instrument.
Since program material is of a very rapidly varying nature, a reading cannot be obtained instantaneously hut the volume indicator must be observed for an appreciable period. I t is suggested tha t a period of 1 minute be assumed for program material and 5 to 10 5t.coilds for message telephone speech, so that the \.olume level a t any particular time is determined by the maximum swings of the pointer within that period.
In the preceding sections of the paper the considera- rions \vhich led to the selection of the more-important c-liaracteristics of the new volume indicator have heen tl&cussed in some detail. In this section a summary \\-ill be made, first of the fundamental requirements \\.hii:h must..be conformed to by any instrument if i t is to be a standard volume indicator according to- the. lie\\ standards and second, of other requirements
hich ha\-e been specified for the. new volume indica- tors which are perhaps matters more of an engineering than of a fundamental nature. These requirements are a condensation of the more impoxtant features of the specifications for the new instrument. The \Teston Electrical Instrument Corporation generously co-oper- ated in the development, but i t is emphasized tha t the specifications are based on fundamental require- ments and are not written on the product of a particu- lar manufacturer. The complete requirements are available to any interested party, and, as a matter of fact, a t least one other manufacturer has produced an instrument which meets the requirements.
( A ) Fundamental Requirements
1. Rectifier The volume indicator must employ a full-wave
rectifier. 2 . Scales
The face of the instrument shall have one of the two scale cards sholvn in Figs. 16 and 17. Both cards shall have a "vu" scale and a "percentage voltage"
scale. The reference point a t which i t is intended normally to read the instrument is located a t about 71 per cent of the full-scale arc. This point is marked 0 on the vu scale and deviations from this point are marked in vu to +3 and to -20. The same point is marked 100 on the other scale which is graduated proportiorlately to voltage from 0 to 100.
3. Dynamic Characteristics
If a 1000-cycle voltage of such amplitude as t o give a steady reading of 100 on the voltage scale is suddenly applied, the pointer should reach 99 in 0.3 second and should then overswing the 100 point by a t least 1.0 and not more than 1.5 per cent.
4. Response versus Frequency The sensitivity of the volume-indicator instrument
shall not depart from tha t a t 1000 cycles by more than 0.2 decibel between 35 and 10,000 cycles per second nor more than 0.5 decibel between 25 and 16,000 cycles per second.
5. Calibration
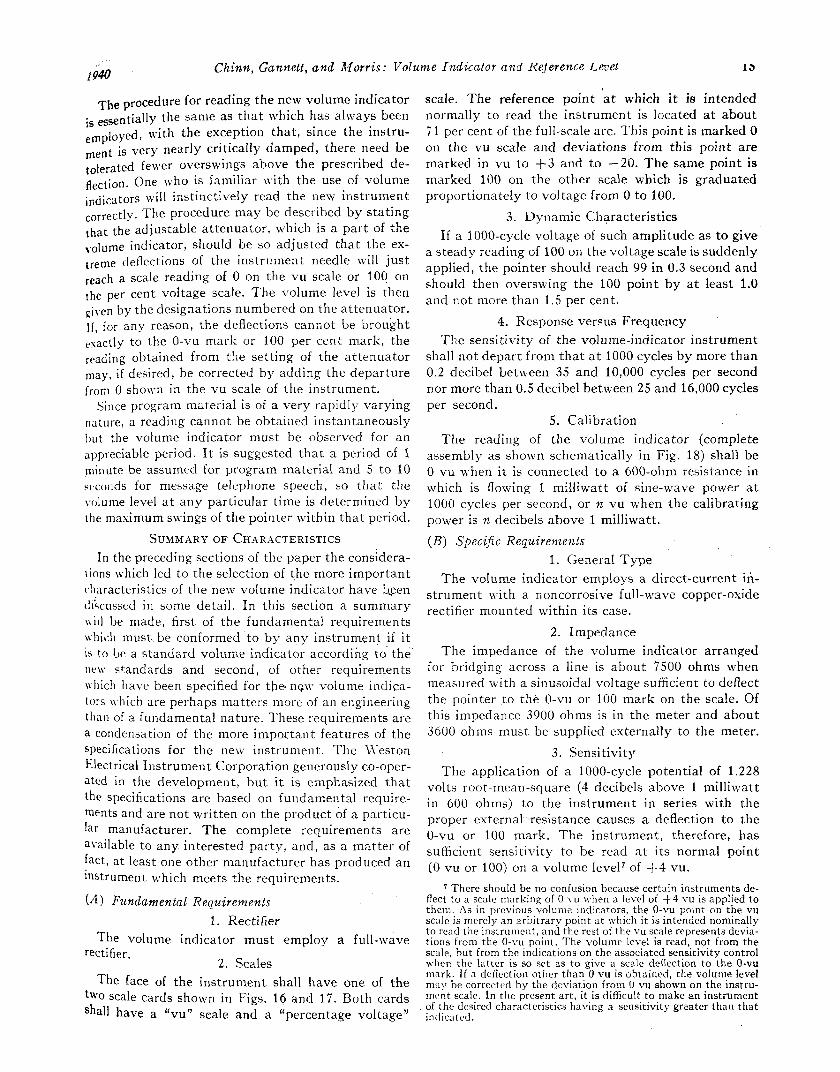
The reading of the volume indicator (complete assembly as shown schematically in Fig. 18) shall be 0 vu when i t is connected to a 600-ohm resistance in which is flowing 1 milliwatt of sine-wave power a t 1000 cycles per second, or n vu when the calibrating power is n decibels above 1 milliwatt.
( B ) Specific Requirements 1. General Type
The volume indicator employs a direct-current in- strument with a noncorrosive full-wave copper-oxide rectifier mounted within its case.
2. Impedance The impedance of the volume indicator arranged
for bridging across a line is about 7500 ohms when measured with a sinusoidal voltage sufficient to deflect the pointer ,to the 0-vu or 100 mark on the scale. Of this impedance 3900 ohms is in the meter and about 3600 ohms must be supplied externally to the meter.
3. Sensitivity The application of a 1000-cycle potential of 1.228
volts root-mean-square (4 decibels above 1 milliwatt in 600 ohms) to the instrument in series with the proper external -resistance causes a deflection to the 0-vu or 100 mark. The instrument, therefore, has sufficient sensitivity to be read a t its normal point (0 vu or 100) on a volume level7 of +4 vu.
7 There should be no confusion because certain instruments de- flect t o a scale marking of 0 vu when a level of +4 vu is applied to them. As in previous volume indicators, the 0-vu point on the vu scale is merely a n arbitrary point a t which it is intended nominally to rend the instrument, and the rest of the vu scale represents devia- tions from the 0-vu point. The volun~e lcvel is read, not from the scale, but from the indications on the associated sensitivity control when the latter is so set a s t o give a scale deflection t o the 0-vu mark. If a defIection other than 0 vu is obtained, the volume level may be corrected by the deviation from O vu shown on the instru- InPnt scale. In tile present ar t , it is difficult t o make an instrument of the desired characteristics having a sensitivity greater than that indicated.
16 Proceedings of the I.R.E.
4. Harmonic Distortion
The harmonic distortion introduced in a 600-ohm circuit by bridging the volume indicator across i t is less than that equivalent t o 0.2 per cent (root-mean- square).
5. Overload
The instrument is capable of withstanding, without injury or effect on calibration, peaks of 10 times the voltage equivalent to a deflection to the 0-vu or 100 mark for 0.5 second and a continuous overload of 5 times the same voltage.
6 . Color of Scale
The color of the scale card, expressed according to the hlunsel18 system of color identification is 2.93 Y (9.1814.61).
u Y 0 3 <
COO?LR O A I D i
R F C i l i i E R A N D
INSTilUMLNI
A B O U T 3900-> , 3900 OHM ATILNUITDRL~OO- 3900-7
A. H1C.H IMPEDANCE A P P A h i l M L N T
R E C T r l E R
INSTRUULPIT
LOO - ABOUT 3 9 0 V J ,960 OHU ATTFNUATOR 3900 -1
1900-
0 . L O W IMPEDANCE APWANCLMLWT.
Fig. 18-Circuits for new 1-olume indicator.
7. Presence of hlagnetic hlaterial . . The presence of magnetic material near the move-
ments of the instruments as now made will affect their calibrations and dynamic characteristics. This ' is because it has been necessary to employ more powei- ful magnets than usually required for such instru- ments to obtain th6 desired sensitivity and dynamic characteristics, and any diversion of flux to near-by magnetic objects effectively weakens the useful mag- netic field beyond the point where these characteris- tics can be met. The instruments should not, therefore, be mounted on steel panels. (The effect is only slight if they are mounted on 1/16-inch panels with the mounting hole cut away as far as possible without extending beyond the instrument area.)
8. Temperature Effects In the instruments now available, the deviation of
the sensitivity with temperature is less than 0.1 decibel for temperatures between 50 degrees Fahren- heit and 120 degrees Fahrenheit, and is less than 0.5 decibel for temperatures as low as 32 degrees Fahren- heit.
DESCRIPTION OF CIRCUITS The new instrument by itself does not constitute a
complete volume indicator but must have certain
llMunsell Book of Color," Munsell Color Company, Baltimore, Maryland, (1929).
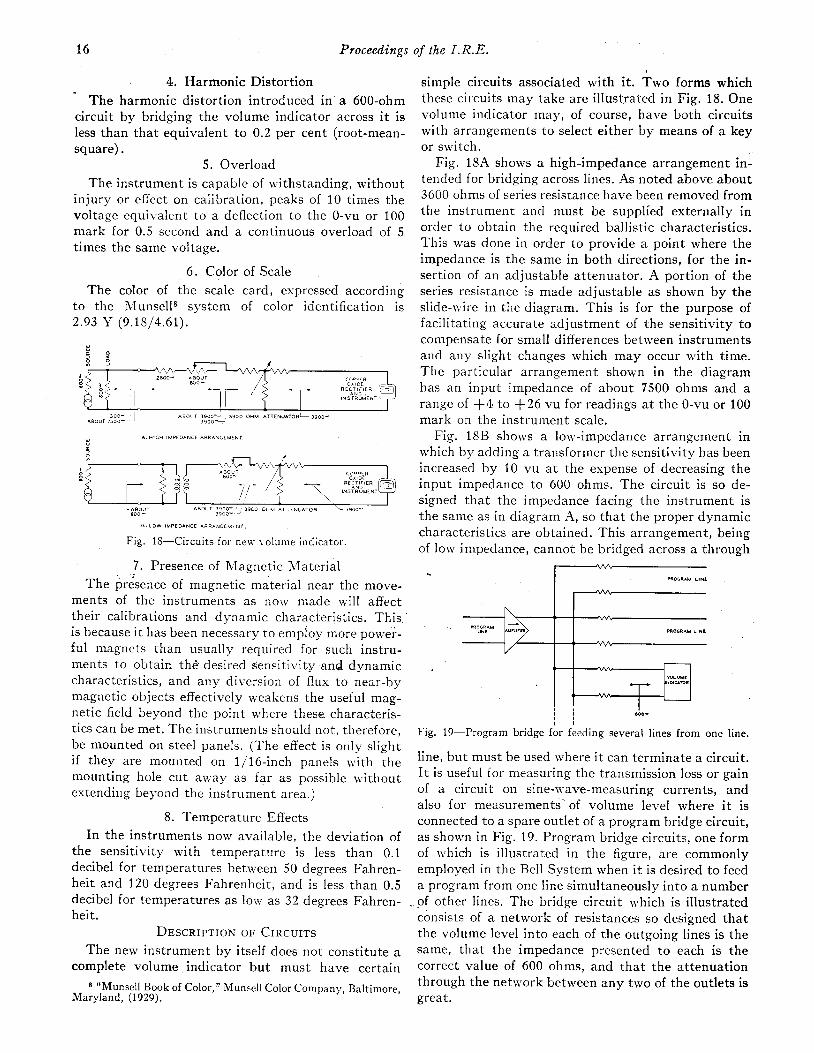
simple circuits associated with it. Two forms which these circuits may take are illustrated in Fig. 18. One volume indicator may, of course, have both circuits with arrangements to select either by means of a key or switch.
Fig. 18A shouls a high-impedance arrangement in- tended for bridging across lines. As noted above about 3600 ohms of series resistance have been removed from the instrument and must be supplied externally in order to obtain the required ballistic characteristics. This was done in order to provide a point where the impedance is the same in both directions, for the in- sertion of an adjustable attenuator. A portion of the series resistance is made adjustable as shown by the slide-wire in the diagram. This is for the purpose of facilitating accurate adjustment of the sensitivity t o compensate for small differences between instruments and any slight changes which may occur with time. The particular arrangement shown in the diagram has an input impedance of about 7500 ohms and a range of +4 to f 2 6 vu for readings a t the 0-vu or 100 mark on the instrument scale.
Fig. 18B shows a low-impedance arrangement in which by adding a transformer the sensitivity has been increased by 10 vu a t the expense of decreasing the input impedance to 600 ohms. The circuit is so de- signed that the impedance facing the instrument is the same as in diagram A, so that the proper dynamic characteristics are obtained. This arrangement, being of low impedance, cannot be bridged across a through
i i Fig. 19-Program bridge for feeding several lines from one line.
line, but must be used where i t can terminate a circuit. I t is useful for measuring the transmission loss or gain of a circuit on sine-wave-measuring currents, and also for measurements' of volume level where i t is connected to a spare outlet of a program bridge circuit, as shown in Fig. 19. Program bridge circuits, one form of which is illustrated in the figure, are commonly employed in the Bell System when i t is desired to feed a program from one line simultaneously into a number . of other lines. The bridge circuit which is illustrated
consists of a network of resistances so designed that the volume level into each of the outgoing lines is the same, that the impedance presented to each is the correct value of 600 ohms, and tha t the attenuation through the network between any two of the outlets is great.

.L\ picture of a volume indicator which is provided \,.ith both of the circuits S ~ O \ V I I in Fig. 18 is illustrated in I:Ig. 20.
Fig. 21 shons a group of new standard volume indicators installed in a network key station.
Fig. 20-751B xolunlc indicator equipped w ~ t h new standard ~nstrurnent ha\ lng scale A.
paper has described a new volume indicator which is inexpensive and \\hose characteristics are r}lought to represent a good practical compromise for ,, general-purpose instrument of this kind. I t has been , ommented upon favorably by all \\ho have had any t,\perience with it. I t has been adopted as standard by thc tuo largest broadcast companies and the Bell stern, and i t is hoped that other users of ~ o l u m e ~i~dicators will be sufficiently impressed by the merits of the new instrument and by the desirability of \t,indardization in this field to join in its adoption. '1 he H e \ \ standards are being submitted to the stand- . rds committees of the various national organizations iGlr dtloption.
Fig. 21-Xew standard volun~e indicators installed a t a network key station.
ACKNOTVLEDGMENT Illany people contributed to the development which
has been described. In particular the authors wish to express their appreciation to RIessrs. Robert A. Brad- ley of the Columbia Broadcasting System, George M. Nixon of the National Broadcasting Company, and S. Brand and Iden Kerney of the Bell Telephone Lab- oratories, for their important share in the work, and to the Weston Electrical Instrument Corporation for its valued co-operation.