Embed Size (px)
Citation preview

A new multidimensional ranking of shadow economy for EU countries
Gheorghe ZAMAN1,
Zizi GOSCHIN2
Abstract. Shadow economy is a perennial, multifaceted and hard to gauge phenomenon that affects to some degree all countries. Scientific research needs to develop rigorous and internationally comparable metrics of shadow economy in order to avoid possible misunderstanding, exaggeration and sometimes bad intentions concerning the assessment of shadow economy, corruption and fiscal fraud. Considering the limitations of single shadow economy indicators we propose a more comprehensive measurement based on a new synthetic shadow economy index (SSEI). This index encompasses three relevant indicators, namely the size of shadow economy per capita, the shadow economy relative to GDP and the countries’ shares in EU total shadow economy. The analysis covered the period 1999 to 2012 and the results indicated that some of the developed EU countries, rather than the new members, are on top positions of the shadow economy. We also found a sigma convergence trend in shadow economy size and intensity among EU-28 countries over 1999-2012. The main conclusion of our paper is that the analyses of shadow economy should be based on a set of relevant indicators, instead of a single indicator.
Keywords: shadow economy metrics, synthetic index, EU.
JEL Classification: D33, E65, H26, P44.
1 Gheorghe ZAMAN, Professor, Corresponding Member of the Romanian Academy of Science,
Director, Institute of National Economy, Bucharest, Romania, E-mail: [email protected] 2 Zizi GOSCHIN (Corresponding author), Professor, Department of Statistics and Econometrics,
Bucharest University of Economic Studies, Senior Scientific Researcher, Institute of National Economy, Romania, E-mail: [email protected]
A new multidimensional ranking of shadow economy for EU countries
15
Introduction The shadow economy (SE), with its various notional variants1, is a perennial research area for both developed and developing countries, owing to several reasons.
Firstly, phenomena of corruption and tax evasion are permanent and determine directly the dynamics and structure of the shadow economy, for any country, regardless of its economic and social development level (Dreher and Schneider, 2006; Buehn and Schneider, 2007, 2012). Corruption and shadow economy, as reciprocal enhancers, have always existed, in different sizes, shapes and intensities, in all economies and the policies, instruments and methods aiming to "eradicate" them are merely ideal wishes. Theoretical attempts, as well as applied and practical measures might at best reduce their size to acceptable or controlled levels, in other words to "optimal" levels in terms of efficient functioning of the national and international economic systems.
Secondly, the size of the shadow economy, as measured by specialized institutions of the EU, OECD, UN or at national level, tended to increase in time, despite shadow economy incrimination and many programs and action plans aiming to combat it, especially on the medium and long term. This is raising many questions about the “inevitability” of such a trend, as well as its magnitude as an indicator per se, or related to other relevant economic indicators at macro-, meso- and micro-levels.
Thirdly, SE is usually considered as a phenomenon generating only negative effects, such as evasion, fiscal fraud, lack of social and health insurance, inefficient activities in public administration sector, lack of transparency, social responsibility, shortcomings in private sector, unfair competition, unfounded and mistaken decisions. In addition, some specialists reveal a series of good effects of SE that might offer alternative solutions for some urgent problems related to employment, social self-protection, consumption and investment in registered economy (Olaru, 2012; Singh et al, 2012; Koba, 2013). For instance, an American study estimated that 2 trillion $ from the underground economy contributed to the recovery of USA economy after the crisis (Koba, 2013). According to some estimations at least two-thirds of the income earned in the shadow economy is immediately spent in the registered economy, where it produces significantly favourable effects (Schneider and Enste, 2000). Positive effects of SE are pointed out especially in the case of corrupt public administrations and bad governance, where public money is misused and behaviour of decision maker is corrupt. Disputes among specialists as regards the relationship between good and bad effects of SE have not conduced so far
1 e.g. informal, underground, unregistered or hidden economy, black market or gray market
economy.
Gheorghe ZAMAN, Zizi GOSCHIN 16
to a more precise (rigorous) assessment of the proportion of each category of effects, since a phenomenon as complex as SE cannot be captured by a single indicator.
Attempts to quantify the shadow economy through statistical indicators and models have made considerable progress in terms of analytical approaches and predictive ability, paying particular attention especially to its determinants, causes and effects, as well as the instruments, policies and mechanisms for stopping and/or combating its different forms of an extreme gravity (Frey and Pommerehne, 1984; Albu, 2007; Elgin and Oztunali, 2012; Schneider et al, 2012). The shadow economy is a complex, interdisciplinary area of research, that often requires the use of international comparisons whose accuracy and relevance can have favourable/unfavourable influence on the decisions of domestic and international business environment, on the evaluation of good or poor governance, on the public and private sectors, on the attractiveness to foreign investors and, finally, on the existence of favourable conditions in terms of stimulating the growth factors, as well as the internal and external competitiveness of countries (La Porta et al, 1999; Torgler and Schneider, 2009; Aruoba, 2010; Elgin et al, 2011; Charles, 2011; Schneider and Teobaldelli, 2012; Buehn, Lessmann, Markwardt, 2013; Elgin and Oztunali, 2013).
The share of the shadow economy in GDP (%) represents the indicator of choice in the literature addressing the size, intensity and negative impact of the shadow economy (Gatti and Honorati, 2008, Taymaz, 2009; Elgin, 2010; Andrei, 2011; Pisica et al, 2012). The majority of studies on SE use this indicator as a panacea for quantitative metrics, failing to take into consideration other important information which can be equally significant. Although shadow economy relative to GDP gives a useful image on the relationship between the formal and informal economy, it is insufficient to draw a comprehensive picture on this complex phenomenon (Koeda and Dabla-Norris, 2008; La Porta and Shleifer, 2008; Manole, 2012; Reikin, 2012).
Not denying the relevance of individual indicators, we consider that only one measure on SE is not enough for understanding such a multi-sided and complex phenomenon, especially in an international comparative context.
Based on the previous theoretical and methodological considerations, in this research we analyse some well known indicators of shadow economy for the period 1999-2012. Since the results are mixed and the hierarchies change completely depending on the indicator used to measure the SE, we introduce a new synthetic index that is more relevant than any single indicator.
A new multidimensional ranking of shadow economy for EU countries
17
Shadow economy – one phenomenon, different indicators In our research, shadow economy refers to those activities (businesses) carried out outside the registration system of public authorities and does not include crime or other illegal activity related to the sale of drugs, money laundering or household activities that by law should not/cannot be recorded by public authorities.
Starting from the theoretical and methodological considerations in previous section, in this research we look first at the most relevant aggregate indicators of the shadow economy using the data available in the literature (Schneider and Kearney, 2013), as well as Eurostat databases. More specifically, we analyzed the shadow economy size and SE relative to GDP and population respectively, for the 28 member states of the EU. By using the ratio of shadow economy to GDP and the size of shadow economy in euro per capita we are trying to establish links between the magnitude of SE and the level of GDP per capita – as a synthetic indicator of socio-economic development.
In order to make comparisons and to establish hierarchies among EU countries, we calculated three relative indicators: SE/capita (in euro per inhabitant), SE relative to GDP (%) and the SE of each country as a percentage share of the total volume of EU-28 total SE. We computed these indicators for every year of the period 1999 to 2012, as well as averages for the entire time span. We finally ranked the countries in descending order, according to the average values over 1999-2012 for each indicator and country, 1 representing the highest value of the indicator and 28 the lowest (Table 1, columns 2, 4 and 6).
The preferred indicator, widely used in international comparisons of shadow economies, is the percentage ratio of SE to GDP. Our data regarding the average magnitude of SE to GDP (%) over the period 1999-2012 (table 1, col. 3) reveal that the EU new member countries, except for Czech Republic and Slovakia, rank on top positions. Bulgaria, Croatia, Romania, Lithuania, Estonia, Latvia, Cyprus, Malta, Poland, Slovenia and Hungary have a relatively lower level of economic development (as captured by GDP per capita) and much higher average percentage share of SE to GDP compared to developed EU countries. But when we look at another indicator, the share of each country’s SE in EU-28, we find that the 12 newest member countries (excluding Poland) together accounted for only 5 per cent of total volume of SE in EU-28. On the opposite, EU developed countries have relatively small levels of SE relative to GDP, what indicates favourable positions, but this is in contradiction with their large shares in total underground economy of EU-28 (Table 1).
Gheorghe ZAMAN, Zizi GOSCHIN 18
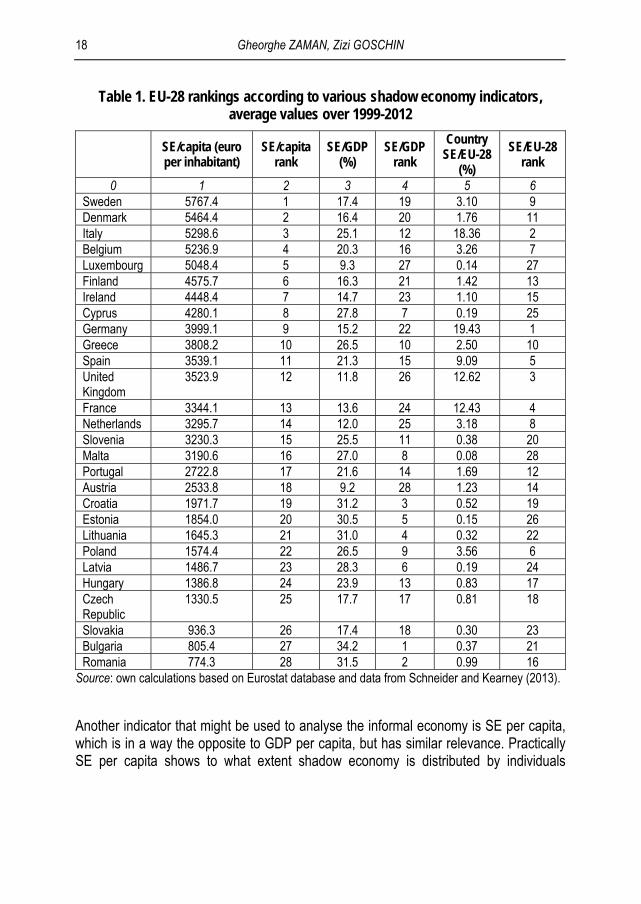
Table 1. EU-28 rankings according to various shadow economy indicators, average values over 1999-2012
SE/capita (euro per inhabitant)
SE/capita rank
SE/GDP (%)
SE/GDP rank
Country SE/EU-28
(%)
SE/EU-28 rank
0 1 2 3 4 5 6 Sweden 5767.4 1 17.4 19 3.10 9 Denmark 5464.4 2 16.4 20 1.76 11 Italy 5298.6 3 25.1 12 18.36 2 Belgium 5236.9 4 20.3 16 3.26 7 Luxembourg 5048.4 5 9.3 27 0.14 27 Finland 4575.7 6 16.3 21 1.42 13 Ireland 4448.4 7 14.7 23 1.10 15 Cyprus 4280.1 8 27.8 7 0.19 25 Germany 3999.1 9 15.2 22 19.43 1 Greece 3808.2 10 26.5 10 2.50 10 Spain 3539.1 11 21.3 15 9.09 5 United Kingdom
3523.9 12 11.8 26 12.62 3
France 3344.1 13 13.6 24 12.43 4 Netherlands 3295.7 14 12.0 25 3.18 8 Slovenia 3230.3 15 25.5 11 0.38 20 Malta 3190.6 16 27.0 8 0.08 28 Portugal 2722.8 17 21.6 14 1.69 12 Austria 2533.8 18 9.2 28 1.23 14 Croatia 1971.7 19 31.2 3 0.52 19 Estonia 1854.0 20 30.5 5 0.15 26 Lithuania 1645.3 21 31.0 4 0.32 22 Poland 1574.4 22 26.5 9 3.56 6 Latvia 1486.7 23 28.3 6 0.19 24 Hungary 1386.8 24 23.9 13 0.83 17 Czech Republic
1330.5 25 17.7 17 0.81 18
Slovakia 936.3 26 17.4 18 0.30 23 Bulgaria 805.4 27 34.2 1 0.37 21 Romania 774.3 28 31.5 2 0.99 16
Source: own calculations based on Eurostat database and data from Schneider and Kearney (2013).
Another indicator that might be used to analyse the informal economy is SE per capita, which is in a way the opposite to GDP per capita, but has similar relevance. Practically SE per capita shows to what extent shadow economy is distributed by individuals
A new multidimensional ranking of shadow economy for EU countries
19
contributing more or less to GDP and SE creation. The highest the SE per capita level, the more unfavourable is the position of a certain country from the black market and corruption perspective. This indicator can shed lights on the degree to which individuals could be affected by SE’s negative impacts in both domestic and external context.
We computed the annual SE per capita in euros for the period 1999 to 2012 for EU countries when ranked them decreasingly according to the average level of this indicator over the whole period (table 1, col. 1 and 2). The resulting hierarchy is completely opposed to the previous one. As it results from the data, Sweden, Denmark, Italy, Belgium and Luxembourg have the highest SE/capita Among the European Union countries, all exceeding 5000 euro of SE per inhabitant (Table 1, col.1), while Slovakia, Bulgaria and Romania are placed below the 1000 euro limit. Comparing the extremes, there is a ratio of 7.45 to one between Sweden and Romania. In general, old EU countries are above the EU average of SE per capita, while the new members are placed below the average.
When taking into consideration the magnitude of SE in each country as a percentage share of the total, it turns out that Germany, Italy, United Kingdom and France are the countries with the largest contribution (above 12% each) to the total SE of the EU-28 countries (Table 1, col. 5). These top 4 countries together own almost 63 per cent from the total amount of SE of EU-28, while the rest of 24 countries have the remaining 37 per cent. This indicator is important for the analysis of spatial distribution of SE, indicating the zones of highest concentration within EU. It reflects the absolute magnitude of SE, the strength of which is multiplied by propagated effects in an integrated or globalized economy.
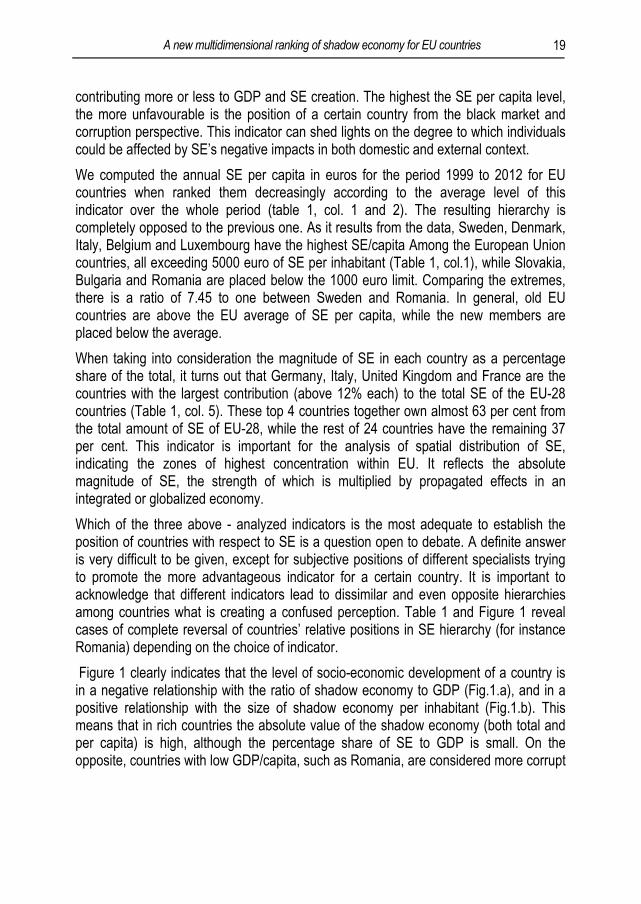
Which of the three above - analyzed indicators is the most adequate to establish the position of countries with respect to SE is a question open to debate. A definite answer is very difficult to be given, except for subjective positions of different specialists trying to promote the more advantageous indicator for a certain country. It is important to acknowledge that different indicators lead to dissimilar and even opposite hierarchies among countries what is creating a confused perception. Table 1 and Figure 1 reveal cases of complete reversal of countries’ relative positions in SE hierarchy (for instance Romania) depending on the choice of indicator.
Figure 1 clearly indicates that the level of socio-economic development of a country is in a negative relationship with the ratio of shadow economy to GDP (Fig.1.a), and in a positive relationship with the size of shadow economy per inhabitant (Fig.1.b). This means that in rich countries the absolute value of the shadow economy (both total and per capita) is high, although the percentage share of SE to GDP is small. On the opposite, countries with low GDP/capita, such as Romania, are considered more corrupt
Gheorghe ZAMAN, Zizi GOSCHIN 20
because the underground economy is large relative to GDP, but the actual level of SE per capita is small.
Figure 1. Shadow economy relative to GDP
(a) and shadow economy per capita (b) in relation to the development level for EU countries, average values over 1999-2012
(a) (b)
Source: own calculation
In our opinion, a single indicator may be misleading and several indicators should be considered when analysing the SE size, dynamics and impact in both national and international context. Unfortunately, the literature on this topic is scarce (e.g. Zaman and Goschin, 2013).
A new synthetic index of shadow economy. Methodology and empirical results It is difficult to draw a clear picture of the shadow economy by choosing only one indicator considered as the most relevant. Table 1 is presenting the equivocal situation as regards the SE of EU countries in the context of their international comparison. For instance, Romania occupies a bad position (rank 2) for SE relative to GDP, but has a very good rank (28) for SE per capita and a medium place (16) in the case of share of

A new multidimensional ranking of shadow economy for EU countries
21
country’s SE in total SE. The same confused situation can be noticed practically for each country, irrespective of its level of development. Such an ambiguous situation could be manipulated in order to promote either a good or an unfavourable image of a certain country.
This is the reason why we propose a method by which the three previously discussed indicators are combined with the aim of determining one unequivocal synthetic index. The computation of the shadow economy synthetic index requires the aggregation of heterogeneous data sets on these three indicators, having different units of measurement and relevance. Compatibility among the respective indicators was achieved by a normalization procedure. More specifically, the values of each variable, for each country and year, were converted using the formula below:
)min()max()min(
jtjt
jtijtijt xx
xxy
, (1)
where:
yijt - the normalized value of variable j for country i in year t; i = 281, , j = 31, t = 1999-2012
xijt - the original data on variable j, country i and year t.
Since high values on any shadow economy indicator are unfavourable, the above transformation allocates a normalized score ranging from 0 (best position) to 1 (worst) for each of the EU 28 counties and for all three variables.
The synthetic shadow economy index (SSEI) will be further calculated as a weighted average, the weights pj for each indicator j being established according to its importance.
,100
3
1
j
jijt
it
pySSEI (2)
where: i-country; j-variable; t-time; i = 281, , j = 31, , t = 1999-2012.
The weights allotted for the three shadow economy indicators are as follows: the shadow economy ratio to GDP gets 25%; the size of shadow economy in euro/capita is considered the most relevant and has a share of 50%; the share of the country’s
Gheorghe ZAMAN, Zizi GOSCHIN 22
shadow economy in total EU-28 represents 25%. Our choices on the weights of SE indicators would be different if additional indicators are included. The weights should be determined by taking into consideration the individual relevance and relationships between SE indicators, both in relative and absolute terms, the objectives of research, etc. We established the highest share of 50% for “shadow economy per capita” based on our perception of the higher relevance and significance of SE indicators expressed in absolute terms as compared with those in relative ones.
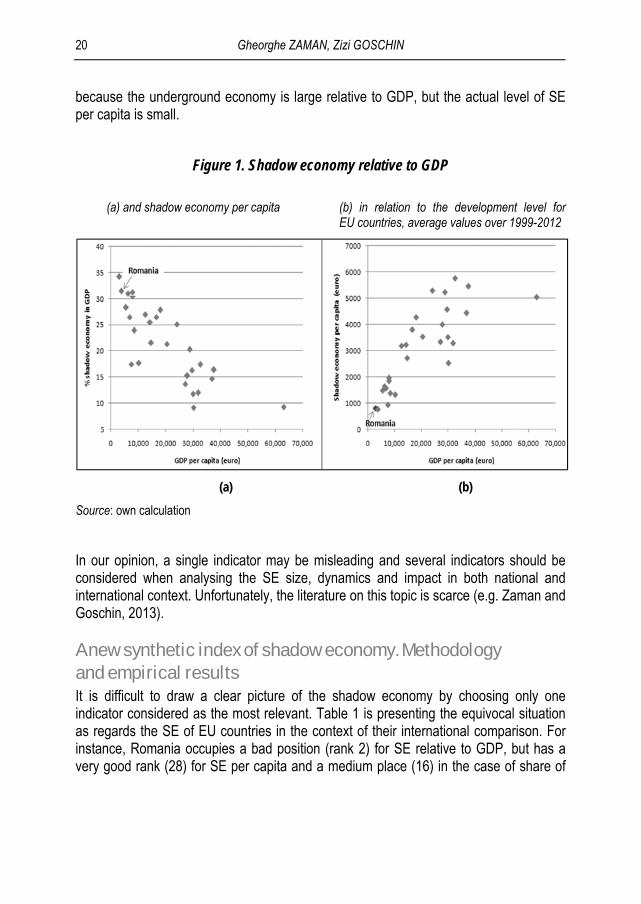
We calculated the SE synthetic index for all EU-28 countries, annually and as time averages, and ranked the countries in decreasing order of magnitude, the highest values of SSEI indicating the worst positions (Table 2). Considering the computation methodology, a country would get the worst score of 1 only if it had the highest value on all SE indicators. Similarly, a country could achieve the best score of 0 only by having the smallest value on each indicator included in SSEI. Since no country recorded such an extreme situation in the period under consideration, the actual values are ranging from 0.10 (Slovakia-best place) and 0.84 (Italy-worst place).
Data in Table 2 show that the most unfavourable positions, i.e. the highest values of SSEI, are hold by Italy, followed at large distance by Germany, Sweden, Belgium and Denmark. According to this index, the old, more developed EU countries have bigger shadow economies compared to the new, less developed members. The last ranks, and consequently the best positions within EU-28, are occupied by Slovakia, Czech Republic, Austria, Hungary and Romania.
Table 2: EU-28 rankings according to the synthetic shadow economy index (SSEI)
1999-2012 SSEI1999-2007
SSEI 2008-2012 SSEI Rank % change
0 1 2 3 4 5 Italy 0.84 1 -15.70 0.889 0.760 Germany 0.63 2 2.67 0.623 0.653 Sweden 0.62 3 -1.15 0.626 0.608 Belgium 0.60 4 -11.01 0.615 0.564 Denmark 0.56 5 -17.73 0.586 0.511 Cyprus 0.54 6 3.44 0.528 0.559 Spain 0.51 7 0.55 0.519 0.502 Greece 0.51 8 -3.09 0.502 0.518 Finland 0.47 9 -7.77 0.480 0.444 United Kingdom 0.46 10 -1.95 0.467 0.452 France 0.46 11 -23.63 0.493 0.394 Ireland 0.43 12 0.99 0.450 0.404 Luxembourg 0.43 13 6.80 0.422 0.444 Malta 0.42 14 14.82 0.405 0.453 Slovenia 0.41 15 15.29 0.393 0.453
A new multidimensional ranking of shadow economy for EU countries
23
1999-2012 SSEI1999-2007
SSEI 2008-2012 SSEI Rank % change
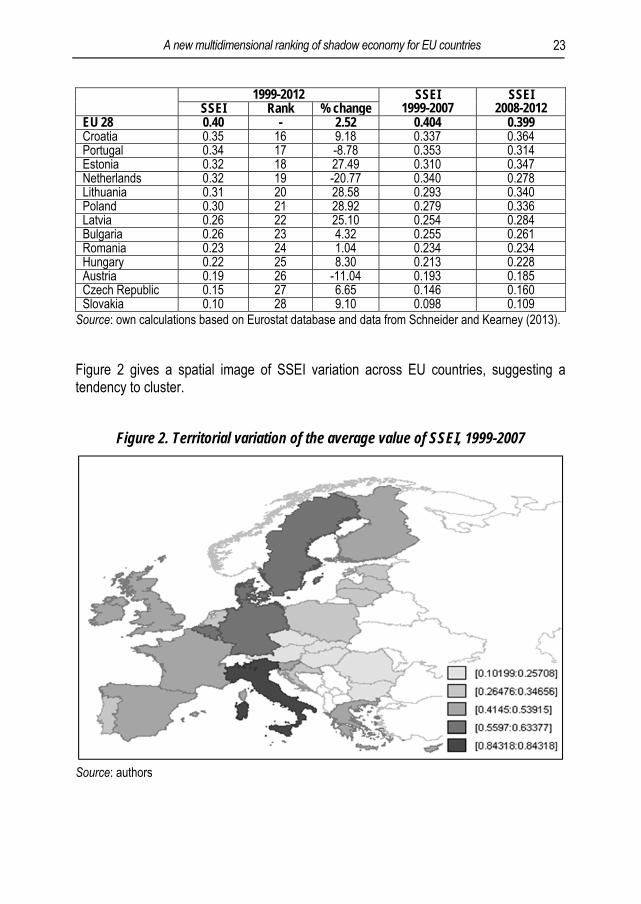
EU 28 0.40 - 2.52 0.404 0.399 Croatia 0.35 16 9.18 0.337 0.364 Portugal 0.34 17 -8.78 0.353 0.314 Estonia 0.32 18 27.49 0.310 0.347 Netherlands 0.32 19 -20.77 0.340 0.278 Lithuania 0.31 20 28.58 0.293 0.340 Poland 0.30 21 28.92 0.279 0.336 Latvia 0.26 22 25.10 0.254 0.284 Bulgaria 0.26 23 4.32 0.255 0.261 Romania 0.23 24 1.04 0.234 0.234 Hungary 0.22 25 8.30 0.213 0.228 Austria 0.19 26 -11.04 0.193 0.185 Czech Republic 0.15 27 6.65 0.146 0.160 Slovakia 0.10 28 9.10 0.098 0.109
Source: own calculations based on Eurostat database and data from Schneider and Kearney (2013).
Figure 2 gives a spatial image of SSEI variation across EU countries, suggesting a tendency to cluster.
Figure 2. Territorial variation of the average value of SSEI, 1999-2007
Source: authors
Gheorghe ZAMAN, Zizi GOSCHIN 24
In order to highlight the size and intensity of SE prior to the global crisis, we also calculated the average value of SSEI over 1999-2007 (Table 2, col.4). When we compare it with the averages for 2008-2012 period we found significant decrease in SSEI for most countries. Additional data on the evolution of the shadow economy during the recent crisis reveal that at the peak of the international economic and financial crisis (2008-2010) in most countries SE slightly decreased, mainly based on the reduction of GDP and economic activities, in general. However, in 2011, in the major part of EU-28 countries SE increased as compared with the previous year, so that the total volume of SE for all analysed countries has increased too (Schneider, 2013).
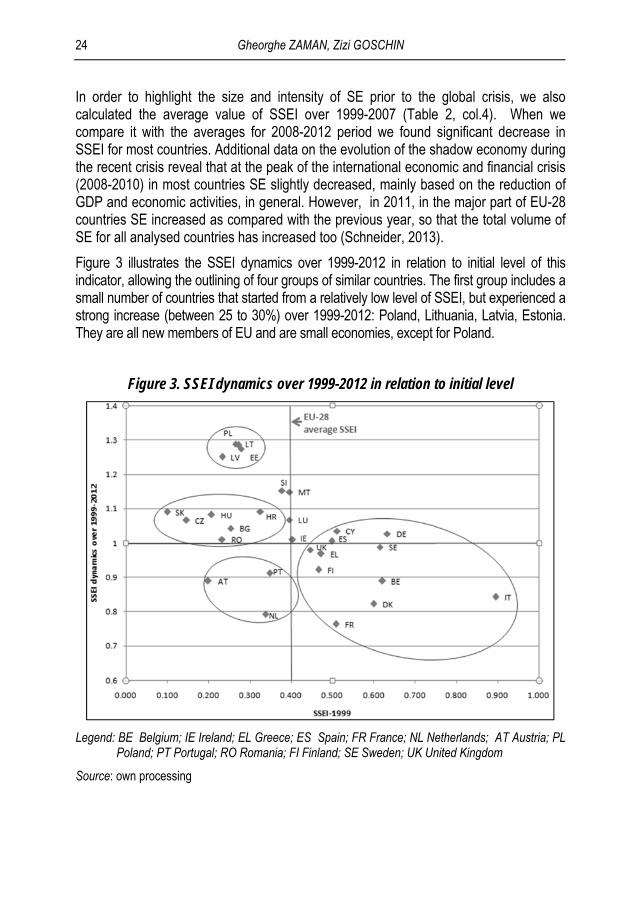
Figure 3 illustrates the SSEI dynamics over 1999-2012 in relation to initial level of this indicator, allowing the outlining of four groups of similar countries. The first group includes a small number of countries that started from a relatively low level of SSEI, but experienced a strong increase (between 25 to 30%) over 1999-2012: Poland, Lithuania, Latvia, Estonia. They are all new members of EU and are small economies, except for Poland.
Figure 3. SSEI dynamics over 1999-2012 in relation to initial level
Legend: BE Belgium; IE Ireland; EL Greece; ES Spain; FR France; NL Netherlands; AT Austria; PL
Poland; PT Portugal; RO Romania; FI Finland; SE Sweden; UK United Kingdom
Source: own processing
A new multidimensional ranking of shadow economy for EU countries
25
The second group also includes only new EU countries that are placed under the EU-28 average, but their SSEI dynamics were low, ranging from +1% in Romania to +9% in Croatia. The first two groups comprise all the EU countries from Central and Eastern Europe. These countries have in common both the relatively low GDP per capita and smaller shadow economies compared to EU-15. Although SSEI increased in all new EU countries, the differences in SSEI dynamics during 1999 to 2012 are quite large, varying from only +1% increase in Romania to a maximum of +30% in Poland.
The third group comprises Austria, Portugal and Netherlands, the best positioned old EU countries, as they have SSEI levels under the average and in decline. From the shadow economy perspective, the best place among old EU countries is held by Austria: not only has it had the smallest value of SSEI (0.19) in 1999, but SSEI continued to decrease to 0.177 in 2012.
The final and largest group reunites most of developed EU economies in EU-15; they are all positioned above EU-28 average level of SSEI and share a common downward trend, except for Germany, who recorded a slight increase in the SE indicator. The outlier in this group is Italy, with the highest level of SSEI in all European Union. It is important to note that a large part of labour black market in EU developed countries regards unofficially employed immigrants originating from EU emergent economies.
It is apparent from figure 3 that almost all countries with large shadow economies have been on a downward trend (Italy, Sweden, Belgium, Denmark etc.), while the countries having the lowest SSEI at the beginning of the period under consideration tend to increase the size and intensity of SE (Slovakia, Czech Republic, Hungary etc.). This suggests a possible convergence trend among EU-28 economies.
Is there a convergence trend in shadow economy among EU-28 countries? Since the formal and informal economies are interdependent (Altman, 2008; Davies and Thurlow, 2009; Valodia and Devey, 2011) and EU economies tend to converge at country level (Bongardt et al, 2013), a legitimate question is whether there is convergence in shadow economies as well. There seems to be consensus in the literature that economic opening and high FDI inflows can bring potential benefits to less developed countries such as the new EU members, but the increased interaction with the world economy might also produce less desirable consequences in the SE area.
Previously presented data seem to indicate that EU countries are getting closer in terms of SE size and intensity as measured by the SSEI indicator. In order to test this hypothesis we use a classical measure of convergence introduced by Barro and Sala-i-Martin (1995), namely sigma convergence (σ) defined as the downward trend in

Gheorghe ZAMAN, Zizi GOSCHIN 26
spatial inequalities. Sigma convergence is measured based on the annual coefficient of variation, calculated as the standard deviation of variable y, divided by its average y :
yn
yyn
ii
1
2)(
(3)
We have to compute this indicator in order to assess the dispersion of the synthetic shadow economy index among EU countries in each year. If the coefficient of variation σ tends to decrease over 1999-2012, this is an indication that a sigma convergence process in SE is taking place.
In order to check for the existence of a systematic trend of convergence or divergence we are going to use the following equation:
tt bta , (4)
where t is the time series of sigma annual values and bt is the corresponding trend
line. If an autoregressive process is introduced in the previous regression equation, the result is:
ttt bta 1 (5)
which allows testing non-stationarity1 of σ time series based on Augmented Dickey-Fuller (ADF) test (Dickey and Fuller, 1981).
The annual values computed for the coefficient of variation in SSEI clearly indicate a strong downward trend for the period 1999 to 2011, followed by a very slight increase in 2012 (Figure 3). This seems to support the convergence hypothesis.
1 non-stationary time series follows an autoregressive process with ρ = 1 indicating unit root.

A new multidimensional ranking of shadow economy for EU countries
27
Figure 3. Sigma convergence among EU countries based on SSEI
Source: own processing
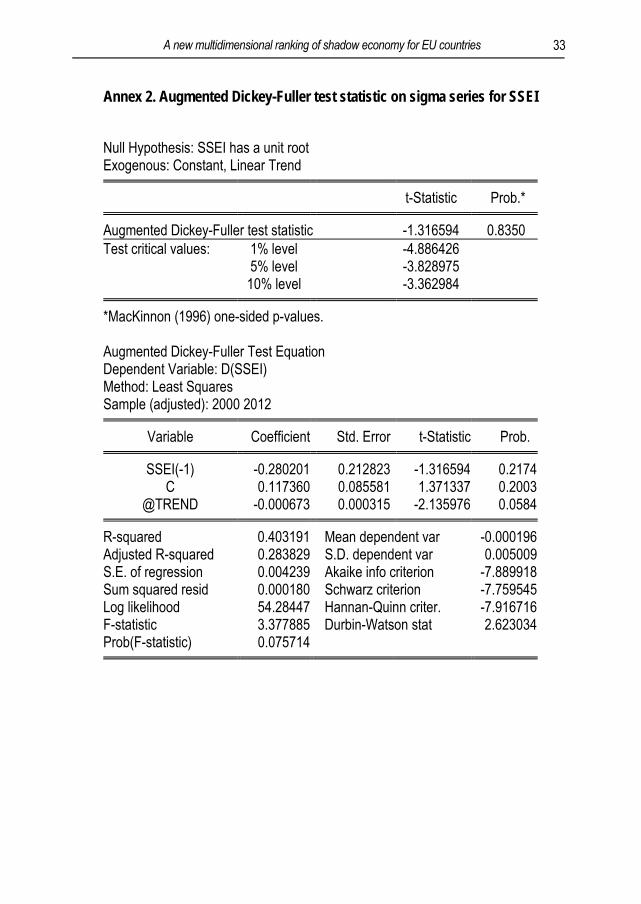
Based on the value of Augmented Dickey-Fuller test statistic (Appendix 2) we cannot reject the unit root hypothesis for sigma values computed for SSEI. The regression equation of the test shows that sigma series has a significant negative trend over 1999-2012, suggesting convergence in shadow economy among EU-28 countries.
Development and shadow economy: a causality analysis Another issue of interest is the causal relationship between the level of development and the size and intensity of shadow economy. We have addressed this topic by applying the Granger causality test in order to determine whether GDP per capita is useful in forecasting the scale of shadow economy (as measured by SSEI) from the perspective of "predictive causality" addressed by this test.
ADF test on GDP per capita and SSEI indicated that these variables have unit roots. Since both series have the same order of integration I(1), we further applied the well-known Johansen test to check for the existence of cointegration and found significant evidence of GDP/cap and SSEI being cointegrated. Cointegration is considered in
Gheorghe ZAMAN, Zizi GOSCHIN 28
literature as an indirect sign of long-run causality. Unfortunately, our data series is not long enough to definitively tell whether or not we have cointegrated series.
Considering that both GDP per capita and SSEI are first order integrated, we further use first-differenced variables in unrestricted VAR models. The results from VAR modelling suggest there is bidirectional short-term causality between GDP per capita and SSEI at 2-year lag. The Granger test indicate that the development level captured by GDP per capita determines (Granger causes) the increase in shadow economy at 3 years lag, while the shadow economy (SSEI) is Granger causal for GDP per capita at 4 years lag, both at low significance levels. Nor these results are entirely reliable, since the two time-series are not stationary and a Toda-Yamamoto procedure (Toda and Yamamoto, 1995) is required. Unfortunately our time-series are too short to allow for the Toda-Yamamoto method to be applied, therefore we are not able to give an accurate answer to the causality issue.
Conclusions and policy recommendations As a complex and long-term phenomenon, the shadow economy needs new methodological tools based on an adequate system of indicators, in an international comparative context. The present paper aimed to introduce a more relevant indicator for shadow economy indicator for international comparisons based on the corroboration of three indicators: shadow economy ratio to GDP, percentage share of shadow economy of each country in the total volume of EU-28 shadow economies and shadow economy per capita. In our opinion these three indicators are reflecting complementary aspects and characteristics of shadow economy. Their separate analysis and comparison across countries can offer only partial or (even worse) false results and conclusions, with potential negative impact on the international image and attractiveness of some countries because a large shadow economy is considered as a negative feature of the well-functioning of a national economy, usually related to corrupt behaviour in the public and private sectors.
The computation of a synthetic index of shadow economy based on a normalization procedure applied to the three above mentioned indicators offered a new and significantly different ranking of EU countries compared to the result of standard classification using only one indicator. It turns out that the contribution of new EU member states, judged both in absolute and relative terms, is much lower than for developed EU members which occupy the top places in the shadow economy hierarchy. On the other hand, our synthetic index of shadow economy points to few EU developed countries which are better positioned. According to our calculations, the major part of the shadow economy in absolute terms, specifically about 63% of EU-28 total value, is located in only four developed countries. This biased distribution has to be taken into
A new multidimensional ranking of shadow economy for EU countries
29
account when countries are cooperating to the aim of shadow economy shrinking. We tested this new index both during economic growth and recession, as the analysis covers a larger time span. We also found a sigma convergence trend in shadow economy size and intensity among EU-28 countries over 1999-2012.
Based on our results on shadow economy international comparisons, a series of conclusions and policy recommendation emerged:
shadow economy represents a complex phenomenon with both negative and positive effects, especially under the economic crisis circumstances which oblige more workers to seek for means of survival in the informal sector of labor market;
means for reducing shadow economy are directly related to good governance; mechanisms for fighting corruption, fiscal evasion and shadow economy have to be differentiated among countries and sectors depending on their size, urgency and considering the aim of sustainable economic, social and environmental development;
fighting shadow economy has to be prioritized by combining proactive policies to increase employment with austerity measures, by reducing corruption, bureaucracy and over-regulation, and by redesigning critical points of legal framework.
As an important conclusion of this study, we point out that most of the developed EU countries, rather than the new members, are on the top positions of the new shadow economy synthetic index. We also stress that, in our opinion, there is no panacea - indicator for measuring complex phenomena with sizeable impact on short, medium and long term, at national and international levels. Although this new index is not solving all the problems of the existing statistics, by encompassing several dimensions of the SE, it provides a more appropriate instrument for international comparisons than the standard “share of the shadow economy in GDP”. Moreover, the use of differentiated shares for the individual indicators that are included in the index allows for flexibility, especially useful in regional analyses.
Our study leaves for further research several topics such as: assessment of positive effects of shadow economy on different time horizons; a more in-depth analysis of shadow economy causality, depending on the development level of different countries; optimal level of SE for different countries, economic sectors or income groups of population; moral and ethical aspects of SE in terms of Pareto, Kaldor-Hicks optimality. Equally important are the analysis of the relationships between SE growth and increasing taxation burdens, social security contribution, corruption and public regulation.
Gheorghe ZAMAN, Zizi GOSCHIN 30
References Albu, L., 2007, Estimating the Size of Underground Economy in Romania, in Romanian Journal of
Economic Forecast, Working Papers of The Institute for Economic Forecasting, 070601. Altman, M.2008 Formal-informal economy linkages, Human Sciences Research Council (HSRC), Pretoria Andrei, T., 2011, Relations de causalité entre l`economie souterraine et les variables macroéconomiques:
application sur la Roumanie, Revista Română de Statistică, nr. 3, 2011, p. 86 – 100. Aruoba, S.B., 2010, Informal Sector, Government Policy and Institutions, 2010 Meeting Papers 324,
Society for Economic Dynamics. Barro, R. and Sala- i-Martin, X., 1995. Economic Growth, New York: McGraw-Hill. Bongardt, A., Torres, F., Hefeker, C., Wunsch, P., Hermann, P. 2013, Convergence in the EU, Inter-
economics, Vol 48, No 2 Buehn, A. and F. Schneider (2007). Shadow Economies and Corruption All Over the World: Revised
Estimates for 120 Countries. Economics: The Open-Access, Open-Assessment E-Journal, Vol. 1, 2007-9 (Version 2), http://www.economics-ejournal.org/economics/journalarticles/2007-9
Buehn, A. and Schneider F., 2012, Corruption and the shadow economy: like oil and vinegar, like water and fire?, International Tax and public Finance 19 (1), p. 172-194.
Buehn, A. and Schneider F., 2012, Shadow Economies Around the World: Novel Insights, Accepted Knowledge and New Estimates, International Tax and public Finance 19 (1), p.139-171.
Buehn, A., Lessmann, C. and Markwardt G., 2013, Decentralization and the shadow economy: Oates meets Allingham-Sandmo, Applied Economics, 45(18), p.2567-2578.
Charles, S.W., 2011, Institutional Quality and Economic Growth in Latin America, Global Economy Journal, 10(4).
Davies, Rob and James Thurlow (2009). Formal-informal economy linkages and unemployment in South-Africa. Human Sciences Research Council, Centre for poverty employment and growth.
Dickey, D.A. Fuller, W.A., 1981. Likelihood ratio statistics for autoregressive time series with a unit root, Econometrica, Vol. 49, 1057-1072.
Dreher, A., Schneider F., 2006, Coruption and the Shadow Economy: an Empirical Analysis, CESifo Working Papers Series 1613, CESifo Group Munich.
Drennan, M.P.; Lobo, J.; Strumsky, D. 2004. Unit root tests of sigma convergence across US metropolitan areas, Journal of Economic Geography, No 4, 583-595.
Elgin, C. and Oztunali, O., 2012, Shadow Economies around the World: Model Based Estimates, Working Papers 2012/05, Bogazici University, Department of Economics.
Elgin, C. and Oztunali, O., 2013, Institutions, Informal Economy and Economic Development, Working Papers 2013/03, Bogazici University, Department of Economics.
Elgin, C., 2010, Political Turnover, Taxes and the Shadow Economy, Working Papers 2010/08, Bogazici University, Department of Economics.
Elgin, C., Garcia, M.S., 2011, Public Trust, Taxes and the Informal Sector, Working Papers 2011/04, Bogazici University, Department of Economics.
Frey, B.S., Pommerehne, W., 1984, The Hidden Economy: State And Prospects For Measurement, The Review of Income and Wealth.
Gatti, R., Honorati, M., 2008, Informality among formal firms: firm-level, cross-country evidence on tax compliance and access to credit, Policy Research Working Papers Series 4476, The World Bank.
Hart, K., 2008, Informal Economy, in The New Palgrave Dictionary of Economics, Palgrave Macmillan. Johnson, S., Kaufmann, D. and Zoido-Lobaton, P., 1998, Regulatory Discretion and the Unofficial
Economy, American Economic Review 88, nr.2.
A new multidimensional ranking of shadow economy for EU countries
31
Koba, M., 2013, $2 trillion underground economy aids recovery, USA Today, http://www.usatoday.com/ story/money/business/2013/05/12/2-trillion-dollar-underground-economy-recovery-savior/2144279/
Koeda, J. and Dabla-Norris, E., 2008, Informality and Bank Credit: Evidence from Firm-Level Data, IMF Working Papers 08/94, International Monetary Fund.
La Porta, R., Lopez-de-Silanes, F., Shleifer, A., Vishny, R., 1999, The Quality of Government, Journal of Law, Economics and Organization, nr.15.
La Porta, R., Shleifer, A., 2008, The Unofficial Economy and Economic Development, NBER Working Papers 14520, National Bureau of Economic Research, Inc.
Manole, S.D., 2012, Impactul economiei subterane asupra economiei României, in revista Strategii Manageriale, nr.4 (18), www.strategiimanageriale.ro.
Monfort, P., 2008. Convergence of EU regions. Measures and evolution. Working Papers, No. 1, European Union. Regional Policy.
Olaru, R., 2012, Economia subterană ne ţine … la suprafaţă, www.gds.ro, Curierul Naţional. Paulenco, C., 2012, Economia subterană, o nouă bilă neagră pentru România, www.money.ro. Pisica, S. et all, 2012, Piaţa muncii între formal şi informal, Editura Expert, 173p. Reikin, V., 2012, Determinants of Shadow Economy. Functioning and Distributing, Business Inform, 11:
25-29. Schneider F., Teobaldelli, D., 2012, Beyond the Veil of Ignorance: The Influence of Direct Democracy on
the Shadow Economy, CESifo Working Papers Series 3749, CESifo Group Munich. Schneider, F. and Kearney, A.T. (2011) The shadow economy in Europe – 2011, Johannes Kepler
University, Linz, Austria. Schneider, F. and Kearney, A.T. (2013) The shadow economy in Europe - 2013, Johannes Kepler
University, Linz, Austria. Schneider, F., Andreas Buehn, Claudio E. Montenegro, 2010, Shadow Economies All over the World. New
Estimates for 162 Countries from 1999 to 2007, World Bank, Policy Research Working Paper 5356,http://wwwds.worldbank.org/servlet/WDSContentServer/WDSP/IB/2010/10/14/000158349_20101014160704/Rendered/PDF/WPS5356.pdf.
Schneider, Fr., Buehn, A., Montenegro, C. E. (2010) New Estimates for the Shadow Economies all over the World, International Economic Journal, 24: 4, 443-461.
Schneider, Fr., Enste D., 2000, Shadow Economy Around the World: Size, Causes and Consequences, IMF Working Paper, WP/00/26, 57 p.
Singh, A., Jain-Chandra S., Mohommad, A., 2012, Inclusive Growth, Institutions and the Underground Economy, IMF Working Papers 12/47, International Monetary Fund.
Taymaz, E., 2009, Informality and Productivity: Productivity Differentials between Formal and Informal Firms in Turkey, ERC Working Papers 0901, ERC Economic Research Center, Middle East Technical University.
Toda, H.Y. and T. Yamamoto (1995). Statistical inferences in vector autoregressions with possibly integrated processes. Journal of Econometrics, 66, 225-250.
Torgler, B., Schneider F., 2009, The Impact of Tax Morale and Institutional Quality on the Shadow Economy, Journal of Economic Psychology, 30, no.2.
Valodia, I. and Devey, R. (2011). Formal, informal economy linkages: Implications for poverty in South Africa, Law, Development and Democracy, 14, 133-158.
Zaman Gh., Goschin Z., 2013, New Approach to Shadow Economy Metrics of International Comparisons EU Countries, in Hlaciuc E., Bostan I. editors, European Research Development in Horizon 2020, Lumen Media Publishing, printed in UK, USA, Romania, pp.609-630.

Gheorghe ZAMAN, Zizi GOSCHIN 32
Annex 1. The shadow economy index (SSEI) average values and percentage change over 1999-2012, by country
A new multidimensional ranking of shadow economy for EU countries
33
Annex 2. Augmented Dickey-Fuller test statistic on sigma series for SSEI
Null Hypothesis: SSEI has a unit root Exogenous: Constant, Linear Trend
t-Statistic Prob.*
Augmented Dickey-Fuller test statistic -1.316594 0.8350 Test critical values: 1% level -4.886426
5% level -3.828975 10% level -3.362984
*MacKinnon (1996) one-sided p-values.
Augmented Dickey-Fuller Test Equation Dependent Variable: D(SSEI) Method: Least Squares Sample (adjusted): 2000 2012
Variable Coefficient Std. Error t-Statistic Prob.
SSEI(-1) -0.280201 0.212823 -1.316594 0.2174 C 0.117360 0.085581 1.371337 0.2003
@TREND -0.000673 0.000315 -2.135976 0.0584
R-squared 0.403191 Mean dependent var -0.000196 Adjusted R-squared 0.283829 S.D. dependent var 0.005009 S.E. of regression 0.004239 Akaike info criterion -7.889918 Sum squared resid 0.000180 Schwarz criterion -7.759545 Log likelihood 54.28447 Hannan-Quinn criter. -7.916716 F-statistic 3.377885 Durbin-Watson stat 2.623034 Prob(F-statistic) 0.075714