Embed Size (px)
Citation preview

57-74
57
The Mining-Geology-Petroleum Engineering BulletinUDC: 624.1DOI: 10.17794/rgn.2020.2.6
Original scientific paper
Corresponding author: Mohammad Ali Ebrahimi [email protected]
A new model for predicting the advance rate of a Tunnel Boring Machine (TBM) in hard rock conditions
Mohammad Hossein Arbabsiar1; Mohammad Ali Ebrahimi Farsangi1; Hamid Mansouri1
1Mining Engineering Department, Shahid Bahonar University of Kerman, Kerman, Iran
AbstractThe prediction of the advance rate of a Tunnel Boring Machine (TBM) in hard rock conditions is one of the most impor-tant concerns for estimating the time and costs of a tunnel project. In this paper, in the first step, a model based on Rock Engineering Systems (RES) is proposed to predict geotechnical risks (representing media characteristics) in rock TBM tunnelling. Fifteen main parameters that influence the geotechnical hazards were used in the modelling. In establishing an interaction matrix and also a parameter rating, the views of five experts were taken into account. The Vulnerability Index (VI) (geotechnical risk levels) for 2058 datasets out of 2168 sets of data from 53 geological zones in 11 km of the Zagros long tunnel was obtained. In the second step, based on the machine operating parameters such as torque, cutter head rotation per minute, cutter normal force and media characteristics (represented by VIs), which were used as input parameters and advance rate was used as an output parameter, while using 2058 datasets, linear and non-linear multiple regression analyses were carried out. 110 datasets (out of 2168 datasets), which were not used in the modelling, were ap-plied to evaluate the performance of regression models and other models in literature and the results were compared. The obtained results showed that the new linear model proposed with R2=0.83 and RMSE=0.12 has a better performance than the other models.
Keywords:Advance rate, Regression models, TBM geotechnical risk, Rock engineering systems, Hard rock TBM, Zagros long tunnel
1. Introduction
In tunnel construction by TBM, the estimation of time and cost of a project are one of the most important pa-rameters, which has always been a challenge between contractors and owners. Penetration and advance rates are key parameters in the performance estimation of a TBM, which results in estimating the time and cost of a project. In recent years, many researchers devoted their work to predict the performance of a TBM. There are two categories of research works while considering modelling of predicting performances of hard rock TBMs. One category is theoretical models and the other empirical models (Rostami, 2015). In principle, theo-retical models are developed, by use of tests of indenta-tion or full-scale cutting tests in a laboratory, which pro-vide an estimation of cutting forces based on the type of cutter, geometry of cutting, spacing, and the cut penetra-tion (Crow, 1975; Roxborough and Phillips, 1975; Ozdemir, 1978; Snowdon et al., 1982; Sanio, 1985; Sato et al., 1991; Rostami and Ozdemir, 1993; Ros-tami, 1997; Balci et al. 2009; Bilgin et al. 2005, 2007, 2012; Tumac et al., 2012). The main weakness of these
models is that the tests used do not entirely describe the facts regarding rock mass characteristics which the disc cutters of TBM face in the field. This type of equipment for tests may not be easily accessible in all centers for research around the world (Khademi Hamidi et al. 2010). The first models were developed, using intact rock parameters such as tensile strength and Uniaxial Compressive Strength (UCS) (Graham, 1977; Farmer and Glossop, 1980). Cassinelli et al. the Penetration Rate (PR) of TBM by the use of Rock Structure Rating (RSR) in 1982. A good relationship between RSR, UCS, and the penetration rate of TBM was introduced by In-naurato et al. in 1991. Snowdon et al. and Sanio dis-closed relationships between the UCS of rock and the specific energy in 1983 and 1985 respectively (Farrokh, 2018). Different laboratory tests such as Taber abrasion, Shore hardness, Schmidt hammer, point load index, and drilling rate index tests were applied for the prediction of PR (Howarth et al. 1986; McFeat-Smith, 1977; Oz-demir, 1977; Pang et al., 1989; Yagiz, 2002; Yagiz and Ozdemir, 2001; Fattahi and Moradi, 2017). Other pre-diction models have been improved in the last three dec-ades to consider a wide range of rock properties and rock mass conditions. Palmstrom (1995) introduced a fore-cast model based on the Rock Mass index (RMi) and the QTBM model was developed by Barton (1999, 2000)

Arbabsiar, M.H.; EbrahimiFarsangi, M.A.; Mansouri, H. 58
The Mining-Geology-Petroleum Engineering Bulletin and the authors ©, 2020, pp. 57-74, DOI: 10.17794/rgn.2020.2.6
based on the developed Q system. The NTNU model was introduced by the Norwegian University of Science and Technology (Bruland, 2012; Blindheim, 1979). Rock Mass Rating (RMR) parameters were employed for predicting TBM performance by Sapigni et al. (2002); Bieniawski et al. (2007); Khademi Hamidi et al. (2010). In 2008, Yagiz developed a relationship be-tween rock mass properties and PR. Hassanpour et al. (2009, 2010, 2011, 2016) investigated TBM perfor-mance based on the Field Penetration Index (FPI). Gong and Zhao (2007, 2009) and Gong et al. (2007) intro-duced the index of boreability and rock brittleness to in-vestigate the rock mass characteristics that affect the performance of TBM. Bieniawski et al. (2007, 2008), examined TBM boreability using rock mass classifica-tion systems (Namli and Bilgin, 2017). The difficulties of TBM excavation in the blocky area were examined by Delisio and Zhao (2013). Neuro-fuzzy techniques were used by Alvarez Grima et al. (2000) for modelling of TBM performance. A study was carried out by Acaroglu et al. (2008) for predicting the specific energy require-ment for the performance of TBM by applying fuzzy logic. Zhao et al. (2007) used a neural network predictor for TBM performance prediction. Yagiz (2009) applied artificial neural networks and non-linear multiple regres-sion to estimate the TBM performance. The hard rock TBM penetration rate was predicted by Yagiz and Karahan (2011), using the Particle Swarm Optimiza-
Table 1: The TBM specifications, section two, the Zagros long tunnel Salimi et al. (2016)
Parameter Value UnitDiameter of machine 6.73 mDiameter of cutters 4318 mmNumber of disc cutters 42 _Disc cutters nominal spacingMaximum of cutterhead thrust
9028.134 at 35 bar
mmkN
Power of cutterhead 2100 kWSpeed of cutterhead 0-11 rpmTorque (nominal) of cutterhead 4450 at 9 rpm kN.mStroke of thrust cylinder 1700 mmCapacity of conveyer 650 t/hTotal weight of TBM 573 ton
Table 2: A descriptive statistics of datasets for section two of the Zagros long tunnel
No Parameter Unit Symbol Min Max Mean St.d1 Cutter head rotation per minute rotation/minute RPM 2.65 8 5.42 0.912 Cutter normal force kN Fn 52.73 231.04 156.62 34.843 Torque kN.m Tq 292 8790 814.45 330.914 Advance rate m/h AR 1.68 3.96 2.87 0.455 Uniaxial compressive strength MPa UCS 15 125 35.16 21.696 Elastic modulus GPa E 5 22.5 5.73 2.667 Quartz content % QC 0.5 4 1.76 1.018 Dry density g/cm3 Dd 2.25 2.55 2.41 0.069 Porosity % P 3.5 12.5 8.02 2.2810 Tensile strength (Brazilian test) MPa TS 1 6 2.50 0.9511 Over burden m Ob 40 1000 211.76 96.0912 Joint spacing mm JS 15 300 136.27 84.5013 Rock quality designation % RQD 22.5 85 65.98 12.6414 Rock mass rating (1989) RMR89 34 65 47.54 6.70
15 Gas emission(H2S) ppm
Ge0 30 7.05 4.47
CH4 % 0 7 0.5 0.715 Squeezing - Sq 1.69 33.56 5.24 4.2916 Water table m Wt 50 400 262.68 138.6617 Water inflow lit/min in 10 m Wi 0 300 12.51 27.6418 Clay contents in mass rock % Cc 5 40 2.80 5.4819 Width of crushed zone m CZ 0 200 2.18 15.11
Maximum: Max; Minimum: Min; Standard deviation: St.d
tion (PSO) method. In an attempt, Farrokh et al. (2012) investigated different models used to predict the pene-tration rate of hard rock TBMs.
In the ABROCK Research Project, different research works are being carried out for the analysis and predic-tion of cutter wear and penetration rate of TBM tunnel-ling in hard rock conditions (Moradi and Ebrahimi, 2014). Ghasemi et al. (2014) and Fattahi and Baban-ouri (2017) employed soft computing methods for TBM performance prediction.

59 A new model for predicting the advance rate of a Tunnel Boring Machine (TBM) in hard rock conditions
The Mining-Geology-Petroleum Engineering Bulletin and the authors ©, 2020, pp. 57-74, DOI: 10.17794/rgn.2020.2.6
Figure 1: Geological profile of section two of the Zagros long tunnel alignment (Lar consulting engineers, 2003, 2004).
Arbabsiar, M.H.; EbrahimiFarsangi, M.A.; Mansouri, H. 60
The Mining-Geology-Petroleum Engineering Bulletin and the authors ©, 2020, pp. 57-74, DOI: 10.17794/rgn.2020.2.6
The objective of the present piece of work is to intro-duce a new model to improve the accuracy of advance rate prediction in different geotechnical conditions in rock TBM tunnelling, considering both operational pa-rameters of TBM (machine parameters) as well as media characteristics. Media characteristics are represented by the geotechnical risk levels in the modelling. The geo-technical risk levels are obtained, using an RES based model. In the new model, machine parameters and geo-technical risk levels are input parameters and the ad-vance rate is an output parameter. The field data used for the modelling was collected from section two of the Za-gros long tunnel in Iran.
2. Description of the site and data collection
The Zagros long tunnel with a circular cross-section, an excavation diameter of 6.73 m, a final diameter of 6 m, and a length of 52 km is a water transfer tunnel which consists of two sections. This tunnel is located in the northwest of Iran. It was planned to transfer about 70 m3/s of water through this tunnel. The data was collected from the second section of the tunnel, which has a length of 26 km. This section of the tunnel was excavated by a double-shield TBM. The machine specifics are shown in Table 1.
The tunnel passes through three formations. The Pab-deh (PEPd) formation includes a mix of greenish-grey limestone argillaceous and dark grey limy shale. The Gurpi (KGu) formation combines argillaceous limestone and limy shale. Furthermore, the Ilam (Ki) formation consists of brownish-grey limestone as illustrated in Figure 1 (Lar consulting engineers, 2003, 2004).
Rock mass conditions vary from weak to good (RMR: 17 to75). According to geological studies, 53 zones were recognized, which mainly are mainly consist of layers of
shale, limestone, and marl. The dominant lithological characteristics were used to name the zones (Marl (MA), Shale (SH), Limestone (LI), Limy Shale (LI-SH), Marly-Limestone (LI-MA), Fractured Zone (FZ), and Crushed Zone (CZ)). Twenty-three different types of faults inter-sect with the tunnel. Overburdens vary between 40 m and 1000 m. The water table above the tunnel varies from 50 m to 400 m (Lar consulting engineers, 2003, 2004).
The database for this research work (2168 sets of data) was obtained by combining the data in the pre -construction and construction phases. During the con-struction phase, the geological and geomechanical data, which were obtained before construction, were exam-ined (Khademi Hamidi et al. 2010; Salimi et al. 2016). During construction, the operational data of TBM such as Revolutions per Minute (RPM), torque, thrust, and advance rate were recorded. The basic descriptive statis-tics of the sets of data are revealed in Table 2.
3. Rock engineering system
Hudson (1992) introduced the Rock Engineering Systems (RES) approach in which interactions between rock mechanics parameters in a rock system can be ob-tained. This approach was applied to different rock engi-neering fields such as an investigation of underground excavation stability (Lu and Hudson, 1993), with rock-fall risk assessment (Cancelli and Crosta, 1993), and characteristics of a rock mass to indicate natural slope stability (Mazzoccola and Hudson, 1996). (Latham and Lu, 1999) introduced an assessment system to de-termine the rock mass’s blastability, (Benardos and Ka-liampakos, 2004) used an assessment system for geo-technical hazards in TBM tunnelling (Shin et al., 2009) studied a hazard assessment of tunnel collapses, a quan-titative approach, (Faramarzi et al., 2013) predicted
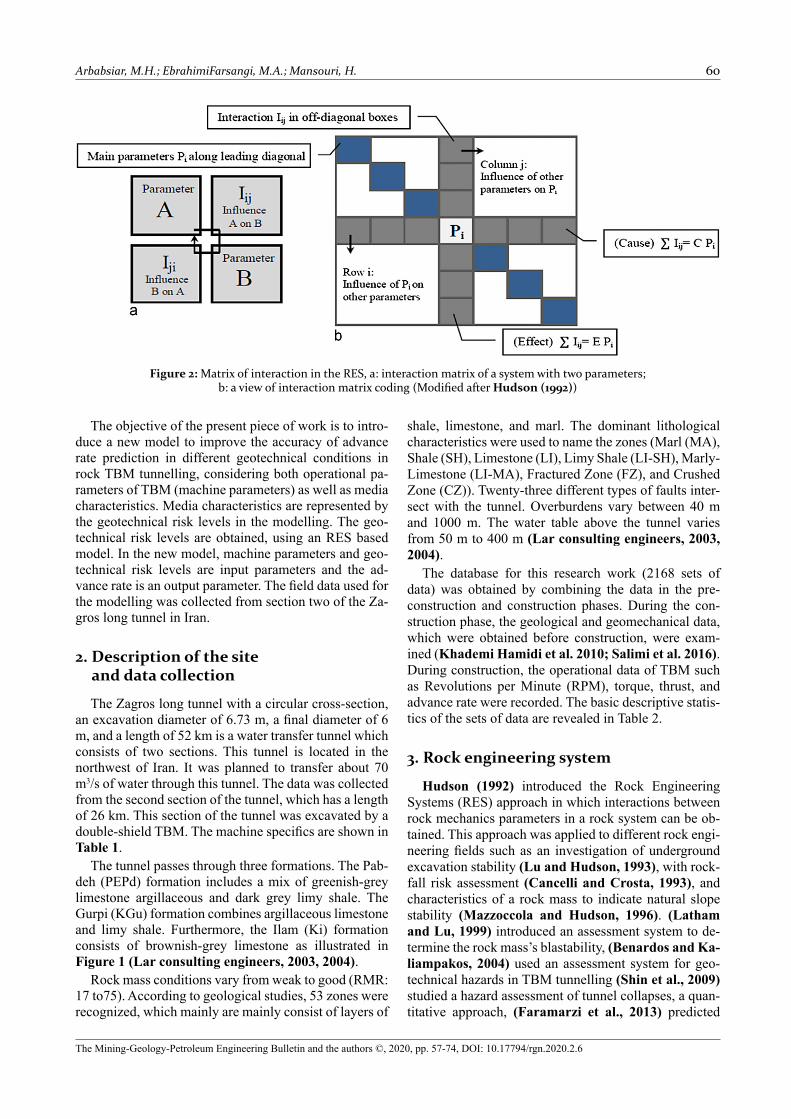
Figure 2: Matrix of interaction in the RES, a: interaction matrix of a system with two parameters; b: a view of interaction matrix coding (Modified after Hudson (1992))

61 A new model for predicting the advance rate of a Tunnel Boring Machine (TBM) in hard rock conditions
The Mining-Geology-Petroleum Engineering Bulletin and the authors ©, 2020, pp. 57-74, DOI: 10.17794/rgn.2020.2.6
rock fragmentation by blasting and predicted the ad-vance rate of face, while determination of the operation efficiency in retreat longwall mining panel was studied by (Aghababaei et al., 2019). In the approach of RES, establishing the matrix of interaction plays an important role. By generating the interaction matrix, the weighting of the parameters of the rock mass system can be evalu-ated. In this matrix, the principal parameters, which af-fect the system, are placed on the leading diagonal of the matrix and the interactions (effects of each parameter on any other parameter) are located on the off-diagonal cells. The assignment of values to off-diagonal cells is called coding of the interaction matrix. The simplest of the interaction matrix, a two parameter system, is shown in Figure 2(a). Beside that, a view of interaction matrix coding is shown in Figure 2(b). The row passing through Pi denotes the impact of Pi on all the other parameters in the system, while the column through Pi shows the im-pacts of other parameters, or the remaining of the sys-tem, on the Pi. In principle, there is no limit to the num-ber of parameters that may be included in an interaction matrix.
For numerically coding the interaction matrix, differ-ent procedures such as the 0-1 binary, Expert Semi-Quantitative (ESQ) (Hudson, 1992), and the Continu-ous Quantitative Coding (CQC) (Lu and Latham, 1994) were applied. Among the suggested coding proce-dures, the most commonly used is the ESQ coding. Based on this coding procedure, the interaction intensity is presented by the values from 0 for no interaction to 4 for critical interaction as revealed in Table 3.
(1)
Where:Ci – Cause of ith parameter,Ei – Efect of ith parameter,ai – Weighting of the ith parameter.
4. Prediction of the level of geotechnical risks, using an RES based model
The level of geotechnical risks was used to reflect the effects of media characteristics in the modelling of TBM performance prediction. In this research, the principles of the work carried out by Benardos and Kaliampakos, (2004) were adopted to define a model for predicting the level of geotechnical risks in rock TBM tunnelling. The merit of this modelling is that all of the important and easily obtainable parameters affecting geotechnical risks in rock TBM were taken into account.
There are two main phases for defining the RES based model. In the first phase, the geotechnical parameters (hazards), which cause the occurrence of risk in the case of rock TBM tunnelling, are defined. Also, their behav-iors are analyzed and the impact (weight) that each one has in the whole risk conditions is evaluated. Further, the RES principles can be applied to evaluate the weighting of the parameters that influence the risk system.
In phase two, the Index of Vulnerability (VI), repre-senting the level of risk, can be determined, using Equa-tion 2 (Hudson, 1992):
(2)
Where:VI – Index of Vulnerability,ai – Weighting of the ith parameter,Pi – Value (rating) of the ith parameter,Pmax – Maximum value assigned the ith parameter
(normalization factor).In this equation, the level of total risk can be calcu-
lated based on the weight and individual influence of each parameter on the total risk level (the parameter’s value rating). The parameter value ratings can be carried out based on the effects of these parameters on the vul-nerability conditions.
Based on the VI obtained, (using Equation 2) and the classification of VI, the level of total risk in each zone of the tunnel can be identified. In the classification for VI, it is divided into three main classes with a normalized scale of 0 to 100, (see Table 4). Class I is including, small-scale problems. These problems cannot significantly affect tun-nel driving. In class II, a challenging region might occur, which must be taken into consideration.
Table 3: The values for coding of interaction matrix in the ESQ procedure (Hudson, 1992)
Coding Description0 No interaction1 Weak interaction2 Medium interaction3 Strong interaction4 Critical interaction
In the matrix of interaction, the summation of a row is called the “cause” value ( ) and the summation
of a column is the “effect” value ( ), which are
the coordinates (C, E) for a parameter in the system. In the cause and effect space, the coordinate values for each parameter in the system can be plotted, which is called the C-E plot. The interactive intensity value of each parameter in the system is indicated as the summa-tion of the C and E values ( ) and it can be applied as an indication of the significance of a parameter in the system. Also, a parameter’s weighting factor ( ) is de-fined using the percentage value of ( ) as shown in Equation 1.

Arbabsiar, M.H.; EbrahimiFarsangi, M.A.; Mansouri, H. 62
The Mining-Geology-Petroleum Engineering Bulletin and the authors ©, 2020, pp. 57-74, DOI: 10.17794/rgn.2020.2.6
In class III, it is expected that in certain individual regions, several difficulties during tunnel excavation, are to be observed.
4.1. Parameters influencing geotechnical risks of TBM
In reviewing the TBM geotechnical risk assessment in hard ground conditions and the pieces of literature pub-lished (Anagnostou and Kovári, 1996; Barla and Peliz-za, 2000; Barla, 2001; Dalģ, 2003; Shang et al., 2004; Farrokh, 2006; Ramoni and Anagnostou, 2010; Jung et al., 2011; Shaterpour Mamaghani et al., 2015 Arb-absiar et al., 2020) many parameters can influence the TBM geotechnical risks encountered. The parameters in Table 5 are the most important ones from available pa-rameters in the database and can be obtained easily. These parameters cover the most important hazards which might be encountered during rock TBM tunnelling such as insta-bility, fault zone, squeezing, sticking due to muddy condi-tion, and water ingress. In the selected parameters, the components of RMR such as UCS, RQD, joint spacing, joint orientation, joint condition, and water inflow are pre-ferred instead of RMR as they describe other issues of risk raised as well as instability as a hazard.
UCS shows the compressive strength of intact rocks and also has significant effects on RMR and the associ-ated stability (Goodman., 1989). Moreover, rocks with very high UCS cause wear and tear of cutters as well as a considerable reduction in the advance rate. Also, in rocks with low UCS, gripping problems might occur. The condition of the joints significantly influences an excavation’s stability. It also affects the gripping of TBM. The total performance of TBM in joints with very rough surfaces of a limited extent and a hard wall is much better than open joints filled with more than 5 mm of gouge, or open more than 5 mm, or when joints ex-tend more than several meters.
The orientation of the joints comparative to the tunnel axis has an impact on the chipping behavior of rocks dur-ing the excavation by TBM. Based on Bieniawski (1984, 1989), the orientation of the joints perpendicular to the tunnel axis is the most favorable for TBM tunnelling.
The spacing of joints affects the rating in RMR and therefore the stability of the tunnel. On the other hand, based on the recommendations by DAUB (German Tun-nelling Committee) (DAUB, 1997), in the rocks with joint spacing of 0.2 m-0.6 m, gripping problems might be encountered, for which shield-TBM suggests. In rocks with joint spacing of 0.06 m- 0.2 m, the possible falling rocks might trap the shield-TBM causing serious delays.
Groundwater can strongly influence rock mass behav-ior (Goodman., 1989). Also, the pore pressure in rocks depends on the level of groundwater. Higher groundwater level means more pore pressure, resulting in decreasing stability, and in the case of high permeability and the pres-ence of joints, an increase in water inflow. In return, the high inflow of water causes delays and possible damage.
Gas emission such as Methane (CH4), Hydrogen Sulfide (H2S), Carbone Monoxide (CO) and Hydrogen Cyanide (HCN) into a tunnel might cause safety con-cerns such as human loss and damage due to an explo-sion, respiratory problems as well as corrosion damage, resulting in delays in tunnelling. In most cases, the main concern is CH4 and H2S.
CH4 is a flammable gas, lighter than air and odorless. The Lower Explosive Limit (LEL) and Upper Explosive Limit (UEL) for CH4 are 5% and 15% respectively (In-dustrial Training Branch of the National Coal Board, 1981).
H2S is a colorless and toxic gas with LEL and UEL of 4% and 44% respectively. It is slightly heavier than air with a strong smell of rotten eggs. H2S dissolves in wa-ter, making a weakly acidic solution. The main dangers are related to its toxic effect and corrosive property to metals. It can be recognized by smelling below 1 ppm. The 8 hour occupational exposure limit is 10 ppm, for short times (15 min), 15 ppm is acceptable. Above 15 ppm, full face masks with filters are used. This restricts the ability to work to a great extent. Above 100 ppm, H2S deadens a person’s sensitivity to smell it. Also,
Table 4: The VI classification (Modified after Benardos and Kaliampakos (2004))
Risk description
Low-Medium
Medium-High
High-Very high
Class I II III0-33 33-66 66-100
Table 5: Parameters affecting the TBM geotechnical risks
Parameter Symbol Parameter SymbolRQD P1 Gas emission P9UCS P2 Squeezing P10Joint condition P3 Mixed face P11Joint orientation P4 Karstic condition P12
Joint spacing P5 Abrasive rocks (quartz contents) P13
Water table P6 Width of crushed zone P14
Permeability P7 Clay contents in mass rock P15
Water inflow P8 - -
RQD describes the fracturing degree of a rock mass. It is one of the most important components of RMR, which has a significant role in the excavation’s stand-up time, indicated by RMR (Goodman., 1989). Also, rocks with low RQD cause difficulties through TBM gripping, putting excavation at risk and causing a reduction in the advance rate.

63 A new model for predicting the advance rate of a Tunnel Boring Machine (TBM) in hard rock conditions
The Mining-Geology-Petroleum Engineering Bulletin and the authors ©, 2020, pp. 57-74, DOI: 10.17794/rgn.2020.2.6
above 100 ppm it is immediately dangerous to life or health. Therefore, filters should only be used up to 100 ppm. At higher concentrations, masks with positive pressure self-supplying respirators shall be used.
Concentrations between 50 and 100 ppm have to be negotiated for longer periods. H2S also causes corrosion to metals, in particular to the electrical installations on the TBM. To reduce the effects, some electrical cabinets, the operator cabin, and a rest cabin have been connected to a fresh air supply (Industrial Training Branch of the National Coal Board, 1981).
Squeezing ground may lead to inadmissible deforma-tions of the tunnel, damage to the support or in the case of mechanized excavation, to the immobilization of TBM due to sticking cutter heads or jamming of the shield. Depending on the number and the length of the critical stretches, squeezing conditions may even put the feasibility of the TBM drive into question (Ramoni and Anagnostou, 2010). Factors such as high overburden, the presence of water, poor ground condition (rock qual-ity), high stress and properties of rocks, all affect the occurrence of ground squeezing. Several approaches have been proposed by various authors such as Jethwa et al. (1984), Singh et al. (1992), Aydan et al. (1996), Goel et al. (1995), Hoek and Marinos (2000), based on practical experience and documented case histories, to identify squeezing rock conditions and potential tunnel squeezing problems. In this research, Singh et al. (1992) and Jethwa et al. (1984) approaches were used to deter-mine the squeezing potential in different zones.
The occurrence of karstic zones through tunnel align-ment results in decreasing rock strength, which in return reduces the load bearing of rock, while gripping is re-quired. On the other hand, in the case of having gases such as CH4 and H2S, karstic zones facilitate the leakage of such gases into the tunnel, which raises the TBM tun-
nelling risks (Marinos, 2001). The requirements, which cause karstic zones include carbonate rocks, joints, and flow of water. In the Zagros long tunnel, in limited zones, the needs for the occurrence of karstic zones are met.
Encountering the alternatives of hard and soft rocks in the tunnel face, the so-called mixed face condition might cause serious damage to the cutters, which results in a delay in tunnelling. Also, in the case of facing abrasive rocks, which are identified by their quartz contents, cut-ter wear might occur, which decreases the penetration rate, causing significant delays to tunnelling and eco-nomic loss.
The presence of water and rocks containing clay min-erals such as shale and marl might cause swelling, which in return increase the stress on the support system used. Also, in the presence of water and such rocks, a sticky condition might be encountered, causing delays and sometimes trapping of the cutterhead.
The width of crushed zones, relevant water ingress and RQD affect the risk associated with the fault zones. With a wider crushed zone, lower RQD and in the pres-ence of high water inflow, a higher degree of risk is ex-pected, which in return causes jamming of the TBM, delays and economic loss.
4.2. Interaction matrix and rating of parameters
4.2.1. Interaction matrix
The 15 principal parameters affecting the geotechni-cal risk in TBM tunnelling are located along the leading diagonal of the matrix and the effects of each parameter on any other parameter (interactions) are placed on the off-diagonal cells. The assigning values to off-diagonal cells, coding the matrix, were carried out by five experts, using the ESQ coding as proposed by Hudson (1992).
Table 6: The interaction matrix for geotechnical hazards in TBM tunnelling
P1 1 0 0 0 1 3 3 3 3 0 2 0 1 23 P2 1 0 2 0 1 0 1 4 0 3 0 2 03 2 P3 0 1 3 4 3 4 2 2 3 1 2 23 3 0 P4 0 3 3 2 3 2 1 2 0 0 04 2 1 0 P5 3 4 3 3 3 1 2 2 2 22 3 2 0 1 P6 2 3 3 2 0 3 0 0 00 1 1 0 0 3 P7 4 4 2 0 3 1 1 11 1 1 0 0 1 1 P8 3 1 0 3 1 0 10 0 0 0 0 0 0 0 P9 0 0 0 0 0 00 0 0 0 0 0 1 2 0 P10 0 0 0 0 02 0 0 0 0 0 1 1 1 0 P11 1 0 0 02 1 1 0 1 3 2 2 2 1 0 P12 1 1 11 1 1 0 0 0 1 0 1 1 0 2 P13 2 02 0 1 0 0 1 2 2 2 2 0 1 0 P14 22 3 2 2 2 1 3 2 2 2 0 1 1 2 P15

Arbabsiar, M.H.; EbrahimiFarsangi, M.A.; Mansouri, H. 64
The Mining-Geology-Petroleum Engineering Bulletin and the authors ©, 2020, pp. 57-74, DOI: 10.17794/rgn.2020.2.6
The interaction matrix for geotechnical hazards in TBM tunnelling is presented in Table 6.
Table 7 gives the cause (C), effect (E), interactive in-tensity (C+E), dominance (C-E), and weight of each pa-rameter (ai) calculated by Equation 1 for the parameters affecting the hazards in TBM tunnelling. Also, the weight for each parameter is shown in Figure 3. As can be seen in Table 7 and Figure 3, the most interactive parameters are permeability, RQD, joints condition karstic zones, whereas the least interactive parameter is the mixed face condition.
4.2.2. Rating of parametersThe rating of the parameters’ values was carried out
based on their effect on the vulnerability conditions. To-tally 4 classes (except UCS, which has five classes), from 0 to 3 were considered, where 0 denotes the worst case (most unfavorable) and 3 the best (most favorable condition). In the case of TBM tunnelling, the rating of each parameter is presented in Table 8. The ranges of parameters in Table 8 were proposed based on empirical results, practical limits and the experiences of different experts (five experts in this research work).
Table 7: The principal parameters weighting in the TBM tunnelling geotechnical risk
No. Parameter C E C+E C-E ai (%)1 RQD 19 25 44 -6 8.62 UCS 17 18 35 -1 6.93 Joint condition 32 11 43 21 8.44 Joint orientation 22 2 24 20 4.75 Joint spacing 32 7 39 25 7.66 Water table 21 19 40 2 7.87 Permeability 21 28 49 -7 9.68 Water inflow 14 27 41 -13 8.09 Gas emission 0 32 32 -32 6.310 Squeezing 3 25 28 -22 5.511 Mixed face 6 4 10 2 2.012 Karstic condition 18 26 44 -8 8.613 Abrasive rocks (quartz contents) 10 7 17 3 3.314 Width of crushed zone 15 13 28 2 5.515 Clay contents in mass rock 25 11 36 14 7.0Total 255 255 510 0 100
Figure 3: The principal parameters weighting in the TBM tunnelling geotechnical risk

65 A new model for predicting the advance rate of a Tunnel Boring Machine (TBM) in hard rock conditions
The Mining-Geology-Petroleum Engineering Bulletin and the authors ©, 2020, pp. 57-74, DOI: 10.17794/rgn.2020.2.6
4.2.3. Geotechnical risk estimation of the Zagros long tunnel
Geotechnical risk estimation of 2058 sets of data from 11 km of section two of the Zagros long tunnel was car-ried out using the vulnerability index (Equation 2). To have a clear understanding, the parameter values and the corresponding VI obtained for one set of data are shown in Table 10. In this table, Qi and QMax for each parameter can be obtained based on its value or description through Table 8.
4.3 Multiple regression modelling for the prediction of the advance rate of TBM in hard rock condition
In this paper, based on 2058 datasets collected from section two of the Zagros long tunnel (out of 2168 data-sets), linear and non-linear regression analyses were car-ried out for developing a new model to predict the ad-vance rate of TBM in hard rock conditions. Torque (Tq), cutter head rotation per minute (RPM), cutter normal force (Fn) as machine parameters, and vulnerability in-
Table 8: The rating suggested for the effective parameters in geotechnical risks in TBM tunnelling
Values or description and ratingsParameter75-10050-7525-500-25ValueRQD (%)13210Rating
>15050-15025-505-25<5ValueUCS (MPa)201234Rating
A4A3A2A1DescriptionJoint condition30123RatingVery unfavorable
UnfavorableFairVery favorable and favorable
DescriptionJoint orientation(According to Table 9)
4
0123Rating>0.60.2-0.60.06-0.2<0.06ValueJoint spacing (m)53210Rating>15050-1500-50<0ValueWater table (m)60123Rating>10-410-4-10-610-6-10-8<10-8ValuePermeability70123Rating>12525-12510-25<10ValueWater inflow (lit/min in 10 m
length of the tunnel)8
0123Rating>5025-5015-255-15<5ValueCH4 (%)Gas emission901203Rating
>10020-10010-20<10ValueH2S (ppm)0123Rating
>20.8-20.4-0.8<0.4ValueSqueezing*103210Rating
MixedNon-mixedDescriptionMixed face1103Rating
Highly karsticModerately karstic
Mildly karstic
Non-karsticDescriptionKarstic condition12
0123Rating>2010-205-10<5ValueAbrasive rocks
(quartz contents) %13
0123Rating>2510-25<10NoneValueThe width of the fractured
or crushed zone14
0123Rating>7030-7010-30<10ValueClay contents in mass rock
(muddy condition) (%)15
0123Rating
* Based on Jethwa et al., (1984)A1: Very coarse surfaces of limited extent, hard wall rock; A2: Slightly coarse surfaces, opening less than 1 mm, hard wall rock; A3: Slightly coarse surfaces, opening less than 1 mm, soft wall rock; A4: Open joints with smooth surfaces, 1 to more than 5mm aperture, filled with gouge filling or 1 to more than 5mm aperture, joints extended more than several meters

Arbabsiar, M.H.; EbrahimiFarsangi, M.A.; Mansouri, H. 66
The Mining-Geology-Petroleum Engineering Bulletin and the authors ©, 2020, pp. 57-74, DOI: 10.17794/rgn.2020.2.6
dex (VI) as the effect of media characteristics were used as input parameters and Advance Rate (AR) was the out-put parameter. Data distributions for these parameters
Table 9: The discontinuity strike and dip orientation effect in tunnelling (Goodman, 1989)
Strike perpendicular to the tunnel axis Strike parallel to the tunnel axisDrive with dip Drive against dip
Dip 45°-90° Dip 20°-45° Dip 45°-90° Dip 20°-45°Very favorable Favorable Fair Unfavorable
Strike parallel to the tunnel axis Irrespective of strikeDip 20°-45° Dip 45°-90° Dip 0°-20°
Fair Very unfavorable Fair
Table 10: The corresponding VI to parameters’ values for one set of data of section two of the Zagros long tunnel
Parameter RQD(%)
UCS(MPa) Jc Jo Js
(cm)Wt(m)
Per.(m/s)
Wi(lit/min)
Ge(%) Sq Mf Kc Qc
(%)Cz(m)
Cc(%)
Value or description 72-85 10-20 A1 Un-
favorable 300 50 2*10-8 22 <5 (H2S)<10 (CH4) 6.1 Mixed None 0-5 None 5
Value rating (Pi) 2 3 3 1 2 2 2 2 3 3 0 3 3 3 3
Weighting (ai) (%) 8.6 6.9 8.4 4.7 7.6 7.8 9.6 8 6.3 5.5 2 8.6 3.3 5.5 7
VI 21
Jc: Joint condition; Jo: Joint orientation; Js: Joint spacing; Wt: Water table; Per.: Permeability; Wi: Water inflow; Ge: Gas emission; Sq.: Squeezing; Mf: Mixed face; Kc: Karstic condition; Qc: Abrasive rocks (quartz contents); CZ: Width of a crushed zone or fractured zone; Cc: Clay contents in mass rock (muddy condition)
(a) (b)
(c) (d)Figure 4: Histogram of (a) Tq, (b) RPM, (c) Fn,(d) VI
are shown in Figure 4. Also, by using the database, a simple regression analysis was performed to identify the relationship between each parameter with AR as shown

67 A new model for predicting the advance rate of a Tunnel Boring Machine (TBM) in hard rock conditions
The Mining-Geology-Petroleum Engineering Bulletin and the authors ©, 2020, pp. 57-74, DOI: 10.17794/rgn.2020.2.6
to carry out a multiple linear regression analysis. Ac-cording to the statistical analysis, the predictive model is as shown in Equation 3:
(3)
Where:AR – Advance rate (m/h),Tq – Torque (nominal) of the cutterhead (kN.m),RPM – Cutter head rotation per minute (rotation/mi-
nute),Fn – Cutter normal force (kN),VI – Index of Vulnerability.
(a) (b)
(c) (d)
Figure 5: Relationship between (a) Tq, (b) RPM, (c) Fn,(d) VI data and recorded AR
in Figure 5. The outcomes obtained show that none of the parameters except RPM individually has a good cor-relation with AR.
4.3.1. Multiple linear regression analysis
Tq, RPM, Fn, and VI as independent variables and AR as a dependent variable, using SPSS software, were used
Table 11: Model summary for Equation 3
Model R R2 Adjusted R2 Std. Error of the Estimate
1 0.935 0.874 0.874 0.12560
Table 12: Coefficients of multiple linear regression and collinearity statistics for Equation 3
ModelUnstandardized Coefficients Standardized
Coefficients t Sig.Collinearity Statistics
B Std. Error Beta Tolerance VIF(Constant) 0.904 0.028 32.450 0.000Tq -4.954E-5 0.000 -0.019 -2.345 0.019 0.976 1.025Fn 0.002 0.000 0.197 24.483 0.000 0.946 1.057RPM 0.366 0.003 0.858 107.655 0.000 0.964 1.038VI -0.009 0.000 -0.259 -33.068 0.000 0.996 1.004

Arbabsiar, M.H.; EbrahimiFarsangi, M.A.; Mansouri, H. 68
The Mining-Geology-Petroleum Engineering Bulletin and the authors ©, 2020, pp. 57-74, DOI: 10.17794/rgn.2020.2.6
Table 13: Variance (ANOVA) analysis for Equation 3
Model Sum of Squares df Mean
Square F Sig.
Regression 225.086 4 56.272 3.567E3 .000Residual 32.404 2054 0.016Total 257.490 2058
Table 15: The performance of different models
Model R2 RMSE ObservationsLinear 0.83 0.12 110Exponential 0.82 0.13 110Polynomial 0.82 0.59 110Power 0.81 0.13 110Logarithmic 0.80 0.14 110Hassanpour et al. 0.57 1.15 110Khademi et al. 0.49 1.48 110Graham 0.50 2.62 110Farmer and Glossop 0.49 9.58 110Innaurato et al. 0.07 1.30 110Cassinelli et al. 0.04 1.28 110QTBM 0.02 4.16 110NTNU 0.0007 2.61 110
Table 14: TBM performance prediction empirical models
Model Relation
Graham (1977)
Farmer and Glossop (1980)
Cassinelli et al. (1982)
Innaurato et al. (1991)
Barton, (1999)
Hassanpour et al. (2009, 2010)
Khademi et al. (2010)
PR: penetration rate, PRev: penetration per revolution, FPI: field penetration index, Fn: cutter normal force, UCS: uniaxial compressive strength of intact rock, TS: tensile strength, RQD: rock quality designation, RMCI: rock mass cuttability index, σc = uniaxial compressive strength of rock, α: the angle between the tunnel axis and the planes of weakness, Jc: RMR joint condition partial rating, RSR: rock structure rating, RMR: rock mass rating, QTBM: Barton rock mass quality rating for TBM driven tunnels
The model summary for Equation 3 is shown in Table 11. Also, to check the degree of correlation between input variables, a multicollinearity analysis was carried out. The
Variance Inflation Factor (VIF), as one of the most useful tools for finding the level of multicollinearity, was used in this research. Its range varies from one to infinity. In gen-eral, VI greater than 10 shows a possibility of multicol-linearity (Montgomery and Peck, 1992).
The VIF values for independent variables in Equation 3 were determined and can be observed in Table 12. As can be seen from Table 12, the VIF for each independent variable in Equation 3 is less than 10. It shows that there is no high correlation between input independent variables.
Furthermore, analysis of variance (ANOVA) for Equation 3 is illustrated in Table 13. The model statistic
value F and significance (Sig.) are used to provide enough proof to discard the theory of ‘‘no effect’’. From Table 13, F of 0.004 and Sig. of 0.000 (less than 0.05) were obtained, which reveals that the null theory can be discarded. It means that at least one of the input param-eters significantly influences the AR.
4.3.2. Multiple non-linear regression modellingFor multiple non-linear regressions modelling, poly-
nomial, power, exponential, and logarithmic models with the same datasets were used. For the polynomial model with R2=0.86 obtained, the mathematical equa-tion is as shown in Equation 4:
(4)

69 A new model for predicting the advance rate of a Tunnel Boring Machine (TBM) in hard rock conditions
The Mining-Geology-Petroleum Engineering Bulletin and the authors ©, 2020, pp. 57-74, DOI: 10.17794/rgn.2020.2.6
Figure 6: Comparison between predicted AR and actual AR, (a) Linear model, (b) Exponential model, (c) Polynomial model, (d) Power model, (e) Logarithmic model, (f) Khademi et al. model, (g) Hassanpour et al. model, (h) QTBM model, (i) NTNU model, (j) Farmer and Glossop model, (k) Cassinelli et al. model, (l) Innaurato et al. model, (m) Graham model
Using, power model, the relation with R2=0.87 is as shown in Equation 5:
(5)
Furthermore, the mathematical equation for logarith-mic model with R2=0.85 is as shown in Equation 6:
(6)
Finally, for the exponential model with R2=0.87, the relation is as shown in Equation 7:
(7)
5. Evaluation performance of the models
The performance of regression models were com-pared with the models from literature such as Khademi
(a) (b) (c)
(d) (e) (f)
(g) (h) (i)
(j)
(m)
(k) (l)

Arbabsiar, M.H.; EbrahimiFarsangi, M.A.; Mansouri, H. 70
The Mining-Geology-Petroleum Engineering Bulletin and the authors ©, 2020, pp. 57-74, DOI: 10.17794/rgn.2020.2.6
et al. (2010), Hassanpour et al. (2009, 2010), QTBM (Barton, 1999), NTNU (Bruland, 2012), Farmer and Glossop (1980), Cassinelli et al. (1982), Innaurato et al. (1991), and Graham (1977) (Table 14), using 110 randomly selected datasets (out of 2168 datasets) from the Zagros long tunnel, which were not used in the mod-elling. Two signs, the determination coefficient (R2) and the Root Mean Square Error (RMSE) (Equations 8 and 9) were used to do the models performance evaluation and the results obtained are illustrated in Table 15. The predicted AR from all models for 110 datasets was com-pared with the recorded AR as shown in Figure 6. The predicted AR from these models for five datasets was compared with the recorded AR as illustrated in Figure 7. As it can be seen from Figure 7 and Table 15 the lin-ear regression model with R2=83 and RMSE=0.12 shows the best performance among the models.
(8)
Where:R2 – Coefficient of determination,xiactual – The ith measured element,xipredicted – The ith predicted element,n – The number of datasets.
(9)
Where:RMSE – Root Mean Square Error,xiactual – The ith measured element,
xipredicted – The ith predicted element,n – The number of datasets.
6. Conclusions
In this research work, using parameters of machine and media characteristics, different models were devel-oped based on linear and non-linear multiple regression analysis to determine the advance rate in rock TBM tun-nelling. In the modelling, torque, cutter head rotation per minute, and cutter normal force are machine parameters and the level of geotechnical risks (VI), representing media characteristics, which were used as input param-eters and AR was the output parameter. For predicting VI, an RES based model was proposed. The merit of this modelling is that all of the important and easily obtain-able parameters affecting geotechnical risks in rock TBM were taken into account.
Validation was carried out, using 110 randomly se-lected datasets (out of 2168 datasets) from the Zagros long tunnel, which were not used in the modelling. For 110 datasets, recorded AR were compared with the AR estimated through regression models and also with the AR obtained from the models such as Khademi et al., Hassanpour et al., QTBM, NTNU, Farmer and Glossop, Cassinelli et al., Innaurato et al., and Graham. The ob-tained results showed that the multiple linear regression model with R2 of 0.83 and RMSE of 0.12 has a better performance among the different models.
As it is evident, the linear regression model was con-structed based on site-specific parameters and limited datasets from the Zagros long tunnel. This model can be used to estimate the advance rate in the Zagros long tun-nel or tunnels with almost the same ground conditions. However, it cannot be generalized for other tunnel pro-
Figure 7: Comparison between the results of different models and recorded AR for five datasets

71 A new model for predicting the advance rate of a Tunnel Boring Machine (TBM) in hard rock conditions
The Mining-Geology-Petroleum Engineering Bulletin and the authors ©, 2020, pp. 57-74, DOI: 10.17794/rgn.2020.2.6
jects. For tunnelling projects with other geological envi-ronments, a similar approach with other parameters can be developed.
7. References
Acaroglu, O., Ozdemir, L. and Asbury, B. (2008): A fuzzy logic model to predict specific energy requirement for TBM performance prediction. Tunnelling and Under-ground Space Technology, 23, 5, 600–608. doi: 10.1016/j.tust.2007.11.003.
ABROCK Research Project (2013): Analysis and prediction of penetration and cutter wear for TBM-tunneling in hard rock, https://www.uibk.ac.at/abrock.
Aghababaei, S., Jalalifar, H. and Saeedi, G. (2019): Prediction of face advance rate and determination of the operation efficiency in retreat longwall mining panel using rock en-gineering system. International Journal of Coal Science and Technology, 6, 3, 419–429. doi: 10.1007/s40789-019-0245-6.
Alvarez Grima, M., Bruines, P. A. and Verhoef, P. N. W. (2000): Modelling tunnel boring machine performance by neuro-fuzzy methods. Tunnelling and Underground Space Technology, 15, 3, 259–269. doi: 10.1016/S0886-7798 (00)00055-9.
Anagnostou, G. and Kovári, K. (1996): Face stability condi-tions with earth-pressure-balanced shields. Tunnelling and Underground Space Technology, 11, 2, 165–173. doi: 10.1016/0886-7798(96)00017-X.
Arbabsiar, M.H., Ebrahimi Farsangi, M.A., Mansouri, H. (2020): Fuzzy logic modelling to predict the level of geo-technical risks in rock TBM tunneling. Rudarsko-geološko-naftni zbornik. doi: 10.17794/rgn.2020.2.1
Aydan, Ö.,Akagi, T. and Kawamoto, T. (1996): The squeezing potential of rock around tunnels. Theory and prediction with examples taken from Japan. Rock Mechanics and Rock Engineering, 29, 3, 125–143. doi: 10.1007/BF010 32650.
Balci, C., Tumac, D., Copur, H., Bilgin, N., Yazgan, S., Demir, E., Aslantas., G. (2009): Performance Prediction and Com-parison with In-situ Values of a TBM: a Case Study of Otogar-Bagcilar Metro Tunnel in Istanbul. In: Kocsonya. P (eds.): Proceeding world tunnel congress, 23-28 May, Bu-dapest, Hungary.
Barla, G. (2001): Tunneling under Squeezing Rock Condi-tions. In: Kolymbas, D. (eds.): Eurosummer-School in Tunnel Mechanics. Logos Verlag Berlin, 169-268
Barla, G. and Pelizza, S. (2000): TBM Tunneling in Difficult Ground Conditions. In: ISRM (eds.): Proceeding ISRM International Symposium 2000, GeoEng 2000. Technomic Publishing Co, Melbourne, Australia, November 19-24.
Barton, N. (1999): TBM performance estimation in rock using Q (TBM). Tunnels and Tunnelling International, 31, 9, 30–34.
Barton N. (2000): TBM Tunneling in Jointed and Faulted Rock. A.A Balkema, Rotterdam, Netherland, 173 p.
Benardos, A. G. and Kaliampakos, D. C. (2004): A methodol-ogy for assessing geotechnical hazards for TBM tunnelling
- Illustrated by the Athens Metro, Greece. International Journal of Rock Mechanics and Mining Sciences, 41, 6, 987–999. doi: 10.1016/j.ijrmms.2004.03.007.
Bieniawski, Z. T. (1984): Rock Mechanics Design in Mining and Tunneling. A.A Balkema, Rotterdam, 280 p.
Bieniawski, Z. T. (1989): Engineering rock mass classifica-tions: a complete manual for engineers and geologists in mining, civil, and petroleum. John Wiley& Sons, Hobo-ken, New Jersey, 251 p.
Bieniawski, Z., Celada, B., Galera, J.M. and Tardáguila, I. (2008): New Applications of the Excavability Index for Selection of TBM Types and Predicting their Performance. In: Underground Facilities for Better Environment and Safety. ITA world Tunnel congress. Agra, India, Septem-ber 19-25, 2008, Balkema, 1618–1629.
Bieniawski, Z. T., Celada, B. and Galera, J. M. (2007): Pre-dicting TBM excavability. Tunnels & Tunnelling Interna-tional, September, 25–28.
Bilgin, N., Feridunoglu, C., Tumac, D., Cinar, M., Palakci, Y., Gunduz, O., Ozyol, L. (2005): The Performance of A Full Face Tunnel Boring Machine (TBM) in Tarabya (Istan-bul). In: Erdem, Y. and Solak, T. (eds.): Proceeding of 31st ITA-AITES World Tunnel Congress, Istanbul, Turkey, 7-12 May 2005, 821-826.
Bilgin, N., Copur, H., Balci, C., Tumac, D., Akgül, M., Yüksel, Kahriman, A., (2007): The Determination of Some Design Parameters and Performance Prediction of Tunnel Boring Machines (TBM) Based on Rock Cutting Test in Kadikoy-Kartal Metro Tunnels. In: Proceedings of the 2nd sympo-sium on Underground Excavations for Transportation, 15–17 November 2007, Istanbul, Turkey, 63–71.
Bilgin, N., Balci, C., Copur, H., Tumac, D., Avunduk, E., (2012): Rock Mechanic Aspects Related to Cutting Effi-ciency of Mechanical Excavators, 25 Years of Experience in Istanbul. In: BeFo (eds.): ISRM International Symposi-um, EUROCK 2012, 28-30 May, Stockholm, Sweden.
Blindheim, O. T. (1979): Boreability Predictions for Tun-neling. Ph.D thesis. The Norwegian Institute of Technolo-gy, Trondheim, Norway.
Bruland, A. (2012): Hard Rock Tunnel Boring Machines. Ph.D thesis. The Norwegian Institute of Technology (NTNU), Trondheim, Norway.
Cancelli, A. and Crosta, G. B. (1993): Hazard and Risk As-sessment in Rockfall Prone Areas. In: Skip, B.O. (ed): Risk Reliability in Ground Engineering. Thomas Telford, London, 1993, 177–190.
Cassinelli, F., Cina, S., Innaurato, N., Mancini, R. and Sam-paolo, A. (1982): Power Consumption and Metal Wear in Tunnel-Boring Machines: Analysis of Tunnel-Boring Op-eration in Hard Rock. In: Jones M.J (eds.): Proceedings Tunneling’82. Institute of Mining and Metallurgy, Lon-don, 73–81.
Crow, S. C. (1975): Jet tunnelling machines: a guide for de-sign. Tunnels and Tunnelling, 7, 2, 23-37.
Dalgic, S. (2003): Tunneling in fault zones, Tuzla tunnel, Tur-key. Tunnelling and Underground Space Technology, 18, 5, 453–465. doi: 10.1016/S0886-7798(03)00045-2.
DAUB. (1997): Recommendations for Selecting and Evaluat-ing Tunnel Boring Machines, Deutscher Ausschuss für un-

Arbabsiar, M.H.; EbrahimiFarsangi, M.A.; Mansouri, H. 72
The Mining-Geology-Petroleum Engineering Bulletin and the authors ©, 2020, pp. 57-74, DOI: 10.17794/rgn.2020.2.6
terirdisches Bauen e. V. (DAUB), German Tunneling Committee (ITA-AITES).
Delisio, A. and Zhao, J. (2013): Review of the TBM Perfor-mance in Blocky Rocks with Potential Face Stability Is-sues. In: Underground - The Way to the Future: Proceed-ings of the World Tunnel Congress. WTC 2013, Geneva, Switzerland, May 31- June 7, 2013, 1179–1186. doi: 10.1201/b14769-162.
Faramarzi, F., Mansouri, H. and Farsangi, M. A.E. (2013): A rock engineering systems based model to predict rock fragmentation by blasting. International Journal of Rock Mechanics and Mining Sciences, 60, 82–94. doi: 10.1016/j.ijrmms.2012.12.045.
Farmer, I. W. and Glossop, N. H. (1980): Mechanics of disk cutter penetration. Tunnels and Tunnelling International, 12, 6, 22–25. doi: 10.1016/0148-9062(80)90769-x.
Farrokh, E., Mortazavi, A. and Shamsi, G. (2006): Evaluation of ground convergence and squeezing potential in the TBM driven Ghomroud tunnel project. Tunnelling and Underground Space Technology, 21, 5, 504–510. doi: 10.1016/j.tust.2005.09.003.
Farrokh, E. (2018): Introducing hard rock TBMs’ downtime analysis model with reference to past case histories’ data. Journal of Mining and Environment, 9, 2, 457–472. doi: 10.22044/jme.2018.6815.1509.
Farrokh, E., Rostami, J. and Laughton, C. (2012): Study of various models for estimation of penetration rate of hard rock TBMs. Tunnelling and Underground Space Techno-logy, Elsevier Ltd, 30, 110–123. doi: 10.1016/j.tust. 2012.02.012.
Fattahi, H. and Moradi, A. (2017): Risk assessment and esti-mation of TBM penetration rate using RES-Based model. Geotechnical and Geological Engineering, 35, 1, 365–376. https://doi.org/10.1007/s10706-016-0111-x
Fattahi, H. and Babanouri, N. (2017): Applying optimized support vector regression models for Prediction of tunnel boring machine performance. Geotechnical and Geologi-cal Engineering, Springer International Publishing, 35, 5, 2205–2217. doi: 10.1007/s10706-017-0238-4.
Ghasemi, E., Yagiz, S. and Ataei, M. (2014): Predicting pene-tration rate of hard rock tunnel boring machine using fuzzy logic. Bulletin of Engineering Geology and the Environ-ment, 73, 1, 23–35. doi: 10.1007/s10064-013-0497-0.
Goel, R. K., Jethwa, J. L. and Paithankar, A. G. (1995): Tun-nelling through the young Himalayas - A case history of the Maneri-Uttarkashi power tunnel. Engineering Geolo-gy, 39, 1–2, 31–44. doi: 10.1016/0013-7952(94)00002-J.
Gong, Q. M. and Zhao, J. (2007): Influence of rock brittleness on TBM penetration rate in Singapore granite. Tunnelling and Underground Space Technology, 22, 3, 317–324. doi: 10.1016/j.tust.2006.07.004.
Gong, Q. M. and Zhao, J. (2009): Development of a rock mass characteristics model for TBM penetration rate prediction. International Journal of Rock Mechanics and Mining Sci-ences, 46, 1, 8–18. doi: 10.1016/j.ijrmms.2008.03.003.
Goodman, R. (1989): Introduction to Rock Mechanics. John Wiley & Sons, Hoboken, New Jersey, 576 p.
Graham, P. C. (1977): Rock Exploration for Machine Manu-facturers. In: Bieniawski, Z. T. (eds.): Exploration for Rock Engineering. Balkema, Rotterdam, 173–180.
Hassanpour, J., Rostami, J., Khamehchiyan, M. and Bruland, A. (2009): Developing new equations for TBM perfor-mance prediction in carbonate-argillaceous rocks: A case history of Nowsood water conveyance tunnel. Geome-chanics and Geoengineering, 4, 4, 287–297. doi: 10.1080 /17486020903174303.
Hassanpour, J., Rostami, J., Khamehchiyan, M., Bruland, A. and Tavakoli, H.R. (2010): TBM performance analysis in pyroclastic rocks: A case history of Karaj Water convey-ance tunnel. Rock Mechanics and Rock Engineering, 427–445. doi: 10.1007/s00603-009-0060-2.
Hassanpour, J., Rostami, J. and Zhao, J. (2011): A new hard rock TBM performance prediction model for project plan-ning. Tunnelling and Underground Space Technology, 26, 5, 595–603. doi: 10.1016/j.tust.2011.04.004.
Hassanpour, J., Vanani, A.A.G., Rostami, J., Cheshomi, A. (2016): Evaluation of common TBM performance predic-tion models based on field data from the second lot of Za-gros water conveyance tunnel (ZWCT2). Tunnelling and Underground Space Technology, Elsevier Ltd, 52, 147–156. doi: 10.1016/j.tust.2015.12.006.
Hoek, E. and Marinos, P. (2000): Predicting tunnel squeezing problems in weak heterogeneous rock masses. Tunnels and Tunnelling International, 32, 45–51.
Howarth, D. F., Adamson, W. R. and Berndt, J. R. (1986): Cor-relation of model tunnel boring and drilling machine per-formances with rock properties. International Journal of Rock Mechanics and Mining Sciences, 23, 2, 171–175. doi: 10.1016/0148-9062(86)90344-X.
Hudson, J. (1992): Rock Engineering Systems, Theory and Practice. Ellis Horwood, Chichester, 196 p.
Hughes, H. M. (1986): The relative cuttability of coal-meas-ures stone. Mining Science and Technology, 3, 2, 95–109. doi: 10.1016/S0167-9031(86)90250-1.
Industrial Training Branch of the National Coal Board. (1981), Mine Gases, National Coal Board of USA.
Innaurato, N., Mancini, R., Rondena, E., Zaninetti, A. (1991): Forecasting and Effective TBM Performances in a Rapid Excavation of a Tunnel in Italy. In: Wittke, W. (eds.): 7th International Congress on Rock Mechanics. Aachen, Ger-many. 1009-1014. doi: 10.1016/0148-9062(93)92171-L.
Jethwa, J. L., Singh, B. and Singh, B. (1984): Estimation of Ultimate Rock Pressure for Tunnel Linings under Squeez-ing Rock Conditions, A New Approach. In: Brown, E.T., and Hudson, J.A. (eds.): Design and Performance of Un-derground Excavations. ISRM Symposium, Cambridge, U.K., September 3-4, 1984, 231–238.
Jung, H. S., Choi, J. M., Chun, B. S., Park, J. S. and Lee, Y. J. (2011): Causes of reduction in shield TBM performance - A case study in Seoul. Tunnelling and Underground Space Technology, 26, 3, 453–461. doi: 10.1016/j.tust.2011. 01.001.
Khademi Hamidi, J., Shahriar, K., Rezai, B. and Rostami, J. (2010c): Performance prediction of hard rock TBM using rock mass rating (RMR) system. Tunnelling and Under-

73 A new model for predicting the advance rate of a Tunnel Boring Machine (TBM) in hard rock conditions
The Mining-Geology-Petroleum Engineering Bulletin and the authors ©, 2020, pp. 57-74, DOI: 10.17794/rgn.2020.2.6
ground Space Technology, 25, 4, 333–345. doi: 10.1016/j.tust.2010.01.008.
Lar Consulting Engineers. (2003): Geotechnical engineering study of Zagros long tunnel, Lar consulting engineers, Tehran, Iran. (In Persian- there is no English abstract)
Lar consulting engineers. (2004): Geotechnical Engineering Study of Zagros Long Tunnel, Lar consulting engineers, Tehran, Iran. (In Persian- there is no English abstract)
Latham, J. P. and Lu, P. (1999): Development of an assessment system for the blastability of rock masses. International Journal of Rock Mechanics and Mining Sciences, 36, 1, 41–55. doi: 10.1016/S0148-9062(98)00175-2.
Lu, P., Hudson, J.A. (1993): A Fuzzy Evaluation Approach to the Stability of Underground Excavations. In: Ribeiro, L., Sousa, E., Grossmann, N. F. (eds.): ISRM Symposium: EUROCK 93. Balkemma, Rotterdam, 615-622.
Lu, P. and Latham, J. (1994): A Continuous Quantitative Cod-ing Approach to the Interaction Matrix in Rock Engineer-ing Systems Based on Grey Systems Approaches. In: Ol-iveira, R. (eds.): Seventh International Congress, Interna-tional Association of Engineering Geology, Lisbon, Portugal, 5-9 September 1994, 4761–4770.
Marinos, P. G. (2001): Tunneling and Mining in Karsticter-rane, an Engineering Challenge. In: Beck, B.F., and Her-ring, J.G. (eds.):Geotecnical and Environmental Applica-tions of Karst Geology and Hydrology. Swets and Zeitlinger, Lisse, Louisville, United State, April 1-4, 3–16.
Mazzoccola, D. F. and Hudson, J. A. (1996): A comprehensive method of rock mass characterization for indicating natu-ral slope instabiblity. Quarterly Journal of Engineering Ge-ology, 29, 1, 37–56. doi: 10.1144/GSL.QJEGH.1996.029.P1.03.
McFeat-Smith, I. (1977): Rock Property Testing for the Assess-ment of Tunnelling Machine Performance. Tunnels Tunnel-ling, 9, 2, 29–33. doi: 10.1016/0148-9062(77)90102-4.
Montgomery, D.C., Peck, E.A. (1992): Introduction to Linear Regression Analysis, Wiley, New York, 544 p.
Moradi, M.R. and Farsangi, M.A.E. (2014): Application of the risk matrix method for geotechnical risk analysis and pre-diction of the advance rate in rock TBM tunneling. Rock Mechanics and Rock Engineering, 47, 1951–1960. https://doi.org/10.1007/s00603-013-0464-x
Namli, M. and Bilgin, N. (2017): A model to predict daily ad-vance rates of EPB-TBMs in a complex geology in Istan-bul. Tunnelling and Underground Space Technology. Else-vier Ltd, 62, 43–52. doi: 10.1016/j.tust.2016.11.008.
Ozdemir, L. (1977): Development of Theoretical Equations for Predicting Tunnel Boreability. Ph.D thesis. Colorado school of mines, USA.
Ozdemir, L., Miller, R., Wang, F.D. (1978): Mechanical tunnel boring prediction and machine design annual report. Inter-national Journal of Rock Mechanics and Mining Sciences & Geomechanics Abstracts, 15, 5, A105. doi: 10.1016/0148-9062(78)91060-4.
Palmström, A. (1995): RMi – A Rock Mass Characterization System for Rock Engineering Purposes. Ph.D thesis, Oslo University, Norway, 1995, 400 p.
Pang, S. S., Goldsmith, W. and Hood, M. (1989): A force-in-dentation model for brittle rocks. Rock Mechanics and Rock Engineering, 22, 2, 127–148. doi: 10.1007/BF015 83958.
Ping, L. (1993): A Fuzzy Evaluation Approach to the Stability of Underground Excavations. In: Ribeiro, E., Sousa, L, Grossmann, N.F. (eds): Proceeding ISRM International Symposium-EUROCK 93. International Society for Rock Mechanics. 21-24 June 1993, Lisbon, Portugal, 615–622.
Ramoni, M. and Anagnostou, G. (2010): Tunnel boring ma-chines under squeezing conditions. Tunnelling and Under-ground Space Technology, 25, 2, 139–157. doi: 10.1016/j.tust.2009.10.003.
Rostami, J. (1997) Development of a Force Estimation Model for Rock Fragmentation with Disc Cutters through Theo-retical Modeling and Physical Measurement. Ph.D thesis, Colorado school of mines, USA.
Rostami, J. (2015): Performance prediction of hard rock Tun-nel Boring Machines (TBMs) in difficult ground. Tunnel-ling and Underground Space Technology. Elsevier Ltd, 57, 173–183. doi: 10.1016/j.tust.2016.01.009.
Rostami, J. and Ozdemir, L. (1993): New Model for Perfor-mance Production of Hard Rock TBMs. In: Bowerman, L. D. (eds.): Proceedings - Rapid Excavation and Tunneling Conference, Boston, 13-17 June, 793–809.
Roxborough, F. F. and Phillips, H. R. (1975): Rock excavation by disc cutter. International Journal of Rock Mechanics and Mining Sciences and, 12, 12, 361–366. doi: 10.1016 /0148-9062(75)90547-1.
Salimi, A., Rostami, J., Moormann, C., Delisio, A. (2017): Ex-amining Feasibility of Developing a Rock Mass Classifi-cation for Hard Rock TBM Application Using Non-linear Regression, Regression Tree and Generic Programming. Geotechnical and Geological Engineering, Springer Inter-national Publishing, 1–15. doi: 10.1007/s10706-017-0380-z.
Sanio, H. P. (1985): Prediction of the performance of disc cut-ters in anisotropic rock. International Journal of Rock Me-chanics and Mining Sciences and, 22, 3, 153–161. doi: 10.1016/0148-9062(85)93229-2.
Sapigni, M., Berti, M., Bethaz, E.,Busillo, A., Cardone, G. (2002): TBM performance estimation using rock mass classifications. International Journal of Rock Mechanics and Mining Sciences, 39, 6, 771–788. doi: 10.1016/S1365-1609(02)00069-2.
Sato, K., Gong, F. M. and Itakura, K. (1991): Prediction of Disc Cutter Performance using Circular Rock Cutting Rig. In: Ozdemir, L., King, R., Hanna, K., (eds.): Proceeding International Symposium on Mine Mechanization and Au-tomation. Golden Colorado June 10-13, 1991, 1.31-1.40.
Shang, Y., Xue, J., Wang, S., Yang, Z. and Yang, J. (2004): A case history of tunnel boring machine jamming in an inter-layer shear zone at the Yellow river diversion project in China. Engineering Geology, 71, 3–4, 199–211. doi: 10.1016/S0013-7952(03)00134-0.
Shaterpour Mamaghani, A.,Tumac, D., Avunduk, E. (2015): Double shield TBM performance analysis in difficult ground conditions: a case study in the Gerede water tunnel,

Arbabsiar, M.H.; EbrahimiFarsangi, M.A.; Mansouri, H. 74
The Mining-Geology-Petroleum Engineering Bulletin and the authors ©, 2020, pp. 57-74, DOI: 10.17794/rgn.2020.2.6
Turkey. Bulletin of Engineering Geology and the Environ-ment, 75, 1, 10.1007/s10064-015-0743-8.
Shin, H. S., Kwon, Y. C., Jung, Y. S., Bae, G. J. and Kim, Y. G. (2009): Methodology for quantitative hazard assessment for tunnel collapses based on case histories in Korea. Inter-national Journal of Rock Mechanics and Mining Sciences, 46, 6, 1072–1087. doi: 10.1016/j.ijrmms.2009.02.009.
Singh, B., Jethwa, J. L., Dube, A. K. and Singh, B. (1992): Correlation between observed support pressure and rock mass quality. Tunnelling and Underground Space Technol-ogy incorporating Trenchless, 7, 1, 59–74. doi: 10.1016 /0886-7798(92)90114-W.
Snowdon, R. A., Ryley, M. D. and Temporal, J. (1982): A study of disc cutting in selected British rocks. International Journal of Rock Mechanics and Mining Sciences and, 19, 3, 107–121. doi: 10.1016/0148-9062(82)91151-2.
Tumac, D., Balci, C., Bilgin, N., Copur, H. (2012): Compari-son of Cutting Forces for V-type Disc Cutter and Perfor-mance Prediction of TBM Using Portable Linear Rock Cutting Machine (PLCM). In: 7th Asia Rock Mechanic Symposium (ARMS2012), Seoul, Korea, 15-19 October, 1156-1165
Yagiz, S. (2002): Develpment of Rock Fracture and Brittle-ness Indices to quantify the Effects of Rock Mass Features and Toughness in the CSM Model Basic Pentration for
Hard Rock Tunneleng Machines. Ph.D thesis, Colorado school of mines, USA.
Yagiz, S. (2008): Utilizing rock mass properties for predicting TBM performance in hard rock condition. Tunnelling and Underground Space Technology, 23, 3, 326–339. doi: 10.1016/j.tust.2007.04.011.
Yagiz, S., Gokceoglu, C., Sezer, E. and Iplikci, S. (2009): Ap-plication of two non-linear prediction tools to the estima-tion of tunnel boring machine performance. Engineering Applications of Artificial Intelligence, 22, 4–5, 818–824. doi: 10.1016/j.engappai.2009.03.007.
Yagiz, S. and Karahan, H. (2011): Prediction of hard rock TBM penetration rate using particle swarm optimization. International Journal of Rock Mechanics and Mining Sci-ences, 48, 3, 427–433. doi: 10.1016/j.ijrmms.2011.02.013.
Yagiz, S. and Ozdemir, L. (2001): Geotechnical Parameters Influencing the TBM Performance in Various Rocks. In Miller, J.D. (eds.): program with abstract, 44th Annual Meeting of Association of Engineering Geologists. Saint Louis, Missouri, USA.
Zhao, Z., Gong, Q., Zhang, Y. and Zhao, J. (2007): Prediction model of tunnel boring machine performance by ensemble neural networks. Geomechanics and Geoengineering, 2, 2, 123–128. doi: 10.1080/17486020701377140.
SAžETAK
Novi model za predviđanje napredovanja tunelskoga bušaćeg stroja u tvrdim stijenama
Predviđanje brzine napredovanja tunelskoga bušaćeg stroja u tvrdim stijenama jedna je od najvažnijih stvari kod procje-ne vremena i troškova izradbe tunela. Prikazana je priprema stijenskoga inženjerskog sustava, modela kojim se predviđa geotehnički rizik (ovisan o svojstvima stijena) kod izradbe tunela bušaćim strojevima. Uporabljeno je 15 varijabli koje utječu na spomenuti rizik. Na temelju 5 ekspertnih mišljenja postavljena je interakcijska matrica i rangiranje varijabli. Indeks ranjivosti, kao izvedenica geotehničkoga rizika, izračunan je za 2058 (od ukupno 2168) skupova podataka, uzor-kovanih u 55 geoloških zona kroz 11 km dugačak tunel Zagros. U sljedećemu koraku proučeni su operativni parametri strojeva poput okretnoga momenta, rotacije glave sjekača po minuti, sile na glavi te svojstava stijena (prikazanih indek-som ranjivosti). Oni su bili ulazne varijable, a iznos napredovanja izlazna. Na temelju 2058 podataka izračunane su line-arne i nelinearne višestruke regresije. Dodatnih 110 podataka (nisu korišteni za modeliranje) uporabljeni su za provjeru regresijskih (i drugih) modela. Rezultati su pokazali kako novi linearni model, s vrijednostima R2 = 0,83 i RMSE = 0,12, ima bolja svojstva nego drugi razmatrani modeli.
Ključne riječi:iznos napredovanja, regresijski model, geotehnički rizik, inženjerski sustav stijena, bušenje u tvrdim stijenama, tunel Zagros
Authors contribution
Mohammad Hossein Arbabsiar (Ph.D. candidate) initialized the idea, completed literature review and participated in all work stages, such as data analysis and fieldwork and executed data analysis and tested its accuracy. Mohammad Ali Ebrahimi Farsangi (Associate Professor) and Hamid Mansouri (Associate Professor) managed the whole process and supervised it from the beginning to the end.