Embed Size (px)
Citation preview

A new mineral from the Bellerberg, Eifel, Germany, intermediate between mullite and sillimanite
ReinhaRd X. FischeR1,*, ValeRia TikhonoVa1, Johannes BiRkensTock1, lennaRT a. FischeR2, klaus heRRmann3, kuRT mengel3 and haRTmuT schneideR1,4
1Fachbereich Geowissenschaften, Universität Bremen, Klagenfurter Strasse, D-28359 Bremen, Germany2Institut für Mineralogie, Leibniz Universität Hannover, Callinstrasse 3, D-30167 Hannover, Germany
3Institut für Endlagerforschung, TU Clausthal, Adolph-Roemer-Strasse 2A, D-38678 Clausthal-Zellerfeld, Germany4Institut für Kristallographie, Universität zu Köln, Greinstrasse 6 D-50939 Köln, Germany
aBsTRacT
A mineral intermediate between sillimanite and mullite, tentatively designated as “sillimullite,” was studied by electron microprobe analyses and single-crystal X-ray diffraction methods. The chemical compositions derived from the microprobe results and the crystal-structure refinement are Al7.84Fe0.18
Ti0.03Mg0.03Si3.92O19.96 and Al8.28Fe0.20Si3.52O19.76 (Fe is Fe3+) corresponding to x-values of 0.02 and 0.12, respectively, in the solid-solution series Al8+4xSi4–4xO20–2x assigning Fe3+, Ti, and Mg to the Al site. The composition derived from microprobe analysis is very close to a stoichiometric sillimanite (with Fe3+,Ti, and Mg assigned to Al sites), while the composition derived from diffraction data is midway between sillimanite and Si-rich mullites. The discrepancy is assumed to be caused by the occurrence of amorphous nano-sized SiO2 inclusions in the aluminosilicate phase not affecting the diffraction data but detected in the microprobe analysis. “Sillimullite” crystallizes in the orthorhombic space group Pnam with a = 7.5127(4), b = 7.6823(4), c = 5.785(3) Å, V = 333.88(4) Å3, Z = 1. It has a complete Si/Al ordering at tetrahedral sites like sillimanite but with neighboring double chains of SiO4 and AlO4 tetrahedra being offset by ½ unit cell parallel to c relative to each other causing the change of the space-group setting from Pbnm (sillimanite) to Pnam. Difference Fourier calculations and refine-ments with anisotropic displacement parameters revealed the formation of oxygen vacancies and triclusters as known in the crystal structures of mullite. Final refinements converged at R1 = 5.9% for 1024 unique reflections with Fo > 4s(Fo). Fe was found to reside predominantly in the octahedral site and with minor amounts in one of the T* sites. Mg and Ti were not considered in the refinements. The crystal studied here is considered to represent a new mineral intermediate between sillimanite and mullite, named “sillimullite.”
Keywords: Sillimullite, new mineral, crystal structure, electron microprobe, sillimanite, mullite
inTRoducTion
Burnham (1964) mentioned that the mullite structure theoreti-cally fits to any composition between x = 0 and x = 1 with respect to the general formula Al4+2xSi2–2xO10–x. The main compounds are sillimanite (x = 0), 3/2-mullite (x = 0.25), and 2/1-mullite (x = 0.4, see, e.g., Fischer and Schneider 2005). Alumina with a hypothetical mullite-type structure (i-alumina, x = 1) was de-scribed by Perrotta and Young (1974) but most probably contains alkaline elements as discussed by Fischer and Schneider (2005). More recently, Ebadzadeh and Sharifi (2008) published data on the synthesis of pure i-alumina, but structural details were not given. Numerous studies in this research field have shown that the situation is complicated. Synthetic mullites normally have com-positions 0.25 ≤ x ≤ 0.40 where the lower x-value corresponds to 60 mol% Al2O3 (3/2-mullite, 3Al2O3·2SiO2, x = 0.25), and the upper x-value to 66.7 mol% Al2O3 (2/1-mullite, 2Al2O3·SiO2, x = 0.40). 3/2-mullites have been designated as “sinter-mullites,” since they are often formed by solid-state reactions. 2/1-mull-ites usually grown from melts are termed “fused-mullites.”
Compounds intermediate in composition between 3/2 and 2/1 mullite are formed by sol-gel based processes and by annealing 3/2-mullites at temperatures >1600 °C. Schneider et al. (1993) described an Al2O3-rich phase with x = 0.83 (89 mol% Al2O3), which was prepared using specific sol-gel routes. However, increasing Al2O3 content destabilizes the mullite structure. This especially comes true at Al2O3 contents >80 mol% (x = 0.67). In this composition range the tetrahedral triclusters, being typical for mullite, are gradually replaced by tetrahedral tetraclusters, where 4 tetrahedra are connected by a bridging oxygen atom instead of 3 in the case of the triclusters. At the SiO2-rich side of the Al2O3-SiO2 system at x < 0.25 a miscibility gap toward sillimanite (x = 0) is assumed under ambient pressure. The occurrence of the miscibility gap can be explained by the dif-ferent ordering schemes of sillimanite and mullite. On the other hand, the question whether phases with compositions between sillimanite (x = 0) and 3/2-mullite (x = 0.25) exist is still con-troversial. A continuous isomorphic series between sillimanite and 3/2-mullite was proposed by Ďurovič (1962) and Hariya et al. (1969). On the basis of high-temperature and high-pressure experiments they demonstrated that compositions between sil-limanite and mullite can be achieved by varying the pressure
American Mineralogist, Volume 100, pages 1493–1501, 2015
0003-004X/15/0007–1493$05.00/DOI: http://dx.doi.org/10.2138/am-2015-4966 1493
* E-mail: [email protected]

FISCHER ET AL.: SILLIMULLITE1494
and temperature conditions in the synthesis process. However, Hariya et al. (1969) gave no information on the crystal structures of theses phases. On the other hand, Cameron (1976a) interpreted the coexistence of sillimanite and mullite in natural rocks as an evidence for the presence of a miscibility gap between the two phases. Further on, Cameron (1976b) described a naturally occurring mineral phase intermediate in composition between sillimanite and mullite. This, however, contained an appreciable amount of Fe, and it was suspected that iron might stabilize this compound. In a subsequent work he states “If Ti is absent, Fe3+ can stabilize the Si-Al ordering scheme characteristic of 1:1 sil-limanite to well into the previously known mullite composition range” (Cameron 1977).
Although natural mullites, mullite-type alumino silicates with compositions midway between sillimanite and 3/2-mullite (Cameron 1976b), and phases approaching sillimanite in composition can be found in nature (e.g., Fischer and Schneider 2005), no structure refinement data are available so far. This is surprising since there is no paucity of suitable specimens. The present study intends to fill this gap by providing data on a mineral that has a composition intermediate between sillimanite and Si-rich mullite, but which has a crystal structure distinctly different from both. A proposal on this mineral has been submitted to the IMA commission for new minerals just recently. Therefore, the name “sillimullite” is not approved yet, but used here as a tentative name for this species.
eXpeRimenTal meThodsThe “sillimullite” crystal (slightly pink color, acicular habit, approximately
0.2 × 0.02 × 0.02 mm3) was separated from a rock sample collected in the basalt quarry Caspar at the Ettringer Bellerberg near Mayen (Eifel area, Germany). The crystal was mounted on a Bruker D8 Venture single-crystal diffractometer with MoKa1-Ka2 radiation (classic tube at 50 kV, 30 mA) equipped with a curved Triumph monochromator, a 0.6 mm collimator, a four-circle diffractometer (k geometry) and a Photon 100 CMOS area detector (Fachbereich Geowissenschaften, University of Bremen). Data collection parameters and crystal data are listed in Table 1. After data collection, the crystal was prepared for electron microprobe analyses using two different Cameca instruments at Universities of Hannover and Clausthal to ensure the reproducibility of the results. Instrumental parameters and setups for both instruments are listed in Table 2. At Leibniz Universität Hannover, the Cameca SX100 microprobe was equipped with five spectrometers having a static (fixed) beam. Standards were wollastonite for Si, corundum for Al, rutile for Ti, hematite for Fe, and periclase for Mg. The Cameca SX100 at TU Clausthal had four spectrometers. Pyrope was used as a standard for Si, Al, Fe, Mg, and Ti, boron nitride and a borosilicate glass (DURAN) for B. Both instruments were operated with an acceleration voltage of 15 kV and a beam current of 15 nA with a counting time of 10 s. The matrix correction PAP was done after Pouchou and Pichoir (1991). Upon preparation the polished crystal split parallel to its long c axis into two main parts. One of the two parts was slightly tilted relative to the plane of preparation and thus yielded inaccurate signals. This was checked by rotating the sample by 180° to confirm that the difference in the detected intensity was due to the effect of the tilt on the instrument and not to differences in chemical composition between the left and right parts of the crystal. Turning the sample is equivalent to switching opposite spectrometers of the microprobe, each of them being sensitive for either Si or Al analyses. Therefore, the signals from the tilted half are different for opposite spectrometers and the results from the left part of the crystal (Fig. 1) were excluded from calculating the average composition. Results are given in Table 2 corresponding to the analyzed spots shown in Figure 1 yielding the average composition of 61.2(5) wt% Al2O3, 36.1(4) wt% of SiO2, 2.2(2) wt% Fe2O3, 0.3(1) wt% TiO2, and 0.21(4) wt% MgO corresponding to 49.0(4) mol% Al2O3, 49.1(5) mol% SiO2, 1.1(1) mol% Fe2O3, 0.35(12) mol% TiO2, and 0.42(8) mol% MgO. The resulting atomic compositions per unit cell are listed in Table 2b. This corresponds to a normalization of the atomic composition to 12 cations. Assuming that all Fe is Fe3+ replacing Al together with Ti and Mg this yields a chemical composition of Al7.84(5)Fe0.180(17)Ti0.028(10)Mg0.033(6)Si3.92(4)O19.96(2) based on the standard mullite composition with doubled unit-cell volume (Al,Fe)8+4xSi4–4xO20–2x
corresponding to an x-value of 0.02. Great care was bestowed on the detection of boron in “sillimullite.” Boron is an
essential constituent of grandidierite (Dzikowski et al. 2007), a mineral related to mullite that is reported intergrown with it at the Bellerberg (Blass and Graf 1994). Even sillimanite has been reported to contain small amounts of boron (Grew and Hinthorne 1983; Grew and Rossman 1985). However, no boron could be found within the detection limits (<0.3 wt%) of the electron microprobe using the Cameca PC3 (Mo/B4C multilayer) spectrometer.
A careful analysis of systematic absences of reflections was done with the crystallographic computing system Jana2006 (Petříček et al. 2006). The program SHELXL-97 (Sheldrick 1997, 2008) as part of the WINGX suite (Farrugia 1999) was used for the crystal-structure refinements. (CIF is available1.) Crystal structure projections were drawn with the program STRUPLO (Fischer and Messner 2013).
ResulTs
The inspection of layers in reciprocal space immediately revealed the superstructure reflections causing the doubling of the c lattice parameter of “sillimullite” with respect to the standard mullite unit cell resembling the metrical parameters of sillimanite. Figure 2 shows a characteristic layer calculated from the observed intensities. It was carefully checked that the superstructure reflections are not caused by l/2-effects of the X-ray beam: If they were caused by this effect the intensity ratios between superstructure reflections hkl (with l = 2n+1) and the respective 2h2k2l reflections would exhibit a constant value. This was not the case and in some cases the intensity of the super-
Table 1. Data collection parameters, refinement details, and crystal data
Crystal dataChemical composition from microprobe analyses Al7.84Fe0.18Ti0.03Mg0.03Si3.92O19.96, x = 0.02a
Chemical composition from crystal-structure analysis Al8.28Fe0.20Si3.52O19.76, x = 0.12a
Space group PnamZ 1a (Å) 7.5127(4)b (Å) 7.6823(4)c (Å) 5.7849(7)V (Å3) 333.87(4)
Data collection and refinementTemperature (K) 298no. of measured reflections 24067no. of unique reflections 1577no. Fo > 4s(Fo) 1024range of h, k, l |h| ≤ 15, |k| ≤ 15, |l| ≤ 11q-max (°) 46.53no. parameters 70no. constraints 0Rint/Rs
b 0.0797/0.0308R1/R1 > 4s(Fo)b 0.092/0.059wR2b 0.1234GoFb 1.139min D (eÅ-3) –1.14, 0.34 Å from T(Al)max D (eÅ-3) 0.96, 0.56 Å from O11a x refers to the solid-solution series Al4+2xSi2–2xO10–x (or Al8+4xSi4–4xO20–2x) assigning Fe, Ti, and Mg to the Al site. It represents the number of oxygen vacancies in the unit cell of mullite with c(mullite) = ½ c(“sillimullite”).
b Rint =∑ Fo
2−Fo2 mean( )
∑Fo2
, Rσ =∑σ Fo
2( )∑Fo
2, R1=∑ Fo − Fc
∑ Fo, wR2= ∑w Fo
2−Fc2( )2
∑w Fo2( )2
⎛
⎝
⎜⎜⎜⎜⎜⎜⎜
⎞
⎠
⎟⎟⎟⎟⎟⎟⎟⎟,
w= 1
σ Fo2( )( )
2+ 0.0278⋅P( )2+1.35⋅P
, P=max Fo
2 ,0( )+2 ⋅Fc23
, GoF = ∑w Fo2−Fc
2( )2
n− p.
n = number of reflections, p = total number of parameters refined.
1 Deposit item AM-15-74966, CIF. Deposit items are stored on the MSA web site and available via the American Mineralogist Table of Contents. Find the article in the table of contents at GSW (ammin.geoscienceworld.org) or MSA (www.minsocam.org), and then click on the deposit link.

FISCHER ET AL.: SILLIMULLITE 1495
structure reflection was even stronger than that of the respective 2h2k2l reflection. Furthermore for strong hkl reflections we did not observe any l/2 reflections h/2 k/2 l/2 at positions that are not imposed by the 2c superstructure (e.g., in the hk0 layer).
The orthorhombic unit cell was chosen to conform to a set-ting with lattice parameters a < b representing the usual setting known for sillimanite and mullite. In this setting, the evaluation of the intensities with Jana (Petříček et al. 2006) revealed a clear preference for space group setting Pnam, rather than Pbnm, the latter corresponding to the standard setting of sillimanite. In the Pbnm setting 186 systematic absence violations of reflections with I > 4s were found while none are present in the Pnam set-ting. Alternatively, space-group setting Pbnm could be achieved if basis vectors a and b were interchanged. But this would not fit to the normal evolution of the lattice parameters on the silica-rich part of the diagram in Figure 3 with b > a. Therefore, space-group setting Pnam was used for the description of the crystal structure.
Structural relationships between the two settings are discussed in the general description paragraph of the discussion section.
Subsequently, atom positions were generated by transform-ing the coordinates of sillimanite (Yang et al. 1997) to Pnam. At this stage, a pure Al2SiO5 sillimanite composition was assumed ignoring Fe, Mg, and Ti. Refinement with isotropic displace-ment parameters converged at R1 = 13.4% for 1024 reflections with Fo > 4s(Fo). Difference Fourier calculations immediately revealed maxima of about 5 e/Å3 at positions corresponding to T* atoms in mullite (but here with doubled lattice parameter c). The deepest trough is observed at the O3 (also designated Oc in the mullite literature) position clearly indicating a preference for the mullite-type model with oxygen vacancies. Consequently, a series of refinements was performed varying the chemical composition toward the composition of mullite. Plotting the residual in Figure 4 vs. the x-value in Al8+4xSi4–4xO20–2x yielded a composition from crystal-structure refinement with x = 0.12 corresponding to Al8.48Si3.52O19.76. Final refinements with mixed occupancies of Al and Fe on the octahedral and the T*2 position and all atoms but O41 and O42 with anisotropic displacement parameters converged at R1 = 5.9%. Residual electron density of about 1 e/Å3 shows that the crystal structure is essentially
Table 2a. Electron microprobe analyses of “sillimullite”Spot SiO2 Al2O3 Fe2O3 TiO2 MgO Total
Leibniz Universität Hannover1 35.02 59.65 2.11 0.33 0.22 97.322 35.34 60.47 2.13 0.44 0.22 98.597 36.60 60.62 2.32 0.27 0.23 100.04
TU Clausthal5 36.21 60.32 2.56 0.34 0.20 99.626 36.59 61.06 2.49 0.31 0.20 100.657 36.20 62.14 1.97 0.14 0.12 100.568 36.13 62.01 2.23 0.37 0.26 101.019 37.24 62.11 2.16 0.52 0.18 102.2110 35.66 62.61 2.11 0.52 0.20 101.1011 36.75 62.01 2.03 0.41 0.22 101.4312 36.44 62.53 1.95 0.18 0.17 101.2713 36.23 61.96 2.39 0.27 0.25 101.10
mean over all12 spots 36.1(6) 61.2(1.0) 2.2(2) 0.3(1) 0.21(4) 100(2)sillimanite 37.1 62.9 3/2-mullite 28.2 71.8 Notes: Results are given in weight percent. Average composition derived from all spots (Hannover and Clausthal) listed above scaled to 100 wt% with standard deviations for the last significant digit in parentheses, compared to correspond-ing compositions of pure sillimanite and 3/2-mullite.
Table 2b. Electron microprobe analyses recalculated to atomic com-position per unit cell
Spot Si Al Fe Ti Mg OLeibniz Universität Hannover
1 3.910 7.849 0.177 0.028 0.037 19.9502 3.895 7.855 0.177 0.036 0.036 19.9487 3.981 7.770 0.190 0.022 0.037 19.983
TU Clausthal5 3.958 7.771 0.211 0.028 0.033 19.9776 3.957 7.783 0.203 0.025 0.032 19.9757 3.906 7.903 0.160 0.011 0.019 19.9498 3.886 7.861 0.181 0.030 0.042 19.9379 3.964 7.792 0.173 0.042 0.029 19.98910 3.830 7.925 0.171 0.042 0.032 19.92011 3.938 7.831 0.164 0.033 0.035 19.96812 3.905 7.897 0.157 0.015 0.027 19.94613 3.895 7.850 0.193 0.022 0.040 19.938
Average compositiona
mean over all Si Al Fe Ti Mg O12 spots 3.92(4) 7.84(5) 0.180(17) 0.028(10) 0.033(6) 19.96(2)sillimanite 4 8 3/2-mullite 3 9 a Average composition per unit cell derived from all spots (Hannover and Clausthal) compared to corresponding compositions of pure sillimanite and 3/2-mullite.
FiguRe 1. Microprobe images of “sillimullite” obtained on two different instruments with instrumental parameters listed in Table 2. (a) Leibniz Universität Hannover. (b) TU Clausthal.
a
b

FISCHER ET AL.: SILLIMULLITE1496
correct but might indicate that split positions could be possible due to the local distortions around the oxygen vacancies. Final atomic parameters are listed in Table 3 and selected interatomic distances in Table 4.
discussion
General descriptionThe chemical composition of the new phase “sillimullite”
derived from electron microprobe analyses is very close to that of sillimanite (Table 2). Contrary to this, the Al2O3 composition
calculated from crystal structure refinement on the basis of the single-crystal diffraction data (Table 1) is significantly higher. The discrepancy between both data sets is shown in Figure 3 where the lattice parameters are plotted vs. the Al2O3 content. Lattice parameter a plotted for the composition determined from the crystal-structure refinement (green cross) follows closely the linear trend observed for mullites while the corresponding param-eter for the microprobe results (red cross) is clearly off this trend.
Similarly, plotting the lattice parameters vs. Fe2O3 mole frac-tions in Figure 5 shows that “sillimullite” is distinctly different from sillimanite. The data points of “sillimullite” are compared with those of iron bearing sillimanites taken from Table 6 in Grew (1980). While b follows the linear trend pretty well, a and c are significantly higher than the corresponding values for the sillimanites.
The results of the crystal-structure refinement revealed that the mineral species studied here, designated as “sillimullite,” neither corresponds to sillimanite nor to mullite. On the one hand, it has an ordering scheme with a Si/Al distribution similar to sil-limanite causing the doubling of c with respect to that of mullite. On the other hand, it has the oxygen vacancies coupled with the formation of triclusters typical for mullite. The distribution of Si and Al is strictly alternating in an individual zweier double chain of TO4 (T = Al,Si) tetrahedra but it is shifted by ½ of a unit cell in c for neighboring chains as compared with sillimanite shown in Figure 6a. For an easier comparison, oxygen vacancies and triclusters are omitted in the structure projections of “sillimullite” in Figure 6. Figure 6c shows the crystal structure transformed to the Pbnm setting by interchanging a and b axes representing the space-group setting of sillimanite but having another orientation of the octahedral and tetrahedral chains as compared with sil-limanite or mullite. The octahedral axis in the a-b plane is closer to b-axis in the Pnam setting shown in Figure 6b in agreement with the orientation of the octahedra in sillimanite (Fig. 6a) and the description of mullite and mullite-type compounds with symmetries lower than tetragonal (Fischer and Schneider 2005, 2008; Fischer et al. 2012). Figure 7 shows the crystal structure including oxygen vacancy and tricluster formation.
The biggest puzzle in this investigation was the evaluation of the chemical composition of “sillimullite” as determined from microprobe analyses and from crystal structure refinements. The chemical composition was checked carefully on two different
FiguRe 2. 0kl layer of the “sillimullite” crystal calculated from all 2D frames of the full data set. View parallel to a*, c* pointing down, b* pointing right. Inset in the upper right with enlarged central area: The smaller gray frame refers to the “sillimullite” reciprocal unit cell, the larger white one to mullite, indicating the doubling of c in “sillimullite.”
FiguRe 3. Lattice parameters of the Al4+2xSi2–2xO10–x aluminosilicate solid-solution series with mullite-type structures from sillimanite (50 mol% Al2O3) and hypothetical i-alumina (100 mol% Al2O3). The a and b parameters are scaled to the left ordinate, c to the right one being halved for sillimanite and “sillimullite” for comparison with mullite. Red crosses indicate compositions derived from microprobe analyses, green crosses refer to the results of the structure refinement with Fe assigned to Al. Black crosses represent average values for sillimanite calculated from the five entries in Table 5. Modified from Figure 1.1.13 of Fischer and Schneider (2005) to include data on sillimanite and “sillimullite.”
FiguRe 4. Residual R1 plotted vs. x-value in Al8+4xSi4–4xO20–2x.

FISCHER ET AL.: SILLIMULLITE 1497
electron microprobes and yielded Al2O3 contents close to that of sillimanite. The diffraction-derived chemical composition deviated from the microprobe data in showing significantly higher Al2O3 contents than in sillimanite, and there was no doubt from the refinements that the crystal contains oxygen vacancies accompanied by tricluster formation. At present, the most probable explanation of the discrepant data would be a segregation process of amorphous nanosized SiO2 particles in an aluminosilicate matrix being slightly enriched in Al2O3 with respect to sillimanite. Such amorphous nanosized SiO2 particles would be detected by the microprobe but they would not affect the diffraction intensities. Comparable SiO2 exsolution from a sillimanite matrix were described by Holland and Carpenter (1986) investigating the behavior of sillimanite at high pressure and temperature by transmission electron microscopy (TEM). Holland and Carpenter (1986) mentioned that sillimanite at p ≈ 1.8–2 GPa and T ≈ 1300 to 1700 °C transforms to a gradually disordered sillimanite enriched in Al2O3 (up to x ≈ 0.1), ac-companied by a SiO2-rich glass phase (<0.1 mm). Rahman et al. (2001) described the complete transformation of sillimanite to 3/2-mullite with precipitations of amorphous SiO2 upon thermal treatment at 1600 °C for 24 h. Here the SiO2 is formed in nano-sized channels parallel to the c-axis of the former sillimanite (Schneider and Schmücker 2005). If the reaction had not gone to completion, coexisting sillimanite and mullite are found and
exsolved SiO2 might be present in the sillimanite cavities or on its surface. Guse et al. (1979) pointed out that silica does not crystallize in the mullitization process at 1600 °C being present in glassy form. Annealing of an Fe-bearing sillimanite at 1675 °C and 2 GPa for 12 min yielded a partial transformation to mullite accompanied by partial melting. The small exsolved precipitates (<100 nm) were rich in SiO2 (80 wt%) as determined by analyti-cal transmission electron microscopy (ATEM). The exsolution of SiO2 according to 3Al2SiO5 → 3/2-mullite + SiO2 is also the common reaction during the high-temperature induced transfor-mation of the mullite-type aluminosilicate andalusite (Hülsmans et al. 2000a, 2000b).
Table 3. Atomic coordinates, Wyckoff positions, site occupancies (occ.), and anisotropic displacement parameters (Å2)Atom Wyck. x y z Occ. Ueq (Å2)(Al,Fe) 4a 0 0 0 0.958/0.042(4) 0.0056(2)T(Al) 4c 0.1488(1) 0.3400(1) 0.25 1.0 0.0080(2)T(Si) 4c 0.14668(9) 0.34296(9) 0.75 0.88 0.0036(1)T*1(Al) 4c 0.2627(17) 0.2076(17) 0.25 0.06 0.006(2)T*2(Al,Fe) 4c 0.259(2) 0.204(2) 0.75 0.052/0.008(4) 0.011(3)O11 4c 0.3669(2) 0.4171(3) 0.25 1.0 0.0082(3)O12 4c 0.3490(2) 0.4261(3) 0.75 1.0 0.0089(3)O2 8d 0.1265(2) 0.2221(2) –0.0116(2) 1.0 0.0093(2)O3 4c –0.0004(4) 0.5075(4) 0.25 0.82 0.0128(4)O41 4c 0.451(4) 0.048(5) 0.25 0.06 0.008(5)a
O42 4c 0.450(5) 0.054(5) 0.75 0.06 0.009(5)a
Atom U11 U22 U33 U23 U13 U12
(Al,Fe) 0.0056(3) 0.0056(3) 0.0055(3) –0.0004(2) –0.0002(2) 0.0002(2)T(Al) 0.0078(3) 0.0083(3) 0.0078(3) 0 0 0.0000(2)T(Si) 0.0029(2) 0.0043(3) 0.0036(3) 0 0 –0.0007(2)T*1(Al) 0.005(4) 0.007(4) 0.005(4) 0 0 0.001(4)T*2(Al,Fe) 0.012(6) 0.013(5) 0.009(5) 0 0 –0.003(4)O11 0.0068(6) 0.0114(7) 0.0065(6) 0 0 –0.0032(5)O12 0.0066(6) 0.0122(7) 0.0080(6) 0 0 –0.0040(6)O2 0.0097(4) 0.0083(4) 0.0098(4) –0.0005(4) 0.0007(4) –0.0030(3)O3 0.0140(9) 0.0109(9) 0.0134(9) 0 0 0.0062(8)a Isotropic displacement parameters.
Table 4. Selected interatomic distances (Å)octahedron T(Al)-O4 T(Si)-O4
2×(Al,Fe)-O11 1.870(1) Al-O3 1.707(4) Si-O3 1.590(4)2×(Al,Fe)-O12 1.924(1) Al-O11 1.742(2) Si-O12 1.649(2)2×(Al,Fe)-O2 1.954(1) 2×Al-O2 1.772(1) 2×Si-O2 1.670(1)mean 1.916 mean 1.748 mean 1.645
T1*(Al)-O4+1 T2*(Al,Fe)-O4+1
Al-O11 1.79(1) 2×(Al,Fe)-O2 1.709(8)2×Al-O2 1.830(7) (Al,Fe)-O42 1.82(4)Al-O41 1.87(3) (Al,Fe)-O12 1.84(1)Al-O12 2.32(1) (Al,Fe)-O11 2.40(1)mean 4 1.83 mean 4 1.77mean 5 1.93 mean 5 1.90
FiguRe 5. Lattice parameters plotted vs. molar fractions of Fe2O3 in “sillimullite” (diamond symbol) in comparison to those of iron-bearing sillilmanites (crosses) given by Grew (1980).
FISCHER ET AL.: SILLIMULLITE1498
Taking into account that just one SiO2 formula unit is exsolved from the crystal structure of the mineral studied here in every second to third unit cell this might not be detected by analytical methods, especially if the SiO2 remains in cavities of the crystal as observed, e.g., in the exsolution process mentioned above for andalusite. A sillimanite-type superstructure with its ordering of Si and Al essentially is retained and the exsolution does not significantly affect the crystal-structure refinement. However, the ordering scheme must have changed in this process yielding the ordering pattern of “sillimullite” (Fig. 8b), which is different from the ordering in sillimanite (Fig. 8a) in the unit cell settings corresponding to a < b.
The fact that exsolution processes in sillimanites have been observed does not mean that the natural “sillimullite” described
FiguRe 6. Crystal structure projections of sillimanite and “sillimullite” in the two space-group settings in an idealized representation ignoring oxygen vacancies and triclusters in “sillimullite.” Identical sequences of Si and Al in the tetrahedral double chains are encircled by a green oval and different sequences by a red oval. Neighboring double chains are shifted by ½ unit cell parallel to c. Blue polyhedra are occupied by Al; yellow ones by Si. View parallel to c rotated by 6° about a and b. (a) Sillimanite in space group Pbnm (Yang et al. 1997). (b) The crystal structure of “sillimullite” in Pnam. (c) The crystal structure of “sillimullite” transformed to Pbnm setting according to b, a, –c.
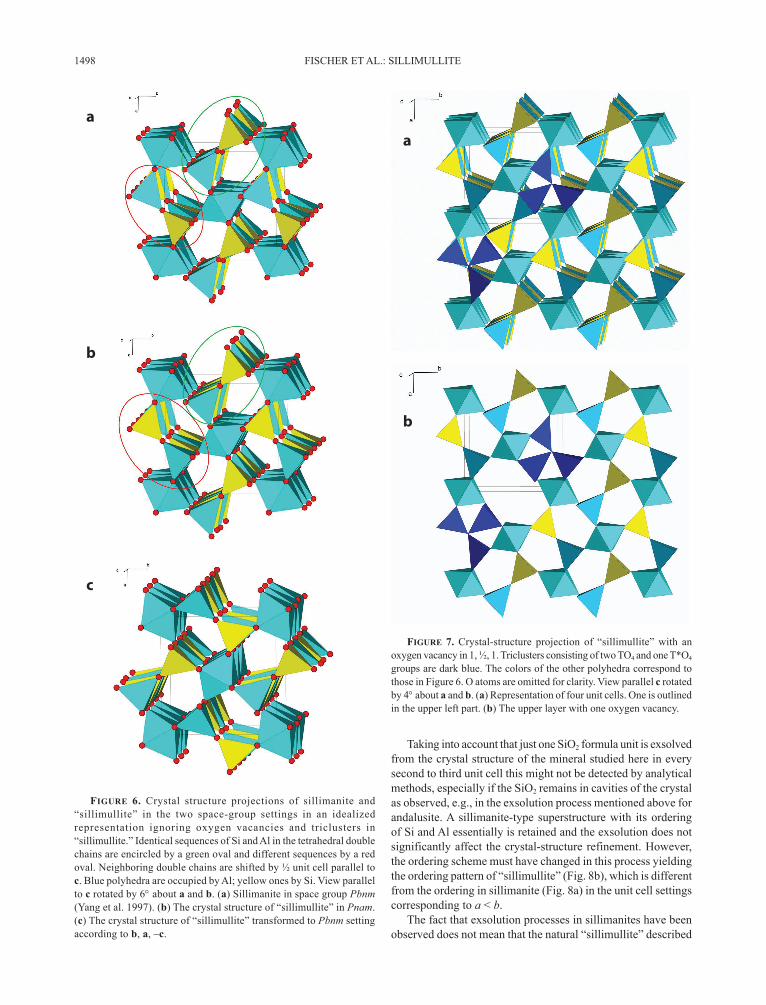
FiguRe 7. Crystal-structure projection of “sillimullite” with an oxygen vacancy in 1, ½, 1. Triclusters consisting of two TO4 and one T*O4 groups are dark blue. The colors of the other polyhedra correspond to those in Figure 6. O atoms are omitted for clarity. View parallel c rotated by 4° about a and b. (a) Representation of four unit cells. One is outlined in the upper left part. (b) The upper layer with one oxygen vacancy.
a
b
c
a
b
FISCHER ET AL.: SILLIMULLITE 1499
here underwent the same conditions as in the experimental procedures described above. It just means that such exsolution processes are commonly observed in sillimanite and thus could be basically considered as possible explanation for the discrepancy in the chemical composition of “sillimullite.”
Si/Al orderingThe crystal-structure refinement clearly yielded an ordering
of Si and Al in the tetrahedral double chains. Compared with literature data listed in Table 5 the mean Si-O distances are slightly larger and the mean Al-O distances are slightly smaller than observed in the sillimanite structures senso stricto. This might indicate that the ordering in “sillimullite” is not complete similar to that in fibrous sillimanite having about 10% mixed occupancies in the T sites (Bish and Burnham 1992). However, the exact determination of the Si/Al distribution is difficult due
to the similarities in the scattering power of Si and Al in the X-ray case. Refinement of simultaneous occupancy of Al and Si on the T(Al) position (Table 3) was not stable. So we performed a series of fixed occupancies similarly to the graph shown in Figure 4 immediately resulting in a linear increase of R1 when Si was incorporated on this position. Thus, a complete ordering was applied in the refinements.
The main difference in the Si/Al distribution between sil-limanite and “sillimullite” is in the occupancies of neighboring double chains of TO4 tetrahedra as shown in Figures 6 and 8 causing the different settings of the space-group symmetries. Dislocations with shifts of the chains one half parallel c as Burgers vector produce similar effects and were described by Doukhan and Christie (1982), Doukhan et al. (1985), Holland and Carpenter (1986), Lefebvre and Paquet (1983), Menard and Doukhan (1978), and Wenk (1983), and discussed by Salje (1986). Stacking faults, thus, are commonly observed in sil-limanites and lead to Al-Al and Si-Si contacts in the tetrahedral double chains as described by Lefebvre and Paquet (1983). Wenk (1983) described a mullite-sillimanite intergrowth with submicroscopic mullite having doubled lattice parameters a and c with antiphase boundary structures for both sillimanite and mullite. However, these macroscopic or phase-boundary effects are clearly different from the ordered configuration observed here. Within the double chains the SiO4 and AlO4 tetrahedra are clearly ordered but neighboring double chains are dislocated by ½ in c with full translational symmetry of either Pbmn (sillimanite) or Pnam (“sillimullite”).
Foreign cationsMicroprobe analyses of “sillimullite” yielded Fe2O3 contents
ranging from 1.95 to 2.55 wt%, MgO ≈ 0.20 wt%, and TiO2 ≈ 0.35 wt%, Table 2. The crystal-structure refinement yielded a preference for iron in the AlO6 octahedron with 0.17(2) Fe and in the T*2 position with 0.032(16) Fe atoms per unit cell. The minor amounts of Ti and Mg cannot be distinguished from Al and Fe in the refinement. The statement that most of the Fe occurs in the AlO6 octahedron with minor amounts in the T* position is in agreement with other studies on the distribution of Fe3+ in
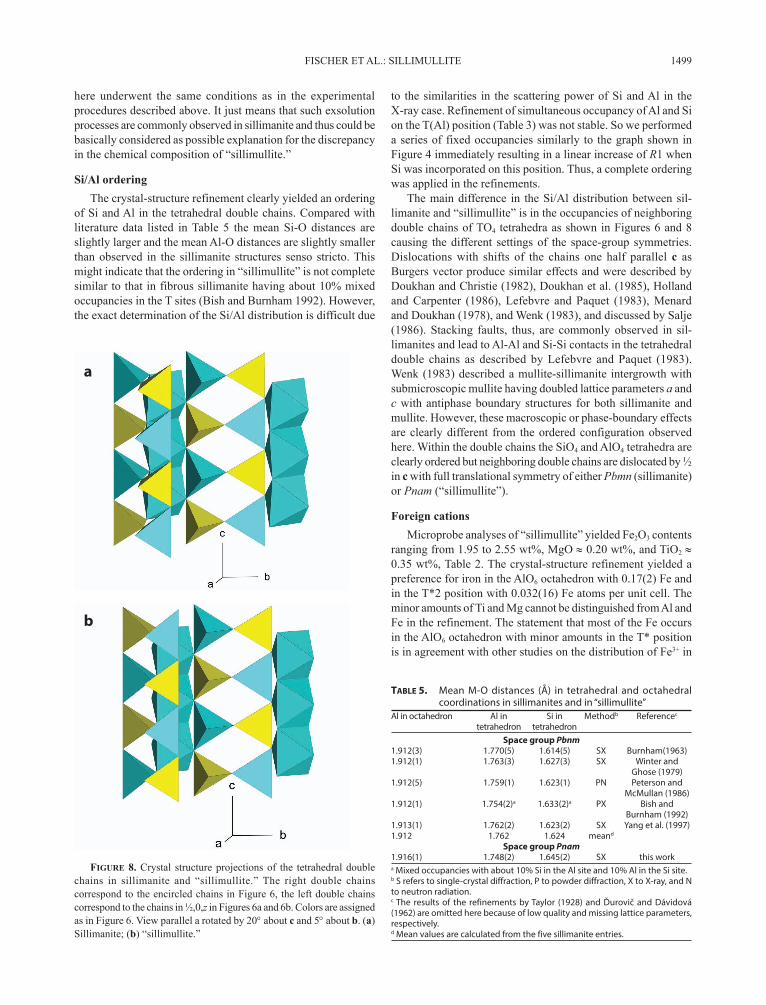
FiguRe 8. Crystal structure projections of the tetrahedral double chains in sillimanite and “sillimullite.” The right double chains correspond to the encircled chains in Figure 6, the left double chains correspond to the chains in ½,0,z in Figures 6a and 6b. Colors are assigned as in Figure 6. View parallel a rotated by 20° about c and 5° about b. (a) Sillimanite; (b) “sillimullite.”
Table 5. Mean M-O distances (Å) in tetrahedral and octahedral coordinations in sillimanites and in “sillimullite”
Al in octahedron Al in Si in Methodb Referencec
tetrahedron tetrahedronSpace group Pbnm
1.912(3) 1.770(5) 1.614(5) SX Burnham(1963)1.912(1) 1.763(3) 1.627(3) SX Winter and Ghose (1979)1.912(5) 1.759(1) 1.623(1) PN Peterson and McMullan (1986)1.912(1) 1.754(2)a 1.633(2)a PX Bish and Burnham (1992)1.913(1) 1.762(2) 1.623(2) SX Yang et al. (1997)1.912 1.762 1.624 meand
Space group Pnam1.916(1) 1.748(2) 1.645(2) SX this worka Mixed occupancies with about 10% Si in the Al site and 10% Al in the Si site.b S refers to single-crystal diffraction, P to powder diffraction, X to X-ray, and N to neutron radiation.c The results of the refinements by Taylor (1928) and Ďurovič and Dávidová (1962) are omitted here because of low quality and missing lattice parameters, respectively.d Mean values are calculated from the five sillimanite entries.
a
b

FISCHER ET AL.: SILLIMULLITE1500
sillimanite and mullite. Peterson and McMullan (1986) observed Fe in both octahedral and tetrahedral sites in their neutron dif-fraction studies of sillimanite. Similar results were obtained by Fisher et al. (1979) from the evaluation of intensities from powder-diffraction experiments of mullite. Mössbauer spectros-copy (Parmentier et al. 1999) revealed three different Fe3+ sites in mullite. This was confirmed by Rietveld refinements yielding Fe distributed between octahedral and tetrahedral positions. Soro et al. (2003) observed a preference for Fe3+ in the octahedron of mullite formed from kaolins. Hålenius (1979) determined Fe3+ and Fe2+ just in the octahedral position in sillimanite, but the presence of tetrahedrally coordinated Fe was not generally ex-cluded. According to Mack et al. (2005) using high-temperature Mössbauer spectroscopy, Fe3+ occurs in mullite at two octahedral sites, one being slightly more distorted than the other, while tetrahedral Fe3+ is of minor importance. Rossman et al. (1982) showed that the yellow color in sillimanite is mainly caused by Fe3+ in the tetrahedral sites.
All these results on sillimanite and mullite support our find-ings that in “sillimullite” most of the Fe3+ enters the AlO6 octa-hedron and minor amounts are found in the T* position yielding a slightly colored crystal.
The minor amounts of Mg2+ and Ti4+ cannot be distinguished from Al and Fe3+ in the refinement. They occur in approximately equal quantities (0.4 mol% TiO2 and MgO, respectively) and thus together have a three-valence charge. For simplicity, they have been assigned to the Al and Fe part in the chemical composition but there are no clues on the exact position of these atoms in the crystal structure.
Symmetry relationshipsSillimanite and mullite belong to the family of mullite-type
crystal structures as defined by Fischer and Schneider (2005) and Fischer et al. (2012) with the characteristic chains of edge-sharing AlO6 octahedra. The new mineral “sillimullite” intermediate between sillimanite and mullite conforms to the criteria listed in these references. However, it represents a new branch in the symmetry relationships derived from the hypothetical tetragonal aristotype. Figure 9 shows the symmetry relationships in the Bärnighausen tree (Bärnighausen 1980) of group-subgroup representations. The new mineral has a symmetry representing a subgroup of mullite similar with sillimanite and andalusite in klassengleiche subgroups of index 2. Mullite is assigned to group 3 in the Bärnighausen tree of the mullite family (Fischer and Schneider 2005), andalusite represents the first and sillimanite the second derivative, thus having numbers 31 (branch 3 position 1) and 32 (branch 3 position 2), respectively. The new mineral is assigned to position 6 because 3 is already assigned to Al18B4O33, 4 to mozartite, and 5 to boralsilite and werdingite (see Fischer and Schneider 2005; Fischer et al. 2012).
implicaTions
“Sillimullite,” a new mineral studied here, has characteristic features of both sillimanite (Si/Al ordering, doubled c lattice pa-rameter) and mullite (oxygen vacancies, formation of triclusters) but it is distinctly different from both minerals. In this respect, it is expanding the current knowledge on sillimanite and mullite type compounds. As a rare mineral it might be just a curiosity, but
it implies that compounds similar but significantly different to mullite do exist and might represent new members of the mullite family. Compared to sillimanite, the tetrahedral double chains are shifted ½ parallel c yielding a different sequence of AlO4 and SiO4 tetrahedra in the (001) plane with the effect that the space group symmetry changes to Pnam, which is a different setting of the sillimanite space group Pbnm. Therefore, “sillimullite” could be considered to represent a new mineral intermediate between sillimanite and mullite.
acknowledgmenTsWe gratefully acknowledge the support of the Deutsche Forschungsgemein-
schaft funding this work under grant Fi442/17-1. We thank Martin Erdmann and Anika Husen for their support at the microprobe at the Institut für Mineralogie, Leibniz Universität Hannover, Angelika Freesemann for preparing the polished crystal for the microprobe analyses, Ed Grew and Ronald Miletich for their com-ments that substantially improved the quality of this manuscript, and Michael Wendschuh and Hanna Lührs for their assistance in drawing Figure 5.
ReFeRences ciTedBärnighausen, H. (1980) Group-subgroup relations between space groups: A
useful tool in crystal chemistry. Communications in Mathematical Chemistry MATCH, 9, 209–233.
Bish, D.L., and Burnham, C.W. (1992) Rietveld refinement of the crystal struc-ture of fibrolitic sillimanite using neutron powder diffraction data. American Mineralogist, 77, 374–379.
Blass, G., and Graf, H.W. (1994) Über neue Mineralien vom Bellerberg, Eifel. Mineralien-Welt 05/6, 53–56.
Burnham, C.W. (1963) Refinement of the crystal structure of sillimanite. Zeitschrift für Kristallographie, 118, 127–148.
——— (1964) The crystal structure of mullite. Carnegie Institution of Washington Year Book, 62, 158–165.
Cameron, W.E. (1976a) Coexisting sillimanite and mullite. Geological Magazine, 113, 497–515.
——— (1976b) A mineral phase intermediate in composition between sillimanite and mullite. American Mineralogist, 61, 1025–1026.
——— (1977) Nonstoichiometry in sillimanite: Mullite compositions with silli-manite-type superstructures. Physics and Chemistry of Minerals, 1, 265–272.
Doukhan, J.C., and Christie, J.M. (1982) Plastic deformation of sillimanite Al2SiO5
FiguRe 9. The Bärnighausen tree illustrating the symmetry relationships of “sillimullite” in comparison to those of mullite, sillimanite, and andalusite. The branches are derived from a hypothetical aristotype representing the highest possible symmetry. Letters t and k represent the type of symmetry reduction (t = translationengleich, k = klassengleich), followed by the index (factor) of symmetry reduction and the origin shift in parentheses. Underneath, the set of basis vectors is given that describes the transformation of a unit cell to its setting in the subgroup. Space groups representing observed crystal structures are put in frames. Numbers in parentheses behind the space-group symbol refer to the space-group number in the International Tables for Crystallography (Hahn 2005). Roman numerals refer to the index of symmetry reduction relative to the aristotype. Members on one level are distinguished by Arabic numerals carrying the root numbers of the supergroup.
P 4/m b m (127) I
t 2 (½,0,0) a, b, c
P b a m (55) II.3
mullite
k 2 (0,0,0) a, b, 2c
k 2 (0,0,0) a, b, 2c
P n n m (58) IV.31
andalusite
k 2 (0,0,0) a, b, 2c
P b n m (62) IV.32
sillimanite
P n a m (62) IV.36
sillimullite

FISCHER ET AL.: SILLIMULLITE 1501
single crystals under confining pressure and TEM investigation of the induced defect structure. Bulletin de Minéralogie, 105, 583–589.
Doukhan, J.C., Doukhan, N., Koch, P.S., and Christie, J.M. (1985) Transmission electron microscopy investigation of lattice defects in Al2SiO5 polymorphs and plasticity induced polymorphic transformations. Bulletin de Minéralogie, 108, 81–96.
Ďurovič, S. (1962) Isomorphism between sillimanite and mullite. Journal of the American Ceramic Society, 45, 157–161.
Ďurovič, S., and Dávidová, Š. (1962) Refined atomic coordinates for sillimanite structure. Acta Crystallographica, 15, 1051.
Dzikowski, T.J., Groat, L.A., and Grew, E.S. (2007) The geometric effects of VFe2+ for VMg substitution on the crystal structures of the grandidierite-ominelite series. American Mineralogist, 92, 863–872.
Ebadzadeh, T., and Sharifi, L. (2008) Synthesis of i-Al2O3 from a mixture of aluminum nitrate and carboxylmethyl cellulose. Journal of the American Ceramic Society 91, 3408–3409.
Farrugia, L.J. (1999) WinGX suite for small-molecule single-crystal crystallogra-phy. Journal of Applied Crystallography, 32, 837–838.
Fischer, R.X., and Messner, T. (2013) STRUPLO, a new version of the structure drawing program. Fachbereich Geowissenschaften, Universität Bremen.
Fischer, R.X., and Schneider, H. (2005) The mullite-type family of crystal struc-tures. In H. Schneider, and S. Komarneni, Eds. Mullite, p. 1–46. Wiley-VCH, Weinheim.
——— (2008) Crystal chemistry of borates and borosilicates with mullite-type structures: a review. European Journal of Mineralogy, 20, 917–933.
Fischer, R.X., Gaede-Köhler, A., Birkenstock, J., and Schneider, H. (2012) Mullite and mullite-type crystal structures. International Journal of Materials Research, 103, 402–407.
Fisher, O.N., Smyslov, Y.N., and Shmitt-Fogelevich, S.P. (1979) Determination of the structural position of Fe3+ in mullite by powder diffractometry. Journal of Structural Chemistry, 20, 926–930.
Grew, E.S. (1980) Sillimanite and ilmenite from high-grade metamorphic rocks of Antarctica and other areas. Journal of Petrology, 21, 39–68.
Grew, E.S., and Hinthorne, J.R. (1983) Boron in sillimanite. Science, 221, 547–549.Grew, E.S., and Rossman, G.R. (1985) Co-ordination of boron in silimanite.
Mineralogical Magazine, 49, 132–135.Guse, W., Saalfeld, H., and Tjandra, J. (1979) Thermal transformation of silliman-
ite single crystals. Neues Jahrbuch für Mineralogie Monatshefte, 175–181.Hahn, T. (2005) International Tables for Crystallography. Springer, Berlin.Hålenius, U. (1979) State and location of iron in sillimanite. Neues Jahrbuch für
Mineralogie Monatshefte, 165–174.Hariya, Y., Dollase, W.A., and Kennedy, G.C. (1969) An experimental investi-
gation of the relationship of mullite to sillimanite. American Mineralogist, 54, 1419–1441.
Holland, T.J.B., and Carpenter, M.A. (1986) Aluminium/silicon disordering and melting in sillimanite at high pressures. Nature, 320, 151–153.
Hülsmans, A., Schmücker, M., Mader, W., and Schneider, H. (2000a) The transfor-mation of andalusite to mullite and silica: Part I. Transformation mechanism in [001]A direction. American Mineralogist, 85, 980–986.
——— (2000b) The transformation of andalusite to mullite and silica: Part II. Trans-formation mechanisms in [100]A and [010]A directions. American Mineralogist, 85, 987–992.
Lefebvre, A., and Paquet, J. (1983) Dissociation of c dislocations in sillimanite Al2SiO5. Bulletin de Minéralogie, 106, 287–292.
Mack, D.E., Becker, K.D., and Schneider, H. (2005) High-temperature Mössbauer study of Fe-substituted mullite. American Mineralogist, 90, 1078–1083.
Menard, D., and Doukhan, J.C. (1978) Défauts de réseau dans la sillimanite: Al2O3-SiO2. Journal de Physique Lettres, 39, L19–L22.
Parmentier, J., Vilminot, S., and Dormann, J.L. (1999) Fe- and Cr-substituted mullites: Mössbauer spectroscopy and Rietveld structure refinement. Solid State Sciences, 1, 257–265.
Perrotta, A.J., and Young, J.E. (1974) Silica-free phases with mullite-type structures. Journal of the American Ceramic Society, 57, 405–407.
Peterson, R.C., and McMullan, R.K. (1986) Neutron diffraction studies of silli-manite. American Mineralogist, 71, 742–745.
Petříček, V., Dušek, M., and Palatinus, L. (2006) Jana2006. The crystallographic computing system. Institute of Physics, Praha, Czech Republic.
Pouchou, J.L., and Pichoir, F. (1991) Quantitative analysis of homogeneous or stratified microvolumes applying the model ‘‘PAP.” In K.F.J. Heinrich and D.E. Newbury, Eds., Electron Probe Quantitation, p. 31–75. Springer, Berlin.
Rahman, S., Feustel, U., and Freimann, S. (2001) Structure description of the thermic phase transformation sillimanite-mullite. Journal of the European Ceramic Society, 21, 2471–2478.
Rossman, G.R., Grew, E.S., and Dollase, W.A. (1982) The colors of sillimanite. American Mineralogist, 67, 749–761.
Salje, E. (1986) Heat capacities and entropies of andalusite and sillimanite: The influence of fibrolitization on the phase diagram of the Al2SiO5 polymorphs. American Mineralogist, 71, 1366–1371.
Schneider, H., and Schmücker, M. (2005) Structure-controlled formation and decomposition of mullite. In H. Schneider and S. Komarneni, Eds., Mullite, p. 167–180. Wiley-VCH, Weinheim.
Schneider, H., Fischer, R.X., and Voll, D. (1993) Mullite with lattice constants a > b. Journal of the American Ceramic Society, 76, 1879–1881.
Sheldrick, G.M. (1997) SHELXL-97, a program for crystal structure refinement. University of Goettingen, Germany.
——— (2008) A short history of SHELX. Acta Crystallographica, A64, 112–122.Soro, N., Aldon, L., Olivier-Fourcade, J., Jumas, J.C., Laval, J.P., and Blanchart,
P. (2003) Role of iron in mullite formation from kaolins by Mössbauer spec-troscopy and Rietveld refinement. Journal of the American Ceramic Society, 86, 129–134.
Taylor, W.H. (1928) The structure of sillimanite and mullite. Zeitschrift für Kri-stallographie, 68, 503–521.
Wenk, H.R. (1983) Mullite-sillimanite intergrowth from pelitic inclusions in Bergell tonalite. Neues Jahrbuch für Mineralogie Abhandlungen, 146, 1–14.
Winter, J.K., and Ghose, S. (1979) Thermal expansion and high-temperature crystal chemistry of the Al2SiO5 polymorphs. American Mineralogist, 64, 573–586.
Yang, H., Hazen, R.M., Finger, L.W., Prewitt, C.T., and Downs, R.T. (1997) Compressibility and crystal structure of sillimanite, Al2SiO5, at high pressure. Physics and Chemistry of Minerals, 25, 39–47.
Manuscript received March 9, 2014Manuscript accepted January 20, 2015Manuscript handled by Martin Kunz