Embed Size (px)
Citation preview

International Journal of Engineering and Applied Sciences (IJEAS)
ISSN: 2394-3661, Volume-4, Issue-4, April 2017
1 www.ijeas.org
Abstract— In this research a general methodology is
presented for health monitoring of cable-stayed bridges. This
methodology has two main phases: 1) identifying different
damage/failure modes through linear static, nonlinear static and
nonlinear dynamic time history analyses; 2) individualizing the
features of the considered bridge sensitive to the recognized
damage/failure modes.
In order to evaluate the proposed methodology as an
exemplified the Kobe earthquake is normalized into 1g in the
vertical, transversal and longitudinal directions and used as the
input of non-linear dynamic time history analyses of the
QINGZHOU Bridge. The components are divided into a few
shorter frequency ranges. The features and their values sensitive
to damages/failures are recognized in each individual frequency
domain. Extensive analysis using various earthquake records,
the Big Bear, Chi-Chi and El-Centro earthquake records, shows
that expected damages and recognized sensitive features in
similar frequency domains are exactly the same as those for the
Kobe earthquake. Recognized sensitive features in this study are
the vertical displacement and acceleration of the main span
center, lateral displacement of the top of towers, vertical
displacement of some points of the main girder of deck near the
towers and also strain of cables. Extensive analysis shows that
by using the new proposed methodology and monitoring a few
selected features of a cable-stayed bridge various source of its
potential damages during strong ground motions are trustfully
predicted and controlled in early steps.
Index Terms— health monitoring, features sensitive to
damage, cable-stayed bridge, nonlinear dynamic time history
analyses.
I. INTRODUCTION
Cable-stayed bridges have been widely used all over the
world in the recent decades because of their remarkable
advantages such as aesthetic appearance and efficient usage
of structural material. Rapid progress of analysis and design
procedure, high strength materials, as well as development of
efficient construction techniques, lead engineers to erect long
span cable-stayed bridges over 1000 m. but, on the other hand
cable-stayed bridges are highly sensitive to dynamic loads
such as wind, earthquake and traffic because of which they
may behave beyond their service limits, or their elements
exceed yield limits. Intensive loadings may cause nonlinear
behavior of each part of the bridge which may be due to both
material and geometric nonlinearities. Sources of these
problems include sag effect of inclined cables, the effects of
Mohammad Hashemi Yekani ,PhD Candidate, Department of Civil
Engineering, Collage of Engineering, Tehran Science and research Branch,
Islamic Azad University, Tehran, Iran,+989121392049
Omid Bahar, Assistant Prof., Structural Dynamics Dept., International
Institute of Earthquake Engineering and Seismology (IIEES), Tehran,
Iran,+989122195967
interaction between axial loads and bending moments in the
girders and towers, large displacements effects, nonlinear
stress-strain behavior of materials, and so on. In these cases,
different parts of cable-stayed bridges, includes towers,
cables, and main girders experience minor to major damages.
Moreover, some parts of the bridge may be partially or
completely collapsed. Therefore, it is crucial to monitor the
behavior of such bridges to recognize all potential damage
sources concerning various strong winds or earthquakes.
Therefore, it is necessary to establish a monitoring system that
can collect data on dynamic response of the bridge. The better
the modeling and considering nonlinear sources are the more
knowledgeable judgment about potential damages will be
obtained. So, performing different types of analysis on the
earthquakes with various characteristics is crucial for better
understanding the performance of such bridges. Since,
bridges play an essential role in the highway network,
structural health monitoring has been implemented for
recognizing the bridge behavior under different loadings. The
dynamic behaviors of major components of bridge, caused by
environmental loadings, are identified by full and large-scale
testing. In this view point, structural health monitoring has
become an important part in the design, construction and
structural safety of bridges [1]–[3]. Damage/failure of main
girders and towers of cable-stayed bridges is another
important feature in the long span bridges [4]. This feature
should be monitored to prevent bridge damage caused by
external excitations such as earthquake, strong wind,
differential settlement, fatigue/defect of material and loose of
tension within the cables. As cable-stayed bridge with long
span usually plays role in the hazard mitigation, it is very
important to remain functional after moderate earthquake.
Therefore, rapid structure health diagnosis is essential for
cable-stayed bridge in a maintenance procedure [5]-[7]. In
this paper a general methodology is presented for health
monitoring of cable-stayed bridges through recognizing
major features sensitive to damage/failure modes.
Nonlinear analysis is applied in studying cable-stayed
bridges due to the rapid incremental development of central
span lengths in such bridges. Therefore, nonlinear analyzing
of these bridges is very essential for recognizing the stresses
and deformations caused by external excitations. In the last
decade the researchers have intensively studied the dynamic
behavior and seismic responses of these highly nonlinear
structures. They focused on 2D or 3D structures, all focusing
on the cable-stayed bridges and their dynamic behavior
characterizations excited by traffic, wind and earthquakes
[8]-[ 9].
In order to analyze the earthquake response of cable-stayed
bridges precisely, it is necessary to know their dynamic
A new methodology for health monitoring of
cable-stayed bridges; identifying the major features
sensitive to damage/failure
Mohammad Hashemi Yekani, Omid Bahar

A new methodology for health monitoring of cable-stayed bridges; identifying the major features sensitive to
damage/failure
2 www.ijeas.org
characteristics, including modal frequencies, mode shapes
and modal damping ratios. On the one hand, many papers
have been published about 2D geometric nonlinear seismic
response time history analysis of cable-stayed bridges [12];
some others hand have concerned 3D geometric nonlinear
response of long span cable-stayed bridges during
earthquake [10],[ 11],[13]. Ambient vibration measurements
are used widely to challenge the modal analyses of real
bridges [14]. Cable supported bridges have been analyzed
subjecting to asynchronous longitudinal and lateral ground
motions. Several researchers studied soil-structure
interaction for long span cable-stayed bridges [16]. None of
these researchers include all nonlinearity sources. Nonlinear
dynamic analysis is the key tool of the methodology
presented in this research for step by step identification of
seismic response behavior of long span cable-stayed bridges.
This methodology considers both geometric and material
nonlinearities.
In this study a general methodology is presented for health
monitoring of cable-stayed bridges through recognizing
major features sensitive to their damage/failure modes. The
methodology includes two main phases: 1) identifying
different damage/failure modes through linear static analysis,
nonlinear static analysis and nonlinear dynamic time history
analysis; 2) individualizing the major features sensitive to
damage/failure. In order to generalize the dynamic analysis,
the selected strong ground motion earthquakes are
normalized and filtered into a few given frequency ranges. In
this approach, the effective features and their proper ranges
are distinguished as the main tools in monitoring process of
cable-stayed bridges. Accordingly, the potential damages are
trustfully predicted and controlled by monitoring a few
points of bridges
II. METHODOLOGY OF DETERMINING THE PARAMETERS
SENSITIVE TO DAMAGE
The new proposed methodology attempts to consider
potential damages/failures by determining the exact
frequency range of the earthquakes. Eventually, the features
sensitive to these recognized damages are identified. The
structural elements will remain in their elastic limits by
controlling the determined points precisely. In this way, the
potential damages and probable collapse would be
predictable.
Non-linear dynamic time-history analyses are used as the key
tools for detecting the damage extent. In order to evaluate the
proposed methodology as an exemplified the Kobe
earthquake is used as the input of non-linear dynamic time
history analyses of the QINGZHOU cable-stayed bridge. The
methodology is conducted in two phases:
1) Kobe earthquake is normalized to 1 g in the vertical,
longitudinal and transversal directions. Then the earthquake is
filtered according to the frequency range of the cable-stayed
bridge. The frequency range of the earthquake record is
divided into 0-3, 3-6, 6-9, 9-12 and 12-15 Hz, which is
covered about 90 modes of the QINGZHOU cable
stayed-bridge. In this way, all the damage/failure modes of the
bridge corresponding directly to a specific frequency ranges
are determined. After filtering the earthquakes, the analyses
will be conducted, and the filtered earthquakes will be applied
on the structure in vertical, longitudinal and transversal
directions. 2) The features and their values sensitive to
damages/failures are recognized in each individual frequency
domain. After initial studying of the structure's status, if the
structure has not yet entered the inelastic limits, the structure
is analyzed again by applying much more intense earthquakes.
The analyses are continued up to observe some damages and
finally failure mode of the bridge [17].
Figure 1 shows the earthquake acceleration values, the
increased earthquake input applied on the structure to cause
damage, and concerning excitation modes of the bridge in
each frequency range. For example, concerning Kobe
earthquake, the input earthquake should be 16 times greater
than the main filtered earthquake in the frequency range of
12-15, in order to collapse the structure.
Fig. 1: The acceleration values increased input earthquakes
The damages, ordinarily observed in the conducted analyses,
are related to the cables, towers and deck or a combination of
them. The damage boundary as well as the limitation in which
the structure shows inelastic behavior is determined by
controlling the displacement center of main span and
identifying its exact domain. Other criteria are: root mean
square of acceleration of main span center, lateral
displacement of top of the tower, vertical displacement of
some points of the main girder of deck (area 3 in region II and
III, Fig. 20) near the towers and cables strain. Figure 2 shows
all steps of choosing, normalizing and filtering the input
earthquakes in the proposed frequency ranges. Figure 3 shows
the steps of analyzing and determining potential damages in
the dominant frequency range, identifying the features
sensitive to damage and monitoring the structure.
Fig. 2: Filtering the earthquake, used as the input of analysis

International Journal of Engineering and Applied Sciences (IJEAS)
ISSN: 2394-3661, Volume-4, Issue-4, April 2017
3 www.ijeas.org
Fig. 3:The analysis steps for identifying the potential damages of cable-stayed bridge
III. THE MODEL PROPOSED FOR CABLE-STAYED BRIDGE
A. A.Cable model description
QINGZHOU Bridge which crosses Ming River (Fuzhou) has
been selected for this research. The bridge span
arrangements are 90+200+605+90+200 m. The elevation
view of the bridge is shown in Fig.4.
Fig. 4: Elevation view of QINGZHOU Bridge
The deck crosses aero dynamic section closely shaped with
box steel girder of 25.1 m width and 2.8 m height with
A=1.0175 m2 and I=1.3232 m
4; where, A is Section Area
and I is Moment Of Inertia. The bridge towers are A-shaped
steel reinforced concrete towers with 175.5 m height, shown
in Fig.5. The towers are connected to the deck by 18 cables
in each side (inner cables and outer cables).The stayed cable
is arranged as a two-vertical-plane system. The eight groups
of cables are composed of 73–199 high-strength 7-mm
wires.
Fig. 5: 3D view of Bridge and A-Shape Tower
The specifications of different parts of towers and the material
data of Sample Bridge have been extracted from reference
[18] for modeling. One of the main objectives of this research
is to determine the criteria for damage and nonlinear behavior
of structure. Accordingly, the suggested model is sensitive to
sag effect, interaction between axial load and bending
moment in the main girders and towers, and large
displacement effects. All these factors would result in
nonlinear behavior of the structure.
B. MECHANICAL PROPERTIES AND INCLINATION OF CABLES
The cables are of main elements in all cable-stayed bridges.
They are made up of steel with excellent mechanical
properties such as a high tensile strength and a high elastic
modulus. The cables are highly resistant against corrosion

A new methodology for health monitoring of cable-stayed bridges; identifying the major features sensitive to
damage/failure
4 www.ijeas.org
having satisfactory fatigue strengths. While they are
extremely strong, they are also very flexible making them
appropriate for axial tension. However, they are weak
against compression and bending forces. As a result, bridges
with long span are vulnerable to the excitations such as
strong winds and earthquakes, and therefore they need some
special measures. Steel cables are very economical as they
allow a slender and lighter structure which is still able to
span long distances. Almost all steel wires are cylindrical
shape with 3-7 mm diameter. The wires used in the cable-
stayed bridges have the diameters up to 7 mm.
They carry the load of the main girder and transfer it to the
towers. The cables in a cable-stayed bridge are all inclined,
Figure 6. The actual stiffness of an inclined cable varies in
accordance with the inclination angle (a), total cable weight
(G) and cable tension force (T) [19]:
)}12/(cos1/{)( 322 TaEAGEAeffEA (1)
Fig. 6: An inclined cable
Where, E is Young’s modulus and A is cross-sectional area of
the cable. If the cable tension (T) changes from T1 to T2, the
equivalent cable stiffness is defined as follows:
)}2124/()21(cos1/{)( 2222 TTTTaEAGEAeffEA (2) This equation is used in the present study to determine the
cables sag effect.
C. HINGE DEFINITION
Concerning nonlinear analysis, the hinge should be defined
according to the structural behavior of each element. In this
research three types of hinge, cables, girders and towers, have
been used for the elements. The hinge behavior is studied for
the cables only under axial forces, the main girders connected
to cables and the towers under the interaction of axial force
and bending moment in two directions. These definitions have
been considered as default status in nonlinear statistic
procedure (NSP) and nonlinear dynamic procedure
(NDP).The important point in nonlinear analysis is related to
the force-deformation curve of members. In Fig.7 the
Acceptance Criteria IO (Immediate Occupancy), LS (Life
Safety) and CP (Collapse Prevention) values are deformations
(displacements, strains, or rotations) that have been
normalized by the same deformation scale factors used to
specify the force-deformation curve, and are typically located
between points, B and C, and, moreover, points B and C on
the curve. The linear response beginning from A (unloaded
component) to the yielding threshold B. Then, the linear
response is observed at the reduced stiffness, from B to C,
with sudden reduction in the lateral load resistance to D,
response at reduced resistance to E, and final loss of
resistance thereafter [20].
Fig. 7: Force – Displacement curve [20]
D. SELECTING THE EARTHQUAKES
In this research a procedure including normalizing, filtering
and scaling is proposed in order to generalize dynamic time
history analysis of cable-stayed bridges, Fig.2. In this way, in
spite of applying various loads on the cable-stayed bridges
and measuring different characteristics of strong ground
motions, the damage patterns is recognized for each
considered bridge. In this regard four earthquakes are chosen
having the magnitudes of 6.4 ≤ Mw ≤ 7. The selected
earthquakes are: Kobe (STATION NO.2046, JAN 16,
1995), Big Bear (STATION NO.22561, JUNE 28,1992),
El-Centro (IMPERIAL VALLEY, STATION NO.5054,
OCT 15, 1979), Chi-Chi (SEP 20,99 , CHY028)[21].
These records are selected out of a great of available records
considering some major factors such as high magnitudes or
epicenters intensities, near fault and far fault motions. In this
way, the performance of bridge is controlled against weak to
strong records to identify all possible damage/failure modes.
Kobe earthquake is considered as the primary earthquake for
analysis and the others as control samples for the proposed
methodology. Accordingly, Kobe earthquake is firstly
normalized to 1g. in longitudinal, transversal and vertical
directions. Then, it is filtered in the frequency ranges of
0-15Hz. The frequency ranges are divided into the intervals of
0-3, 3-6, 6-9, 9-12, 12-15 to determine their relation with the
dominant modes. These are used as input earthquakes of
dynamic time- history analyses. The studied earthquakes are
summarized in Table 1. Five frequency ranges have been
assigned for the selected earthquakes. The damage is
observed in the frequency range of 0-3 Hz. However, no
damage is seen in other frequency ranges. Therefore, the input
earthquake increases there. This increase has been 5 times the
input earthquake in 3-6 Hz, 2 times in 6-9 Hz, 9 times in 9-12
Hz and 16 times in 12-15 Hz, Fig.1. This increase was about
2g which is an acceptable earthquake. In the next step, the
frequency range of structural damage is determined. Fig. 8
shows the relation between frequency range and structural
modes.

International Journal of Engineering and Applied Sciences (IJEAS)
ISSN: 2394-3661, Volume-4, Issue-4, April 2017
5 www.ijeas.org
Table 1: The specifications of studied earthquakes
EQ. Component X (g) Component Y (g) Component Up(g) Duration (Sec)
Kobe 0-3 Hz. 0.90 0.95 0.72 26
Kobe 3-6 Hz. 0.34 0.36 0.70 26
Kobe 6-9 Hz 0.10 0.12 0.32 26
Kobe 9-12 Hz. 0.06 0.07 0.23 26
Kobe 12-15 Hz. 0.03 0.03 0.08 26
Big Bear 0.53 0.47 0.19 26
Chi Chi 0.82 0.65 0.34 25
El-Centro 0.60 0.77 0.42 25
Fig. 8: The relation between the selected frequency range and
involved modes
IV. SELECTING THE PROPER ANALYSIS CORRESPONDING TO
DAMAGE DIAGNOSIS FEATURE
Here, linear statistic analysis, modal analysis, nonlinear
statistic analysis and dynamic time history analysis have been
conducted in order to evaluate the characteristics of different
elements of bridge and their behaviors against external forces.
These analyses are essential for determining the features
sensitive to damage and their variation ranges. Therefore, the
analyses are performed to evaluate the accurate condition of
bridge and determine the points or features sensitive to
damage.
The determined sensitive features are: 1) vertical
displacement center of the main span; 2) root mean square of
acceleration center of the main span; 3) lateral displacement
of top of the towers; 4) vertical displacement of some points
of the main girder of deck (area 3 located in region II and III,
Fig. 20) near the towers; 5) cables strain. The details of all
these features are defined in the following. By controlling the
points accurately and determining the exact limitation for
damage features it is possible to keep the structure in the
linear and safe limitation throughout its life time and prevent
the potential damages from occurring.
V. DAMAGE MODES ASSESSMENT
The selected earthquakes are normalized and divided into
different frequency ranges of 0-3, 3-6, 6-9, 9-12, 12-15 Hz. In
this regard the behavior of the bridge is controlled under three
directions in a small frequency range of about 24 modes. The
potential excitation of special modes of the structure is
identified causing minor damages to complete collapse.
At this stage, each filtered three directional records is applied
on the structure as the input of nonlinear time history analysis
to study the behavior of bridge. The analyses have been
conducted after nonlinear static analyses of cable-stayed
bridge under vertical dead loads.
If some parts of the bridge are not still in the elastic limitation,
the applied record decreases by scaling; otherwise, it
increases up to observing some damages in the bridge. The
reasons of beginning the damage, its progress to the other
sectors of the bridge and bridge collapse have been studied in
each input frequency range by conducting more analyses. For
this purpose, first, it is focused on the beginning stages of
damage associated with different modes. Then, the
propagation of damage in structural elements of the bridge,
local failure and overall failure (collapse) would be identified.
In the following the failure process is studied in different
frequency ranges.
A. DAMAGE IN THE FREQUENCY RANGE OF 0-3 HZ.
The structural damages are divided into 4 areas: left inner
region (I), left outer region (II), right inner region (III), right
outer region (IV) for better understanding the process.
Regarding the frequency range of 3.0 Hz, the structural
damages are started with arriving some cables of regions (II)
and (III) into inelastic limitation (B) (about 55% of cables in
each region). As the analysis approaches, more cables of the
four regions enter non-elastic limitation (B). After that, they
do not exceed this limitation until the main span tower meets
the boundary (B) as well. In this status, the damages are
progressed in some cables of region III (50%B – 16% IO –
11% LS – 5 % C). This process is continued until the tower is
out of elastic limitation; then, and the cables of region (III)
experience damage expanding to the region (IV) and
eventually (II). Meanwhile, both right and left towers also
enter inelastic limitation and the damages are progressed up to
their upper columns until stopping the analysis in Y direction
due to the right tower failure because of excessive movement.
Table 2 presents the damages occurred in the cables, towers
and girders at the end of analysis. The overall damages of all
members have been shown in Figure 9.
Table 2:The damage occurred in the cable- stayed bridge in the frequency range of 0-3 Hz.
Damage OF Cables
Position Time(Sec) C-O-L C-I-L C-I-R C-O-R
Front 11.12" 88% B 16% B - 77% IO 27% C -72% E 100% E
Back 11.12" 88% B 16% B - 77% IO 5% B - 39% IO - 27% LS - 11% C - 16% E 88% B - 5.5% IO - 5.5 % LS

A new methodology for health monitoring of cable-stayed bridges; identifying the major features sensitive to
damage/failure
6 www.ijeas.org
Damage OF Towers
Position Tower Time(Sec) LEFT RIGHT Position Tower Time(Sec) LEFT RIGHT Beam Under Deck (L) Beam Under Deck (R)
FRONT 1 11.12" − − BACK 1 11.12" − − − −
FRONT 2 11.12" B B BACK 2 11.12" − B B B
FRONT 3 11.12" − B BACK 3 11.12" − B − −
Damage OF Girders
Position Time(Sec) Span 1 (90m)L Span 2(200m)L Span 3(605/2m)L Span 4(605/2m)R Span 5(200m)R Span 6 (90m)R
Front 11.12" − B B B B −
Back 11.12" − B B B B −
Fig9: Overall damages of all members
B. the Damage in the frequency range of 3-6 Hz.
The damages in the frequency range of 3-6 Hz. are started
with entering some cables of regions II and III (about 61% of
each of the regions II and III) the non-elastic limitation (B).
As the analyses are continued, the damages are found in the
regions I and IV as well. Therefore, the cables meet the
border limitation (B). Continuing the analysis, no cable goes
beyond the limitation until the girder of the main span is out of
elastic limitation; then, the cables of the regions III and I are
damaged. Eventually, the damage is occurred and progressed
in the girders of region IV up to the stopping of analysis due to
the mechanization of the girders of region I. No damage is
happened in the towers in this frequency range.
Table 3 presents the damages of cables, columns and girders
at the end of analysis. Overall damage of all members is
shown in Fig. 10.
Table 3: The damage of cable- stayed bridge in the frequency range of 3-6 Hz.
Damage OF Cables
Position Time(Sec) C-O-L C-I-L C-I-R C-O-R
Front 8.56" 94%B 94%B 50%B - 38%IO - 5% C 88%B
Back 8.56" 83%B - 5%IO - 5% C 94%B 38%B - 50%IO -5% LS 88%B Damage OF Towers
Position Tower Time(Sec) LEFT RIGHT Position Tower Time(Sec) LEFT RIGHT Beam Under Deck (L) Beam Under Deck (R)
FRONT 1 8.56" − − BACK 1 8.56" − − − −
FRONT 2 8.56" − − BACK 2 8.56" − − − −
FRONT 3 8.56" − − BACK 3 8.56" − − − − Damage OF Girders
Position Time(Sec) Span 1 (90m)L Span 2(200m)L Span 3(605/2m)L Span 4(605/2m)R Span 5(200m)R Span 6 (90m)R
Front 8.56" B/2(Collapse) − B B B/2 B/2
Back 8.56" B/2(Collapse) B/2 B B B/2 B/2

International Journal of Engineering and Applied Sciences (IJEAS)
ISSN: 2394-3661, Volume-4, Issue-4, April 2017
7 www.ijeas.org
Fig. 10: Overall damages of all members
C. The damages in the frequency range of 6-9 Hz.
In this frequency range, the damages are started with entering
some cables of the regions II and III (about 55% of cables of
regions II and III) the limitation border (B). The analysis is
continued and the damage of region III increases; and all
cables and the girder of main span meet the border. In this
condition the damage increases in region III. Eventually,
some cables exceed the limitation C (27% B-22% IO -11% LS
– 27% E) leading to the deck collapse. No damage is occurred
in the towers in this frequency range. Table 4 presents the
damages of cables, columns and girders at the end of analysis.
The overall damage of all members is shown in Fig. 11.
Table 4: The damages of cable- stayed bridge in the frequency range of 6-9 Hz.
Damage OF Cables
Position Time(Sec) C-O-L C-I-L C-I-R C-O-R
Front 26" 38%B 88%B 27%B - 22% IO - 16%LS - 22%E 44%B
Back 26" 38%B 88%B 27%B - 22% IO - 11%LS - 27%E 44%B
Damage OF Towers
Position Tower Time(Sec) LEFT RIGHT Position Tower Time(Sec) LEFT RIGHT Beam Under Deck (L) Beam Under Deck (R)
FRONT 1 26" − − BACK 1 26" − − − −
FRONT 2 26" − − BACK 2 26" − − − −
FRONT 3 26" − − BACK 3 26" − − − −
Damage OF Girders
Position Time(Sec) Span 1 (90m)L Span 2(200m)L Span 3(605/2m)L Span 4(605/2m)R Span 5(200m)R Span 6 (90m)R
Front 26" − − B B − −
Back 26" − − B B − −
Fig. 11: Overall damage of all members

A new methodology for health monitoring of cable-stayed bridges; identifying the major features sensitive to
damage/failure
8 www.ijeas.org
D. The damages in the frequency range of 9-12 Hz.
In this frequency range, the damages are started with meeting
some cables (about 55%) of region II and III the border
limitation (B). As the analysis is continued, the damages
increase in these regions. Although all cables have not yet
reached border limitation B, the girder of main span reaches
this border. At this stage, the damage increases in the cables
of region II (passing the border limitation C). The trend is
progressed and the cables are damaged in region III
exceeding the mentioned limitation border. Then damage is
expanded into the region IV and some cables exceed the
limitation C. In this stage the damages of girders meet region
IV; the damages of right tower, under deck and top of the
deck, meet the borders of B and IO limitations, respectively.
Eventually, the analysis is stopped due to the deck collapse in
region II.
Table 5 presents the damages of cables, columns and girders
at the end of analysis. Overall damage of all members is
shown in Fig. 12.
Table 5: The damages of cable- stayed bridge occurred in the frequency range of 9-12 Hz. Damage OF Cables
PositionTime(Sec) C-O-L C-I-L C-I-R C-O-RFront 26" 55%B - 11%IO 5%B - 83%E 100%E 11%B - 5%IO - 16% LS- 11%C - 55%EBack 26" 55%B - 11%IO 5%B - 83%E 100%E 11%B - 5%IO - 16% LS- 11%C - 55%E Damage OF Towers
Position Tower Time(Sec) LEFTRIGHT Position Tower Time(Sec) LEFT RIGHT Beam Under Deck (L) Beam Under Deck (R)FRONT 1 26" − IO/2 BACK 1 26" − IO/2 − −FRONT 2 26" − IO/2 BACK 2 26" − IO/2 − −
FRONT 3 26" − − BACK 3 26" − − − − Damage OF Girders
Position Time(Sec) Span 1 (90m)L Span 2(200m)L Span 3(605/2m)L Span 4(605/2m)R Span 5(200m)R Span 6 (90m)R
Front 26" − − B B B B/2Back 26" − − B B B B/2
Fig. 12: Overall damage of all members
D. The damages occurred in the frequency range of 12-15 Hz.
The damage is started in the frequency range of 9-12 once
some cables of region I and III (about 55%) reach the border
of B limitation. Continuing the analysis, the damage increases
in these regions. However, no cable exceeds B limitation until
the girder of main span enters B limitation; the damage
occurred in the cables of region III increases and exceeds C
limitation. This condition continues and the damage is
expanded into region II and passes C limitation. Then the
damage is expanded to region I and some cables pass C
limitation. In this stage the damages occurred in the girders of
region I and the left towers, under and top of the deck, meet
the border of B limitation. Eventually, the analysis is stopped
due to deck collapse in the region III. Table 6 summarizes the
damages of cables, columns and girders at the end of analysis.
The overall damage of all members is shown in Fig. 13.
Table 6: The damage of cable- stayed bridge occurred in the frequency range of 9-12 Hz. Damage OF Cables
PositionTime(Sec) C-O-L C-I-L C-I-R C-O-R
Front 15.62"72%B - 5%IO - 11%LS - 11%C 5%LS - 5%C -89%E 83%E 39%B
Back 15.62"78%B - 11%IO - 5%LS - 5%C 5%IO - 11%C -83%E 83%E 45%B

International Journal of Engineering and Applied Sciences (IJEAS)
ISSN: 2394-3661, Volume-4, Issue-4, April 2017
9 www.ijeas.org
Damage OF Towers
Position Tower Time(Sec) LEFT RIGHT Position Tower Time(Sec) LEFT RIGHT Beam Under Deck (L) Beam Under Deck (R)
FRONT 1 15.62" B/2 − BACK 1 16" B/2 − − −
FRONT 2 15.62" B/2 − BACK 2 16" − − − −
FRONT 3 15.62" − − BACK 3 16" − − − − Damage OF Girders
Position Time(Sec) Span 1 (90m)L Span 2(200m)L Span 3(605/2m)L Span 4(605/2m)R Span 5(200m)R Span 6 (90m)R
Front 15.62" − B/2 B B − −
Back 15.62" − B/2 B B − −
Fig. 13: Overall damage of all members
VI. THE FEATURES SENSITIVE TO DAMAGE
In this method, it is focused on studying the reasons of
beginning the damage in different elements of the bridge,
progressing of damage in other sectors of the bridge and
occurring elements failure or bridge collapse in different
frequency ranges in the regions I to IV. Then the features
sensitive to damage and their displacements are determined in
the given conditions.
The identified features are confined to certain frequency
ranges. By the way, the cable stayed bridges health
monitoring is possible in each performance level with
evaluating the least bridge locations. Therefore, the detail
damaging of the features sensitive to damage should be
determined in different frequency ranges.
The features sensitive to damage are: displacement and root
mean square of the center of main span acceleration, lateral
displacement of the top of the towers, vertical displacement of
some points of the main girder of the deck near the towers and
cables strain.
The features sensitive to damage in the considered analysis
and the progress of potential damages are studied in the
following.
A. Controlling maximum displacement of the main span
center
Vertical displacement of the main span center one of the most
effective features in the trivial (small) damages to complete
collapse of the cable stayed bridge. Its effect is widely
observed in the cables of regions II and III. By continuing the
analysis, the process approaches to other regions and
elements and eventually leads to the overall collapse of the
bridge. The damage progression and overall collapse are
shown in Fig. 9-13 and tabulated in Tales 2-6. By conducting
several analyses in the given frequency range, the boundary
between safety and initial damage is well controlled based on
the performance level. Since all The analyses are all dynamic
time history and therefore the structural status can be
controlled throughout the analysis. The displacement of the
main span center exceeds the determined limitation (247cm,
Fig. 14) in the frequency range of 0-3Hz. (Table 2).
Therefore, one of the cables of region III meets failure
boundary. As the analysis continues, the damage goes toward
the cables of regions IV and II until stopping the analysis due
to the large displacement in Y direction and eventually
collapsing the right tower. Larger displacement of the main
span center is needed for structural collapse in the frequency
range of 3-6 Hz comparing to other ranges (Table 3). In this
frequency range, as the displacement of the main span center
exceeds the determined limitation (380cm, Fig. 14), one of
the cables of region III reaches the failure boundary.
Eventually, the damage progression toward region I lead to
the failure of deck in this region. The displacement of the
main span center exceeds the determined limitation (225cm,
Fig. 14) in the frequency range of 6- 9 Hz (Table 4).
Therefore, one of the cables of region III reaches failure
boundary. By conducting the analysis, the damage progresses
toward the cables of this region, 27% of which reaches the
failure boundary eventually leading to the failure of deck (Fig.
16). If in this frequency range an earthquake causes the
excitation modes of 46 – 61, the, damage is concentrated in
the cables and deck. The displacement of the main span center
exceeds the determined limitation (220cm, Fig. 14) in the
frequency range of 9-12 Hz (Table 5). In this condition causes
damage is occurred in the cables of region II and progressed
in those of regions III and IV. Then the cables of region II

A new methodology for health monitoring of cable-stayed bridges; identifying the major features sensitive to
damage/failure
10 www.ijeas.org
reach the failure boundary; eventually, the left tower is
damaged leading to the deck collapse (Fig. 12).In the
frequency range of 12-15 Hz (Table 6), the displacement of
the main span center goes beyond the determined limitation
(214cm, Fig. 14) and the cables of region III meet the failure
boundary. By conducting the analysis the damage progresses
towards the cables of regions II and III and exceed the failure
boundary. This trend continues until the deck of the region III
is collapsed due to the damage occurred in the columns of the
right tower (Fig. 13). In the given bridge, this frequency range
leads to the excitation modes of 78 to 90.
Fig. 14: Comparing the displacements of main span center in
different frequency ranges
Fig. 14 shows the displacements of the main span center,
regarding both front and back of the bridge, in all given
frequency ranges. The cable stayed bridge is collapsed if the
displacement of main span center goes beyond its minimum
value (i.e. 213 cm in the frequency range of 12-15 Hz).
Therefore, the excitation modes of 78 to 90 are dominant in
this frequency range.
B. Controlling the acceleration root mean square of the main
span center
The acceleration of main span center is another other feature
sensitive to damage proposed for restricting the damage of
cable stayed bridges. Therefore, the values of root mean
square of main span center (front and back parts) are
calculated and compared in different frequency ranges.
Measuring the acceleration is more convenient (lower price)
in comparison with that of displacement. Therefore, this
feature is evaluated in different frequency ranges to determine
the failure boundary of the bridge elements. Then damage to
different frequency ranges and the safety boundary are
examined precisely. According to Fig. 15, both acceleration
components of the front and back of the deck are very close to
each other. The root mean square values in the frequency
range of 0-3 Hz are calculated for both front and back of the
frames. As the root mean square value becomes higher than
beyond 906 cm/s2, the first cable of region III reaches the
failure limitation. The trend goes toward region II, eventually
leading to the left tower failure, Fig. 9. Finally, the bridge will
collapse because of the failures occurred in the cables and
towers.
FIG15: The acceleration root mean square of the main span
center for all given frequency ranges
In the frequency range of 3-6 Hz, as the root mean square
value goes beyond 4481 cm/s2 (Fig. 15), the cables of region
III reach failure limitation and the trend progresses toward
region I (Table 3).Meanwhile, the damage increases in the
girders of region III. Eventually, the girders of region I are
mechanized and the analysis is stopped. No damage occurs in
the towers in the above mentioned frequency range; the bridge
will collapse due to the collapse of cables and deck (Fig. 10).
In this frequency range If an earthquake causes the excitation
modes of 24-46, the condition will lead to the damage of
cables and deck.
In the frequency range of 6-9 Hz (Table 4), as the root mean
square value goes beyond 1394 cm/s2 (Fig. 15), the cables of
region III reach failure limitation. By continuing the analysis,
the damage progresses towards the cables; 27% of the cables
go beyond the failure limitation and leading to the failure of
deck (Fig. 11). The bridge will collapse because of the failure
in the cables and deck. In this frequency range, if an
earthquake causes the excitation modes of 46 – 61, the
damage is concentrated in the cables and deck.
In the frequency range of 9-12 Hz (Table 5), as the root mean
square value goes beyond 850 cm/s2 (Fig. 15), the cables are
stretched leading to damage of the cables of region II. This
condition progresses toward regions III and IV. By
continuing the analysis, the damage progresses toward the
cables region II. Therefore, the cables go beyond the failure
limitation, leading the trend to the failure of columns of the
left tower. The process is continued up to the deck collapse in
the region II (Fig. 12). The collapse of cables, towers and
deck will lead to the bridge collapse. In this frequency range if
an earthquake causes the excitation modes of 61-78, the
damage is concentrated in the cables, towers and deck.
In the frequency range of 12-15 Hz (Table 6) the root mean
square for both values are very close to each other in the front
and back of the frames, about 556 cm/s2- (Fig. 15). As the root
mean square value goes beyond 556cm/s2, the cables of
region III reach failure limitation progressing toward the

International Journal of Engineering and Applied Sciences (IJEAS)
ISSN: 2394-3661, Volume-4, Issue-4, April 2017
11 www.ijeas.org
cables of regions II and I. By continuing the analysis, the
damage expands to the cables of regions II and III and goes
beyond the failure limitation. However, the cables of region I
reach the failure limitation without any changes in their
conditions. Finally, this status damages the columns of right
tower and the deck of region III will eventually collapse (Fig.
13).The failure of cables, towers and deck will lead to the
bridge collapse. In this frequency range if an earthquake
causes the excitation modes of 78-90, the damage is
concentrated in the cables, towers and deck.
According to the results obtained in this research, the
displacement of the main span center corresponds to its root
mean square. Therefore, root mean square of the main span
center can be used instead of its displacement in order to
decrease the costs.
C. Controlling the lateral displacement of top of the towers
Based on the analyses conducted in the different frequency
ranges, if the lateral displacement goes beyond the
displacement of top of the towers in Y and X directions,
severe damages are happened in different elements of the
bridge. Therefore, besides identifying the damage limitation
precisely, the displacement of top of the towers is controlled
and determined to keep the performance level in the safe
condition and prevent the damage from progressing.
Here, the damage is examined from two points of view: 1)
when increasing in the lateral displacement of top of the
towers leads to the deck failure; 2) lateral displacement of top
of the towers leads to the damage to the cables, deck and deck
columns.
The coincident lateral displacements of top of the right and
left towers in X and Y directions are compared in all
frequency ranges and presented separately in the Figs. 17- 18.
According to Fig. 17, the lateral displacement of top of the
right and left towers in direction X, causes the increase of
cables strain in different regions of the bridge without any
failure in the towers. This fact is discussed in the section
concerned about the strain and its increase in the cables, Fig.
26.In the frequency range of 3-6 Hz, maximum lateral
displacement of top of the towers in X direction is related to
the right tower (i.e. about 84cm). As the lateral displacement
of top of the towers in X direction goes beyond the maximum
value (84cm), a cable of region III reaches the failure
boundary and a cable of region I exceeds the failure boundary.
Meanwhile, the damage occurred in the towers of region IV
increases and eventually the analysis is stopped by
mechanizing the girders of region I (Table 3). No damage is
occurred in the towers in this frequency range. Therefore, the
cables and deck are failed due to the large lateral
displacement of top of the towers leading eventually to the
bridge collapse. Therefore, the lateral displacement of top of
the towers is restricted to prevent the potential damages and
control the outer cables (regions I and IV) and deck. The
frequency ranges of 6-9, 9-12 and 12-15 Hz have been studied
in direction X for both right and left towers. According to the
obtained results, if the lateral displacement of top of the
towers goes beyond certain values (Fig. 16), only the cables,
deck and tower’s columns are damaged. However, no failure
is occurred in the towers.
FIG16: Lateral displacements of top of the towers (X) for all
given frequency ranges
The frequency ranges of 3-6, 6-9, 9-12 and 12-15 Hz in
direction Y have been studied for both right and left towers
(Fig. 17). Based on the obtained results, the lateral
displacement of top of the towers is very small causing no
damage to the bridge. However, in the frequency range of 0-3,
the lateral displacement of top of the right tower is about
55cm. If the lateral displacement values of top of the towers in
X and Y directions go beyond maximum (about 65cm), a
cable of region III reaches the failure boundary.
Fig. 17: Lateral displacements of top of the towers (Y) for all
given frequency ranges
As the analysis continues, the damage progresses to the cables
of regions IV and II. Dramatic increase in the lateral
displacement of top of the towers in direction Y leads to the
tower failure and eventually stopping the analysis. Therefore,
in the frequency range of 0-3 Hz if an earthquake causes the
excitation modes of 1-24, the lateral displacement of top of
right tower in direction Y will increase. Eventually, the
condition leads to tower failure. Fig. 18 shows the modes 16
and 19 along with the failure of right tower failure in direction
Y.

A new methodology for health monitoring of cable-stayed bridges; identifying the major features sensitive to
damage/failure
12 www.ijeas.org
Fig. 18: The modes 16 and 19 in frequency range of 0-3 Hz.
Lateral displacement values of top of towers calculated in this
research. By the way, the towers conditions are controlled; the
damage is prevented from progressing to the other parts of the
bridge; and the bridge is kept in the safe limitation.
Comparing the displacement of the main span center and
lateral displacement of top of the towers, there will be three
different scenarios for bridge damage:
1) Lateral displacement values of top of the towers in
direction X exceed 85 cm and the displacement value of the
main span center is over 3.5 m. The earthquake excitation will
cause a great vertical displacement in the main girder. At the
same time a great displacement is occurred in the towers in
direction X. In this state the damages are mostly seen in the
cables and deck of regions I and IV (Fig. 19-1) (Kobe
earthquake in the frequency range of 3-6 Hz).
2) Lateral displacement of top of the towers is limited to 45
cm and the displacement of the main span center 2.20 m.
Therefore, the earthquake excitation causes lower
displacements of the main girder in the vertical direction and
the towers in X direction, comparing to the first state. In this
situation the damages are mostly seen in the cables and deck
of regions II and III (Fig. 19-2) (Kobe earthquake in the
frequency range of 0-3, 6-9, 9-12 and 12-15 Hz.).
3) Lateral displacement values of top of the towers are higher
than 60cm and 55cm in X and Y directions, respectively. The
earthquake excitation causes large displacements in the
towers in X and Y directions. In this state the damage is ended
to the towers failure (Fig. 19-3) (Kobe earthquake in the
frequency range of 0-3 Hz.).
Fig. 19: Damage scenarios for different regions of bridge
D. Vertical displacement of some points of deck near the
towers
The regions II and III are divided into three parts for better
understanding of the collapse modes. These parts are: the
cables near the tower; middle cables; and the cables near the
main span center, Fig. 20. By conducting the analyses, deck
collapse is seen in some of the frequency ranges. All collapses
are observed in the region near the towers (region III). The
exact safe limitation is determined by studying the vertical
displacement of the failure points in the front and back
frames. The safe limitation is shown in Figs. 21- 24.
Fig. 20: Division the inner areas of cables
The vertical displacement of main span center as well as the
failure points of area 3 (Fig. 20) should be considered in order
to control the bridge condition more precisely. According to
the damage progression shown in Figs. 14 -18, the damages
and deck failure are mostly observed in area 3. These points
are: point 228 in the left back frame in region II; point 726 in
the left front frame in region II; point 573 in the right front
frame in region III.
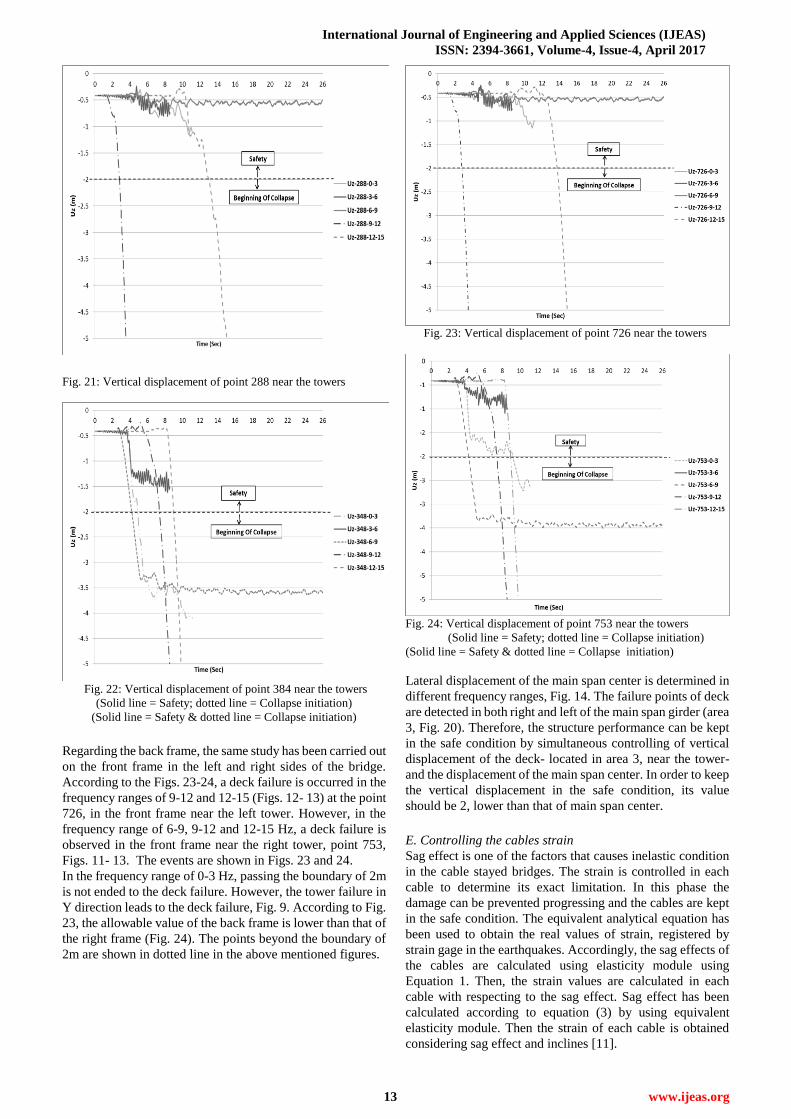
According to Fig. 21, the deck is failed in the frequency
ranges of 9-12 and 12-15 Hz due to the vertical displacement
of the back frame deck near the left tower (point 288), Figs.
12-13. However, by limiting the vertical displacement to 2m,
all the cables will remain in the safe limitation.
The deck is failed in the frequency range of 6-9, 9-12 and
12-15 Hz (Figs. 11- 13) due to the vertical displacement of the
back frame deck near the right tower (point 348, Fig. 22).
Therefore, the boundary between safe limitation and damage
initiation is about 2m for cables. If the boundary is higher than
2m, the cables will enter the failure limitation. Though in the
frequency range of 0-3 Hz, exceeding this boundary value
does not lead to the deck failure. The tower failure in Y
direction leads to the deck failure in this frequency range, Fig.
9.
International Journal of Engineering and Applied Sciences (IJEAS)
ISSN: 2394-3661, Volume-4, Issue-4, April 2017
13 www.ijeas.org
Fig. 21: Vertical displacement of point 288 near the towers
Fig. 22: Vertical displacement of point 384 near the towers
(Solid line = Safety; dotted line = Collapse initiation)
(Solid line = Safety & dotted line = Collapse initiation)
Regarding the back frame, the same study has been carried out
on the front frame in the left and right sides of the bridge.
According to the Figs. 23-24, a deck failure is occurred in the
frequency ranges of 9-12 and 12-15 (Figs. 12- 13) at the point
726, in the front frame near the left tower. However, in the
frequency range of 6-9, 9-12 and 12-15 Hz, a deck failure is
observed in the front frame near the right tower, point 753,
Figs. 11- 13. The events are shown in Figs. 23 and 24.
In the frequency range of 0-3 Hz, passing the boundary of 2m
is not ended to the deck failure. However, the tower failure in
Y direction leads to the deck failure, Fig. 9. According to Fig.
23, the allowable value of the back frame is lower than that of
the right frame (Fig. 24). The points beyond the boundary of
2m are shown in dotted line in the above mentioned figures.
Fig. 23: Vertical displacement of point 726 near the towers
Fig. 24: Vertical displacement of point 753 near the towers
(Solid line = Safety; dotted line = Collapse initiation)
(Solid line = Safety & dotted line = Collapse initiation)
Lateral displacement of the main span center is determined in
different frequency ranges, Fig. 14. The failure points of deck
are detected in both right and left of the main span girder (area
3, Fig. 20). Therefore, the structure performance can be kept
in the safe condition by simultaneous controlling of vertical
displacement of the deck- located in area 3, near the tower-
and the displacement of the main span center. In order to keep
the vertical displacement in the safe condition, its value
should be 2, lower than that of main span center.
E. Controlling the cables strain
Sag effect is one of the factors that causes inelastic condition
in the cable stayed bridges. The strain is controlled in each
cable to determine its exact limitation. In this phase the
damage can be prevented progressing and the cables are kept
in the safe condition. The equivalent analytical equation has
been used to obtain the real values of strain, registered by
strain gage in the earthquakes. Accordingly, the sag effects of
the cables are calculated using elasticity module using
Equation 1. Then, the strain values are calculated in each
cable with respecting to the sag effect. Sag effect has been
calculated according to equation (3) by using equivalent
elasticity module. Then the strain of each cable is obtained
considering sag effect and inclines [11].

A new methodology for health monitoring of cable-stayed bridges; identifying the major features sensitive to
damage/failure
14 www.ijeas.org
(3)
Where, E is the elasticity module of cable; L0 is horizontal
projected length of the cable; γ is specific gravity of the cable;
σ1 is primary tension stress; and σ2 is the tension stress of
cable. The damage limitation, damage process and
performance level of cables are determined using tension
stress equation. The performance level is achieved according
to the values of strain and damage of the longest cable located
in region III (cable 61) in all frequency ranges, Fig. 25.
Fig. 25 shows the changes of strain-stress for the cable
number 61 in the frequency ranges of 0-3 Hz and 12-15 Hz.
The cable is studied precisely in different performance levels
in order to obtain their exact corresponded values of strain.
(1) (2)
Fig. 25: The performance levels of cable 61 in the frequency ranges of 0-3, 12-15 Hz.
In the frequency range of 0-3 Hz. (Fig. 25-1) the stress and
consequently bearing capacity of cable decrease as the strain
increases (over 0.0024); it goes beyond the limitation C.
According to the figure, if the cables incline (at the end of
analysis) the stress increases again perhaps due to the residual
strain. When two ends of the cable move towards each other
and causes the inclination of cable, the stress becomes zero.
However, the length of cable increases, some parts of which is
elastic and some inelastic. This condition is clearly seen in the
frequency range of 12-15Hz. After passing the failure
boundary, with the increase of strain the bearing capacity
decreases until the stress reaches zero (Fig. 25-1).The
performance levels are all calculated easily and accurately as
the conducted analyses have been dynamic time history. The
strain values, obtained from analyses, are 0.0020, 0.0022 and
0.0024 for limitations B, IO and LS, respectively. The
performance levels are presented as C and E points in Fig. 7
for the strain values greater than 0.0024.The limitations
corresponding to different strain values have been
determined. The strain values have been calculated for
different regions and shown in Fig. 26. According to this
figure, in the frequency range of 0-3Hz, the cables of region
III reach the limitations C and E exceeding the strain of
0.0024 (9- 11.12 sec.) and stopping the analysis at 11.12 sec.
Fig. 9 shows the damage values of the cables of front frame in
region III as 27% C and 72% E. Fig. 26-1 shows the cables 56
to 61, exactly corresponded to Fig. 9.
The cables of front frame in region III have been studied in the
frequency range of 3-6 Hz. In this condition only one cable
goes beyond the failure boundary. The damage values of
cables are 5% C, 38% IO, 50% B, shown Fig. 10. These
values confirm the results obtained in this research. All cables
are at the maximum strain of 0,002, excluding the cable
number 30 which is higher than that, Fig. 26-2. In the
frequency range of 6-9Hz, the cables number 30, 33, 35 and
39 of the front frame in region III reach failure limitation and
their strain values exceed 0.0024, Fig. 26-3. Their damage
values 16% LS, 22% IO, 27% B and 27% E, respectively, Fig.
11. These values well confirm the illustration of Fig. 33. In the
frequency range of 9-12Hz, all cables of front frame in region
III reach failure limitation with the strain values over 0.0024.
The condition for cable number 22 is shown in Fig. 26-4.
According to Fig. 12, the damage value of cables is 100% E
that confirms the results illustrated in the figure. In the
frequency range of 12-15Hz, all cables of front frame in
region III reach the collapse limitation (with the strain values
over 0.0024) except the cables 30, 33 and 35 that remain in
the elastic limitation, Fig. 26-5. The illustration of this figure
is confirmed by the obtained damage value of cables (83% E),
shown in Fig. 13.

International Journal of Engineering and Applied Sciences (IJEAS)
ISSN: 2394-3661, Volume-4, Issue-4, April 2017
15 www.ijeas.org
(1) (2)
(3) (4)
(5)
Fig. 26: Comparing the Strains of Right Inner Cables in Different Frequency Ranges
The amount of damage occurred in each cable can be
determined by controlling the strains. If cable strain exceeds
the identified value (0.0024), the inelastic limitation can be
determined according to the defined performance level.
Therefore, the structure is kept in the safe limitation and the
damage extension is prevented by controlling the inelastic
limitation precisely.
VII. DETERMINING AND CONTROLLING THE FEATURES
SENSITIVE TO DAMAGE
The analyses have been conducted using Kobe earthquake in
the frequency ranges of 0-3, 3-6, 6-9, 9-12 and 12-15Hz. The
features sensitive to damage have been determined. These
features are: lateral displacement of top of the towers, vertical
displacement of some points of main girder of deck near the
towers and cables strain. The suggested methodology should
be controlled by some other control sample earthquakes as
well. For this purpose, Big Bear, Chi-Chi and El-Centro
earthquakes are selected having the acceleration spectrums
different from that of Kobe earthquakes.. Their acceleration
spectrums for X directions are illustrated in Fig. 27.
If the results obtained from these earthquakes are
corresponded to that of Kobe earthquake, it is inferred that the
proposed methodology is acceptable. Accordingly, the
structure can be kept in the safe limitation. Moreover, the
damage extension is prevented by controlling the features
sensitive to damage.
Fig. 27: Acceleration spectrum X

A new methodology for health monitoring of cable-stayed bridges; identifying the major features sensitive to
damage/failure
16 www.ijeas.org
Table 7 presents the results of analyses conducted on the
control sample earthquakes as well as the features sensitive to
damage. According to the results obtained for Big Bear
earthquake, the displacement of main span center, lateral
displacement of top of the tower and root mean square of
acceleration are similar to that of Kobe earthquake in the
frequency range of 3-6Hz (Figs. 14-17).
Table 7: The analysis results of control sample earthquakes EQ. Dis. Middel Span ( m) Dis. Left Tower Top (Cm) Dis. Right Tower Top (Cm) RMS - X (Cm/S
2) RMS - Y (Cm/S
2) RMS - Up (Cm/S
2) RMS (Cm/S
2) Dominant frequency (Hz.)
BIG BEAR /Front 3.13 72(x)-2.5(y) 54(x)-0.18(y) 2792 1345 851 3214 (3-6)
BIG BEAR/Back 3.13 57(x)-2.5(y) 54(x)-0.18(y) 3649 1345 824 3975 (3-6)
CHI CHI/Front 2.49 45x)-68(y) 43(x)-71(y) 4296 1262 1137 4620 (0-3)
CHI CHI/Back 2.5 46(x)-68(y) 45(x)-71(y) 2008 1263 1132 2628 (0-3)
EL-CENTRO/Front 2.6 57(x)-76(y) 56(x)-77(y) 1403 1170 1006 2086 (0-3)
EL-CENTRO/Back 2.64 56(x)-76(y) 57(x)-77(y) 2856 1171 1058 3263 (0-3) According to the obtained results, the damage caused by Big
Bear earthquake is exactly the same as that of Kobe event in
the frequency range of 3-6 (Fig. 10). In this frequency range
the damage progresses to the cables of region I causing the
failure of deck.
Concerning the Fourier domain of Big Bear earthquake, the
maximum domain is in the frequency range of 3-6 Hz, Fig. 28.
Fig. 28: Fourier Domain of Big Bear Earthquake Fig. 29: Fourier Domain of Chi-Chi Earthquake
Based on the results obtained for Chi-Chi and El-Centro
earthquakes (Table 7), lateral displacement of top of the
towers in Y direction is similar to that of Kobe earthquake in
the frequency range of 0-3 Hz (Figs. 16- 17). The
displacement of the main span center is exactly the same as
that of Kobe earthquake in the frequency range of 0-3Hz.
(Fig. 14) in which the damage eventually progresses to the
deck, girders under deck and towers` columns.
Regarding the Fourier domains of Chi-Chi and El-Centro
earthquakes, maximum domain is in the frequency range of
0-3Hz, The fact has been presented in Fig. 29 for Chi-Chi
earthquake. Therefore, if an earthquake is in a frequency
range of Kobe earthquake, the expected damages are exactly
the same as that of Kobe.
VIII. CONCLUSION
In this paper a new methodology is proposed to identify the
features sensitive to damage based on different frequency
ranges of input earthquakes. In the suggested method, it is
likely to and examines the beginning phase, progression and
extension of damage can be identified and controlled.
Therefore, the cable stayed bridges can be practically kept
safe by restricting the potential damages. By applying this
methodology along with complementary control systems, the
potential damages can be prevented from occurring in the
cable stayed bridges.
In this methodology, first, the earthquake is normalized to 1g
in the vertical, transversal and longitudinal directions and
used as the input for nonlinear dynamic time history analyses.
Then, each 3-component record is divided into frequency
ranges of 0-3, 3-6, 6-9, 9-12 and 12-15. Each frequency range
covers 10 to 25 frequency modes of the bridge. The
acceleration increased in the given frequency range up to
damage occurred in the bridge. At this stage, by identifying
the failure modes, all damage stages are controlled, from
damage initiation to the bridge collapse, in each frequency
ranges. Finally, the excitation mode which causes different
potential damages to the bridge is found. Then, the features
sensitive to damage and their changes are determined by
examining the failure modes of the bridge. The features,
considered in this study are: 1) vertical displacement of main
span center; 2) root mean square of the acceleration of main
span center; 3) lateral displacement of top of the towers; 4)
vertical displacement of some points of the main girder of the
deck (area 3 located in regions II and III) near the towers; 5)
strain of cables. In the proposed methodology, the exact
boundaries of the recognized features for damage initiation,
extension of damages, and finally collapse conditions of the
bridge are quantifiable.
In order to verify the proposed methodology, other
earthquake records such as the Big Bear, the Chi-Chi, and the
El Centro earthquake records are examined and their results
are compared with those concern to the Kobe earthquake,
extensive analyses show that the proposed methodology is
robust and very strong to recognize a few specific features of a
cable-stayed bridge in order to determine the bridge
vulnerability and its controlling to prevent damages in
different parts of cable stayed bridges due to various sources
of excitations.

International Journal of Engineering and Applied Sciences (IJEAS)
ISSN: 2394-3661, Volume-4, Issue-4, April 2017
17 www.ijeas.org
REFERENCES [1] Brownjohn J. M. W., Bocciolone M, Curami A, Falco M, Zasso A,
Humber Bridge full-scale measurement campaigns 1990-1991.
JWEIA 52 185-218, 1994.
[2] Barr I. G., Waldron P., Evans H. R., Instrumentation of glued segmental
box girder bridges. Monitoring of Large Structures and Assessment
of their Safety.IABSEColloquium Bergamo, 1987.
[3] Lau CK, Wong KY, Design, construction and monitoring of three key
cable-supported bridges in Hong Kong. Proc 4th International
Kerensky Conference on Structures in the new millennium, Hong
Kong, 105-115, 1997.
[4] Leitch J, Long A E, Thompson A, Sloan T D, Monitoring the behavior of
a major box-girder bridge. Structural Assessment Based on Full and
Large-Scale Testing, BRE Garston 212-219, Butterworth, 1987.
[5] Chang, K. C., Mo, Y. L., Chen, C. C., Lai, L. C. and Chou, C. C. 2004.
Lessons Learned from the Damaged Chi-Lu Cable-Stayed Bridge.
Journal of Bridge Engineering, ASCE, Vol. 9, No. 4,343-352.
[6] Farrar, C.R., and James, G. H. Ⅲ, 1997, System Identification from
Ambient Vibration Measurements on a Bridge, Journal of Sound and
Vibration, Vol. 205(1), pp. 1-18.
[7] Huang, C.C., and Loh C.H., 2001, Nonlinear Identification of Dynamic
System Using Neural Networks, Journal of Computer-Aided Civil
Infrastructure Engineering, Vol.16, pp. 28–4.1
[8] Nazmy A.S., Abdel-Ghaffar A.M., ‘Three-Dimensional Nonlinear Static
Analysis of Cable-Stayed Bridges’, Computers and Structures, 34,
pp. 257-271, 1990.
[9] Nazmy, A. S., and Abdel-Ghaffar, A. M. (1990a). Non-linear
earthquake-response analysis of long-span cable-stayed bridges:
Theory. EarthquakeEngrg.andStruct. Dyn., 19, 45–62. [10] Abdel-Ghaffar, A. M., and Nazmy, A. S. (1991). 3-D nonlinear seismic
behavior of cable-stayed bridges. J. Struct. Engrg, ASCE, 117(11),
3456–3476.
[11] Nazmy A.S., Abdel-Ghaffar A.M., ‘Three-Dimensional Nonlinear
Static Analysis of Cable-Stayed Bridges’, Computers and Structures,
34, pp. 257-271, 1990.
[12] Fleming, J. F., and Egeseli, E. A. (1980). Dynamic behavior of a cable
stayed bridge. Earthquake Engrg.andStruct. Dyn. 8, 1–16.
[13] Nazmy, A. S., and Abdel-Ghaffar, A. M. (1990a). Non-linear
earthquake- response analysis of long-span cable-stayed bridges:
Theory. EarthquakeEngrg.andStruct. Dyn., 19, 45–62.
[14] Lee, Z. K., Chen C. C., Chou, C. C. and Chang, K. C. 2006. Finite
Element Analysis of Ambient Vibration Signal of Stay Cables.
Journal of Chinese Institute of Civil and Hydraulic Engineering, Vol.
18, No. 2, 279 - 288.
[15] Loh, C. H., and Ho, R. C. (1990). Seismic damage assessment based on
different hysteretic rulers. Earthquake Engrg.andStruct. Dyn. 19,
753–771.
[16] Betti, R., Abdel-Ghaffar, A. M., and Nazmy, A. S. (1993). Kinematic
soil-structural interaction for long-span cable-supported bridges.
Earthquake Engrg.andStruct. Dyn., 22(5), 415–430.
[17] Mohammad Hashemi Yekani. Monitoring systems optimization and
provide application of software for bridges and tall structures.
PH.D. Thesis, Department of Civil Engineering, Research and
Science Branch Islamic AzadUniversity,Tehran,Iran;2017.
[18] Wei-Xin Ren1 and Makoto Obata2. ELASTIC-PLASTIC SEISMIC
BEHAVIOR OF LONG SPAN CABLE-STAYED
BRIDGES’JOURNAL OF BRIDGE ENGINEERING / AUGUST
1999.
[19] Tang, M. Cable-Stayed Bridges. Bridge Engineering
Handbook.Ed.Wai-Fah Chen and LianDuan CRC Press, 2000.
[20] Federal Emergency Management Agency, FEMA-356.Prestandard
and commentary for seismic rehabilitation of buildings. Washington
(DC);2000.
[21] Peer Strong Motion Database Record. Processing By Pacific
Engineering


![[TECH]Cable Stayed Bridges](https://img.dokumen.tips/doc/110x75/544cd985b1af9f3a0b8b4c5b/techcable-stayed-bridges.jpg)