Embed Size (px)
Citation preview

Research ArticleA New Method for Interindustry Linkage Analysis Based onDemand-Driven and Multisector Input-Output Model and ItsApplication in Chinarsquos Manufacturing and Producer Services
Xiao Liu 12 and Jinchuan Shi 1
1School of Economics Zhejiang University Hangzhou 310007 China2Zhejiang Economic Information Center Hangzhou 310006 China
Correspondence should be addressed to Jinchuan Shi jinchuan_shi163com
Received 24 April 2020 Revised 23 June 2020 Accepted 13 July 2020 Published 20 August 2020
Guest Editor Baogui Xin
Copyright copy 2020 Xiao Liu and Jinchuan Shi +is is an open access article distributed under the Creative Commons AttributionLicense which permits unrestricted use distribution and reproduction in any medium provided the original work isproperly cited
Interindustry linkage analysis is an important interdisciplinary research field of technical economic and complex systems and theresults can be used as critical bases for making strategies and policies of economic development +is study reviews the previousmethods for measuring interindustry linkages and their disadvantages and puts forward a new method for interindustry linkageanalysis in a complex economic system on the basis of demand-driven and multisector input-output model Firstly it makes afurther decomposition of the Leontief inverse matrix in the economic sense and decomposes the gross output of one industrialsector or its sub-industries into three components +en it analyzes the structural features of output and measures the in-terindustry linkages between two industrial sectors with three indices interindustry linkage effect interindustry linkage con-tribution and interindustry linkage coefficient Compared with the previous measurements the method in this study has threeobvious advantages it integrates the sectoral internal effect and external linkage effect at the same time it can not only measure theinterindustry linkage effects between two given industrial sectors but also clearly describe the composition ratio of the direct andindirect interindustry linkage effects and it adopts respectively the absolute flow value relative flow value and unit relative valueto measure the linkages comprehensively Finally this study takes Chinarsquos input and output in 2017 as an application case toanalyze the structural features of output of its manufacturing and producer services and measure the interindustry linkagesbetween them
1 Introduction
National economy is a large and complex system and theindustries in it interact with and impact each other Inter-industry linkage is a kind of technical and economic linkexisting extensively among the industries and the conceptwas first introduced by Hirschman in 1958 based on thetheory of unbalanced development [1] Since the 1950s withthe acceleration of industrialization in developing countriesinterindustry linkages have gained extensive attention fromacademia circle industrial field and policy-makers and areused to measure the relative importance of industries inorder to identify the key industries which are central foreconomic development and can drive economic high-speed
growth +erefore an applicable and reasonable method tomeasure the interindustry linkages is helpful to recognize therelationship between or among industries promote the levelof balanced development of the entire economic system andeven optimize the industrial structure of the nationaleconomy Over the years the previous scholars have con-ducted many research studies on the analysis of interin-dustry linkages from different perspectives In general thetraditional econometric analysis and input-output analysisare two main and common kinds of methods which can beused to well describe the interrelatedness of industries
+e former is a relatively indirect method which gen-erally first puts forward hypotheses and then usually adoptsthe econometric model such as the panel data regression
HindawiComplexityVolume 2020 Article ID 3857981 16 pageshttpsdoiorg10115520203857981
model or the vector autoregressive (VAR) model to searchthe supporting empirical evidences based on the macro-statistics data of the economy system eg Banga and Goldaruse regression analysis model to research the contribution ofservices to manufacturing output growth and productivityon the basis of Indian panel data [2] Francois andWoerz useregression analysis model to research the interaction be-tween production services andmanufacturing on the basis ofthe panel data on goods and services trade of Organizationfor Economic Co-operation and Development (OECD)during 1994ndash2004 [3] Ke et al conduct a panel data analysisof Chinese cities and construct a simultaneous equationmodel of co-agglomeration of producer services andmanufacturing that highlights the synergy effects of the twosectors located in the same cities or neighboring cities [4]Kong and Liang use VAR model to analyze the interactionbetween producer services and manufacturing in ShaanxiProvince China [5]
+e latter is a relatively direct method which is firstintroduced by Leontief in 1936 [6] and it quantitativelyanalyzes or computes the interindustry linkages or rela-tionships through the input-output data and a series of linearequations eg Guerrieri andMeliciani study empirically theinterindustry linkages between producer service and threemajor industries on the basis of the input-output data ofDenmark the UK Germany France Japan and the US [7]through measuring the backward and forward linkages ofone certain industry Chiu and Lin investigate the role andinfluence of the maritime sector on the national economy ofTaiwan [8] Mattioli and Lamonica evaluate the informationand communications technology (ICT) role in the worldeconomy [9] Khanal et al study the significance of eco-nomic linkages between the tourism sector and the rest ofthe economy in Lao Peoplersquos Democratic Republic (LaoPDR) [10] Guerra and Sancho measure the role of energyand non-energy efficiency gains in an interconnected andmultisector economy with the hypothetical extractionmethod [11] which is a powerful input-output analysis tooland will be discussed later Sajid et al conduct a serial ofresearches on carbon linkages via hypothetical extractionmethod or its modification [12 13] Wang et al employ thehypothetical extraction method to map flows of embodiedair pollutant emission from economic sectors in China [14]and even conduct an analysis on interregional and sectorallinkages of air pollutant emissions in Beijing-Tianjin-Hebeiregion of China [15] Ali et al use the Asian DevelopmentBank input-output database to analyze and compare theperformance of the construction sector in some south Asiancountries [16]
Comparing the two kinds of methods mentioned abovealthough the latter is insufficient in terms of data immediacyand availability due to the fact that input-output data usuallyare only issued by the official statistics department every fewyears it can provide a more convictive and micro-viewperspective to describe the interrelatedness of industries andovercome the disadvantages of the former that it is difficultto obtain high quality economic statistics data and reflectpromptly when the economic structure changes greatlyWhat is more due to an apparent intimate tie between the
interdependencies studied in input-output analysis and thecausal relations expressed in Hirschmanrsquos interindustrylinkages Hirschmanrsquos interindustry linkages have beenembraced by input-output economists [17]
+erefore on the foundation of the theory of input-output analysis this study designs a new method for in-terindustry linkage analysis based on demand-driven andmultisector input-output model and applies it in the sce-nario of Chinarsquos Manufacturing and Producer ServicesSince its obvious advantages compared with the previousmeasurements of interindustry linkages specifically dis-cussed later the authors hold that it is a helpful tool foranalyzing the interrelatedness between two industrial sectorsand identifying the key weak links
Section 2 reviews the theory of input-output and in-terindustry linkages and summarizes the features and dis-advantages of different attempts to measure theinterindustry linkages In Section 3 demand-driven andmultisector input-output model is carried out in which theoutput and Leontief inverse matrix are structurallydecomposed in economic sense it also presents the ways toanalyze the output structural features of an industrial sectorand its sub-industries and measure the interindustry link-ages between two different industrial sectors in particularthis study takes China as an example to emphatically analyzethe interindustry linkages between its manufacturing andproducer services in a framework of multisector economicsystem Section 4 presents the results of the application inChina and then the specific discussion and policy impli-cation are presented in Section 5 +e paper ends up with adiscussion of the value of this method in analyzing theinterindustry linkages in multisector economic system
2 Theoretical Background
According to the view of Hirschman [1] any nonprimaryactivity which does not only produce for final demand exertstwo distinct effects by means of its demand for and supply ofintermediate inputs respectively so the interindustrylinkage has two different types+e demand stimulates othersectors to satisfy its intermediate requirements which isnamed backward linkage the supply also stimulates sectorsbecause its output is also taken as an input in new activitieswhich is named forward linkage Chenery and Watanablersquoswork firstly attracts the scholarsrsquo attention [18] which isconducted on the basis of the input coefficient matrix andconsidered to be the earliest measurement of Hirschmanrsquosinterindustry linkages However the analysis based on theinput coefficient matrix only considers the first round ofconsumption in the entire economic system ignoring theinterrelatedness of indirect transfer namely the measure-ment is incomplete Rasmussenrsquos dispersion indices on thebasis of Leontief inverse matrix (also called total require-ments matrix) is another attempt to measure interindustrylinkages [19] and it has been widely used because it can becredited with including indirect effects and distinguishingbetween backward linkage and forward linkage despite thefact that Rasmussenrsquos original research is before Hirschmanintroduced the concept of interindustry linkages Based on
2 Complexity
the pioneering work of Hirschman Chenery andWatanableand Rasmussen the theoretical and applied researches onthe measurement of interindustry linkages have been con-ducted widely and the later scholars have put forwardvarious schemes to refine the measurement of interindustrylinkages
Jones questions the use of Rasmussenrsquos index ofsensitivity of dispersion as a measurement of forwardlinkage then puts forward a new method to measure theforward linkage on the basis of Ghosh inverse matrixinstead of Leontief inverse matrix and elaborates its valuein detail [20] Cuello et al refine Rasmussenrsquos measure-ment through introducing a serial of parameters which areused in weighting the coefficients in Leontief inversematrix in order to take the relative importance of dif-ferent industries into consideration [21] Referring to theresearch of Cuello et al Drejer even introduces knowl-edge as a weight in terms of knowledge intensive in-dustries [17] Hazari and Laumas discuss whether theweighting of different industries should be considered inthe measurement of interindustry linkages although theirviewpoints are not the same Hazari holds that weightingor not weighting depends on the purpose of analysis [22]while Laumas is more inclined to adopt the measurementin the weighted form [23]
Since Rasmussenrsquos dispersion indices and the modi-fied methods evaluate the two types of linkages separatelyhypothetical extraction method is proposed as a new andmore practical method [24 25] In this method the im-portance of a sector also called its total linkage ismeasured by comparing numerically the output levels ofeconomy before and after the hypothetical extraction inwhich the row and column input-output data of this sectorare deleted (Instead of physically deleting them they cansimply be replaced by zeros) Cella modifies the methodand the measure of total linkage in his research not onlyexcludes feedback processes which are purely internal tothe selected industry but also is decomposable into ad-ditive components measuring backward and forwardlinkages respectively [26] Duarte et al further modifyCellarsquos method and decompose the total linkage into fourcomponents internal effect mixed effect net backwardlinkage and net forward linkage when studying the be-havior of the productive sectors of the Spanish economyas direct and indirect consumers of water [27] Differentfrom the studies that have mostly calculated both back-ward and forward linkages using only demand-drivenLeontief inverse model Sajid et al estimate the linkagesfrom both demand and supply with Leontief inversematrix and Ghosh inverse matrix when studying theintersectoral carbon linkages of Turkey [28]
+e measure methods on the foundation of the researchof Chenery and Watanable and Rasmussen are all based onclassical input-output analysis model When using theseclassical measurements of interindustry linkages scholarsfirstly may face two difficult problems which coefficientmatrix should be chosen whether and how the researchersweight the different industries according to their scales andimportance Furthermore Leontief inverse matrix or Ghosh
inverse matrix based on the row balance or column balancein the input-output tables can only represent the overallinterrelatedness which contains not only direct and indirectinterrelatedness but also internal effect and external linkageFinally the classical measurements only describe the in-terrelatedness between a given industry and the entireeconomic system rather than that between two given in-dustries As for the hypothetical extraction method thoughmany scholars have been improving and modifying it inorder to better and more accurately measure the importanceof the sector it still has some drawbacks First of all itsunderlying hypothetical deviates somewhat from the eco-nomic reality In the scenario of hypothetical extraction therow and the column referring to the selected industry ininput coefficient matrix are replaced by zeros while the restremain the same In fact as mentioned the industries in theeconomic system interact with and impact each other +einterrelatedness among the rest of the industries may changeeven dramatically when an industry is removed So thedifference between the output levels before and after thehypothetical extraction probably should not be equated withthe real impact of the interindustry linkages What is morehypothetical extraction method provides a very practical andsimple measure for interindustry linkages between a givenindustry and the entire economy system however themeasure for interindustry linkages between two given in-dustries is still inexplicit In addition with mounting evi-dence favoring simultaneous application of both Ghoshsupply and Leontief demand for forward and backwardlinkages the researches on hypothetical extraction methodwhich only adopts Leontief inverse matrix may provideerroneous evidence or biased suggestions
With the continuous progress of the input-outputtheoretical model now the researchers have many newchoices to analyze the interindustry linkages eg thedynamic input-output model aiming to overcome thestatic analysis disadvantages of the classical input-outputmodel [29 30] the input-output optimization model thatcombines optimization theory and input-output theory[31 32] and the spatial input-output model aiming toanalyze the interregional input-output relationships[33 34] Now the inter-country input-output tables whichare regularly published in the world mainly include theWord Input-output Table (WIOT) OECD Inter-CountryInput-Output (ICIO) Table and the Asian InternationalInput-Output Table (AIIOT) Miller first adopted theinput-output theory to study the economic impacts be-tween different regions and constructed a two-regioninput-output model to measure the interregional feedbackeffect but it does not involve the concept and measure-ment of interindustry spillover effect [35] Later scholarseg Round Sonis and Dietzenbacher distinguish theinterindustry spillover effect and interindustry feedbackeffect between different regions study the relationshipbetween them and their multiplier effect and conduct theempirical researches [36ndash38]
According to the research of Round the output as well asLeontief inverse matrix can be multiplicatively decomposedinto three components the separate effects of multipliers
Complexity 3
wholly within a group of accounts the effect of an exogenousinjection which feeds back upon itself but via other parts ofthe system and the effect an increase in income in one groupof accounts has upon another In many kinds of analysisinvolving multipliers it is convenient to formulate them sothat their sum rather than their sequential multiplicationyields the total multipliers +e output as well as Leontiefinverse matrix also can be additively decomposed which isequivalent to Roundrsquos multiplicative decomposition On thefoundation of Miller and Roundrsquos two-region input-outputanalysis this study regards different industrial sectors in theentire economic system as different regions in the spatialscope and constructs a demand-driven and multisectorinput-output model focusing on the output structuralanalysis and the measurement of interindustry linkagesbetween two given industrial sectors in a multisector eco-nomic system
In demand-driven and multisector input-outputmodel the gross output can be decomposed into threecomponents intraindustry multiplier effect interindustryspillover effect and interindustry feedback effect Intra-industry multiplier effect is a kind of sectoral internaleffect and an industrial sectorrsquos intraindustry multipliereffect refers to the output induced by the increase of itsfinal demand in an input-output system which onlycontains this industrial sector and it indicates the viabilityof this industrial sector Interindustry spillover effect is akind of external linkage effect and an industrial sectorrsquosspillover effect refers to the rest of the industrial sectorsrsquooutput induced by the increase of its final demand whichindicates the impacting capacity of this industrial sectorIn this study the conception of interindustry incomingspillover effect is introduced in order to analyze the outputstructure easily which is precisely opposite to that ofinterindustry spillover effect An industrial sectorrsquos in-terindustry incoming spillover effect refers to the outputinduced by the increase of the rest of the industrial sectorsrsquofinal demand Interindustry feedback effect is also a kindof external linkage effect and an industrial sectorrsquos in-terindustry feedback effect refers to the output induced bythe increase of its final demand after the multiplier effectnamely the transfer of the technology products orservices from this industrial sector to the other industrialsectors and then back to itself So the gross output of anindustrial sector or its subindustry is the total sum of itsintraindustry multiplier effect interindustry incomingspillover effect and interindustry feedback effect
3 Materials and Methods
31 Demand-Driven and Multisector Input-Output ModelSuppose that the entire economic system contains n (nge 2)
industrial sectors and each industrial sector contains one ormore subindustries Denote the industrial sector as Ind withsuperscript such as Indp(p isin 1 2 n ) and the subin-dustry in it with subscript such as Indp
u(u isin 1 2 mp1113966 1113967)where mp is the number of subindustries in Indp X rep-resents the gross output of the entire economic system Xp
represents the gross output of Indp and Xpu represents the
gross output of Indpu Similarly Y represents the final de-
mand of the entire economic system Yp represents the finaldemand of Indp and Y
pu represents the final demand of Indp
u It is worth mentioning that the final demand in this studyalso contains the part of net exports if the system is an openeconomy Both of X and Y are column vectors consisting ofthe industrial sectorsrsquo gross output or final demand andboth of Xp and Yp are also column vectors consisting of thesubindustriesrsquo gross output or final demand eg X
X1 X2 middot middot middot Xn1113858 1113859T Y Y1 Y2 middot middot middot Yn1113858 1113859
T Xp
Xp1 X
p2 middot middot middot X
pmp
1113960 1113961T
Yp Yp1 Y
p2 middot middot middot Y
pmp
1113960 1113961T
According to the classical demand-driven input-outputtheory the quantitative relationship between the grossoutput and final demand can be expressed as follows
AX + Y X (1)
In a multisector input-output scenario equation (1) canbe written specifically as follows
A11 A12 middot middot middot A1n
A21 A22 middot middot middot A2n
middot middot middot middot middot middot middot middot middot middot middot middot
An1 An2 middot middot middot Ann
⎡⎢⎢⎢⎢⎢⎢⎢⎢⎢⎢⎢⎢⎢⎢⎢⎢⎢⎢⎢⎢⎢⎢⎢⎢⎢⎢⎢⎢⎣
⎤⎥⎥⎥⎥⎥⎥⎥⎥⎥⎥⎥⎥⎥⎥⎥⎥⎥⎥⎥⎥⎥⎥⎥⎥⎥⎥⎥⎥⎦
X1
X2
middot middot middot
Xn
⎡⎢⎢⎢⎢⎢⎢⎢⎢⎢⎢⎢⎢⎢⎢⎢⎢⎢⎢⎢⎢⎢⎢⎢⎢⎢⎢⎢⎢⎣
⎤⎥⎥⎥⎥⎥⎥⎥⎥⎥⎥⎥⎥⎥⎥⎥⎥⎥⎥⎥⎥⎥⎥⎥⎥⎥⎥⎥⎥⎦
+
Y1
Y2
middot middot middot
Yn
⎡⎢⎢⎢⎢⎢⎢⎢⎢⎢⎢⎢⎢⎢⎢⎢⎢⎢⎢⎢⎢⎢⎢⎢⎢⎢⎢⎢⎢⎣
⎤⎥⎥⎥⎥⎥⎥⎥⎥⎥⎥⎥⎥⎥⎥⎥⎥⎥⎥⎥⎥⎥⎥⎥⎥⎥⎥⎥⎥⎦
X1
X2
middot middot middot
Xn
⎡⎢⎢⎢⎢⎢⎢⎢⎢⎢⎢⎢⎢⎢⎢⎢⎢⎢⎢⎢⎢⎢⎢⎢⎢⎢⎢⎢⎢⎣
⎤⎥⎥⎥⎥⎥⎥⎥⎥⎥⎥⎥⎥⎥⎥⎥⎥⎥⎥⎥⎥⎥⎥⎥⎥⎥⎥⎥⎥⎦
(2)
where A is the input coefficient matrix of the entire eco-nomic system Apq is a submatrix in A and Apq consists ofthe element apq
uv which represents the direct consumption ofIndp
u per unit of output of Indqv (q isin 1 2 n )
(v isin 1 2 mq1113966 1113967) After serials of mathematical deriva-tion equation (2) can be transformed as follows
X
X1
X2
middot middot middot
Xn
⎡⎢⎢⎢⎢⎢⎢⎢⎢⎢⎢⎢⎢⎢⎢⎢⎢⎢⎢⎢⎢⎢⎢⎢⎢⎢⎢⎢⎢⎣
⎤⎥⎥⎥⎥⎥⎥⎥⎥⎥⎥⎥⎥⎥⎥⎥⎥⎥⎥⎥⎥⎥⎥⎥⎥⎥⎥⎥⎥⎦
(I minus A)minus 1
Y BY
B11 B12 middot middot middot B1n
B21 B22 middot middot middot B2n
middot middot middot middot middot middot middot middot middot middot middot middot
Bn1 Bn2 middot middot middot Bnn
⎡⎢⎢⎢⎢⎢⎢⎢⎢⎢⎢⎢⎢⎢⎢⎢⎢⎢⎢⎢⎢⎢⎢⎢⎢⎢⎢⎢⎢⎣
⎤⎥⎥⎥⎥⎥⎥⎥⎥⎥⎥⎥⎥⎥⎥⎥⎥⎥⎥⎥⎥⎥⎥⎥⎥⎥⎥⎥⎥⎦
Y1
Y2
middot middot middot
Yn
⎡⎢⎢⎢⎢⎢⎢⎢⎢⎢⎢⎢⎢⎢⎢⎢⎢⎢⎢⎢⎢⎢⎢⎢⎢⎢⎢⎢⎢⎣
⎤⎥⎥⎥⎥⎥⎥⎥⎥⎥⎥⎥⎥⎥⎥⎥⎥⎥⎥⎥⎥⎥⎥⎥⎥⎥⎥⎥⎥⎦
(3)
where B is the Leontief inverse matrix of the entire economicsystem and Bpq is its submatrix B is the so-called multiplierin the demand-driven input-output model which representsthe multiplicative relationship between the gross output andfinal demand
Referring to the research on interregional input-outputmodel the gross output or the Leontief inverse matrix B ofthe entire economic system can be decomposed into threecomponents intraregional multiplier effect interregionalspillover effect and interregional feedback effect Whenregarding the industrial sectors as regions the gross outputor the Leontief inverse matrix B of the entire economicsystem can be also similarly decomposed into three com-ponents intraindustry multiplier effect interindustryspillover effect and interindustry feedback effect For thesake of specific distinction this study names the componentsin the gross output as intraindustry multiplier effect in-terindustry spillover effect and interindustry feedback effectand the components in the Leontief inverse matrix B as
4 Complexity
intraindustry multiplier effect coefficient matrix interin-dustry spillover effect coefficient matrix and interindustryfeedback effect coefficient matrix labeled as M S and F
Leontief inverse matrix B has two different kinds ofdecompositions multiplicative decomposition and additive
decomposition in which three components are labeled asMm Sm Fm andMa Sa Fa respectively +e decompositionsare presented as follows [39]
B FmSmMm
F11 0 middot middot middot 0
0 F22 middot middot middot 0
middot middot middot middot middot middot middot middot middot middot middot middot
0 0 middot middot middot Fnn
⎡⎢⎢⎢⎢⎢⎢⎢⎢⎢⎢⎢⎢⎢⎢⎢⎢⎢⎢⎢⎢⎢⎢⎢⎢⎢⎢⎢⎢⎣
⎤⎥⎥⎥⎥⎥⎥⎥⎥⎥⎥⎥⎥⎥⎥⎥⎥⎥⎥⎥⎥⎥⎥⎥⎥⎥⎥⎥⎥⎦
I S12 middot middot middot S1n
S21 I middot middot middot S2n
middot middot middot middot middot middot middot middot middot middot middot middot
Sn1 Sn2 middot middot middot I
⎡⎢⎢⎢⎢⎢⎢⎢⎢⎢⎢⎢⎢⎢⎢⎢⎢⎢⎢⎢⎢⎢⎢⎢⎢⎢⎢⎢⎢⎣
⎤⎥⎥⎥⎥⎥⎥⎥⎥⎥⎥⎥⎥⎥⎥⎥⎥⎥⎥⎥⎥⎥⎥⎥⎥⎥⎥⎥⎥⎦
M11 0 middot middot middot 0
0 M22 middot middot middot 0
middot middot middot middot middot middot middot middot middot middot middot middot
0 0 middot middot middot Mnn
⎡⎢⎢⎢⎢⎢⎢⎢⎢⎢⎢⎢⎢⎢⎢⎢⎢⎢⎢⎢⎢⎢⎢⎢⎢⎢⎢⎢⎢⎣
⎤⎥⎥⎥⎥⎥⎥⎥⎥⎥⎥⎥⎥⎥⎥⎥⎥⎥⎥⎥⎥⎥⎥⎥⎥⎥⎥⎥⎥⎦
(4)
B Ma + Sa + Fa
M11 0 middot middot middot 00 M22 middot middot middot 0
middot middot middot middot middot middot middot middot middot middot middot middot
0 0 middot middot middot Mnn
⎡⎢⎢⎢⎢⎢⎢⎢⎢⎢⎢⎢⎢⎢⎢⎢⎢⎢⎢⎢⎢⎢⎢⎢⎢⎣
⎤⎥⎥⎥⎥⎥⎥⎥⎥⎥⎥⎥⎥⎥⎥⎥⎥⎥⎥⎥⎥⎥⎥⎥⎥⎦+
0 F11S12M22 middot middot middot F11S1nMnn
F22S21M11 0 middot middot middot F22S2nMnn
middot middot middot middot middot middot middot middot middot middot middot middot
FnnSn1M11 FnnSn2M22 middot middot middot 0
⎡⎢⎢⎢⎢⎢⎢⎢⎢⎢⎢⎢⎢⎢⎢⎢⎢⎢⎢⎢⎢⎢⎢⎢⎢⎣
⎤⎥⎥⎥⎥⎥⎥⎥⎥⎥⎥⎥⎥⎥⎥⎥⎥⎥⎥⎥⎥⎥⎥⎥⎥⎦
+
F11 minus I( 1113857M11 0 middot middot middot 00 F22 minus I( 1113857M22 middot middot middot 0
middot middot middot middot middot middot middot middot middot middot middot middot
0 0 middot middot middot Fnn minus I( )Mnn
⎡⎢⎢⎢⎢⎢⎢⎢⎢⎢⎢⎢⎢⎢⎢⎢⎢⎢⎢⎢⎢⎢⎢⎢⎢⎣
⎤⎥⎥⎥⎥⎥⎥⎥⎥⎥⎥⎥⎥⎥⎥⎥⎥⎥⎥⎥⎥⎥⎥⎥⎥⎦
(5)
where Mpp Spq and Fpp are defined in equations (6)ndash(8)
Mpp
I minus App
( 1113857minus 1
(6)
Fpp
Bpp
I minus App
( 1113857 (7)
Spq
Bpp
minus Bpp
App
( 1113857minus 1
Bpq
I minus Aqq
( 1113857 (pne q) (8)
Since the additive decomposition is easier to understandin economic sense and more intuitive for output analysisthis study just adopts it instead of the multiplicative de-composition namely M S and F in the following contentare represented by Ma Sa Fa in equation (5) shown asfollows
M
M11 0 middot middot middot 0
0 M22 middot middot middot 0
middot middot middot middot middot middot middot middot middot middot middot middot
0 0 middot middot middot Mnn
⎡⎢⎢⎢⎢⎢⎢⎢⎢⎢⎢⎢⎢⎢⎢⎢⎢⎢⎢⎢⎢⎢⎢⎢⎢⎢⎢⎢⎢⎣
⎤⎥⎥⎥⎥⎥⎥⎥⎥⎥⎥⎥⎥⎥⎥⎥⎥⎥⎥⎥⎥⎥⎥⎥⎥⎥⎥⎥⎥⎦
S
0 F11S12M22 middot middot middot F11S1nMnn
F22S21M11 0 middot middot middot F22S2nMnn
middot middot middot middot middot middot middot middot middot middot middot middot
FnnSn1M11 FnnSn2M22 middot middot middot 0
⎡⎢⎢⎢⎢⎢⎢⎢⎢⎢⎢⎢⎢⎢⎢⎢⎢⎢⎢⎢⎢⎢⎢⎢⎢⎢⎢⎢⎢⎣
⎤⎥⎥⎥⎥⎥⎥⎥⎥⎥⎥⎥⎥⎥⎥⎥⎥⎥⎥⎥⎥⎥⎥⎥⎥⎥⎥⎥⎥⎦
F
F11 minus I( 1113857M11 0 middot middot middot 0
0 F22 minus I( 1113857M22 middot middot middot 0
middot middot middot middot middot middot middot middot middot middot middot middot
0 0 middot middot middot Fnn minus I( )Mnn
⎡⎢⎢⎢⎢⎢⎢⎢⎢⎢⎢⎢⎢⎢⎢⎢⎢⎢⎢⎢⎢⎢⎢⎢⎢⎢⎢⎢⎢⎣
⎤⎥⎥⎥⎥⎥⎥⎥⎥⎥⎥⎥⎥⎥⎥⎥⎥⎥⎥⎥⎥⎥⎥⎥⎥⎥⎥⎥⎥⎦
(9)
Interindustry spillover effect coefficient matrix S can befurther decomposed into two parts which respectivelyrepresent the impacts on the output in the first round andthe rest of the rounds In this study the two parts are namedas direct interindustry spillover effect coefficient matrix Sdand indirect interindustry spillover effect coefficient matrixSi presented as follows
S Sd + Si
0 S12M22 middot middot middot S1nMnn
S21M11 0 middot middot middot S2nMnn
middot middot middot middot middot middot middot middot middot middot middot middot
Sn1M11 Sn2M22 middot middot middot 0
⎡⎢⎢⎢⎢⎢⎢⎢⎢⎢⎢⎢⎢⎢⎢⎢⎢⎢⎢⎢⎢⎢⎢⎢⎢⎢⎢⎢⎢⎣
⎤⎥⎥⎥⎥⎥⎥⎥⎥⎥⎥⎥⎥⎥⎥⎥⎥⎥⎥⎥⎥⎥⎥⎥⎥⎥⎥⎥⎥⎦
+
0 F11 minus I( 1113857S12M22 middot middot middot F11 minus I( 1113857S1nMnn
F22 minus I( 1113857S21M11 0 middot middot middot F22 minus I( 1113857S2nnn
middot middot middot middot middot middot middot middot middot middot middot middot
Fnn minus I( )Sn1M11 Fnn minus I( )Sn2M22 middot middot middot 0
⎡⎢⎢⎢⎢⎢⎢⎢⎢⎢⎢⎢⎢⎢⎢⎢⎢⎢⎢⎢⎢⎢⎢⎢⎢⎢⎢⎢⎢⎣
⎤⎥⎥⎥⎥⎥⎥⎥⎥⎥⎥⎥⎥⎥⎥⎥⎥⎥⎥⎥⎥⎥⎥⎥⎥⎥⎥⎥⎥⎦
(10)
So the Leontief inverse matrix B of the entire economicsystem in multisector input-output model can be decom-posed as follows
B
F11M11 F11S12M22 middot middot middot F11S1nMnn
F22S21M11 F22M22 middot middot middot F22S2nMnn
middot middot middot middot middot middot middot middot middot middot middot middot
FnnSn1M11 FnnSn2M22 middot middot middot FnnMnn
⎡⎢⎢⎢⎢⎢⎢⎢⎢⎢⎢⎢⎢⎢⎢⎢⎢⎢⎢⎢⎢⎢⎢⎢⎢⎢⎢⎢⎢⎣
⎤⎥⎥⎥⎥⎥⎥⎥⎥⎥⎥⎥⎥⎥⎥⎥⎥⎥⎥⎥⎥⎥⎥⎥⎥⎥⎥⎥⎥⎦
M + S + F
(11)
On the basis of this kind of decomposition the rela-tionship of gross output and final demand shown inequation (3) can be rewritten as follows
Complexity 5
X1
X2
Xn
⎡⎢⎢⎢⎢⎢⎢⎢⎢⎢⎢⎢⎢⎢⎢⎢⎢⎢⎢⎢⎢⎢⎢⎢⎢⎢⎢⎢⎢⎣
⎤⎥⎥⎥⎥⎥⎥⎥⎥⎥⎥⎥⎥⎥⎥⎥⎥⎥⎥⎥⎥⎥⎥⎥⎥⎥⎥⎥⎥⎦
M times
Y1
Y2
Yn
⎡⎢⎢⎢⎢⎢⎢⎢⎢⎢⎢⎢⎢⎢⎢⎢⎢⎢⎢⎢⎢⎢⎢⎢⎢⎢⎢⎢⎢⎣
⎤⎥⎥⎥⎥⎥⎥⎥⎥⎥⎥⎥⎥⎥⎥⎥⎥⎥⎥⎥⎥⎥⎥⎥⎥⎥⎥⎥⎥⎦
+ S times
Y1
Y2
Yn
⎡⎢⎢⎢⎢⎢⎢⎢⎢⎢⎢⎢⎢⎢⎢⎢⎢⎢⎢⎢⎢⎢⎢⎢⎢⎢⎢⎢⎢⎣
⎤⎥⎥⎥⎥⎥⎥⎥⎥⎥⎥⎥⎥⎥⎥⎥⎥⎥⎥⎥⎥⎥⎥⎥⎥⎥⎥⎥⎥⎦
+ F times
Y1
Y2
Yn
⎡⎢⎢⎢⎢⎢⎢⎢⎢⎢⎢⎢⎢⎢⎢⎢⎢⎢⎢⎢⎢⎢⎢⎢⎢⎢⎢⎢⎢⎣
⎤⎥⎥⎥⎥⎥⎥⎥⎥⎥⎥⎥⎥⎥⎥⎥⎥⎥⎥⎥⎥⎥⎥⎥⎥⎥⎥⎥⎥⎦
(12)
Equation (12) can be also briefly presented as follows
Xp
Mpp
Yp
+ 1113944q
Fpp
Spq
Mqq
Yq
+ Fpp
minus I( 1113857Mpp
Yp (qnep)
(13)
Since equation (13) is a kind of matrix expression whendefining Xp as the total sum of the elements in Xp the grossoutput of Indp in algebraic expression can be presented asfollows
Xp eXp
eMpp
Yp
+ e 1113944q
Fpp
Spq
Mqq
Yq
+ e Fpp
minus I( 1113857Mpp
Yp (qnep)
(14)
where e is a column summation operator eg e [1 1 1]+e gross output of Indp
u namely Xpu in algebraic expression
can be also written as follows
Xpu euX
p euM
ppY
p+ eu 1113944
q
Fpp
Spq
Mqq
Yq
+ eu Fpp
minus I( 1113857Mpp
Yp (qnep)
(15)
where eu is a row vector containing mp elements and theresponding element of Indp
u is 1 while the rest are 0 egeu [0 1 0]
According to the additive decompositions in equations(14) and (15) the intraindustry multiplier effect interin-dustry incoming spillover effect and interindustry feedbackeffect of industrial sector Indp and its subindustry Indp
u inalgebraic expression are presented in Table 1
32 InterindustryLinkageAnalysis DenoteM (Z) S (Z) andF (Z) as the intraindustry multiplier effect interindustryincoming spillover effect and interindustry feedback effectof Z (Z is Indp or Indp
u) respectively+is study adoptsM (Z)to represent the sectoral internal effect of Z and S (Z) + F (Z)to represent the external linkage effect of Z S (Z) refers to theoutput totally induced by the final demand of other in-dustrial sectors called external linkage effect I in this study F(Z) refers to the difference between output induced by thefinal demand of this industrial sector in an economy onlycontaining it and that in the actual economy containingmulti-industrial sectors called external linkage effect II inthis study
+is study adopts the proportions of the sectoral internaleffect and external linkage effect in the gross output todescribe the output structural features of an industrial sectoror its subindustries +e proportion of M (Z) in the grossoutput indicates the contribution of the industrial sector (ifZ is Indp) or the industrial sector to which the subindustrybelongs (if Z is Indp
u) on the gross output of Z and the highervalue refers to the greater viability of Z +e proportion of S
(Z) + F (Z) in the gross output indicates the contribution ofthe external industrial sectors to the gross output of Z andthe higher value refers to the greater dependence of Z for theother industrial sectors +e sectoral internal effect andexternal linkage effect of Z in demand-driven and multi-sector input-output model are presented in Table 2
Denote S (Indq Z) as the interindustry incomingspillover effect from Indq to Z (qnep) and this study adoptsS (Indq Z) to measure the interindustry linkage effect fromIndq to Z As mentioned above S (Indq Z) can be furtherdecomposed into two parts which respectively representthe direct and indirect interindustry linkage effect from Indq
to Z and are presented as follows
S Indq Indp
( 1113857 eFpp
Spq
Mqq
Yq
eSpq
Mqq
Yq
+ e Fpp
minus I( 1113857Spq
Mqq
Yq
S Indq Indp
u( 1113857 euFpp
Spq
Mqq
Yq
euSpq
Mqq
Yq
+ eu Fpp
minus I( 1113857Spq
Mqq
Yq
(16)
+is study adopts the proportion of S (Indq Z) in thegross output of Z to measure the contribution of the in-terindustry linkage effect named as interindustry linkagecontribution and labeled as LinkC (Indq Z) and adopts theratio of S (Indq Z) and the final demand of Indq to measurethe efficiency of the interindustry linkage effect named asinterindustry linkage coefficient and labeled as LinkE (IndqZ) LinkC (Indq Z) and LinkE (Indq Z) can be written asfollows
LinkC Indq Indp
( 1113857 S Indq Indp( 1113857
Xp
LinkC Indq Indp
u( 1113857 S Indq Indp
u( 1113857
Xpu
LinkE Indq Indp
( 1113857 S Indq Indp( 1113857
eYq
LinkE Indq Indp
u( 1113857 S Indq Indp
u( 1113857
eYq
(17)
Interindustry linkage effect indicates the scale of theabsolute flow value from one given industrial sector to theother industrial sector or its subindustries interindustrylinkage contribution indicates the contribution of the inter-industry linkage effect on the gross output namely the scaleof the relative flow value from one given industrial sector tothe other industrial sector or its subindustries interindustrylinkage coefficient indicates the efficiency of the interindustrylinkage effect namely the scale of the unit flow value fromone given industrial sector to the other industrial sector or itssubindustries +e higher value of them refers to the greaterabsolute flow value contribution or efficiency
33 Input-Output Data in China 2017 In this subsectionthis study takes the input-output data in China 2017 asexample and adopts the method mentioned above to analyzethe structural features of output and measure the
6 Complexity
interindustry linkages between two industrial sectors SinceChinarsquos authority and the industry policy-makers have al-most regarded manufacturing and producer services as themost critical industrial sectors for industrial transformationand upgrading and have successively introduced a series ofindustrial policies to promote the integration level of the twoindustrial sectors this application case mainly focuses on theinterindustry linkages between them
Firstly the entire economic system of China is dividedinto three industrial sectors manufacturing producer ser-vices and the rest of the industries and each of them hassome subindustries In China Input-Output Table in Year2017 manufacturing has many subindustries Since the scaleof some subindustries of manufacturing is too smallmanufacturing is only further divided into three compo-nents low-tech manufacturing mid-tech manufacturingand high-tech manufacturing in this study according to theIndustrial Classification for National Economic Activities(ICNEA) issued in 2017 +e six subindustries of producerservices are wholesale service logistic service informationservice finance service business service and technologyservice +e three subindustries of the rest of the industriesare the primary industry the second industry excludingmanufacturing labeled as the rest second industry in briefand the tertiary industry excluding producer services labeledas the rest of the tertiary industry in brief +e classificationof the entire economic system is specifically presented inAppendix A and the rearranged China Input-Output Tablein Year 2017 is shown in Appendix B
Label manufacturing producer services and the rest ofthe industries as Ind1 Ind2 and Ind3 respectively the low-techmanufacturing mid-tech manufacturing and high-techmanufacturing in Ind1 as Ind11 Ind
12 and Ind
13 the wholesale
service logistic service information service finance servicebusiness service and technology service in Ind2 as Ind21Ind22 Ind
23 Ind
24 Ind
25 and Ind26 and the primary industry
the rest of the second industry and the rest of the tertiaryindustry in Ind3 as Ind31 Ind
32 and Ind33 +e gross input
vector X final demand vector Y input coefficient matrix ALeontief inverse matrix B intraindustry multiplier effectcoefficient matrixM interindustry spillover effect coefficientmatrix S direct interindustry spillover effect coefficientmatrix Sd indirect interindustry spillover effect coefficientmatrix Si and interindustry feedback effect coefficientmatrix F are presented in Appendix C
4 Results
On the basis of the method mentioned in Section 31 thedecomposition components of gross output ofmanufacturing producer services and their subindustries inChina 2017 are presented in Table 3
Further combining the data in Table 3 and themethod mentioned in Section 32 the output structuralfeatures of the two industrial sectors and their subin-dustries namely the proportions of sectoral internaleffect and external linkage effect are presented in Table 4the interindustry linkages from manufacturing to pro-ducer services are presented in Table 5 and those fromproducer services to manufacturing are presented inTable 6
+rough data observation and comparison in Tables 4ndash6this study finds the following results on manufacturing andproducer services
As for manufacturing in China 2017 (1) its viabilitynamely intraindustry multiplier effect or sectoral internaleffect contributes 4896 of the gross output of itself andthe external linkage effect namely the total sum of inter-industry spillover effect and interindustry feedback effectcontributes 5104 of the gross output of itself in which theinterindustry linkage effect from the rest of the industrialsector accounts for 3551 shown in Table 4 (2) the in-terindustry linkage effect direct interindustry linkage effectand indirect interindustry linkage effect from producerservices to manufacturing are 716 604 and 112 TrillionYuan respectively shown in Table 6 (3) the interindustrylinkage contribution and coefficient from producer servicesto manufacturing are 709 and 05129 respectively shownin Table 6
As for producer services in China 2017 (1) its viabilitycontributes 3806 of the gross output of itself and theexternal linkages contribute 6194 of the gross output ofitself in which the interindustry linkage effect from the restof the industrial sector accounts for 3579 shown in Ta-ble 4 (2) the interindustry linkage effect direct interindustrylinkage effect and indirect interindustry linkage effect frommanufacturing to producer services are 1109 1012 and097 Trillion Yuan respectively shown in Table 5 (3) theinterindustry linkage contribution and coefficient frommanufacturing to producer services are 2253 and 04625respectively shown in Table 5
Table 1 Decomposition components of gross output in demand-driven and multisector input-output model
Industrial sectoror subindustry
Grossoutput
Intraindustrymultiplier effect
Interindustry incomingspillover effect
Interindustry incomingspillover effect from Indq
Interindustryfeedback effect
Indp Xp euMppYp e1113936qFppSpqMqqYq (pne q) eFppSpqMqqYq (pne q) e(Fpp minus I)MppYp
Indpu X
pu euMppYp eu1113936qFppSpqMqqYq (pne q) euFppSpqMqqYq (pne q) eu(Fpp minus I)MppYp
Table 2 +e sectoral internal effect and external linkage effect in demand-driven and multisector input-output model
Industrial sector or subindustry Sectoral internal effect External linkage effectIndp eMppYp Xp minus eMppYp
Indpu euMppYp X
pu minus euMppYp
Complexity 7
Table 3 Decomposition components of gross output of manufacturing producer services and their subindustries
Industrial sectoror subindustry
Grossoutput
Intraindustrymultipliereffect
Interindustryincoming
spillover effect
Interindustryincoming
spillover effectfrom
manufacturing
Interindustryincoming
spillover effectfrom producer
services
Interindustryincoming
spillover effectfrom the rest ofthe industries
Interindustryfeedback effect
Manufacturing 10089 4940 4299 mdash 716 3583 851Low-techmanufacturing 2670 1691 800 mdash 150 650 179
Mid-techmanufacturing 2619 665 1658 mdash 201 1458 295
High-techmanufacturing 4800 2583 1840 mdash 365 1475 376
Producerservices 4922 1873 2870 1109 mdash 1761 178
Wholesaleservice 1159 423 691 330 mdash 360 045
Logistic service 1026 333 650 279 mdash 371 042Informationservice 565 368 185 056 mdash 129 011
Finance service 943 313 594 185 mdash 409 036Business service 718 194 492 195 mdash 298 032Technologyservice 510 241 258 064 - 194 011
+e unit of the data expressed is Trillion Yuan
Table 4 Output structural features of manufacturing producer services and their subindustries
Industrial sector orsubindustry
Grossoutput
Proportion of sectoralinternal effect
Proportion of externallinkage effect
Interindustry linkage contribution from therest of the industries
Manufacturing 10000 4896 5104 3551Low-techmanufacturing 10000 6335 3665 2435
Mid-tech manufacturing 10000 2541 7459 5565High-techmanufacturing 10000 5382 4618 3073
Producer services 10000 3806 6194 3579Wholesale service 10000 3653 6347 3109Logistic service 10000 3249 6751 3621Information service 10000 6515 3485 2290Finance service 10000 3321 6679 4336Business service 10000 2698 7302 4146Technology service 10000 4730 5270 3792+e unit of all the data expressed is
Table 5 Interindustry linkages from manufacturing to producer services and its subindustries
Industrial sectoror subindustry
Interindustry linkageeffect (Trillion Yuan)
Direct interindustrylinkage effect (Trillion
Yuan)
Indirect interindustrylinkage effect (Trillion
Yuan)
Interindustrylinkage contribution
()
Interindustrylinkage coefficient
Producer services 1109 1012 097 2253 04625Wholesale service 330 306 024 2850 01378Logistic service 279 256 023 2719 01163Informationservice 056 050 006 991 00234
Finance service 185 165 020 1959 00771Business service 195 177 017 2711 00812Technologyservice 064 058 006 1260 00268
8 Complexity
Similarly the results of the subindustries of manufacturingor producer services can also be summarized according toTables 4ndash6 which are not presented for brevity
Compared with the previous measurements of interin-dustry linkages based on Leontief inverse matrix or similarcoefficient matrix this study further decomposes Leontiefinverse matrix into three components based on demand-driven and multisector input-output model in which thedifferent industrial sectors in the entire economic system areregarded as different regions in the spatial scope +emethod in this study has three obvious advantages
Firstly the method takes multiplier effect as sectoralinternal effect and takes the total sum of spillover effect andfeedback effect as external linkage effectWhen analyzing thestructural features of the gross output it integrates thesectoral internal effect and external linkage effect at the sametime which can make it easy to understand the drivingmechanism of industrial development
Secondly the classical measurements of interindustrylinkages based on Leontief inverse matrix or similar coef-ficient matrix generally only reflect the overall interrelat-edness namely the interindustry linkages between the givenindustry and the entire economic system while the methodin this study can not only measure the interindustry linkageeffects between two given industrial sectors but also clearlydescribe the composition ratio of the direct and indirectinterindustry linkage effects through the further decom-position of spillover effect
+irdly the method adopts respectively the absoluteflow value relative flow value and unit relative value of theinput-output relationship as the measurement of interin-dustry linkage effect interindustry linkage contribution andinterindustry linkage coefficient which can comprehen-sively reflect and evaluate the degree of industry linkages
5 Discussion and Policy Implication
In accordance with the above results four viewpoints inagreement with the cognitive patterns have been tested againby the empirical evidence from China Firstly compared withthe indirect interindustry linkage effects the direct interin-dustry linkage effects between manufacturing and producerservices are overwhelmingly dominant accounting for about80sim90 of the total interindustry linkage effects (see Ta-bles 5 and 6) Secondly the viability of manufacturing isoverall significantly stronger than that of producer services
namely the proportion of sectoral internal effect on the grossoutput of manufacturing is significantly greater than that ofproducer services (see Table 4) +irdly among the interin-dustry linkages from producer services to the subindustries ofmanufacturing the interindustry linkages to mid-tech orhigh-tech manufacturing are significantly stronger than thoseto low-tech manufacturing (see Table 6) Fourthly the outputof manufacturing induced by per unit final demand ofproducer services is larger than that of producer servicesinduced by per unit final demand of manufacturing namelythe interindustry linkage coefficient from producer services tomanufacturing is higher than that from manufacturing toproducer services (see Tables 5 and 6)
What is more some unique local features ofmanufacturingand producer services in China can be also drawn as followsand in this study we think they are helpful for the policy-makers and economists to better evaluate the developmentstatus of two critical industrial sectors in China
(1) Whether it is the manufacturing or producer ser-vices the total sum of interindustry spillover effectand interindustry feedback effect is higher thanintraindustry multiplier effect (see Table 4) indi-cating that the external linkage effect is the maindriving force for the output of these two industrialsectors and the viability of them is secondary Inaddition compared with the intraindustry multipliereffect the interindustry feedback has a certain scalewhich means that the estimation error will be ob-vious when a single-sector model is used instead ofmultisector model +is is different from some re-searches on multiregional input-output model[40 41] in which the interregional feedback effect isusually neglected for the very small scale comparedwith the intraregional multiplier effect One rea-sonable explanation is that the interdependence ofdifferent industrial sectors is much stronger thanthat of different regions for goodsrsquo or servicesrsquotransfer barriers of the former are significantly lessthan that of the latter
(2) +e interindustry linkage effects and contributionsbetween manufacturing and producer services inChina are not strong overall compared with thosefrom the rest of the industries to manufacturing orproducer service (see Tables 4ndash6) In 2017 the in-terindustry linkage effect and proportion from
Table 6 Interindustry linkages from producer services to manufacturing and its subindustries
Industrial sector orsubindustry
Interindustry linkageeffect (Trillion Yuan)
Direct interindustrylinkage effect (Trillion
Yuan)
Indirect interindustrylinkage effect (Trillion
Yuan)
Interindustrylinkage contribution
()
Interindustrylinkage coefficient
Manufacturing 716 604 112 709 05129Low-techmanufacturing 150 129 020 560 01072
Mid-techmanufacturing 201 157 044 767 01439
High-techmanufacturing 365 318 047 761 02617
Complexity 9
producer services to manufacturing are 716 trillionYuan and 709 and both of them are far smallerthan those from the rest of the industries tomanufacturing which are 3583 trillion Yuan and3551 In spite of the fact that the interindustrylinkage proportion from manufacturing to producerservices is higher than that from producer services tomanufacturing and the interindustry linkage effectfrom manufacturing to producer services is alsohigher than that from producer services tomanufacturing they are still smaller than those fromthe rest of the industries to producer services +eempirical results show that the impact of the rest ofthe industries in China on manufacturing or pro-ducer services is very significant accounting for themajor or overwhelming major of the external linkageeffect If analyzing the interindustry linkages be-tween manufacturing and producer services onlywith the two-sector model and ignoring the role ofthe rest of the industries it will greatly weaken theapplicability of the conclusions
(3) Interindustry linkages from manufacturing towholesale service and logistic service are relativelystrong while those from manufacturing to infor-mation service and technology service are relatively
weak Among the interindustry linkages frommanufacturing to the subindustries of producer ser-vices the linkage to wholesale service is the highestfollowed by logistic service business service financialservice and technology service and the lowest is toinformation service (see Table 5) Since the laborproductivities of information service and technologyservice are usually higher than those of wholesaleservice and logistic service the empirical results showthat in China the pull force from manufacturing ismore significant in the field of low-level producerservices instead of high-level services and the evolu-tion of interindustry linkages between manufacturingand producer services is still in the primary stage
After the analysis and evaluation of the output structuralfeatures and interindustry linkages in Chinese three-sectoreconomic system in the perspective of improving thecurrent weak links this study puts forward the followingthree policy suggestions aiming to promote the integrationlevel of manufacturing and producer services in China
First of all the policy-makers in China should pay greatattention to the fact that the interindustry linkages betweenmanufacturing and producer services are not strong overalland the interindustry linkage effect from producer servicesto manufacturing is weaker than that frommanufacturing to
Table 7 +e classification of the entire economic system of China
Industrial sectors Subindustries Corresponding industries in China ICNEA
Manufacturing
Low-tech manufacturing
Processing of food from agricultural products manufacture of foods manufacture ofalcoholbeveragesrefined tea manufacture of tobacco manufacture of textiles
manufacture of textilesclothingapparel industry manufacture of leatherfurfeatherrelated products and footwear industry processing of timber and manufacture of woodbamboorattanpalmstraw products manufacture of furniture manufacture of paperand paper prod printing and recorded media manufacture of articles for culture
educationartsportsentertainment
Mid-tech manufacturing
Processing of petroleumcokingprocessing of nuclear fuel manufacturing ofnonmetallic minerals products smelting and processing of ferrous metals smelting andprocessing of nonferrous metals manufacture of metal products other manufacturingcomprehensive use of waste resources repair of metal productsmachineryequipment
High-techmanufacturing
Manufacture of chemical raw materials and chemical products manufacture ofmedicines manufacture of chemical fibers manufacturing of rubber and plastics
manufacture of general purpose machinery manufacture of special purpose machinerymanufacture of automobiles manufacture of railwayshipsaerospaceothertransportation equipment manufacture of electrical machineryequipment
manufacture of computerscommunicationother electronic equipment manufacturingof measuring instruments
Producer services
Wholesale service Wholesale and retail tradesLogistic service Transport storage and postal services
Information service Information transfer software and information technology servicesFinance service FinanceBusiness service Leasing and commercial services
Technology service Scientific research and polytechnic services
+e rest of theindustries
+e primary industry Agriculture+e rest of the second
industry Mining and quarrying utilities and construction
+e rest of the tertiaryindustry
Accommodation and catering real estate administrate of waterenvironmentpublicfacilities residentrepairother services education health care and social work culturesportsentertainment public administrationsocial insurancesocial organizations
international organizations
10 Complexity
Tabl
e8
+erearrang
edChina
inpu
t-ou
tput
tablein
year
2017
Inpu
toutpu
tLo
w-tech
manufacturing
Mid-tech
manufacturing
High-tech
manufacturing
Who
lesale
service
Logistic
service
Inform
ation
service
Finance
service
Busin
ess
service
Techno
logy
service
+e
prim
ary
indu
stry
+erest
ofthe
second
indu
stry
+erest
ofthe
tertiary
indu
stry
Final
demand
Gross
output
Low-tech
manufacturing
857065
43149
112197
11554
13946
19762
33674
80792
13031
96879
75757
235060
1076980
2669846
Mid-tech
manufacturing
67978
839567
584035
3564
83976
1375
3039
41747
26179
7156
842848
22944
94766
2619175
High-tech
manufacturing
185521
161427
2227382
18276
104060
44285
5908
64204
89556
102688
324054
246620
1225821
4799802
Who
lesale
service
154947
76784
233358
7363
25115
8105
6057
24088
11757
23666
122590
71993
393111
1158936
Logisticservice
90880
78420
143063
72360
110433
8564
16563
45098
23275
25033
93606
81630
236607
1025533
Inform
ation
service
6327
3637
29176
6937
17657
92569
30641
6859
6144
1591
32936
46022
284783
565280
Finances
ervice
22097
57145
67138
47729
110540
11695
79120
48866
14081
14511
135242
129009
206231
943405
Busin
ess
service
51564
26419
92268
108866
20957
37234
84123
72408
20659
2688
52043
83195
65630
718055
Techno
logy
service
5536
7654
34753
8405
2452
1764
1104
084
57384
7843
171869
2716
208897
510460
+eprim
ary
indu
stry
573601
2529
51511
012
101
365
091
5153
2918
146838
19274
48274
250572
1101240
+erest
ofthe
second
indu
stry
44659
608986
154879
12318
27474
6864
8486
3483
5219
11409
502942
55191
2022797
3464709
+erest
ofthe
tertiary
indu
stry
25672
25301
55012
90920
44244
37407
134265
90091
35654
6415
51678
238275
2165960
3000894
Value
added
583997
688157
1015031
770630
464576
295291
540332
235183
204602
654524
1039869
1739965
Gross
inpu
t2669846
2619175
4799802
1158936
1025533
565280
943405
718055
510460
1101240
3464709
3000894
+eo
riginalinp
ut-outpu
ttablein
2017
hastotally149indu
striesand
itcanbe
downloadedthroughhttpdatastatsg
ovcnfileshtm
lquickSearchtr
cctr
cc01htm
lthefi
naldem
andin
thistablec
ontainsthe
part
ofnete
xports+
eun
itof
thedata
expressedisBillion
Yuan
Complexity 11
producer services It means that the producer services are amore obvious weak link compared with manufacturing so itis necessary to further strengthen the supporting of producerservices for manufacturing and take measures such aspromoting the industrial clustering degree or improving theserviceability of producer services
Secondly in view of the fact that low-tech manufacturingis the key weak link among the subindustries ofmanufacturing it is necessary to accelerate the transformationof traditional low-tech manufacturing through the universalapplication and integration of producer services in responseto the trends of industrialization upgrading in China
Finally in view of the fact that information service is thekey weak link among the subindustries of producer serviceit is necessary to speed up the pace of manufacturing ser-vitization especially manufacturing digitization and pro-mote the widespread application of information technologyin the field of manufacturing
6 Conclusions
+is study puts forward a new method for interindustrylinkage analysis in a complex economic system on the basisof demand-driven and multisector input-output model inwhich the output as well as Leontief inverse matrix isdecomposed into three components and interindustrylinkage effect interindustry linkage contribution and in-terindustry linkage coefficient are adopted as the measuringindices Compared with the previous measurements ofinterindustry linkages based on Leontief inverse matrix orsimilar coefficient matrix the method in this study hassome obvious advantages As a whole this method is arefinement of Hirschmanrsquos backward linkage which iscritical in the perspective of output structure in demandside
Based on the method and input-output data this studyalso conducts an empirical study on the interindustrylinkages between Chinarsquos manufacturing and producerservices and the results show that the external linkageeffect is the main driving force for the output of these twoindustrial sectors and the viability of them is secondarythe interindustry linkage effects and contributions be-tween manufacturing and producer services in China arenot strong overall compared with those from the rest ofthe industries to manufacturing or producer service in-terindustry linkages from manufacturing to wholesaleservice and logistic service are relatively strong whilethose from manufacturing to information service andtechnology service are relatively weak +e authors holdthat the method in this study is helpful for policy-makersand relevant stakeholders to better understand the in-terrelatedness between two industrial sectors in a complexeconomic system and identify the key weak links whichguide them to promote balanced development ofeconomy
Finally it is worth mentioning that this study onlydiscusses Hirschmanrsquos backward linkage on the basis ofLeontief inverse matrix mainly due to the fact that theoutput structure on the demand side generally is paid more
attention Further research may focus on the forward linkageon the basis of Ghosh inverse matrix and explore thestructural features of output on the supply side or someother important economic factors such as value addedemployment and resource utilization
Appendix
A The Classification of the Entire EconomicSystem of China
+e classification of the entire economic system of China isshown in Table 7
BTheRearrangedChina Input-OutputTable inYear 2017 (Unit Billion Yuan)
+e rearranged China input-output table in year 2017 isshown in Table 8
C Some Critical Vectors and Matrices of theApplication Case in China 2017
X
X1
X2
X3
⎡⎢⎢⎢⎢⎢⎢⎢⎢⎢⎢⎢⎢⎢⎣
⎤⎥⎥⎥⎥⎥⎥⎥⎥⎥⎥⎥⎥⎥⎦
X11
X12
X13
X21
X22
X23
X24
X25
X26
X31
X32
X33
⎡⎢⎢⎢⎢⎢⎢⎢⎢⎢⎢⎢⎢⎢⎢⎢⎢⎢⎢⎢⎢⎢⎢⎢⎢⎢⎢⎢⎢⎢⎢⎢⎢⎢⎢⎢⎢⎢⎢⎢⎢⎢⎢⎢⎢⎢⎢⎢⎢⎢⎢⎢⎢⎢⎢⎢⎢⎢⎢⎢⎢⎢⎢⎢⎢⎢⎢⎢⎢⎢⎢⎢⎢⎢⎢⎢⎢⎢⎢⎢⎢⎢⎢⎢⎢⎢⎢⎢⎢⎢⎢⎢⎢⎢⎢⎢⎢⎢⎢⎢⎢⎢⎢⎢⎢⎢⎢⎢⎢⎢⎢⎢⎢⎢⎢⎢⎢⎢⎢⎢⎢⎢⎢⎢⎢⎢⎢⎢⎢⎢⎢⎢⎢⎢⎢⎢⎢⎢⎢⎢⎢⎢⎢⎢⎢⎢⎢⎢⎢⎢⎢⎢⎢⎢⎢⎢⎢⎣
⎤⎥⎥⎥⎥⎥⎥⎥⎥⎥⎥⎥⎥⎥⎥⎥⎥⎥⎥⎥⎥⎥⎥⎥⎥⎥⎥⎥⎥⎥⎥⎥⎥⎥⎥⎥⎥⎥⎥⎥⎥⎥⎥⎥⎥⎥⎥⎥⎥⎥⎥⎥⎥⎥⎥⎥⎥⎥⎥⎥⎥⎥⎥⎥⎥⎥⎥⎥⎥⎥⎥⎥⎥⎥⎥⎥⎥⎥⎥⎥⎥⎥⎥⎥⎥⎥⎥⎥⎥⎥⎥⎥⎥⎥⎥⎥⎥⎥⎥⎥⎥⎥⎥⎥⎥⎥⎥⎥⎥⎥⎥⎥⎥⎥⎥⎥⎥⎥⎥⎥⎥⎥⎥⎥⎥⎥⎥⎥⎥⎥⎥⎥⎥⎥⎥⎥⎥⎥⎥⎥⎥⎥⎥⎥⎥⎥⎥⎥⎥⎥⎥⎥⎥⎥⎥⎥⎥⎦
2670
2619
4800
1159
1026
565
943
718
510
1101
3465
3001
⎡⎢⎢⎢⎢⎢⎢⎢⎢⎢⎢⎢⎢⎢⎢⎢⎢⎢⎢⎢⎢⎢⎢⎢⎢⎢⎢⎢⎢⎢⎢⎢⎢⎢⎢⎢⎢⎢⎢⎢⎢⎢⎢⎢⎢⎢⎢⎢⎢⎢⎢⎢⎢⎢⎢⎢⎢⎢⎢⎢⎢⎢⎢⎢⎢⎢⎢⎢⎢⎢⎢⎢⎢⎢⎢⎢⎢⎢⎢⎢⎢⎢⎢⎢⎢⎢⎢⎢⎢⎢⎢⎢⎢⎢⎢⎢⎢⎢⎢⎢⎢⎢⎢⎢⎢⎢⎢⎢⎢⎢⎢⎢⎢⎢⎢⎢⎢⎢⎢⎢⎢⎢⎢⎢⎢⎢⎢⎢⎢⎢⎢⎢⎢⎢⎢⎢⎢⎢⎢⎢⎢⎢⎢⎢⎢⎢⎢⎢⎢⎢⎢⎢⎢⎢⎢⎢⎣
⎤⎥⎥⎥⎥⎥⎥⎥⎥⎥⎥⎥⎥⎥⎥⎥⎥⎥⎥⎥⎥⎥⎥⎥⎥⎥⎥⎥⎥⎥⎥⎥⎥⎥⎥⎥⎥⎥⎥⎥⎥⎥⎥⎥⎥⎥⎥⎥⎥⎥⎥⎥⎥⎥⎥⎥⎥⎥⎥⎥⎥⎥⎥⎥⎥⎥⎥⎥⎥⎥⎥⎥⎥⎥⎥⎥⎥⎥⎥⎥⎥⎥⎥⎥⎥⎥⎥⎥⎥⎥⎥⎥⎥⎥⎥⎥⎥⎥⎥⎥⎥⎥⎥⎥⎥⎥⎥⎥⎥⎥⎥⎥⎥⎥⎥⎥⎥⎥⎥⎥⎥⎥⎥⎥⎥⎥⎥⎥⎥⎥⎥⎥⎥⎥⎥⎥⎥⎥⎥⎥⎥⎥⎥⎥⎥⎥⎥⎥⎥⎥⎥⎥⎥⎥⎥⎥⎦
(C1)
Y
Y1
Y2
Y3
⎡⎢⎢⎢⎢⎢⎢⎢⎢⎢⎢⎣⎤⎥⎥⎥⎥⎥⎥⎥⎥⎥⎥⎦
Y11
Y12
Y13
Y21
Y22
Y23
Y24
Y25
Y26
Y31
Y32
Y33
⎡⎢⎢⎢⎢⎢⎢⎢⎢⎢⎢⎢⎢⎢⎢⎢⎢⎢⎢⎢⎢⎢⎢⎢⎢⎢⎢⎢⎢⎢⎢⎢⎢⎢⎢⎢⎢⎢⎢⎢⎢⎢⎢⎢⎢⎢⎢⎢⎢⎢⎢⎢⎢⎢⎢⎢⎢⎢⎢⎢⎢⎢⎢⎢⎢⎢⎢⎢⎢⎢⎢⎢⎢⎢⎢⎢⎢⎢⎢⎢⎢⎢⎢⎢⎢⎢⎢⎢⎢⎢⎢⎢⎢⎢⎢⎢⎢⎢⎢⎢⎢⎢⎢⎢⎢⎢⎢⎢⎢⎢⎢⎢⎢⎢⎢⎢⎢⎢⎢⎢⎢⎢⎢⎢⎢⎢⎢⎢⎢⎢⎢⎢⎢⎢⎢⎢⎢⎢⎢⎢⎢⎢⎣
⎤⎥⎥⎥⎥⎥⎥⎥⎥⎥⎥⎥⎥⎥⎥⎥⎥⎥⎥⎥⎥⎥⎥⎥⎥⎥⎥⎥⎥⎥⎥⎥⎥⎥⎥⎥⎥⎥⎥⎥⎥⎥⎥⎥⎥⎥⎥⎥⎥⎥⎥⎥⎥⎥⎥⎥⎥⎥⎥⎥⎥⎥⎥⎥⎥⎥⎥⎥⎥⎥⎥⎥⎥⎥⎥⎥⎥⎥⎥⎥⎥⎥⎥⎥⎥⎥⎥⎥⎥⎥⎥⎥⎥⎥⎥⎥⎥⎥⎥⎥⎥⎥⎥⎥⎥⎥⎥⎥⎥⎥⎥⎥⎥⎥⎥⎥⎥⎥⎥⎥⎥⎥⎥⎥⎥⎥⎥⎥⎥⎥⎥⎥⎥⎥⎥⎥⎥⎥⎥⎥⎥⎥⎦
1077095122639323728520606620925120232166
⎡⎢⎢⎢⎢⎢⎢⎢⎢⎢⎢⎢⎢⎢⎢⎢⎢⎢⎢⎢⎢⎢⎢⎢⎢⎢⎢⎢⎢⎢⎢⎢⎢⎢⎢⎢⎢⎢⎢⎢⎢⎢⎢⎢⎢⎢⎢⎢⎢⎢⎢⎢⎢⎢⎢⎢⎢⎢⎢⎢⎢⎢⎢⎢⎢⎢⎢⎢⎢⎢⎢⎢⎢⎢⎢⎢⎢⎢⎢⎢⎢⎢⎢⎢⎢⎢⎢⎢⎢⎢⎢⎢⎢⎢⎢⎢⎢⎢⎢⎢⎢⎢⎢⎢⎢⎢⎢⎢⎢⎢⎢⎢⎢⎢⎢⎢⎢⎢⎢⎢⎢⎢⎢⎢⎢⎢⎢⎢⎢⎢⎢⎢⎢⎢⎢⎢⎢⎢⎢⎢⎢⎣
⎤⎥⎥⎥⎥⎥⎥⎥⎥⎥⎥⎥⎥⎥⎥⎥⎥⎥⎥⎥⎥⎥⎥⎥⎥⎥⎥⎥⎥⎥⎥⎥⎥⎥⎥⎥⎥⎥⎥⎥⎥⎥⎥⎥⎥⎥⎥⎥⎥⎥⎥⎥⎥⎥⎥⎥⎥⎥⎥⎥⎥⎥⎥⎥⎥⎥⎥⎥⎥⎥⎥⎥⎥⎥⎥⎥⎥⎥⎥⎥⎥⎥⎥⎥⎥⎥⎥⎥⎥⎥⎥⎥⎥⎥⎥⎥⎥⎥⎥⎥⎥⎥⎥⎥⎥⎥⎥⎥⎥⎥⎥⎥⎥⎥⎥⎥⎥⎥⎥⎥⎥⎥⎥⎥⎥⎥⎥⎥⎥⎥⎥⎥⎥⎥⎥⎥⎥⎥⎥⎥⎥⎦
(C2)
12 Complexity
Note the unit of the elements inX and Y is Trillion Yuan
A
A11 A12 A13
A21 A22 A23
A31 A32 A33
⎡⎢⎢⎢⎢⎢⎢⎢⎢⎢⎢⎢⎢⎢⎣
⎤⎥⎥⎥⎥⎥⎥⎥⎥⎥⎥⎥⎥⎥⎦
032 002 002 001 001 003 004 011 003 009 002 008
003 032 012 000 008 000 000 006 005 001 024 001
007 006 046 002 010 008 001 009 018 009 009 008
006 003 005 001 002 001 001 003 002 002 004 002
003 003 003 006 011 002 002 006 005 002 003 003
000 000 001 001 002 016 003 001 001 000 001 002
001 002 001 004 011 002 008 007 003 001 004 004
002 001 002 009 002 007 009 010 004 000 002 003
000 000 001 001 000 000 000 000 011 001 005 000
021 000 001 000 000 000 000 001 001 013 001 002
002 023 003 001 003 001 001 000 001 001 015 002
001 001 001 008 004 007 014 013 007 001 001 008
⎡⎢⎢⎢⎢⎢⎢⎢⎢⎢⎢⎢⎢⎢⎢⎢⎢⎢⎢⎢⎢⎢⎢⎢⎢⎢⎢⎢⎢⎢⎢⎢⎢⎢⎢⎢⎢⎢⎢⎢⎢⎢⎢⎢⎢⎢⎢⎢⎢⎢⎢⎢⎢⎢⎢⎢⎢⎢⎢⎢⎢⎢⎢⎢⎢⎢⎢⎢⎢⎢⎢⎢⎢⎢⎢⎢⎢⎢⎢⎢⎢⎢⎢⎢⎢⎢⎢⎢⎢⎢⎢⎢⎢⎢⎢⎢⎢⎢⎢⎢⎢⎢⎢⎢⎢⎢⎢⎢⎢⎢⎢⎢⎢⎢⎢⎢⎢⎢⎢⎢⎢⎢⎢⎢⎢⎢⎢⎢⎢⎢⎢⎢⎢⎢⎢⎢⎢⎢⎢⎢⎢⎢⎢⎢⎢⎢⎢⎢⎢⎢⎢⎢⎢⎢⎢⎢⎣
⎤⎥⎥⎥⎥⎥⎥⎥⎥⎥⎥⎥⎥⎥⎥⎥⎥⎥⎥⎥⎥⎥⎥⎥⎥⎥⎥⎥⎥⎥⎥⎥⎥⎥⎥⎥⎥⎥⎥⎥⎥⎥⎥⎥⎥⎥⎥⎥⎥⎥⎥⎥⎥⎥⎥⎥⎥⎥⎥⎥⎥⎥⎥⎥⎥⎥⎥⎥⎥⎥⎥⎥⎥⎥⎥⎥⎥⎥⎥⎥⎥⎥⎥⎥⎥⎥⎥⎥⎥⎥⎥⎥⎥⎥⎥⎥⎥⎥⎥⎥⎥⎥⎥⎥⎥⎥⎥⎥⎥⎥⎥⎥⎥⎥⎥⎥⎥⎥⎥⎥⎥⎥⎥⎥⎥⎥⎥⎥⎥⎥⎥⎥⎥⎥⎥⎥⎥⎥⎥⎥⎥⎥⎥⎥⎥⎥⎥⎥⎥⎥⎥⎥⎥⎥⎥⎥⎦
(C3)
B
157 011 013 007 009 012 012 026 012 019 011 017019 175 048 007 026 010 007 023 025 010 059 011037 037 206 013 033 028 013 036 051 029 041 027014 010 014 103 007 005 004 009 008 006 010 006011 011 012 010 117 006 006 013 011 006 010 007002 002 003 002 004 121 005 003 003 001 003 003006 010 009 008 017 006 113 014 009 004 011 008007 007 009 013 007 012 013 117 010 003 007 007002 004 003 001 002 001 001 001 114 002 008 001040 004 006 002 003 004 004 008 005 120 005 007011 050 022 005 013 007 005 010 011 006 136 007007 008 008 013 011 013 021 021 014 004 008 113
⎡⎢⎢⎢⎢⎢⎢⎢⎢⎢⎢⎢⎢⎢⎢⎢⎢⎢⎢⎢⎢⎢⎢⎢⎢⎢⎢⎢⎢⎢⎢⎢⎢⎢⎢⎢⎢⎢⎢⎢⎢⎢⎢⎢⎢⎢⎢⎢⎢⎢⎢⎢⎢⎢⎢⎢⎢⎢⎢⎢⎢⎢⎢⎢⎢⎢⎢⎢⎢⎢⎢⎢⎢⎢⎢⎢⎢⎢⎢⎢⎢⎢⎢⎢⎢⎢⎢⎢⎢⎢⎢⎢⎢⎢⎢⎢⎢⎢⎢⎢⎢⎢⎢⎢⎢⎢⎢⎢⎢⎢⎢⎢⎢⎢⎢⎢⎢⎢⎢⎢⎢⎢⎢⎢⎢⎢⎢⎢⎢⎢⎢⎢⎢⎢⎢⎢⎢⎢⎢⎢⎢⎣
⎤⎥⎥⎥⎥⎥⎥⎥⎥⎥⎥⎥⎥⎥⎥⎥⎥⎥⎥⎥⎥⎥⎥⎥⎥⎥⎥⎥⎥⎥⎥⎥⎥⎥⎥⎥⎥⎥⎥⎥⎥⎥⎥⎥⎥⎥⎥⎥⎥⎥⎥⎥⎥⎥⎥⎥⎥⎥⎥⎥⎥⎥⎥⎥⎥⎥⎥⎥⎥⎥⎥⎥⎥⎥⎥⎥⎥⎥⎥⎥⎥⎥⎥⎥⎥⎥⎥⎥⎥⎥⎥⎥⎥⎥⎥⎥⎥⎥⎥⎥⎥⎥⎥⎥⎥⎥⎥⎥⎥⎥⎥⎥⎥⎥⎥⎥⎥⎥⎥⎥⎥⎥⎥⎥⎥⎥⎥⎥⎥⎥⎥⎥⎥⎥⎥⎥⎥⎥⎥⎥⎥⎦
(C4)
M
148 004 007 0 0 0 0 0 0 0 0 0009 151 035 0 0 0 0 0 0 0 0 0020 018 192 0 0 0 0 0 0 0 0 00 0 0 101 003 002 001 004 003 0 0 00 0 0 008 113 003 003 008 007 0 0 00 0 0 001 003 120 005 002 002 0 0 00 0 0 006 014 004 111 010 005 0 0 00 0 0 012 004 009 012 113 006 0 0 00 0 0 001 000 000 000 000 113 0 0 00 0 0 0 0 0 0 0 0 115 001 0020 0 0 0 0 0 0 0 0 001 117 0020 0 0 0 0 0 0 0 0 001 002 109
⎡⎢⎢⎢⎢⎢⎢⎢⎢⎢⎢⎢⎢⎢⎢⎢⎢⎢⎢⎢⎢⎢⎢⎢⎢⎢⎢⎢⎢⎢⎢⎢⎢⎢⎢⎢⎢⎢⎢⎢⎢⎢⎢⎢⎢⎢⎢⎢⎢⎢⎢⎢⎢⎢⎢⎢⎢⎢⎢⎢⎢⎢⎢⎢⎢⎢⎢⎢⎢⎢⎢⎢⎢⎢⎢⎢⎢⎢⎢⎢⎢⎢⎢⎢⎢⎢⎢⎢⎢⎢⎢⎢⎢⎢⎢⎢⎢⎢⎢⎢⎢⎢⎢⎢⎢⎢⎢⎢⎢⎢⎢⎢⎢⎢⎢⎢⎢⎢⎢⎢⎢⎢⎢⎢⎢⎢⎢⎢⎢⎢⎢⎢⎢⎢⎢⎢⎢⎢⎢⎢⎢⎣
⎤⎥⎥⎥⎥⎥⎥⎥⎥⎥⎥⎥⎥⎥⎥⎥⎥⎥⎥⎥⎥⎥⎥⎥⎥⎥⎥⎥⎥⎥⎥⎥⎥⎥⎥⎥⎥⎥⎥⎥⎥⎥⎥⎥⎥⎥⎥⎥⎥⎥⎥⎥⎥⎥⎥⎥⎥⎥⎥⎥⎥⎥⎥⎥⎥⎥⎥⎥⎥⎥⎥⎥⎥⎥⎥⎥⎥⎥⎥⎥⎥⎥⎥⎥⎥⎥⎥⎥⎥⎥⎥⎥⎥⎥⎥⎥⎥⎥⎥⎥⎥⎥⎥⎥⎥⎥⎥⎥⎥⎥⎥⎥⎥⎥⎥⎥⎥⎥⎥⎥⎥⎥⎥⎥⎥⎥⎥⎥⎥⎥⎥⎥⎥⎥⎥⎥⎥⎥⎥⎥⎥⎦
(C5)
Complexity 13
S
0 0 0 007 009 012 012 026 012 019 011 017
0 0 0 007 026 010 007 023 025 010 059 011
0 0 0 013 033 028 013 036 051 029 041 027
014 010 014 0 0 0 0 0 0 006 010 006
011 011 012 0 0 0 0 0 0 006 010 007
002 002 003 0 0 0 0 0 0 001 003 003
006 010 009 0 0 0 0 0 0 004 011 008
007 007 009 0 0 0 0 0 0 003 007 007
002 004 003 0 0 0 0 0 0 002 008 001
040 004 006 002 003 004 004 008 005 0 0 0
011 050 022 005 013 007 005 010 011 0 0 0
007 008 008 013 011 013 021 021 014 0 0 0
⎡⎢⎢⎢⎢⎢⎢⎢⎢⎢⎢⎢⎢⎢⎢⎢⎢⎢⎢⎢⎢⎢⎢⎢⎢⎢⎢⎢⎢⎢⎢⎢⎢⎢⎢⎢⎢⎢⎢⎢⎢⎢⎢⎢⎢⎢⎢⎢⎢⎢⎢⎢⎢⎢⎢⎢⎢⎢⎢⎢⎢⎢⎢⎢⎢⎢⎢⎢⎢⎢⎢⎢⎢⎢⎢⎢⎢⎢⎢⎢⎢⎢⎢⎢⎢⎢⎢⎢⎢⎢⎢⎢⎢⎢⎢⎢⎢⎢⎢⎢⎢⎢⎢⎢⎢⎢⎢⎢⎢⎢⎢⎢⎢⎢⎢⎢⎢⎢⎢⎢⎢⎢⎢⎢⎢⎢⎢⎢⎢⎢⎢⎢⎢⎢⎢⎢⎢⎢⎢⎢⎢⎢⎢⎢⎢⎢⎢⎢⎢⎢⎢⎢⎢⎢⎢⎢⎢⎢⎢⎢⎢⎢⎢⎢⎢⎢⎢⎢⎢⎢⎢⎢⎢⎢⎢⎢⎢⎢⎢⎢⎢⎢⎢⎢⎢⎢⎢⎢⎢⎢⎢⎢⎣
⎤⎥⎥⎥⎥⎥⎥⎥⎥⎥⎥⎥⎥⎥⎥⎥⎥⎥⎥⎥⎥⎥⎥⎥⎥⎥⎥⎥⎥⎥⎥⎥⎥⎥⎥⎥⎥⎥⎥⎥⎥⎥⎥⎥⎥⎥⎥⎥⎥⎥⎥⎥⎥⎥⎥⎥⎥⎥⎥⎥⎥⎥⎥⎥⎥⎥⎥⎥⎥⎥⎥⎥⎥⎥⎥⎥⎥⎥⎥⎥⎥⎥⎥⎥⎥⎥⎥⎥⎥⎥⎥⎥⎥⎥⎥⎥⎥⎥⎥⎥⎥⎥⎥⎥⎥⎥⎥⎥⎥⎥⎥⎥⎥⎥⎥⎥⎥⎥⎥⎥⎥⎥⎥⎥⎥⎥⎥⎥⎥⎥⎥⎥⎥⎥⎥⎥⎥⎥⎥⎥⎥⎥⎥⎥⎥⎥⎥⎥⎥⎥⎥⎥⎥⎥⎥⎥⎥⎥⎥⎥⎥⎥⎥⎥⎥⎥⎥⎥⎥⎥⎥⎥⎥⎥⎥⎥⎥⎥⎥⎥⎥⎥⎥⎥⎥⎥⎥⎥⎥⎥⎥⎥⎦
(C6)
Sd
0 0 0 006 007 011 011 024 009 017 008 016
0 0 0 006 021 008 005 018 019 007 050 008
0 0 0 011 029 025 011 030 046 025 032 023
013 009 013 0 0 0 0 0 0 006 009 006
010 010 011 0 0 0 0 0 0 006 009 006
002 002 003 0 0 0 0 0 0 001 003 003
006 009 008 0 0 0 0 0 0 004 010 008
007 006 008 0 0 0 0 0 0 003 006 006
002 004 003 0 0 0 0 0 0 002 008 001
038 002 005 002 002 003 003 007 004 0 0 0
008 043 019 004 011 005 003 008 009 0 0 0
005 005 007 012 010 012 020 020 013 0 0 0
⎡⎢⎢⎢⎢⎢⎢⎢⎢⎢⎢⎢⎢⎢⎢⎢⎢⎢⎢⎢⎢⎢⎢⎢⎢⎢⎢⎢⎢⎢⎢⎢⎢⎢⎢⎢⎢⎢⎢⎢⎢⎢⎢⎢⎢⎢⎢⎢⎢⎢⎢⎢⎢⎢⎢⎢⎢⎢⎢⎢⎢⎢⎢⎢⎢⎢⎢⎢⎢⎢⎢⎢⎢⎢⎢⎢⎢⎢⎢⎢⎢⎢⎢⎢⎢⎢⎢⎢⎢⎢⎢⎢⎢⎢⎢⎢⎢⎢⎢⎢⎢⎢⎢⎢⎢⎢⎢⎢⎢⎢⎢⎢⎢⎢⎢⎢⎢⎢⎢⎢⎢⎢⎢⎢⎢⎢⎢⎢⎢⎢⎢⎢⎢⎢⎢⎢⎢⎢⎢⎢⎢⎢⎢⎢⎢⎢⎢⎢⎢⎢⎢⎢⎢⎢⎢⎢⎢⎢⎢⎢⎢⎢⎢⎢⎢⎢⎢⎢⎢⎢⎢⎢⎢⎢⎢⎢⎢⎢⎢⎢⎢⎢⎢⎢⎢⎢⎢⎢⎢⎢⎢⎢⎣
⎤⎥⎥⎥⎥⎥⎥⎥⎥⎥⎥⎥⎥⎥⎥⎥⎥⎥⎥⎥⎥⎥⎥⎥⎥⎥⎥⎥⎥⎥⎥⎥⎥⎥⎥⎥⎥⎥⎥⎥⎥⎥⎥⎥⎥⎥⎥⎥⎥⎥⎥⎥⎥⎥⎥⎥⎥⎥⎥⎥⎥⎥⎥⎥⎥⎥⎥⎥⎥⎥⎥⎥⎥⎥⎥⎥⎥⎥⎥⎥⎥⎥⎥⎥⎥⎥⎥⎥⎥⎥⎥⎥⎥⎥⎥⎥⎥⎥⎥⎥⎥⎥⎥⎥⎥⎥⎥⎥⎥⎥⎥⎥⎥⎥⎥⎥⎥⎥⎥⎥⎥⎥⎥⎥⎥⎥⎥⎥⎥⎥⎥⎥⎥⎥⎥⎥⎥⎥⎥⎥⎥⎥⎥⎥⎥⎥⎥⎥⎥⎥⎥⎥⎥⎥⎥⎥⎥⎥⎥⎥⎥⎥⎥⎥⎥⎥⎥⎥⎥⎥⎥⎥⎥⎥⎥⎥⎥⎥⎥⎥⎥⎥⎥⎥⎥⎥⎥⎥⎥⎥⎥⎥⎦
(C7)
Si
0 0 0 001 002 001 001 003 002 002 003 0020 0 0 002 005 003 002 005 005 003 009 0030 0 0 002 005 003 002 006 006 004 008 004
001 001 001 0 0 0 0 0 0 000 001 001001 001 001 0 0 0 0 0 0 000 001 001000 000 000 0 0 0 0 0 0 000 000 000001 001 001 0 0 0 0 0 0 000 001 001001 001 001 0 0 0 0 0 0 000 001 001000 000 000 0 0 0 0 0 0 000 000 000002 002 001 001 001 001 001 001 001 0 0 0003 007 003 001 002 001 001 002 002 0 0 0002 003 001 001 001 001 001 001 001 0 0 0
⎡⎢⎢⎢⎢⎢⎢⎢⎢⎢⎢⎢⎢⎢⎢⎢⎢⎢⎢⎢⎢⎢⎢⎢⎢⎢⎢⎢⎢⎢⎢⎢⎢⎢⎢⎢⎢⎢⎢⎢⎢⎢⎢⎢⎢⎢⎢⎢⎢⎢⎢⎢⎢⎢⎢⎢⎢⎢⎢⎢⎢⎢⎢⎢⎢⎢⎢⎢⎢⎢⎢⎢⎢⎢⎢⎢⎢⎢⎢⎢⎢⎢⎢⎢⎢⎢⎢⎢⎢⎢⎢⎢⎢⎢⎢⎢⎢⎢⎢⎢⎢⎢⎢⎢⎢⎢⎢⎢⎢⎢⎢⎢⎢⎢⎢⎢⎢⎢⎢⎢⎢⎢⎢⎢⎢⎢⎢⎢⎢⎢⎢⎢⎢⎢⎢⎢⎢⎢⎢⎢⎢⎣
⎤⎥⎥⎥⎥⎥⎥⎥⎥⎥⎥⎥⎥⎥⎥⎥⎥⎥⎥⎥⎥⎥⎥⎥⎥⎥⎥⎥⎥⎥⎥⎥⎥⎥⎥⎥⎥⎥⎥⎥⎥⎥⎥⎥⎥⎥⎥⎥⎥⎥⎥⎥⎥⎥⎥⎥⎥⎥⎥⎥⎥⎥⎥⎥⎥⎥⎥⎥⎥⎥⎥⎥⎥⎥⎥⎥⎥⎥⎥⎥⎥⎥⎥⎥⎥⎥⎥⎥⎥⎥⎥⎥⎥⎥⎥⎥⎥⎥⎥⎥⎥⎥⎥⎥⎥⎥⎥⎥⎥⎥⎥⎥⎥⎥⎥⎥⎥⎥⎥⎥⎥⎥⎥⎥⎥⎥⎥⎥⎥⎥⎥⎥⎥⎥⎥⎥⎥⎥⎥⎥⎥⎦
(C8)
14 Complexity
F
009 006 006 0 0 0 0 0 0 0 0 0010 024 013 0 0 0 0 0 0 0 0 0017 019 014 0 0 0 0 0 0 0 0 00 0 0 002 004 003 002 005 005 0 0 00 0 0 002 004 003 002 005 005 0 0 00 0 0 001 001 001 001 001 001 0 0 00 0 0 002 003 002 002 004 004 0 0 00 0 0 001 003 002 002 004 003 0 0 00 0 0 000 001 001 001 001 001 0 0 00 0 0 0 0 0 0 0 0 005 004 0050 0 0 0 0 0 0 0 0 005 019 0050 0 0 0 0 0 0 0 0 003 006 004
⎡⎢⎢⎢⎢⎢⎢⎢⎢⎢⎢⎢⎢⎢⎢⎢⎢⎢⎢⎢⎢⎢⎢⎢⎢⎢⎢⎢⎢⎢⎢⎢⎢⎢⎢⎢⎢⎢⎢⎢⎢⎢⎢⎢⎢⎢⎢⎢⎢⎢⎢⎢⎢⎢⎢⎢⎢⎢⎢⎢⎢⎢⎢⎢⎢⎢⎢⎢⎢⎢⎢⎢⎢⎢⎢⎢⎢⎢⎢⎢⎢⎢⎢⎢⎢⎢⎢⎢⎢⎢⎢⎢⎢⎢⎢⎢⎢⎢⎢⎢⎢⎢⎢⎢⎢⎢⎢⎢⎢⎢⎢⎢⎢⎢⎢⎢⎢⎢⎢⎢⎢⎢⎢⎢⎢⎢⎢⎢⎢⎢⎢⎢⎢⎢⎢⎢⎢⎢⎢⎢⎢⎣
⎤⎥⎥⎥⎥⎥⎥⎥⎥⎥⎥⎥⎥⎥⎥⎥⎥⎥⎥⎥⎥⎥⎥⎥⎥⎥⎥⎥⎥⎥⎥⎥⎥⎥⎥⎥⎥⎥⎥⎥⎥⎥⎥⎥⎥⎥⎥⎥⎥⎥⎥⎥⎥⎥⎥⎥⎥⎥⎥⎥⎥⎥⎥⎥⎥⎥⎥⎥⎥⎥⎥⎥⎥⎥⎥⎥⎥⎥⎥⎥⎥⎥⎥⎥⎥⎥⎥⎥⎥⎥⎥⎥⎥⎥⎥⎥⎥⎥⎥⎥⎥⎥⎥⎥⎥⎥⎥⎥⎥⎥⎥⎥⎥⎥⎥⎥⎥⎥⎥⎥⎥⎥⎥⎥⎥⎥⎥⎥⎥⎥⎥⎥⎥⎥⎥⎥⎥⎥⎥⎥⎥⎦
(C9)
Data Availability
+e data used to support the findings of this study are in-cluded within the article
Conflicts of Interest
+e authors declare that they have no conflicts of interest
Acknowledgments
+e authors would like to thank the research team oneconomic systems engineering in Zhejiang Economic In-formation Center for their great and sincere help +is workwas supported by the Project in 2020 of Zhejiang ProvincialSoft Science Research of China (2020C35009) and theProject in 2019 of Zhejiang Provincial Social ScienceFoundation of China (19NDQN368YB)
References
[1] A Hirschman 2e Strategy of Economic Development YaleUniversity Press New Haven CT USA 1958
[2] R Banga and B Goldar ldquoContribution of services to outputgrowth and productivity in Indian manufacturing pre-andpost-reformsrdquo Economic and Political Weekly vol 42 no 26pp 2769ndash2777 2007
[3] J Francois and J Woerz ldquoProducer services manufacturinglinkages and traderdquo Journal of Industry Competition andTrade vol 8 no 3-4 pp 199ndash229 2008
[4] S Ke M He and C Yuan ldquoSynergy and co-agglomeration ofproducer services and manufacturing a panel data analysis ofChinese citiesrdquo Regional Studies vol 48 no 11pp 1829ndash1841 2014
[5] L Kong and X Liang ldquoResearch on the interaction betweenproducer services and manufacturing industry in ShaanxiProvincerdquo American Journal of Industrial and BusinessManagement vol 8 no 5 pp 1277ndash1289 2018
[6] W W Leontief ldquoQuantitative input and output relations inthe economic systems of the United Statesrdquo 2e Review ofEconomics and Statistics vol 18 no 3 pp 105ndash125 1936
[7] P Guerrieri and V Meliciani ldquoTechnology and internationalcompetitiveness the interdependence between
manufacturing and producer servicesrdquo Structural Change andEconomic Dynamics vol 16 no 4 pp 489ndash502 2005
[8] R-H Chiu and Y-C Lin ldquo+e inter-industrial linkage ofmaritime sector in Taiwan an input-output analysisrdquo AppliedEconomics Letters vol 19 no 4 pp 337ndash343 2012
[9] E Mattioli and G R Lamonica ldquo+e ICT role in the Wordeconomy an input-output analysisrdquo Journal of World Eco-nomic Research vol 2 no 2 pp 20ndash25 2013
[10] B R Khanal C Gan and S Becken ldquoTourism inter-industrylinkages in the Lao PDR economy an input-output analysisrdquoTourism Economics vol 20 no 1 pp 171ndash194 2014
[11] A-I Guerra and F Sancho ldquoMeasuring energy linkages withthe hypothetical extraction method an application to SpainrdquoEnergy Economics vol 32 no 4 pp 831ndash837 2010
[12] M J Sajid N Shahni and M Ali ldquoCalculating inter-sectoralcarbon flows of a mining sector via hypothetical extractionmethodrdquo Journal of Mining and Environment vol 10 no 4pp 853ndash867 2019
[13] M J Sajid Q Cao and W Kang ldquoTransport sector carbonlinkages of EUrsquos top seven emittersrdquo Transport Policy vol 80pp 24ndash38 May 2019
[14] Y Wang N Lai G Mao et al ldquoAir pollutant emissions fromeconomic sectors in China a linkage analysisrdquo EcologicalIndicators vol 77 pp 250ndash260 2017
[15] Y Wang H Liu G Mao J Zuo and J Ma ldquoInter-regionaland sectoral linkage analysis of air pollution in Beijing-Tianjin-Hebei (Jing-Jin-Ji) urban agglomeration of ChinardquoJournal of Cleaner Production vol 165 pp 1436ndash1444 2017
[16] Y Ali M Sabir and N Muhammad ldquoA comparative input-output analysis of the construction sector in three developingeconomies of South Asiardquo Construction Management andEconomics vol 37 no 11 pp 643ndash658 2019
[17] I Drejer ldquoInput-Output based measures of interindustrylinkages revisitedndashA survey and discussionrdquo in Proceedings ofthe 14th International Conference on Input-OutputTechniques Montreal Canada October 2002
[18] H B Chenery and T Watanabe ldquoInternational comparisonsof the structure of productionrdquo Econometrica vol 26 no 4pp 487ndash521 1958
[19] P N Rasmussen Studies in Inter-sectoral Relations E HarckCopenhagen Denmark 1956
[20] L P Jones ldquo+e measurement of hirschmanian linkagesrdquo2eQuarterly Journal of Economics vol 90 no 2 pp 323ndash3331976
Complexity 15
[21] F A Cuello F Mansouri and G J D Hewings ldquo+eidentification of structure at the sectoral level a reformulationof the hirschman-rasmussen key sector indicesrdquo EconomicSystems Research vol 4 no 4 pp 285ndash296 1992
[22] B R Hazari ldquoEmpirical identification of key sectors in theIndian economyrdquo 2e Review of Economics and Statisticsvol 52 no 3 pp 301ndash305 1970
[23] P S Laumas ldquoAn international comparison of the structure ofproductionrdquo Economia Internazionale vol 29 no 1-2pp 2ndash13 1976
[24] G Strassert ldquoZur bestimmung strategischer sektoren mit hilfevon input-output modellenrdquo Jahrbucher fur Natio-nalokonomie und Statistik vol 182 pp 211ndash215 1968 (InGerman)
[25] S Schultz ldquoApproaches to identifying key sectors empiricallyby means of input-output analysisrdquo 2e Journal of Develop-ment Studies vol 14 no 1 pp 77ndash96 1977
[26] G Cella ldquo+e input-output measurement of interindustrylinkagesrdquo Oxford Bulletin of Economics and Statistics vol 46no 1 pp 73ndash84 1984
[27] R Duarte J Sanchez-Choliz and J Bielsa ldquoWater use in theSpanish economy an input-output approachrdquo EcologicalEconomics vol 43 no 1 pp 71ndash85 2002
[28] M J Sajid X Li and Q Cao ldquoDemand and supply-sidecarbon linkages of Turkish economy using hypothetical ex-traction methodrdquo Journal of Cleaner Production vol 228pp 264ndash275 2019
[29] M S Silva and T P de Lima ldquoLooking for nonnegativesolutions of a Leontief dynamic modelrdquo Linear Algebra andIts Applications vol 364 pp 281ndash316 2003
[30] H D Kurz and N Salvadori ldquo+e dynamic Leontief modeland the theory of endogenous growthrdquo Economic SystemsResearch vol 12 no 2 pp 255ndash265 2010
[31] A Rose ldquoInput-output economics and computable generalequilibrium modelsrdquo Structural Change and Economic Dy-namics vol 6 no 3 pp 295ndash304 1995
[32] Q-X Li and S-F Liu ldquo+e foundation of the grey matrix andthe grey input-output analysisrdquo Applied MathematicalModelling vol 32 no 3 pp 267ndash291 2008
[33] A Tukker and E Dietzenbacher ldquoGlobal multiregional input-output frameworks an introduction and outlookrdquo EconomicSystems Research vol 25 no 1 pp 1ndash19 2013
[34] G E Halkos and K D Tsilika ldquoA new vision of classicalmulti-regional inputndashoutput modelsrdquo Computational Eco-nomics vol 51 no 3 pp 1ndash24 2018
[35] R E Miller ldquoInterregional feedback effects in input-outputmodels some preliminary resultsrdquo Papers of the RegionalScience Association vol 17 no 1 pp 105ndash125 1966
[36] J I Round ldquoDecomposing multipliers for economic systemsinvolving regional and world traderdquo 2e Economic Journalvol 95 no 378 pp 383ndash399 1985
[37] M Sonis J Oosterhaven and G J D Hewings ldquoSpatialeconomic structure and structural changes in the EC feed-back loop input-output analysisrdquo Economic Systems Researchvol 5 no 2 pp 173ndash184 1993
[38] E Dietzenbacher ldquoInterregional multipliers looking back-ward looking forwardrdquo Regional Studies vol 36 no 2pp 125ndash136 2002
[39] R E Miller and P D Blair Input-Output Analysis Foun-dation and Extension Cambridge University Press Cam-bridge UK 2nd edition 2009
[40] B Meng and C Qu ldquoApplication of the input-output de-composition technique to Chinarsquos regional economicsrdquo IDEDiscussion Papers vol 102 2007
[41] J Oosterhaven D Stelder and S Inomata ldquoEvaluation ofnon-survey international IO construct ion methods with theasian-pacific input-output tablerdquo IDE Discussion Papersvol 114 2007
16 Complexity
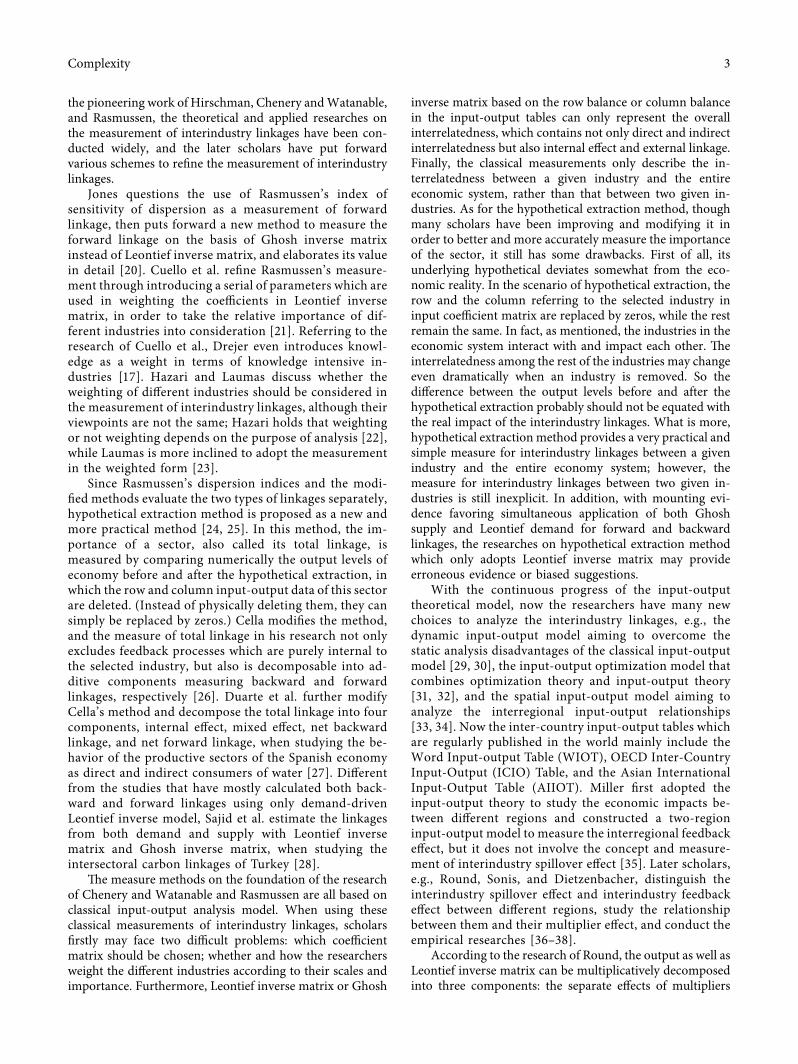
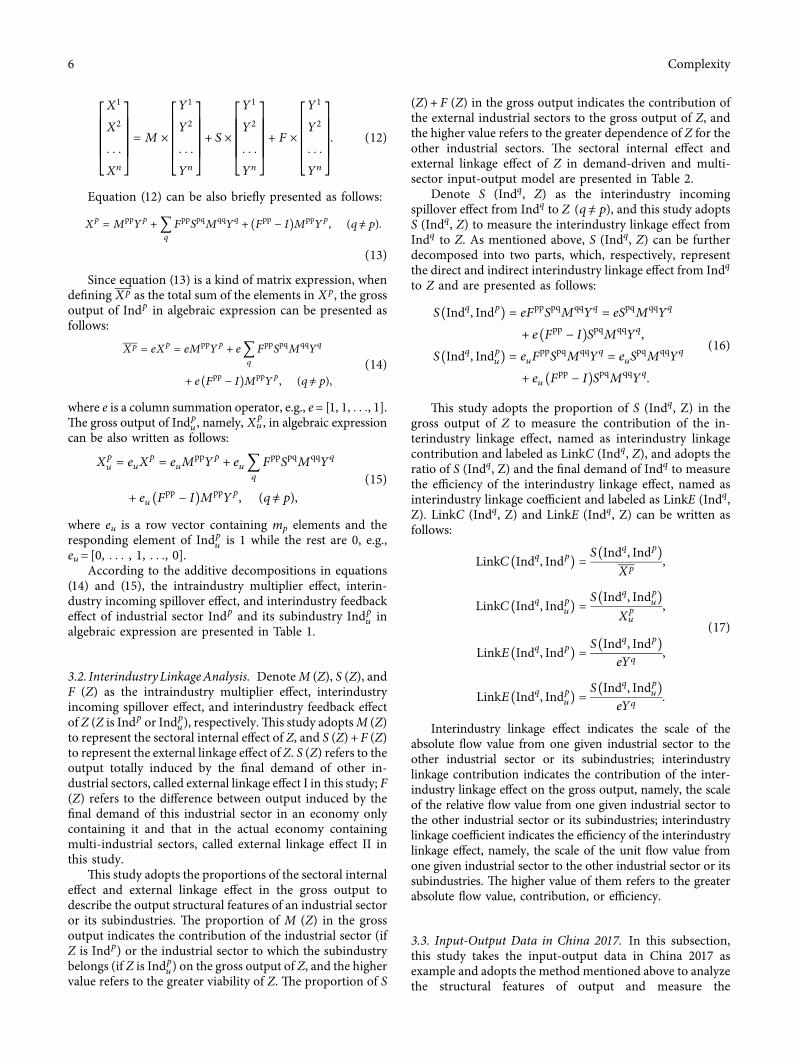
X1
X2
Xn
⎡⎢⎢⎢⎢⎢⎢⎢⎢⎢⎢⎢⎢⎢⎢⎢⎢⎢⎢⎢⎢⎢⎢⎢⎢⎢⎢⎢⎢⎣
⎤⎥⎥⎥⎥⎥⎥⎥⎥⎥⎥⎥⎥⎥⎥⎥⎥⎥⎥⎥⎥⎥⎥⎥⎥⎥⎥⎥⎥⎦
M times
Y1
Y2
Yn
⎡⎢⎢⎢⎢⎢⎢⎢⎢⎢⎢⎢⎢⎢⎢⎢⎢⎢⎢⎢⎢⎢⎢⎢⎢⎢⎢⎢⎢⎣
⎤⎥⎥⎥⎥⎥⎥⎥⎥⎥⎥⎥⎥⎥⎥⎥⎥⎥⎥⎥⎥⎥⎥⎥⎥⎥⎥⎥⎥⎦
+ S times
Y1
Y2
Yn
⎡⎢⎢⎢⎢⎢⎢⎢⎢⎢⎢⎢⎢⎢⎢⎢⎢⎢⎢⎢⎢⎢⎢⎢⎢⎢⎢⎢⎢⎣
⎤⎥⎥⎥⎥⎥⎥⎥⎥⎥⎥⎥⎥⎥⎥⎥⎥⎥⎥⎥⎥⎥⎥⎥⎥⎥⎥⎥⎥⎦
+ F times
Y1
Y2
Yn
⎡⎢⎢⎢⎢⎢⎢⎢⎢⎢⎢⎢⎢⎢⎢⎢⎢⎢⎢⎢⎢⎢⎢⎢⎢⎢⎢⎢⎢⎣
⎤⎥⎥⎥⎥⎥⎥⎥⎥⎥⎥⎥⎥⎥⎥⎥⎥⎥⎥⎥⎥⎥⎥⎥⎥⎥⎥⎥⎥⎦
(12)
Equation (12) can be also briefly presented as follows
Xp
Mpp
Yp
+ 1113944q
Fpp
Spq
Mqq
Yq
+ Fpp
minus I( 1113857Mpp
Yp (qnep)
(13)
Since equation (13) is a kind of matrix expression whendefining Xp as the total sum of the elements in Xp the grossoutput of Indp in algebraic expression can be presented asfollows
Xp eXp
eMpp
Yp
+ e 1113944q
Fpp
Spq
Mqq
Yq
+ e Fpp
minus I( 1113857Mpp
Yp (qnep)
(14)
where e is a column summation operator eg e [1 1 1]+e gross output of Indp
u namely Xpu in algebraic expression
can be also written as follows
Xpu euX
p euM
ppY
p+ eu 1113944
q
Fpp
Spq
Mqq
Yq
+ eu Fpp
minus I( 1113857Mpp
Yp (qnep)
(15)
where eu is a row vector containing mp elements and theresponding element of Indp
u is 1 while the rest are 0 egeu [0 1 0]
According to the additive decompositions in equations(14) and (15) the intraindustry multiplier effect interin-dustry incoming spillover effect and interindustry feedbackeffect of industrial sector Indp and its subindustry Indp
u inalgebraic expression are presented in Table 1
32 InterindustryLinkageAnalysis DenoteM (Z) S (Z) andF (Z) as the intraindustry multiplier effect interindustryincoming spillover effect and interindustry feedback effectof Z (Z is Indp or Indp
u) respectively+is study adoptsM (Z)to represent the sectoral internal effect of Z and S (Z) + F (Z)to represent the external linkage effect of Z S (Z) refers to theoutput totally induced by the final demand of other in-dustrial sectors called external linkage effect I in this study F(Z) refers to the difference between output induced by thefinal demand of this industrial sector in an economy onlycontaining it and that in the actual economy containingmulti-industrial sectors called external linkage effect II inthis study
+is study adopts the proportions of the sectoral internaleffect and external linkage effect in the gross output todescribe the output structural features of an industrial sectoror its subindustries +e proportion of M (Z) in the grossoutput indicates the contribution of the industrial sector (ifZ is Indp) or the industrial sector to which the subindustrybelongs (if Z is Indp
u) on the gross output of Z and the highervalue refers to the greater viability of Z +e proportion of S
(Z) + F (Z) in the gross output indicates the contribution ofthe external industrial sectors to the gross output of Z andthe higher value refers to the greater dependence of Z for theother industrial sectors +e sectoral internal effect andexternal linkage effect of Z in demand-driven and multi-sector input-output model are presented in Table 2
Denote S (Indq Z) as the interindustry incomingspillover effect from Indq to Z (qnep) and this study adoptsS (Indq Z) to measure the interindustry linkage effect fromIndq to Z As mentioned above S (Indq Z) can be furtherdecomposed into two parts which respectively representthe direct and indirect interindustry linkage effect from Indq
to Z and are presented as follows
S Indq Indp
( 1113857 eFpp
Spq
Mqq
Yq
eSpq
Mqq
Yq
+ e Fpp
minus I( 1113857Spq
Mqq
Yq
S Indq Indp
u( 1113857 euFpp
Spq
Mqq
Yq
euSpq
Mqq
Yq
+ eu Fpp
minus I( 1113857Spq
Mqq
Yq
(16)
+is study adopts the proportion of S (Indq Z) in thegross output of Z to measure the contribution of the in-terindustry linkage effect named as interindustry linkagecontribution and labeled as LinkC (Indq Z) and adopts theratio of S (Indq Z) and the final demand of Indq to measurethe efficiency of the interindustry linkage effect named asinterindustry linkage coefficient and labeled as LinkE (IndqZ) LinkC (Indq Z) and LinkE (Indq Z) can be written asfollows
LinkC Indq Indp
( 1113857 S Indq Indp( 1113857
Xp
LinkC Indq Indp
u( 1113857 S Indq Indp
u( 1113857
Xpu
LinkE Indq Indp
( 1113857 S Indq Indp( 1113857
eYq
LinkE Indq Indp
u( 1113857 S Indq Indp
u( 1113857
eYq
(17)
Interindustry linkage effect indicates the scale of theabsolute flow value from one given industrial sector to theother industrial sector or its subindustries interindustrylinkage contribution indicates the contribution of the inter-industry linkage effect on the gross output namely the scaleof the relative flow value from one given industrial sector tothe other industrial sector or its subindustries interindustrylinkage coefficient indicates the efficiency of the interindustrylinkage effect namely the scale of the unit flow value fromone given industrial sector to the other industrial sector or itssubindustries +e higher value of them refers to the greaterabsolute flow value contribution or efficiency
33 Input-Output Data in China 2017 In this subsectionthis study takes the input-output data in China 2017 asexample and adopts the method mentioned above to analyzethe structural features of output and measure the
6 Complexity
interindustry linkages between two industrial sectors SinceChinarsquos authority and the industry policy-makers have al-most regarded manufacturing and producer services as themost critical industrial sectors for industrial transformationand upgrading and have successively introduced a series ofindustrial policies to promote the integration level of the twoindustrial sectors this application case mainly focuses on theinterindustry linkages between them
Firstly the entire economic system of China is dividedinto three industrial sectors manufacturing producer ser-vices and the rest of the industries and each of them hassome subindustries In China Input-Output Table in Year2017 manufacturing has many subindustries Since the scaleof some subindustries of manufacturing is too smallmanufacturing is only further divided into three compo-nents low-tech manufacturing mid-tech manufacturingand high-tech manufacturing in this study according to theIndustrial Classification for National Economic Activities(ICNEA) issued in 2017 +e six subindustries of producerservices are wholesale service logistic service informationservice finance service business service and technologyservice +e three subindustries of the rest of the industriesare the primary industry the second industry excludingmanufacturing labeled as the rest second industry in briefand the tertiary industry excluding producer services labeledas the rest of the tertiary industry in brief +e classificationof the entire economic system is specifically presented inAppendix A and the rearranged China Input-Output Tablein Year 2017 is shown in Appendix B
Label manufacturing producer services and the rest ofthe industries as Ind1 Ind2 and Ind3 respectively the low-techmanufacturing mid-tech manufacturing and high-techmanufacturing in Ind1 as Ind11 Ind
12 and Ind
13 the wholesale
service logistic service information service finance servicebusiness service and technology service in Ind2 as Ind21Ind22 Ind
23 Ind
24 Ind
25 and Ind26 and the primary industry
the rest of the second industry and the rest of the tertiaryindustry in Ind3 as Ind31 Ind
32 and Ind33 +e gross input
vector X final demand vector Y input coefficient matrix ALeontief inverse matrix B intraindustry multiplier effectcoefficient matrixM interindustry spillover effect coefficientmatrix S direct interindustry spillover effect coefficientmatrix Sd indirect interindustry spillover effect coefficientmatrix Si and interindustry feedback effect coefficientmatrix F are presented in Appendix C
4 Results
On the basis of the method mentioned in Section 31 thedecomposition components of gross output ofmanufacturing producer services and their subindustries inChina 2017 are presented in Table 3
Further combining the data in Table 3 and themethod mentioned in Section 32 the output structuralfeatures of the two industrial sectors and their subin-dustries namely the proportions of sectoral internaleffect and external linkage effect are presented in Table 4the interindustry linkages from manufacturing to pro-ducer services are presented in Table 5 and those fromproducer services to manufacturing are presented inTable 6
+rough data observation and comparison in Tables 4ndash6this study finds the following results on manufacturing andproducer services
As for manufacturing in China 2017 (1) its viabilitynamely intraindustry multiplier effect or sectoral internaleffect contributes 4896 of the gross output of itself andthe external linkage effect namely the total sum of inter-industry spillover effect and interindustry feedback effectcontributes 5104 of the gross output of itself in which theinterindustry linkage effect from the rest of the industrialsector accounts for 3551 shown in Table 4 (2) the in-terindustry linkage effect direct interindustry linkage effectand indirect interindustry linkage effect from producerservices to manufacturing are 716 604 and 112 TrillionYuan respectively shown in Table 6 (3) the interindustrylinkage contribution and coefficient from producer servicesto manufacturing are 709 and 05129 respectively shownin Table 6
As for producer services in China 2017 (1) its viabilitycontributes 3806 of the gross output of itself and theexternal linkages contribute 6194 of the gross output ofitself in which the interindustry linkage effect from the restof the industrial sector accounts for 3579 shown in Ta-ble 4 (2) the interindustry linkage effect direct interindustrylinkage effect and indirect interindustry linkage effect frommanufacturing to producer services are 1109 1012 and097 Trillion Yuan respectively shown in Table 5 (3) theinterindustry linkage contribution and coefficient frommanufacturing to producer services are 2253 and 04625respectively shown in Table 5
Table 1 Decomposition components of gross output in demand-driven and multisector input-output model
Industrial sectoror subindustry
Grossoutput
Intraindustrymultiplier effect
Interindustry incomingspillover effect
Interindustry incomingspillover effect from Indq
Interindustryfeedback effect
Indp Xp euMppYp e1113936qFppSpqMqqYq (pne q) eFppSpqMqqYq (pne q) e(Fpp minus I)MppYp
Indpu X
pu euMppYp eu1113936qFppSpqMqqYq (pne q) euFppSpqMqqYq (pne q) eu(Fpp minus I)MppYp
Table 2 +e sectoral internal effect and external linkage effect in demand-driven and multisector input-output model
Industrial sector or subindustry Sectoral internal effect External linkage effectIndp eMppYp Xp minus eMppYp
Indpu euMppYp X
pu minus euMppYp
Complexity 7
Table 3 Decomposition components of gross output of manufacturing producer services and their subindustries
Industrial sectoror subindustry
Grossoutput
Intraindustrymultipliereffect
Interindustryincoming
spillover effect
Interindustryincoming
spillover effectfrom
manufacturing
Interindustryincoming
spillover effectfrom producer
services
Interindustryincoming
spillover effectfrom the rest ofthe industries
Interindustryfeedback effect
Manufacturing 10089 4940 4299 mdash 716 3583 851Low-techmanufacturing 2670 1691 800 mdash 150 650 179
Mid-techmanufacturing 2619 665 1658 mdash 201 1458 295
High-techmanufacturing 4800 2583 1840 mdash 365 1475 376
Producerservices 4922 1873 2870 1109 mdash 1761 178
Wholesaleservice 1159 423 691 330 mdash 360 045
Logistic service 1026 333 650 279 mdash 371 042Informationservice 565 368 185 056 mdash 129 011
Finance service 943 313 594 185 mdash 409 036Business service 718 194 492 195 mdash 298 032Technologyservice 510 241 258 064 - 194 011
+e unit of the data expressed is Trillion Yuan
Table 4 Output structural features of manufacturing producer services and their subindustries
Industrial sector orsubindustry
Grossoutput
Proportion of sectoralinternal effect
Proportion of externallinkage effect
Interindustry linkage contribution from therest of the industries
Manufacturing 10000 4896 5104 3551Low-techmanufacturing 10000 6335 3665 2435
Mid-tech manufacturing 10000 2541 7459 5565High-techmanufacturing 10000 5382 4618 3073
Producer services 10000 3806 6194 3579Wholesale service 10000 3653 6347 3109Logistic service 10000 3249 6751 3621Information service 10000 6515 3485 2290Finance service 10000 3321 6679 4336Business service 10000 2698 7302 4146Technology service 10000 4730 5270 3792+e unit of all the data expressed is
Table 5 Interindustry linkages from manufacturing to producer services and its subindustries
Industrial sectoror subindustry
Interindustry linkageeffect (Trillion Yuan)
Direct interindustrylinkage effect (Trillion
Yuan)
Indirect interindustrylinkage effect (Trillion
Yuan)
Interindustrylinkage contribution
()
Interindustrylinkage coefficient
Producer services 1109 1012 097 2253 04625Wholesale service 330 306 024 2850 01378Logistic service 279 256 023 2719 01163Informationservice 056 050 006 991 00234
Finance service 185 165 020 1959 00771Business service 195 177 017 2711 00812Technologyservice 064 058 006 1260 00268
8 Complexity
Similarly the results of the subindustries of manufacturingor producer services can also be summarized according toTables 4ndash6 which are not presented for brevity
Compared with the previous measurements of interin-dustry linkages based on Leontief inverse matrix or similarcoefficient matrix this study further decomposes Leontiefinverse matrix into three components based on demand-driven and multisector input-output model in which thedifferent industrial sectors in the entire economic system areregarded as different regions in the spatial scope +emethod in this study has three obvious advantages
Firstly the method takes multiplier effect as sectoralinternal effect and takes the total sum of spillover effect andfeedback effect as external linkage effectWhen analyzing thestructural features of the gross output it integrates thesectoral internal effect and external linkage effect at the sametime which can make it easy to understand the drivingmechanism of industrial development
Secondly the classical measurements of interindustrylinkages based on Leontief inverse matrix or similar coef-ficient matrix generally only reflect the overall interrelat-edness namely the interindustry linkages between the givenindustry and the entire economic system while the methodin this study can not only measure the interindustry linkageeffects between two given industrial sectors but also clearlydescribe the composition ratio of the direct and indirectinterindustry linkage effects through the further decom-position of spillover effect
+irdly the method adopts respectively the absoluteflow value relative flow value and unit relative value of theinput-output relationship as the measurement of interin-dustry linkage effect interindustry linkage contribution andinterindustry linkage coefficient which can comprehen-sively reflect and evaluate the degree of industry linkages
5 Discussion and Policy Implication
In accordance with the above results four viewpoints inagreement with the cognitive patterns have been tested againby the empirical evidence from China Firstly compared withthe indirect interindustry linkage effects the direct interin-dustry linkage effects between manufacturing and producerservices are overwhelmingly dominant accounting for about80sim90 of the total interindustry linkage effects (see Ta-bles 5 and 6) Secondly the viability of manufacturing isoverall significantly stronger than that of producer services
namely the proportion of sectoral internal effect on the grossoutput of manufacturing is significantly greater than that ofproducer services (see Table 4) +irdly among the interin-dustry linkages from producer services to the subindustries ofmanufacturing the interindustry linkages to mid-tech orhigh-tech manufacturing are significantly stronger than thoseto low-tech manufacturing (see Table 6) Fourthly the outputof manufacturing induced by per unit final demand ofproducer services is larger than that of producer servicesinduced by per unit final demand of manufacturing namelythe interindustry linkage coefficient from producer services tomanufacturing is higher than that from manufacturing toproducer services (see Tables 5 and 6)
What is more some unique local features ofmanufacturingand producer services in China can be also drawn as followsand in this study we think they are helpful for the policy-makers and economists to better evaluate the developmentstatus of two critical industrial sectors in China
(1) Whether it is the manufacturing or producer ser-vices the total sum of interindustry spillover effectand interindustry feedback effect is higher thanintraindustry multiplier effect (see Table 4) indi-cating that the external linkage effect is the maindriving force for the output of these two industrialsectors and the viability of them is secondary Inaddition compared with the intraindustry multipliereffect the interindustry feedback has a certain scalewhich means that the estimation error will be ob-vious when a single-sector model is used instead ofmultisector model +is is different from some re-searches on multiregional input-output model[40 41] in which the interregional feedback effect isusually neglected for the very small scale comparedwith the intraregional multiplier effect One rea-sonable explanation is that the interdependence ofdifferent industrial sectors is much stronger thanthat of different regions for goodsrsquo or servicesrsquotransfer barriers of the former are significantly lessthan that of the latter
(2) +e interindustry linkage effects and contributionsbetween manufacturing and producer services inChina are not strong overall compared with thosefrom the rest of the industries to manufacturing orproducer service (see Tables 4ndash6) In 2017 the in-terindustry linkage effect and proportion from
Table 6 Interindustry linkages from producer services to manufacturing and its subindustries
Industrial sector orsubindustry
Interindustry linkageeffect (Trillion Yuan)
Direct interindustrylinkage effect (Trillion
Yuan)
Indirect interindustrylinkage effect (Trillion
Yuan)
Interindustrylinkage contribution
()
Interindustrylinkage coefficient
Manufacturing 716 604 112 709 05129Low-techmanufacturing 150 129 020 560 01072
Mid-techmanufacturing 201 157 044 767 01439
High-techmanufacturing 365 318 047 761 02617
Complexity 9
producer services to manufacturing are 716 trillionYuan and 709 and both of them are far smallerthan those from the rest of the industries tomanufacturing which are 3583 trillion Yuan and3551 In spite of the fact that the interindustrylinkage proportion from manufacturing to producerservices is higher than that from producer services tomanufacturing and the interindustry linkage effectfrom manufacturing to producer services is alsohigher than that from producer services tomanufacturing they are still smaller than those fromthe rest of the industries to producer services +eempirical results show that the impact of the rest ofthe industries in China on manufacturing or pro-ducer services is very significant accounting for themajor or overwhelming major of the external linkageeffect If analyzing the interindustry linkages be-tween manufacturing and producer services onlywith the two-sector model and ignoring the role ofthe rest of the industries it will greatly weaken theapplicability of the conclusions
(3) Interindustry linkages from manufacturing towholesale service and logistic service are relativelystrong while those from manufacturing to infor-mation service and technology service are relatively
weak Among the interindustry linkages frommanufacturing to the subindustries of producer ser-vices the linkage to wholesale service is the highestfollowed by logistic service business service financialservice and technology service and the lowest is toinformation service (see Table 5) Since the laborproductivities of information service and technologyservice are usually higher than those of wholesaleservice and logistic service the empirical results showthat in China the pull force from manufacturing ismore significant in the field of low-level producerservices instead of high-level services and the evolu-tion of interindustry linkages between manufacturingand producer services is still in the primary stage
After the analysis and evaluation of the output structuralfeatures and interindustry linkages in Chinese three-sectoreconomic system in the perspective of improving thecurrent weak links this study puts forward the followingthree policy suggestions aiming to promote the integrationlevel of manufacturing and producer services in China
First of all the policy-makers in China should pay greatattention to the fact that the interindustry linkages betweenmanufacturing and producer services are not strong overalland the interindustry linkage effect from producer servicesto manufacturing is weaker than that frommanufacturing to
Table 7 +e classification of the entire economic system of China
Industrial sectors Subindustries Corresponding industries in China ICNEA
Manufacturing
Low-tech manufacturing
Processing of food from agricultural products manufacture of foods manufacture ofalcoholbeveragesrefined tea manufacture of tobacco manufacture of textiles
manufacture of textilesclothingapparel industry manufacture of leatherfurfeatherrelated products and footwear industry processing of timber and manufacture of woodbamboorattanpalmstraw products manufacture of furniture manufacture of paperand paper prod printing and recorded media manufacture of articles for culture
educationartsportsentertainment
Mid-tech manufacturing
Processing of petroleumcokingprocessing of nuclear fuel manufacturing ofnonmetallic minerals products smelting and processing of ferrous metals smelting andprocessing of nonferrous metals manufacture of metal products other manufacturingcomprehensive use of waste resources repair of metal productsmachineryequipment
High-techmanufacturing
Manufacture of chemical raw materials and chemical products manufacture ofmedicines manufacture of chemical fibers manufacturing of rubber and plastics
manufacture of general purpose machinery manufacture of special purpose machinerymanufacture of automobiles manufacture of railwayshipsaerospaceothertransportation equipment manufacture of electrical machineryequipment
manufacture of computerscommunicationother electronic equipment manufacturingof measuring instruments
Producer services
Wholesale service Wholesale and retail tradesLogistic service Transport storage and postal services
Information service Information transfer software and information technology servicesFinance service FinanceBusiness service Leasing and commercial services
Technology service Scientific research and polytechnic services
+e rest of theindustries
+e primary industry Agriculture+e rest of the second
industry Mining and quarrying utilities and construction
+e rest of the tertiaryindustry
Accommodation and catering real estate administrate of waterenvironmentpublicfacilities residentrepairother services education health care and social work culturesportsentertainment public administrationsocial insurancesocial organizations
international organizations
10 Complexity
Tabl
e8
+erearrang
edChina
inpu
t-ou
tput
tablein
year
2017
Inpu
toutpu
tLo
w-tech
manufacturing
Mid-tech
manufacturing
High-tech
manufacturing
Who
lesale
service
Logistic
service
Inform
ation
service
Finance
service
Busin
ess
service
Techno
logy
service
+e
prim
ary
indu
stry
+erest
ofthe
second
indu
stry
+erest
ofthe
tertiary
indu
stry
Final
demand
Gross
output
Low-tech
manufacturing
857065
43149
112197
11554
13946
19762
33674
80792
13031
96879
75757
235060
1076980
2669846
Mid-tech
manufacturing
67978
839567
584035
3564
83976
1375
3039
41747
26179
7156
842848
22944
94766
2619175
High-tech
manufacturing
185521
161427
2227382
18276
104060
44285
5908
64204
89556
102688
324054
246620
1225821
4799802
Who
lesale
service
154947
76784
233358
7363
25115
8105
6057
24088
11757
23666
122590
71993
393111
1158936
Logisticservice
90880
78420
143063
72360
110433
8564
16563
45098
23275
25033
93606
81630
236607
1025533
Inform
ation
service
6327
3637
29176
6937
17657
92569
30641
6859
6144
1591
32936
46022
284783
565280
Finances
ervice
22097
57145
67138
47729
110540
11695
79120
48866
14081
14511
135242
129009
206231
943405
Busin
ess
service
51564
26419
92268
108866
20957
37234
84123
72408
20659
2688
52043
83195
65630
718055
Techno
logy
service
5536
7654
34753
8405
2452
1764
1104
084
57384
7843
171869
2716
208897
510460
+eprim
ary
indu
stry
573601
2529
51511
012
101
365
091
5153
2918
146838
19274
48274
250572
1101240
+erest
ofthe
second
indu
stry
44659
608986
154879
12318
27474
6864
8486
3483
5219
11409
502942
55191
2022797
3464709
+erest
ofthe
tertiary
indu
stry
25672
25301
55012
90920
44244
37407
134265
90091
35654
6415
51678
238275
2165960
3000894
Value
added
583997
688157
1015031
770630
464576
295291
540332
235183
204602
654524
1039869
1739965
Gross
inpu
t2669846
2619175
4799802
1158936
1025533
565280
943405
718055
510460
1101240
3464709
3000894
+eo
riginalinp
ut-outpu
ttablein
2017
hastotally149indu
striesand
itcanbe
downloadedthroughhttpdatastatsg
ovcnfileshtm
lquickSearchtr
cctr
cc01htm
lthefi
naldem
andin
thistablec
ontainsthe
part
ofnete
xports+
eun
itof
thedata
expressedisBillion
Yuan
Complexity 11
producer services It means that the producer services are amore obvious weak link compared with manufacturing so itis necessary to further strengthen the supporting of producerservices for manufacturing and take measures such aspromoting the industrial clustering degree or improving theserviceability of producer services
Secondly in view of the fact that low-tech manufacturingis the key weak link among the subindustries ofmanufacturing it is necessary to accelerate the transformationof traditional low-tech manufacturing through the universalapplication and integration of producer services in responseto the trends of industrialization upgrading in China
Finally in view of the fact that information service is thekey weak link among the subindustries of producer serviceit is necessary to speed up the pace of manufacturing ser-vitization especially manufacturing digitization and pro-mote the widespread application of information technologyin the field of manufacturing
6 Conclusions
+is study puts forward a new method for interindustrylinkage analysis in a complex economic system on the basisof demand-driven and multisector input-output model inwhich the output as well as Leontief inverse matrix isdecomposed into three components and interindustrylinkage effect interindustry linkage contribution and in-terindustry linkage coefficient are adopted as the measuringindices Compared with the previous measurements ofinterindustry linkages based on Leontief inverse matrix orsimilar coefficient matrix the method in this study hassome obvious advantages As a whole this method is arefinement of Hirschmanrsquos backward linkage which iscritical in the perspective of output structure in demandside
Based on the method and input-output data this studyalso conducts an empirical study on the interindustrylinkages between Chinarsquos manufacturing and producerservices and the results show that the external linkageeffect is the main driving force for the output of these twoindustrial sectors and the viability of them is secondarythe interindustry linkage effects and contributions be-tween manufacturing and producer services in China arenot strong overall compared with those from the rest ofthe industries to manufacturing or producer service in-terindustry linkages from manufacturing to wholesaleservice and logistic service are relatively strong whilethose from manufacturing to information service andtechnology service are relatively weak +e authors holdthat the method in this study is helpful for policy-makersand relevant stakeholders to better understand the in-terrelatedness between two industrial sectors in a complexeconomic system and identify the key weak links whichguide them to promote balanced development ofeconomy
Finally it is worth mentioning that this study onlydiscusses Hirschmanrsquos backward linkage on the basis ofLeontief inverse matrix mainly due to the fact that theoutput structure on the demand side generally is paid more
attention Further research may focus on the forward linkageon the basis of Ghosh inverse matrix and explore thestructural features of output on the supply side or someother important economic factors such as value addedemployment and resource utilization
Appendix
A The Classification of the Entire EconomicSystem of China
+e classification of the entire economic system of China isshown in Table 7
BTheRearrangedChina Input-OutputTable inYear 2017 (Unit Billion Yuan)
+e rearranged China input-output table in year 2017 isshown in Table 8
C Some Critical Vectors and Matrices of theApplication Case in China 2017
X
X1
X2
X3
⎡⎢⎢⎢⎢⎢⎢⎢⎢⎢⎢⎢⎢⎢⎣
⎤⎥⎥⎥⎥⎥⎥⎥⎥⎥⎥⎥⎥⎥⎦
X11
X12
X13
X21
X22
X23
X24
X25
X26
X31
X32
X33
⎡⎢⎢⎢⎢⎢⎢⎢⎢⎢⎢⎢⎢⎢⎢⎢⎢⎢⎢⎢⎢⎢⎢⎢⎢⎢⎢⎢⎢⎢⎢⎢⎢⎢⎢⎢⎢⎢⎢⎢⎢⎢⎢⎢⎢⎢⎢⎢⎢⎢⎢⎢⎢⎢⎢⎢⎢⎢⎢⎢⎢⎢⎢⎢⎢⎢⎢⎢⎢⎢⎢⎢⎢⎢⎢⎢⎢⎢⎢⎢⎢⎢⎢⎢⎢⎢⎢⎢⎢⎢⎢⎢⎢⎢⎢⎢⎢⎢⎢⎢⎢⎢⎢⎢⎢⎢⎢⎢⎢⎢⎢⎢⎢⎢⎢⎢⎢⎢⎢⎢⎢⎢⎢⎢⎢⎢⎢⎢⎢⎢⎢⎢⎢⎢⎢⎢⎢⎢⎢⎢⎢⎢⎢⎢⎢⎢⎢⎢⎢⎢⎢⎢⎢⎢⎢⎢⎢⎣
⎤⎥⎥⎥⎥⎥⎥⎥⎥⎥⎥⎥⎥⎥⎥⎥⎥⎥⎥⎥⎥⎥⎥⎥⎥⎥⎥⎥⎥⎥⎥⎥⎥⎥⎥⎥⎥⎥⎥⎥⎥⎥⎥⎥⎥⎥⎥⎥⎥⎥⎥⎥⎥⎥⎥⎥⎥⎥⎥⎥⎥⎥⎥⎥⎥⎥⎥⎥⎥⎥⎥⎥⎥⎥⎥⎥⎥⎥⎥⎥⎥⎥⎥⎥⎥⎥⎥⎥⎥⎥⎥⎥⎥⎥⎥⎥⎥⎥⎥⎥⎥⎥⎥⎥⎥⎥⎥⎥⎥⎥⎥⎥⎥⎥⎥⎥⎥⎥⎥⎥⎥⎥⎥⎥⎥⎥⎥⎥⎥⎥⎥⎥⎥⎥⎥⎥⎥⎥⎥⎥⎥⎥⎥⎥⎥⎥⎥⎥⎥⎥⎥⎥⎥⎥⎥⎥⎥⎦
2670
2619
4800
1159
1026
565
943
718
510
1101
3465
3001
⎡⎢⎢⎢⎢⎢⎢⎢⎢⎢⎢⎢⎢⎢⎢⎢⎢⎢⎢⎢⎢⎢⎢⎢⎢⎢⎢⎢⎢⎢⎢⎢⎢⎢⎢⎢⎢⎢⎢⎢⎢⎢⎢⎢⎢⎢⎢⎢⎢⎢⎢⎢⎢⎢⎢⎢⎢⎢⎢⎢⎢⎢⎢⎢⎢⎢⎢⎢⎢⎢⎢⎢⎢⎢⎢⎢⎢⎢⎢⎢⎢⎢⎢⎢⎢⎢⎢⎢⎢⎢⎢⎢⎢⎢⎢⎢⎢⎢⎢⎢⎢⎢⎢⎢⎢⎢⎢⎢⎢⎢⎢⎢⎢⎢⎢⎢⎢⎢⎢⎢⎢⎢⎢⎢⎢⎢⎢⎢⎢⎢⎢⎢⎢⎢⎢⎢⎢⎢⎢⎢⎢⎢⎢⎢⎢⎢⎢⎢⎢⎢⎢⎢⎢⎢⎢⎢⎣
⎤⎥⎥⎥⎥⎥⎥⎥⎥⎥⎥⎥⎥⎥⎥⎥⎥⎥⎥⎥⎥⎥⎥⎥⎥⎥⎥⎥⎥⎥⎥⎥⎥⎥⎥⎥⎥⎥⎥⎥⎥⎥⎥⎥⎥⎥⎥⎥⎥⎥⎥⎥⎥⎥⎥⎥⎥⎥⎥⎥⎥⎥⎥⎥⎥⎥⎥⎥⎥⎥⎥⎥⎥⎥⎥⎥⎥⎥⎥⎥⎥⎥⎥⎥⎥⎥⎥⎥⎥⎥⎥⎥⎥⎥⎥⎥⎥⎥⎥⎥⎥⎥⎥⎥⎥⎥⎥⎥⎥⎥⎥⎥⎥⎥⎥⎥⎥⎥⎥⎥⎥⎥⎥⎥⎥⎥⎥⎥⎥⎥⎥⎥⎥⎥⎥⎥⎥⎥⎥⎥⎥⎥⎥⎥⎥⎥⎥⎥⎥⎥⎥⎥⎥⎥⎥⎥⎦
(C1)
Y
Y1
Y2
Y3
⎡⎢⎢⎢⎢⎢⎢⎢⎢⎢⎢⎣⎤⎥⎥⎥⎥⎥⎥⎥⎥⎥⎥⎦
Y11
Y12
Y13
Y21
Y22
Y23
Y24
Y25
Y26
Y31
Y32
Y33
⎡⎢⎢⎢⎢⎢⎢⎢⎢⎢⎢⎢⎢⎢⎢⎢⎢⎢⎢⎢⎢⎢⎢⎢⎢⎢⎢⎢⎢⎢⎢⎢⎢⎢⎢⎢⎢⎢⎢⎢⎢⎢⎢⎢⎢⎢⎢⎢⎢⎢⎢⎢⎢⎢⎢⎢⎢⎢⎢⎢⎢⎢⎢⎢⎢⎢⎢⎢⎢⎢⎢⎢⎢⎢⎢⎢⎢⎢⎢⎢⎢⎢⎢⎢⎢⎢⎢⎢⎢⎢⎢⎢⎢⎢⎢⎢⎢⎢⎢⎢⎢⎢⎢⎢⎢⎢⎢⎢⎢⎢⎢⎢⎢⎢⎢⎢⎢⎢⎢⎢⎢⎢⎢⎢⎢⎢⎢⎢⎢⎢⎢⎢⎢⎢⎢⎢⎢⎢⎢⎢⎢⎢⎣
⎤⎥⎥⎥⎥⎥⎥⎥⎥⎥⎥⎥⎥⎥⎥⎥⎥⎥⎥⎥⎥⎥⎥⎥⎥⎥⎥⎥⎥⎥⎥⎥⎥⎥⎥⎥⎥⎥⎥⎥⎥⎥⎥⎥⎥⎥⎥⎥⎥⎥⎥⎥⎥⎥⎥⎥⎥⎥⎥⎥⎥⎥⎥⎥⎥⎥⎥⎥⎥⎥⎥⎥⎥⎥⎥⎥⎥⎥⎥⎥⎥⎥⎥⎥⎥⎥⎥⎥⎥⎥⎥⎥⎥⎥⎥⎥⎥⎥⎥⎥⎥⎥⎥⎥⎥⎥⎥⎥⎥⎥⎥⎥⎥⎥⎥⎥⎥⎥⎥⎥⎥⎥⎥⎥⎥⎥⎥⎥⎥⎥⎥⎥⎥⎥⎥⎥⎥⎥⎥⎥⎥⎥⎦
1077095122639323728520606620925120232166
⎡⎢⎢⎢⎢⎢⎢⎢⎢⎢⎢⎢⎢⎢⎢⎢⎢⎢⎢⎢⎢⎢⎢⎢⎢⎢⎢⎢⎢⎢⎢⎢⎢⎢⎢⎢⎢⎢⎢⎢⎢⎢⎢⎢⎢⎢⎢⎢⎢⎢⎢⎢⎢⎢⎢⎢⎢⎢⎢⎢⎢⎢⎢⎢⎢⎢⎢⎢⎢⎢⎢⎢⎢⎢⎢⎢⎢⎢⎢⎢⎢⎢⎢⎢⎢⎢⎢⎢⎢⎢⎢⎢⎢⎢⎢⎢⎢⎢⎢⎢⎢⎢⎢⎢⎢⎢⎢⎢⎢⎢⎢⎢⎢⎢⎢⎢⎢⎢⎢⎢⎢⎢⎢⎢⎢⎢⎢⎢⎢⎢⎢⎢⎢⎢⎢⎢⎢⎢⎢⎢⎢⎣
⎤⎥⎥⎥⎥⎥⎥⎥⎥⎥⎥⎥⎥⎥⎥⎥⎥⎥⎥⎥⎥⎥⎥⎥⎥⎥⎥⎥⎥⎥⎥⎥⎥⎥⎥⎥⎥⎥⎥⎥⎥⎥⎥⎥⎥⎥⎥⎥⎥⎥⎥⎥⎥⎥⎥⎥⎥⎥⎥⎥⎥⎥⎥⎥⎥⎥⎥⎥⎥⎥⎥⎥⎥⎥⎥⎥⎥⎥⎥⎥⎥⎥⎥⎥⎥⎥⎥⎥⎥⎥⎥⎥⎥⎥⎥⎥⎥⎥⎥⎥⎥⎥⎥⎥⎥⎥⎥⎥⎥⎥⎥⎥⎥⎥⎥⎥⎥⎥⎥⎥⎥⎥⎥⎥⎥⎥⎥⎥⎥⎥⎥⎥⎥⎥⎥⎥⎥⎥⎥⎥⎥⎦
(C2)
12 Complexity
Note the unit of the elements inX and Y is Trillion Yuan
A
A11 A12 A13
A21 A22 A23
A31 A32 A33
⎡⎢⎢⎢⎢⎢⎢⎢⎢⎢⎢⎢⎢⎢⎣
⎤⎥⎥⎥⎥⎥⎥⎥⎥⎥⎥⎥⎥⎥⎦
032 002 002 001 001 003 004 011 003 009 002 008
003 032 012 000 008 000 000 006 005 001 024 001
007 006 046 002 010 008 001 009 018 009 009 008
006 003 005 001 002 001 001 003 002 002 004 002
003 003 003 006 011 002 002 006 005 002 003 003
000 000 001 001 002 016 003 001 001 000 001 002
001 002 001 004 011 002 008 007 003 001 004 004
002 001 002 009 002 007 009 010 004 000 002 003
000 000 001 001 000 000 000 000 011 001 005 000
021 000 001 000 000 000 000 001 001 013 001 002
002 023 003 001 003 001 001 000 001 001 015 002
001 001 001 008 004 007 014 013 007 001 001 008
⎡⎢⎢⎢⎢⎢⎢⎢⎢⎢⎢⎢⎢⎢⎢⎢⎢⎢⎢⎢⎢⎢⎢⎢⎢⎢⎢⎢⎢⎢⎢⎢⎢⎢⎢⎢⎢⎢⎢⎢⎢⎢⎢⎢⎢⎢⎢⎢⎢⎢⎢⎢⎢⎢⎢⎢⎢⎢⎢⎢⎢⎢⎢⎢⎢⎢⎢⎢⎢⎢⎢⎢⎢⎢⎢⎢⎢⎢⎢⎢⎢⎢⎢⎢⎢⎢⎢⎢⎢⎢⎢⎢⎢⎢⎢⎢⎢⎢⎢⎢⎢⎢⎢⎢⎢⎢⎢⎢⎢⎢⎢⎢⎢⎢⎢⎢⎢⎢⎢⎢⎢⎢⎢⎢⎢⎢⎢⎢⎢⎢⎢⎢⎢⎢⎢⎢⎢⎢⎢⎢⎢⎢⎢⎢⎢⎢⎢⎢⎢⎢⎢⎢⎢⎢⎢⎢⎣
⎤⎥⎥⎥⎥⎥⎥⎥⎥⎥⎥⎥⎥⎥⎥⎥⎥⎥⎥⎥⎥⎥⎥⎥⎥⎥⎥⎥⎥⎥⎥⎥⎥⎥⎥⎥⎥⎥⎥⎥⎥⎥⎥⎥⎥⎥⎥⎥⎥⎥⎥⎥⎥⎥⎥⎥⎥⎥⎥⎥⎥⎥⎥⎥⎥⎥⎥⎥⎥⎥⎥⎥⎥⎥⎥⎥⎥⎥⎥⎥⎥⎥⎥⎥⎥⎥⎥⎥⎥⎥⎥⎥⎥⎥⎥⎥⎥⎥⎥⎥⎥⎥⎥⎥⎥⎥⎥⎥⎥⎥⎥⎥⎥⎥⎥⎥⎥⎥⎥⎥⎥⎥⎥⎥⎥⎥⎥⎥⎥⎥⎥⎥⎥⎥⎥⎥⎥⎥⎥⎥⎥⎥⎥⎥⎥⎥⎥⎥⎥⎥⎥⎥⎥⎥⎥⎥⎦
(C3)
B
157 011 013 007 009 012 012 026 012 019 011 017019 175 048 007 026 010 007 023 025 010 059 011037 037 206 013 033 028 013 036 051 029 041 027014 010 014 103 007 005 004 009 008 006 010 006011 011 012 010 117 006 006 013 011 006 010 007002 002 003 002 004 121 005 003 003 001 003 003006 010 009 008 017 006 113 014 009 004 011 008007 007 009 013 007 012 013 117 010 003 007 007002 004 003 001 002 001 001 001 114 002 008 001040 004 006 002 003 004 004 008 005 120 005 007011 050 022 005 013 007 005 010 011 006 136 007007 008 008 013 011 013 021 021 014 004 008 113
⎡⎢⎢⎢⎢⎢⎢⎢⎢⎢⎢⎢⎢⎢⎢⎢⎢⎢⎢⎢⎢⎢⎢⎢⎢⎢⎢⎢⎢⎢⎢⎢⎢⎢⎢⎢⎢⎢⎢⎢⎢⎢⎢⎢⎢⎢⎢⎢⎢⎢⎢⎢⎢⎢⎢⎢⎢⎢⎢⎢⎢⎢⎢⎢⎢⎢⎢⎢⎢⎢⎢⎢⎢⎢⎢⎢⎢⎢⎢⎢⎢⎢⎢⎢⎢⎢⎢⎢⎢⎢⎢⎢⎢⎢⎢⎢⎢⎢⎢⎢⎢⎢⎢⎢⎢⎢⎢⎢⎢⎢⎢⎢⎢⎢⎢⎢⎢⎢⎢⎢⎢⎢⎢⎢⎢⎢⎢⎢⎢⎢⎢⎢⎢⎢⎢⎢⎢⎢⎢⎢⎢⎣
⎤⎥⎥⎥⎥⎥⎥⎥⎥⎥⎥⎥⎥⎥⎥⎥⎥⎥⎥⎥⎥⎥⎥⎥⎥⎥⎥⎥⎥⎥⎥⎥⎥⎥⎥⎥⎥⎥⎥⎥⎥⎥⎥⎥⎥⎥⎥⎥⎥⎥⎥⎥⎥⎥⎥⎥⎥⎥⎥⎥⎥⎥⎥⎥⎥⎥⎥⎥⎥⎥⎥⎥⎥⎥⎥⎥⎥⎥⎥⎥⎥⎥⎥⎥⎥⎥⎥⎥⎥⎥⎥⎥⎥⎥⎥⎥⎥⎥⎥⎥⎥⎥⎥⎥⎥⎥⎥⎥⎥⎥⎥⎥⎥⎥⎥⎥⎥⎥⎥⎥⎥⎥⎥⎥⎥⎥⎥⎥⎥⎥⎥⎥⎥⎥⎥⎥⎥⎥⎥⎥⎥⎦
(C4)
M
148 004 007 0 0 0 0 0 0 0 0 0009 151 035 0 0 0 0 0 0 0 0 0020 018 192 0 0 0 0 0 0 0 0 00 0 0 101 003 002 001 004 003 0 0 00 0 0 008 113 003 003 008 007 0 0 00 0 0 001 003 120 005 002 002 0 0 00 0 0 006 014 004 111 010 005 0 0 00 0 0 012 004 009 012 113 006 0 0 00 0 0 001 000 000 000 000 113 0 0 00 0 0 0 0 0 0 0 0 115 001 0020 0 0 0 0 0 0 0 0 001 117 0020 0 0 0 0 0 0 0 0 001 002 109
⎡⎢⎢⎢⎢⎢⎢⎢⎢⎢⎢⎢⎢⎢⎢⎢⎢⎢⎢⎢⎢⎢⎢⎢⎢⎢⎢⎢⎢⎢⎢⎢⎢⎢⎢⎢⎢⎢⎢⎢⎢⎢⎢⎢⎢⎢⎢⎢⎢⎢⎢⎢⎢⎢⎢⎢⎢⎢⎢⎢⎢⎢⎢⎢⎢⎢⎢⎢⎢⎢⎢⎢⎢⎢⎢⎢⎢⎢⎢⎢⎢⎢⎢⎢⎢⎢⎢⎢⎢⎢⎢⎢⎢⎢⎢⎢⎢⎢⎢⎢⎢⎢⎢⎢⎢⎢⎢⎢⎢⎢⎢⎢⎢⎢⎢⎢⎢⎢⎢⎢⎢⎢⎢⎢⎢⎢⎢⎢⎢⎢⎢⎢⎢⎢⎢⎢⎢⎢⎢⎢⎢⎣
⎤⎥⎥⎥⎥⎥⎥⎥⎥⎥⎥⎥⎥⎥⎥⎥⎥⎥⎥⎥⎥⎥⎥⎥⎥⎥⎥⎥⎥⎥⎥⎥⎥⎥⎥⎥⎥⎥⎥⎥⎥⎥⎥⎥⎥⎥⎥⎥⎥⎥⎥⎥⎥⎥⎥⎥⎥⎥⎥⎥⎥⎥⎥⎥⎥⎥⎥⎥⎥⎥⎥⎥⎥⎥⎥⎥⎥⎥⎥⎥⎥⎥⎥⎥⎥⎥⎥⎥⎥⎥⎥⎥⎥⎥⎥⎥⎥⎥⎥⎥⎥⎥⎥⎥⎥⎥⎥⎥⎥⎥⎥⎥⎥⎥⎥⎥⎥⎥⎥⎥⎥⎥⎥⎥⎥⎥⎥⎥⎥⎥⎥⎥⎥⎥⎥⎥⎥⎥⎥⎥⎥⎦
(C5)
Complexity 13
S
0 0 0 007 009 012 012 026 012 019 011 017
0 0 0 007 026 010 007 023 025 010 059 011
0 0 0 013 033 028 013 036 051 029 041 027
014 010 014 0 0 0 0 0 0 006 010 006
011 011 012 0 0 0 0 0 0 006 010 007
002 002 003 0 0 0 0 0 0 001 003 003
006 010 009 0 0 0 0 0 0 004 011 008
007 007 009 0 0 0 0 0 0 003 007 007
002 004 003 0 0 0 0 0 0 002 008 001
040 004 006 002 003 004 004 008 005 0 0 0
011 050 022 005 013 007 005 010 011 0 0 0
007 008 008 013 011 013 021 021 014 0 0 0
⎡⎢⎢⎢⎢⎢⎢⎢⎢⎢⎢⎢⎢⎢⎢⎢⎢⎢⎢⎢⎢⎢⎢⎢⎢⎢⎢⎢⎢⎢⎢⎢⎢⎢⎢⎢⎢⎢⎢⎢⎢⎢⎢⎢⎢⎢⎢⎢⎢⎢⎢⎢⎢⎢⎢⎢⎢⎢⎢⎢⎢⎢⎢⎢⎢⎢⎢⎢⎢⎢⎢⎢⎢⎢⎢⎢⎢⎢⎢⎢⎢⎢⎢⎢⎢⎢⎢⎢⎢⎢⎢⎢⎢⎢⎢⎢⎢⎢⎢⎢⎢⎢⎢⎢⎢⎢⎢⎢⎢⎢⎢⎢⎢⎢⎢⎢⎢⎢⎢⎢⎢⎢⎢⎢⎢⎢⎢⎢⎢⎢⎢⎢⎢⎢⎢⎢⎢⎢⎢⎢⎢⎢⎢⎢⎢⎢⎢⎢⎢⎢⎢⎢⎢⎢⎢⎢⎢⎢⎢⎢⎢⎢⎢⎢⎢⎢⎢⎢⎢⎢⎢⎢⎢⎢⎢⎢⎢⎢⎢⎢⎢⎢⎢⎢⎢⎢⎢⎢⎢⎢⎢⎢⎣
⎤⎥⎥⎥⎥⎥⎥⎥⎥⎥⎥⎥⎥⎥⎥⎥⎥⎥⎥⎥⎥⎥⎥⎥⎥⎥⎥⎥⎥⎥⎥⎥⎥⎥⎥⎥⎥⎥⎥⎥⎥⎥⎥⎥⎥⎥⎥⎥⎥⎥⎥⎥⎥⎥⎥⎥⎥⎥⎥⎥⎥⎥⎥⎥⎥⎥⎥⎥⎥⎥⎥⎥⎥⎥⎥⎥⎥⎥⎥⎥⎥⎥⎥⎥⎥⎥⎥⎥⎥⎥⎥⎥⎥⎥⎥⎥⎥⎥⎥⎥⎥⎥⎥⎥⎥⎥⎥⎥⎥⎥⎥⎥⎥⎥⎥⎥⎥⎥⎥⎥⎥⎥⎥⎥⎥⎥⎥⎥⎥⎥⎥⎥⎥⎥⎥⎥⎥⎥⎥⎥⎥⎥⎥⎥⎥⎥⎥⎥⎥⎥⎥⎥⎥⎥⎥⎥⎥⎥⎥⎥⎥⎥⎥⎥⎥⎥⎥⎥⎥⎥⎥⎥⎥⎥⎥⎥⎥⎥⎥⎥⎥⎥⎥⎥⎥⎥⎥⎥⎥⎥⎥⎥⎦
(C6)
Sd
0 0 0 006 007 011 011 024 009 017 008 016
0 0 0 006 021 008 005 018 019 007 050 008
0 0 0 011 029 025 011 030 046 025 032 023
013 009 013 0 0 0 0 0 0 006 009 006
010 010 011 0 0 0 0 0 0 006 009 006
002 002 003 0 0 0 0 0 0 001 003 003
006 009 008 0 0 0 0 0 0 004 010 008
007 006 008 0 0 0 0 0 0 003 006 006
002 004 003 0 0 0 0 0 0 002 008 001
038 002 005 002 002 003 003 007 004 0 0 0
008 043 019 004 011 005 003 008 009 0 0 0
005 005 007 012 010 012 020 020 013 0 0 0
⎡⎢⎢⎢⎢⎢⎢⎢⎢⎢⎢⎢⎢⎢⎢⎢⎢⎢⎢⎢⎢⎢⎢⎢⎢⎢⎢⎢⎢⎢⎢⎢⎢⎢⎢⎢⎢⎢⎢⎢⎢⎢⎢⎢⎢⎢⎢⎢⎢⎢⎢⎢⎢⎢⎢⎢⎢⎢⎢⎢⎢⎢⎢⎢⎢⎢⎢⎢⎢⎢⎢⎢⎢⎢⎢⎢⎢⎢⎢⎢⎢⎢⎢⎢⎢⎢⎢⎢⎢⎢⎢⎢⎢⎢⎢⎢⎢⎢⎢⎢⎢⎢⎢⎢⎢⎢⎢⎢⎢⎢⎢⎢⎢⎢⎢⎢⎢⎢⎢⎢⎢⎢⎢⎢⎢⎢⎢⎢⎢⎢⎢⎢⎢⎢⎢⎢⎢⎢⎢⎢⎢⎢⎢⎢⎢⎢⎢⎢⎢⎢⎢⎢⎢⎢⎢⎢⎢⎢⎢⎢⎢⎢⎢⎢⎢⎢⎢⎢⎢⎢⎢⎢⎢⎢⎢⎢⎢⎢⎢⎢⎢⎢⎢⎢⎢⎢⎢⎢⎢⎢⎢⎢⎣
⎤⎥⎥⎥⎥⎥⎥⎥⎥⎥⎥⎥⎥⎥⎥⎥⎥⎥⎥⎥⎥⎥⎥⎥⎥⎥⎥⎥⎥⎥⎥⎥⎥⎥⎥⎥⎥⎥⎥⎥⎥⎥⎥⎥⎥⎥⎥⎥⎥⎥⎥⎥⎥⎥⎥⎥⎥⎥⎥⎥⎥⎥⎥⎥⎥⎥⎥⎥⎥⎥⎥⎥⎥⎥⎥⎥⎥⎥⎥⎥⎥⎥⎥⎥⎥⎥⎥⎥⎥⎥⎥⎥⎥⎥⎥⎥⎥⎥⎥⎥⎥⎥⎥⎥⎥⎥⎥⎥⎥⎥⎥⎥⎥⎥⎥⎥⎥⎥⎥⎥⎥⎥⎥⎥⎥⎥⎥⎥⎥⎥⎥⎥⎥⎥⎥⎥⎥⎥⎥⎥⎥⎥⎥⎥⎥⎥⎥⎥⎥⎥⎥⎥⎥⎥⎥⎥⎥⎥⎥⎥⎥⎥⎥⎥⎥⎥⎥⎥⎥⎥⎥⎥⎥⎥⎥⎥⎥⎥⎥⎥⎥⎥⎥⎥⎥⎥⎥⎥⎥⎥⎥⎥⎦
(C7)
Si
0 0 0 001 002 001 001 003 002 002 003 0020 0 0 002 005 003 002 005 005 003 009 0030 0 0 002 005 003 002 006 006 004 008 004
001 001 001 0 0 0 0 0 0 000 001 001001 001 001 0 0 0 0 0 0 000 001 001000 000 000 0 0 0 0 0 0 000 000 000001 001 001 0 0 0 0 0 0 000 001 001001 001 001 0 0 0 0 0 0 000 001 001000 000 000 0 0 0 0 0 0 000 000 000002 002 001 001 001 001 001 001 001 0 0 0003 007 003 001 002 001 001 002 002 0 0 0002 003 001 001 001 001 001 001 001 0 0 0
⎡⎢⎢⎢⎢⎢⎢⎢⎢⎢⎢⎢⎢⎢⎢⎢⎢⎢⎢⎢⎢⎢⎢⎢⎢⎢⎢⎢⎢⎢⎢⎢⎢⎢⎢⎢⎢⎢⎢⎢⎢⎢⎢⎢⎢⎢⎢⎢⎢⎢⎢⎢⎢⎢⎢⎢⎢⎢⎢⎢⎢⎢⎢⎢⎢⎢⎢⎢⎢⎢⎢⎢⎢⎢⎢⎢⎢⎢⎢⎢⎢⎢⎢⎢⎢⎢⎢⎢⎢⎢⎢⎢⎢⎢⎢⎢⎢⎢⎢⎢⎢⎢⎢⎢⎢⎢⎢⎢⎢⎢⎢⎢⎢⎢⎢⎢⎢⎢⎢⎢⎢⎢⎢⎢⎢⎢⎢⎢⎢⎢⎢⎢⎢⎢⎢⎢⎢⎢⎢⎢⎢⎣
⎤⎥⎥⎥⎥⎥⎥⎥⎥⎥⎥⎥⎥⎥⎥⎥⎥⎥⎥⎥⎥⎥⎥⎥⎥⎥⎥⎥⎥⎥⎥⎥⎥⎥⎥⎥⎥⎥⎥⎥⎥⎥⎥⎥⎥⎥⎥⎥⎥⎥⎥⎥⎥⎥⎥⎥⎥⎥⎥⎥⎥⎥⎥⎥⎥⎥⎥⎥⎥⎥⎥⎥⎥⎥⎥⎥⎥⎥⎥⎥⎥⎥⎥⎥⎥⎥⎥⎥⎥⎥⎥⎥⎥⎥⎥⎥⎥⎥⎥⎥⎥⎥⎥⎥⎥⎥⎥⎥⎥⎥⎥⎥⎥⎥⎥⎥⎥⎥⎥⎥⎥⎥⎥⎥⎥⎥⎥⎥⎥⎥⎥⎥⎥⎥⎥⎥⎥⎥⎥⎥⎥⎦
(C8)
14 Complexity
F
009 006 006 0 0 0 0 0 0 0 0 0010 024 013 0 0 0 0 0 0 0 0 0017 019 014 0 0 0 0 0 0 0 0 00 0 0 002 004 003 002 005 005 0 0 00 0 0 002 004 003 002 005 005 0 0 00 0 0 001 001 001 001 001 001 0 0 00 0 0 002 003 002 002 004 004 0 0 00 0 0 001 003 002 002 004 003 0 0 00 0 0 000 001 001 001 001 001 0 0 00 0 0 0 0 0 0 0 0 005 004 0050 0 0 0 0 0 0 0 0 005 019 0050 0 0 0 0 0 0 0 0 003 006 004
⎡⎢⎢⎢⎢⎢⎢⎢⎢⎢⎢⎢⎢⎢⎢⎢⎢⎢⎢⎢⎢⎢⎢⎢⎢⎢⎢⎢⎢⎢⎢⎢⎢⎢⎢⎢⎢⎢⎢⎢⎢⎢⎢⎢⎢⎢⎢⎢⎢⎢⎢⎢⎢⎢⎢⎢⎢⎢⎢⎢⎢⎢⎢⎢⎢⎢⎢⎢⎢⎢⎢⎢⎢⎢⎢⎢⎢⎢⎢⎢⎢⎢⎢⎢⎢⎢⎢⎢⎢⎢⎢⎢⎢⎢⎢⎢⎢⎢⎢⎢⎢⎢⎢⎢⎢⎢⎢⎢⎢⎢⎢⎢⎢⎢⎢⎢⎢⎢⎢⎢⎢⎢⎢⎢⎢⎢⎢⎢⎢⎢⎢⎢⎢⎢⎢⎢⎢⎢⎢⎢⎢⎣
⎤⎥⎥⎥⎥⎥⎥⎥⎥⎥⎥⎥⎥⎥⎥⎥⎥⎥⎥⎥⎥⎥⎥⎥⎥⎥⎥⎥⎥⎥⎥⎥⎥⎥⎥⎥⎥⎥⎥⎥⎥⎥⎥⎥⎥⎥⎥⎥⎥⎥⎥⎥⎥⎥⎥⎥⎥⎥⎥⎥⎥⎥⎥⎥⎥⎥⎥⎥⎥⎥⎥⎥⎥⎥⎥⎥⎥⎥⎥⎥⎥⎥⎥⎥⎥⎥⎥⎥⎥⎥⎥⎥⎥⎥⎥⎥⎥⎥⎥⎥⎥⎥⎥⎥⎥⎥⎥⎥⎥⎥⎥⎥⎥⎥⎥⎥⎥⎥⎥⎥⎥⎥⎥⎥⎥⎥⎥⎥⎥⎥⎥⎥⎥⎥⎥⎥⎥⎥⎥⎥⎥⎦
(C9)
Data Availability
+e data used to support the findings of this study are in-cluded within the article
Conflicts of Interest
+e authors declare that they have no conflicts of interest
Acknowledgments
+e authors would like to thank the research team oneconomic systems engineering in Zhejiang Economic In-formation Center for their great and sincere help +is workwas supported by the Project in 2020 of Zhejiang ProvincialSoft Science Research of China (2020C35009) and theProject in 2019 of Zhejiang Provincial Social ScienceFoundation of China (19NDQN368YB)
References
[1] A Hirschman 2e Strategy of Economic Development YaleUniversity Press New Haven CT USA 1958
[2] R Banga and B Goldar ldquoContribution of services to outputgrowth and productivity in Indian manufacturing pre-andpost-reformsrdquo Economic and Political Weekly vol 42 no 26pp 2769ndash2777 2007
[3] J Francois and J Woerz ldquoProducer services manufacturinglinkages and traderdquo Journal of Industry Competition andTrade vol 8 no 3-4 pp 199ndash229 2008
[4] S Ke M He and C Yuan ldquoSynergy and co-agglomeration ofproducer services and manufacturing a panel data analysis ofChinese citiesrdquo Regional Studies vol 48 no 11pp 1829ndash1841 2014
[5] L Kong and X Liang ldquoResearch on the interaction betweenproducer services and manufacturing industry in ShaanxiProvincerdquo American Journal of Industrial and BusinessManagement vol 8 no 5 pp 1277ndash1289 2018
[6] W W Leontief ldquoQuantitative input and output relations inthe economic systems of the United Statesrdquo 2e Review ofEconomics and Statistics vol 18 no 3 pp 105ndash125 1936
[7] P Guerrieri and V Meliciani ldquoTechnology and internationalcompetitiveness the interdependence between
manufacturing and producer servicesrdquo Structural Change andEconomic Dynamics vol 16 no 4 pp 489ndash502 2005
[8] R-H Chiu and Y-C Lin ldquo+e inter-industrial linkage ofmaritime sector in Taiwan an input-output analysisrdquo AppliedEconomics Letters vol 19 no 4 pp 337ndash343 2012
[9] E Mattioli and G R Lamonica ldquo+e ICT role in the Wordeconomy an input-output analysisrdquo Journal of World Eco-nomic Research vol 2 no 2 pp 20ndash25 2013
[10] B R Khanal C Gan and S Becken ldquoTourism inter-industrylinkages in the Lao PDR economy an input-output analysisrdquoTourism Economics vol 20 no 1 pp 171ndash194 2014
[11] A-I Guerra and F Sancho ldquoMeasuring energy linkages withthe hypothetical extraction method an application to SpainrdquoEnergy Economics vol 32 no 4 pp 831ndash837 2010
[12] M J Sajid N Shahni and M Ali ldquoCalculating inter-sectoralcarbon flows of a mining sector via hypothetical extractionmethodrdquo Journal of Mining and Environment vol 10 no 4pp 853ndash867 2019
[13] M J Sajid Q Cao and W Kang ldquoTransport sector carbonlinkages of EUrsquos top seven emittersrdquo Transport Policy vol 80pp 24ndash38 May 2019
[14] Y Wang N Lai G Mao et al ldquoAir pollutant emissions fromeconomic sectors in China a linkage analysisrdquo EcologicalIndicators vol 77 pp 250ndash260 2017
[15] Y Wang H Liu G Mao J Zuo and J Ma ldquoInter-regionaland sectoral linkage analysis of air pollution in Beijing-Tianjin-Hebei (Jing-Jin-Ji) urban agglomeration of ChinardquoJournal of Cleaner Production vol 165 pp 1436ndash1444 2017
[16] Y Ali M Sabir and N Muhammad ldquoA comparative input-output analysis of the construction sector in three developingeconomies of South Asiardquo Construction Management andEconomics vol 37 no 11 pp 643ndash658 2019
[17] I Drejer ldquoInput-Output based measures of interindustrylinkages revisitedndashA survey and discussionrdquo in Proceedings ofthe 14th International Conference on Input-OutputTechniques Montreal Canada October 2002
[18] H B Chenery and T Watanabe ldquoInternational comparisonsof the structure of productionrdquo Econometrica vol 26 no 4pp 487ndash521 1958
[19] P N Rasmussen Studies in Inter-sectoral Relations E HarckCopenhagen Denmark 1956
[20] L P Jones ldquo+e measurement of hirschmanian linkagesrdquo2eQuarterly Journal of Economics vol 90 no 2 pp 323ndash3331976
Complexity 15
[21] F A Cuello F Mansouri and G J D Hewings ldquo+eidentification of structure at the sectoral level a reformulationof the hirschman-rasmussen key sector indicesrdquo EconomicSystems Research vol 4 no 4 pp 285ndash296 1992
[22] B R Hazari ldquoEmpirical identification of key sectors in theIndian economyrdquo 2e Review of Economics and Statisticsvol 52 no 3 pp 301ndash305 1970
[23] P S Laumas ldquoAn international comparison of the structure ofproductionrdquo Economia Internazionale vol 29 no 1-2pp 2ndash13 1976
[24] G Strassert ldquoZur bestimmung strategischer sektoren mit hilfevon input-output modellenrdquo Jahrbucher fur Natio-nalokonomie und Statistik vol 182 pp 211ndash215 1968 (InGerman)
[25] S Schultz ldquoApproaches to identifying key sectors empiricallyby means of input-output analysisrdquo 2e Journal of Develop-ment Studies vol 14 no 1 pp 77ndash96 1977
[26] G Cella ldquo+e input-output measurement of interindustrylinkagesrdquo Oxford Bulletin of Economics and Statistics vol 46no 1 pp 73ndash84 1984
[27] R Duarte J Sanchez-Choliz and J Bielsa ldquoWater use in theSpanish economy an input-output approachrdquo EcologicalEconomics vol 43 no 1 pp 71ndash85 2002
[28] M J Sajid X Li and Q Cao ldquoDemand and supply-sidecarbon linkages of Turkish economy using hypothetical ex-traction methodrdquo Journal of Cleaner Production vol 228pp 264ndash275 2019
[29] M S Silva and T P de Lima ldquoLooking for nonnegativesolutions of a Leontief dynamic modelrdquo Linear Algebra andIts Applications vol 364 pp 281ndash316 2003
[30] H D Kurz and N Salvadori ldquo+e dynamic Leontief modeland the theory of endogenous growthrdquo Economic SystemsResearch vol 12 no 2 pp 255ndash265 2010
[31] A Rose ldquoInput-output economics and computable generalequilibrium modelsrdquo Structural Change and Economic Dy-namics vol 6 no 3 pp 295ndash304 1995
[32] Q-X Li and S-F Liu ldquo+e foundation of the grey matrix andthe grey input-output analysisrdquo Applied MathematicalModelling vol 32 no 3 pp 267ndash291 2008
[33] A Tukker and E Dietzenbacher ldquoGlobal multiregional input-output frameworks an introduction and outlookrdquo EconomicSystems Research vol 25 no 1 pp 1ndash19 2013
[34] G E Halkos and K D Tsilika ldquoA new vision of classicalmulti-regional inputndashoutput modelsrdquo Computational Eco-nomics vol 51 no 3 pp 1ndash24 2018
[35] R E Miller ldquoInterregional feedback effects in input-outputmodels some preliminary resultsrdquo Papers of the RegionalScience Association vol 17 no 1 pp 105ndash125 1966
[36] J I Round ldquoDecomposing multipliers for economic systemsinvolving regional and world traderdquo 2e Economic Journalvol 95 no 378 pp 383ndash399 1985
[37] M Sonis J Oosterhaven and G J D Hewings ldquoSpatialeconomic structure and structural changes in the EC feed-back loop input-output analysisrdquo Economic Systems Researchvol 5 no 2 pp 173ndash184 1993
[38] E Dietzenbacher ldquoInterregional multipliers looking back-ward looking forwardrdquo Regional Studies vol 36 no 2pp 125ndash136 2002
[39] R E Miller and P D Blair Input-Output Analysis Foun-dation and Extension Cambridge University Press Cam-bridge UK 2nd edition 2009
[40] B Meng and C Qu ldquoApplication of the input-output de-composition technique to Chinarsquos regional economicsrdquo IDEDiscussion Papers vol 102 2007
[41] J Oosterhaven D Stelder and S Inomata ldquoEvaluation ofnon-survey international IO construct ion methods with theasian-pacific input-output tablerdquo IDE Discussion Papersvol 114 2007
16 Complexity
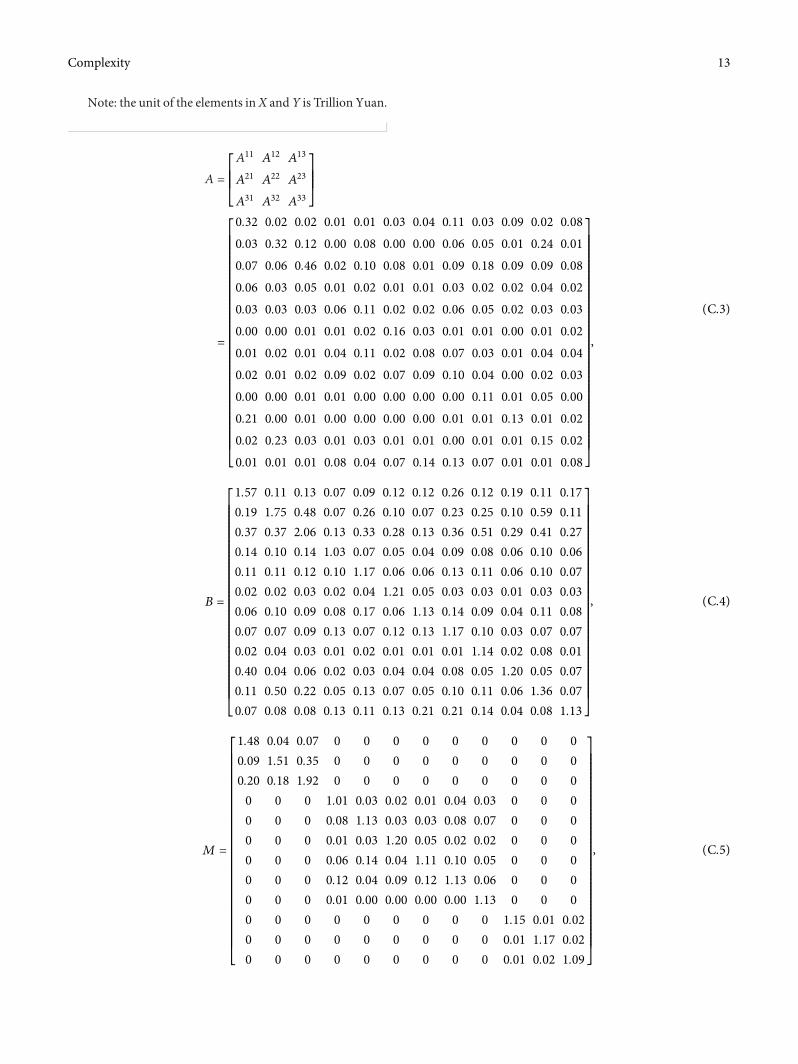