Embed Size (px)
Citation preview
1
A New Method for Correlating Rock Strength to Indentation Tests
M. Haftania*, B. Bohlolia, M. Moosavib, A. Nouric, M. Moradid, M.R. Maleki Javana a Department of Tectonics and Engineering Geology, School of Geology, College of Science, University of
Tehran, Iran.
b Department of Rock Mechanics, School of Mining Engineering, University of Tehran, Tehran, Iran.
c Department of Civil and Environmental Engineering, University of Alberta, Canada.
d School of Civil Engineering, University of Tehran, Iran.
Abstract
In this Paper, UCS of limestone rock was determined by indentation testing on rock fragments. The size of the
fragments was in the range of 2 to 5 mm, which is within the size range of drill cuttings. Here, scatter of the data
was investigated by calculating the coefficient of variation that showed the size dependency of the conventional
indentation parameters; Indentation Modulus (IM) and Critical Transition Force (CTF). Thus, it is recommended
that the results of indentation tests should be normalized by the fragment size and presented in the form of
Normalized Indentation Modulus (IMn) and Normalized Critical Transition Force (CTFn). Regression analysis
was carried out to show the relationship between the IMn or CTFn and the UCS. Linear and exponential
regression provided reasonable correlation coefficients of higher than 0.74 and 0.85, respectively. The proposed
empirical equations for estimation of the intact rock UCS from the normalized indentation indices were verified
using independent data from limestone rocks not used in developing the correlations. The outcome was a strong
agreement (R~1.00) between the estimated and measured UCS. Based on statistical analysis, minimum number
of indentation test was determined for random size samples. It is suggested that indentation testing be carried out
using uniform fragment sizes to reduce the required number of indentation tests.
Key words: Drill Cuttings, Indentation Test, Normalized Critical Transition Force, Normalized Indentation
Modulus, Rock Fragments, Mechanical Testing, Uniaxial Compressive Strength, Wellbore Geomechanics.
1. Introduction
Mechanical properties of rocks, especially the UCS and E, have significant impact on the
design of rock engineering projects (Santarelli et al., 1996; Uboldi et al., 1999; Holt et al.,
* Corresponding Author:
Mohammad Haftani, (E-mail Address: [email protected] and [email protected])
(M.Haftani: Currently Visiting Researcher at the University of Alberta)
Postal Address: Department of Tectonics and Engineering Geology, School of Geology, College of Science,
University of Tehran, Enghelab St., Tehran, Iran (Tel. & Fax: +98 21 66 49 16 23)

2
2005; Mateus et al., 2007 and Garcia et al., 2008). Investigations carried out by Jaramillo
(2004) show that UCS of formations has the highest influence on wellbore stability compared
to other factors such as azimuth, slope, exposure time and even mud weight.
Conventionally, two well-known techniques are used to obtain rock mechanical properties: a)
standard laboratory tests on rock cores, e.g. ASTM 1984 or ISRM 1979, and b) acoustic well
log interpretation combined with lithological analysis of formation (Fjar, 1999 and Mateus et
al., 2007).
Although these methods are reliable for obtaining rock strength, practical limitations such as
the costs involved, unavailability of rock cores and well logs in some intervals and the time
required for delivery of results make them restricted (Zausa and Santarelli 1995; Santarelli et
al., 1996; Holt et al., 2000; Chang, 2004 and Chang et al., 2006). Such limitations have led to
the development of nonconventional techniques and procedures to achieve mechanical
properties of formations encountered during drilling. Some of these techniques are listed
below:
- Empirical correlations between rock mechanical properties and easily obtainable and
reliably measured parameters such as porosity and density (Plumb, 1994 and Horsrud,
2001),
- Measurement of P and S wave velocities by Pulsed Ultrasonic on Cuttings (PUC)
(Santarelli et al., 1996) and Continuous Wave Technique (CWT) (Nes et al., 1998),
- Laboratory test on reconstructed core from rock cuttings (Mehrabi Mazidi et al.,
2012),
- Correlation between mineralogical or textural characteristics and mechanical
properties (Tugrul and Zarif, 1999; Kekec et al., 2006 and Zorlu et al., 2008), and
3
- Indentation test on drill cuttings as a laboratory technique (Thiercelin and Cook, 1988;
Cook and Thiercelin, 1989; Thiercelin, 1989; Suarez-Rivera et al., 1990; Suarez-
Rivera et al., 1991 and Santarelli et al., 1996).
The laboratory indentation test uses small rock fragments in the range of 2 to 5 mm. In this
technique, the resistance of rock fragments against the penetration of an indenter is measured
and these measurements are used in empirical correlations to determine the rock UCS.
This paper presents a new method for interpretation of indentation test results that leads to a
new correlation between the normalized parameters of Indentation Modulus (IMn) and
Critical Transition Force (CTFn) with UCS. Statistical approaches are used to examine the
size dependency of the indentation parameters and to determine the minimum numbers of
tests required for a statistically reliable analysis. The test results showed the size dependency
of the conventional indentation parameters and the higher number of tests required when
using random size rock fragments compared to uniform size fragments. To minimize the size
dependency and required number of tests, we recommend using normalized indentation
indices for determining the UCS and doing indentation test on fragments of approximately the
same size.
2. Methodology
2.1 Sample preparation
A total of 9 limestone boulders were collected from various types of limestone from
outcropped rocks of Iranian oil fields. Boulders S1 through S6 (UCS from 280 MPa for S1 to
30 MPa for S6) were used to develop the correlations and boulders S7, S8 and S9 (UCS
between 80 and 250 MPa) were used to verify the accuracy of the correlations.
A number of core plugs were drilled out of the samples for conventional UCS testing (see
Table 1). The rest of the boulders were used for producing artificial rock cuttings in a crusher
machine that produced rock fragments similar in shape and size to drill cuttings. Particles
4
with sizes between 2 and 5 mm were selected for the indentation testing. Small rock
fragments were embedded in epoxy-resin, composed of resin epoxy bisphenol and polyamine
hardener, to provide the confinement needed during the testing. The samples were disk
shaped with 55 mm diameter and 10 mm thickness (Fig. 1a). After curing the resin disk, the
disk was trimmed and polished to expose sufficient number of rock fragments, e.g., 30-40
pieces hereafter named a specimen group, for indentation testing (Fig. 1a).
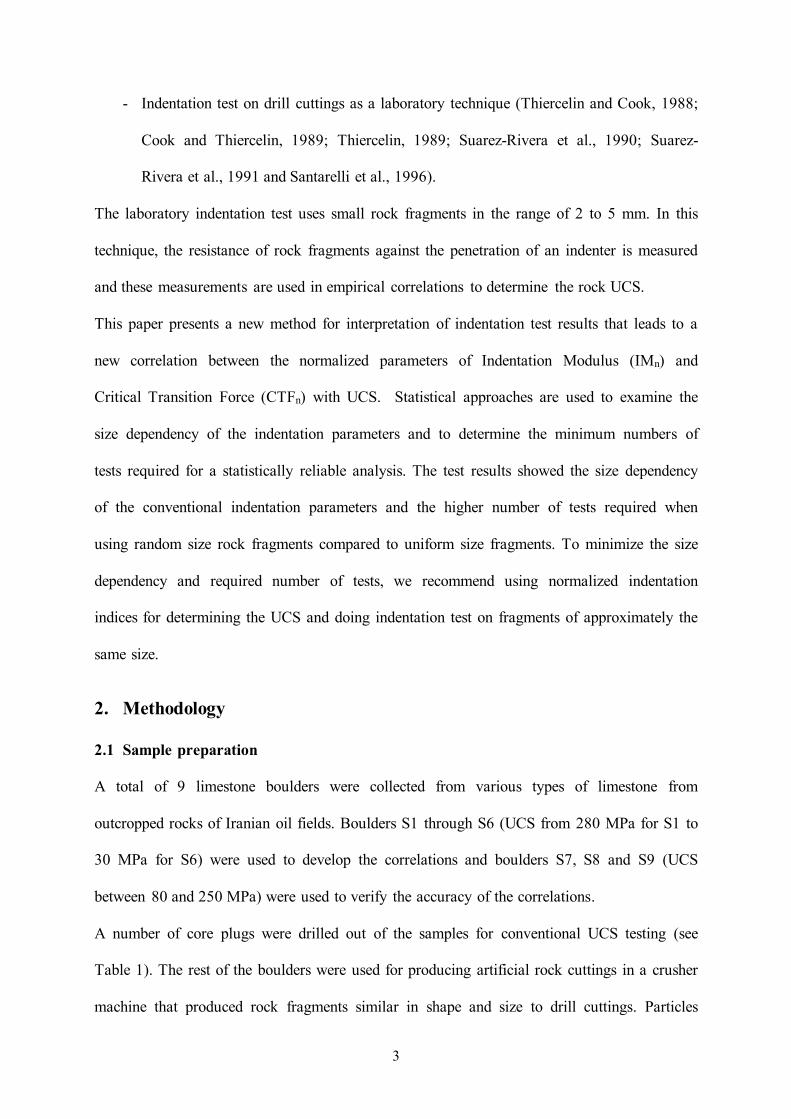
Table 1: Physical and mechanical characteristics of the samples.
Sample
No. Lithology
Rock Density
(g/cm3)
Porosity
(%)
UCS
(MPa)
S1 Micritic Limestone 2.59 2.25 279.76
S2 Micritic Limestone 2.64 2.62 230.39
S3 Micritic Limestone 2.73 < 0.1 182.49
S4 Siliceous limestone 2.65 0.91 129.73
S5 Siliceous limestone 2.64 0.93 124.39
S6 Marly Limestone 2.43 9.64 31.50
S7 Micritic Limestone 2.72 1.16 246.32
S8 Micritic Limestone 2.63 6.06 178.45
S9 Siliceous limestone 2.64 1.07 82.89
Note: Samples S1 to S6 were utilized to evaluate the indentation test results and
samples S7 to S9 were used to verify the accuracy of the proposed equations.
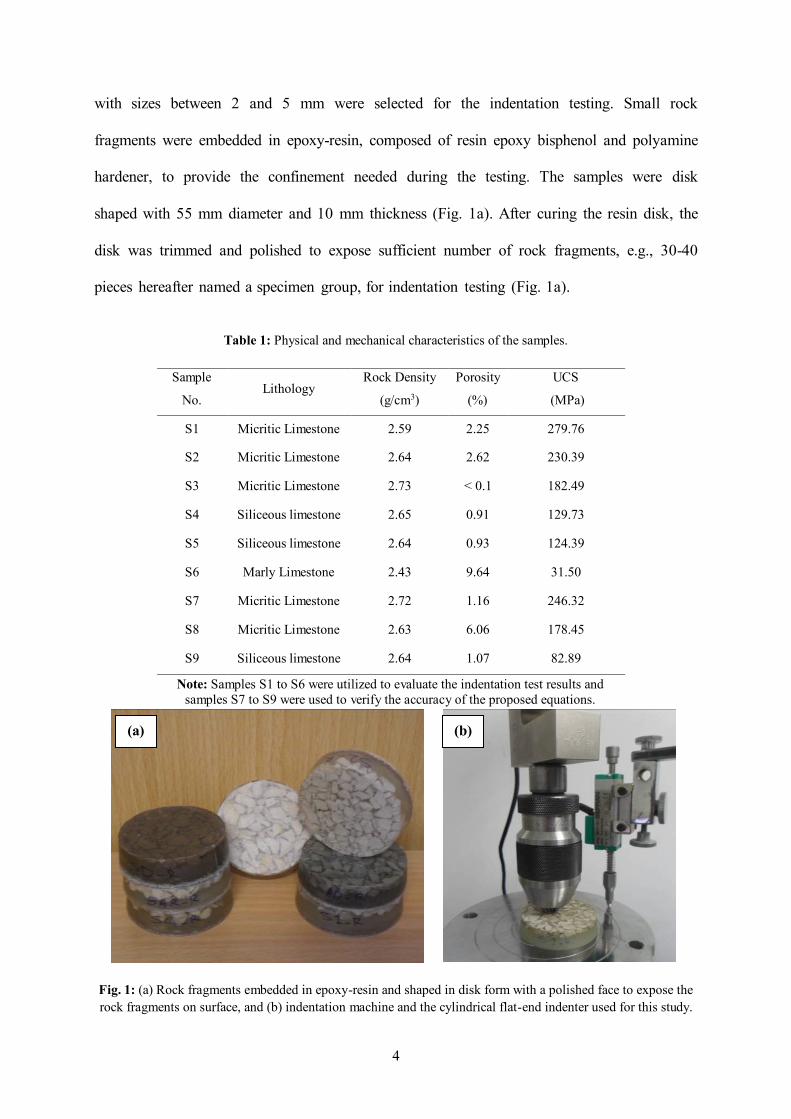
Fig. 1: (a) Rock fragments embedded in epoxy-resin and shaped in disk form with a polished face to expose the
rock fragments on surface, and (b) indentation machine and the cylindrical flat-end indenter used for this study.
(a) (b)

5
2.2 Testing method and analysis
Indentation test measures the force and displacement of an indenter while penetrating into a
rock fragment until it breaks apart. A cylindrical flat-end indenter stylus with the diameter of
1 mm was used in this work. It was made of tungsten carbide with ASTM hardness of 91
Rockwell B. The applied force and penetration rate were measured during the testing by a
load cell and a displacement sensor, respectively (Fig. 1b). A constant penetration rate of 0.01
mm/sec was applied on rock fragment until failure occurred (similar to the rate applied by
Mateus et al., 2007; Garcia et al., 2008).
The results are shown in the form of load versus penetration, similar to the conventional
stress-strain curves. A typical curve, illustrated by Garcia et al. (2008), is presented in Fig. 2.
Conventionally, two main indices are derived from the indentation curve: Indentation
Modulus (IM) and Critical Transition Force (CTF). Indentation modulus (analogous to elastic
modulus) is obtained from the slope of the linear part of the curve and is defined as the
resistance of rock against penetration of the indenter. The critical transition force is the load
level beyond which softening behavior is observed.
Fig. 2: Typical load-penetration curve from indentation testing with IM and CTF identified on the curve. After
Garcia et al. (2008).

6
In Section 3.1, the results of the conventional indentation indices are presented which indicate
size dependency of the results. The indentation indices were normalized to decrease the size
dependency of the indices when testing samples containing fragments of different sizes.
An arithmetical average value for normalized indentation indices (IMn and CTFn) was
calculated for each specimen group, which consisted of a total of N fragments (30-40
fragments in our tests) as follows:
N
N
ii
i
n
i ICOCIM
IM
1
(1)
N
ii
i
n
N
i ICOCCTF
CTF
1
(2)
Where IMi and CTFi are the conventional indentation indices for fragment i, OCi is the
diameter of the smallest circle circumscribed about Fragment i and ICi is the diameter of the
circle inscribed in the same fragment. Finally, normalized indentation indices of the samples
were correlated with the uniaxial compressive strength from core testing of the same rock
type.
2.3 Statistical concepts
A statistical analysis was performed to determine the minimum number of rock fragments
required for a reliable assessment of the indentation indices and to allow the size dependency
analysis.
The number of data points required for determining a mean representative value in rock
mechanical problems is a function of sample heterogeneity, sample sizes and scatter of the
results. Gill et al. (2005) utilized the small sampling theory and presented a statistical
procedure to obtain the minimum number of specimens as observation points for
determination of the representative values of the rock mechanical characteristics. Based on the
small sampling theory, the observed coefficient of variation after testing (CVob), the

7
reasonable precision index and the confidence interval have major effect on the minimum
number of specimens. The CVob is calculated as the ratio of sample standard deviation
relative to the arithmetic mean value (S) to the average value of the arithmetic sample
mean X( ) , expressed in percentage:
100X
SCV ob (3)
An advantage of the coefficient of variation is its independency on the units of measurement.
The other important factor for determining the minimum number of samples is the precision
index (p) which is defined as the ratio of the upper to lower bound of the population mean as
estimated for a specimen group:
1
1
N
SX
N
SX
p
t
t
, p≥1 (4)
where S is standard deviation, X is arithmetic average value and tβ represents the confidence
coefficient obtained from the Student t distribution which is a function of the number of
degrees of freedom (N-1) that in turn is a function of sample size N in the final calculation.
Combination of Eqs. (3) and (4) gives the required number of tests (N) for a statistically
significant mean value which will guarantee a given precision index (p) for a specified
confidence interval:
1
1001
12
CVt
p
p obN
(5)
The numbers of required specimens for determination of the representative value as a function
of precision indices (1.20 ≤ p ≤ 1.60) and coefficients of variation for a 95% confidence
interval are presented in Table 2.

8
Table 2: The number of required samples based on the precision index and coefficient of variation with 95%
confidence interval (Gill et al., 2005).
CVob (%) p ≤
1.6 1.5 1.4 1.35 1.3 1.2
35 13 16 21 25 31 61
30 10 12 16 19 24 46
25 8 10 12 15 18 33
20 6 7 9 11 13 22
15 5 6 7 8 9 14
10 4 4 5 5 6 8
5 3 3 3 4 4 5
Gill et al. (2005) suggested different p values depending on the investigation/project
importance; p ≤ 1.35 for long-life mining structures and civil engineering works and p ≤ 1.20
for important underground excavation and research work. Protodyakonov (1960 and 1969)
and Vutukuri et al. (1974) recommended p ≤ 1.50 as the best value for determining the
number of required samples for laboratory investigations. Generally, Spiegel (1961)
suggested 30 observation points for finding a reliable mean value for laboratory
investigations.
For the indentation test, different researchers suggested different number of indentation tests
in order to compute an average value; Santarelli et al. (1996) recommended a series of five
indentation tests, Mateus et al. (2007) suggested an average value of 10-15 for sandstone
samples and Garcia et al. (2008) showed that a minimum of 25 indentation tests were
necessary for shale samples.
3. Results and Discussion
3.1 Test results and statistical analysis
A total of about 220 indentation tests were carried out on 6 specimen groups of limestones,
each containing around 35 rock fragments. Macroscopic and microscopic residual imprints of
the indenter and post failure fractures are presented in Fig. 3. The indentation modulus (IM)

9
and critical transition force (CTF) were extracted from the load-penetration curves of the
indentation tests. The average conventional indentation indices were calculated from the
results of all indentation tests for each sample and the corresponding coefficient of variations
(CVob) were calculated to determine the dispersion of the indentation parameter in each
specimen group (Table 3). The results showed that:
- IM varied from 2425 N/mm for Sample S6 to 4433 N/mm for Sample S2,
- CTF was between 290 N and 990 N for Samples S6 and S3, respectively,
- CVob of IM and CTF were in the range of 17.61% - 28.11% and 28.62% - 49.97%,
respectively.
- CVob of the IM was less than that of the CTF (see Fig. 4).
The CVob represents the dispersion of the test results for the specimen groups. The high value
of CVob indicates a wide range of variation of the indentation parameter for different size
fragments. Higher values of CVob for the CTF compared to the IM indicate stronger
sensitivity of this parameter to the rock fragment size.
Fig. 3: Macroscopic residual imprint after indentation test on Sample S1 and close-up of four tested fragments.
S1-R-20
S1-R-17
S1-R-6
S1-R-27
S1-R-17
S1-R-27
S1-R-6
S1-R-20
10
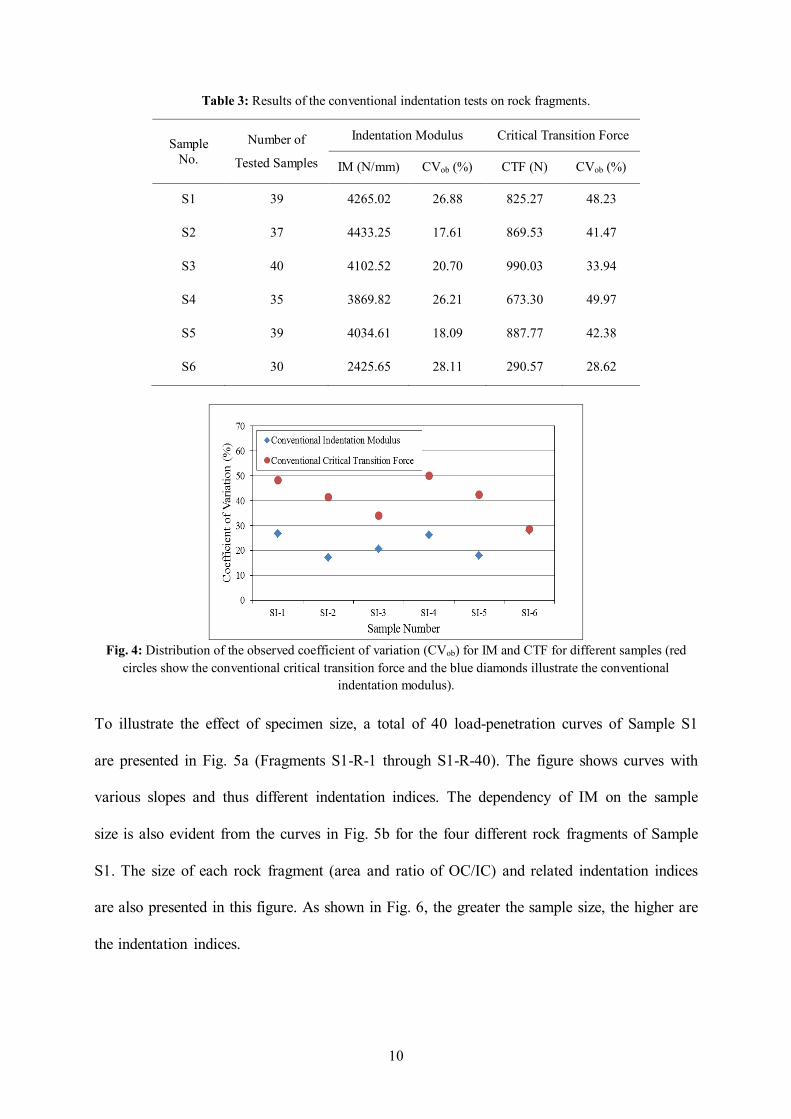
Table 3: Results of the conventional indentation tests on rock fragments.
Sample
No.
Number of
Tested Samples
Indentation Modulus Critical Transition Force
IM (N/mm) CVob (%) CTF (N) CVob (%)
S1 39 4265.02 26.88 825.27 48.23
S2 37 4433.25 17.61 869.53 41.47
S3 40 4102.52 20.70 990.03 33.94
S4 35 3869.82 26.21 673.30 49.97
S5 39 4034.61 18.09 887.77 42.38
S6 30 2425.65 28.11 290.57 28.62
Fig. 4: Distribution of the observed coefficient of variation (CVob) for IM and CTF for different samples (red
circles show the conventional critical transition force and the blue diamonds illustrate the conventional
indentation modulus).
To illustrate the effect of specimen size, a total of 40 load-penetration curves of Sample S1
are presented in Fig. 5a (Fragments S1-R-1 through S1-R-40). The figure shows curves with
various slopes and thus different indentation indices. The dependency of IM on the sample
size is also evident from the curves in Fig. 5b for the four different rock fragments of Sample
S1. The size of each rock fragment (area and ratio of OC/IC) and related indentation indices
are also presented in this figure. As shown in Fig. 6, the greater the sample size, the higher are
the indentation indices.

11
The sizes of all fragments in each specimen group were measured and plotted against the
corresponding IM and CTF, which confirmed the size dependency of the indentation indices
(Fig. 6). Linear regressions were developed resulting in correlation coefficients of 0.72 and
0.64 for CTF and IM, respectively. Higher correlation coefficient of the CTF indicates its
higher size sensitivity compared to the IM.
Fig. 5: (a) Load-penetration curves measured during the indentation tests on fragments of Sample S1, and (b)
Load-penetration curves of the rock fragments shown in Fig. 3.
Fig. 6: Sensitivity of the conventional indentation indices to the fragment size for Sample S1.
Statistical approach was used to determine the required number of tests to obtain an
acceptable CVob and a reasonable precision value. Table 3 and Fig. 4 show the CVob ranges
from 29-50% for the critical transition force and from 17-28% for indentation modulus. The
average values of CVob for CTF and IM are 40.8% and 22.9%, respectively. The required
(a) (b)
(a) (b)

12
number of tests can then be estimated as a function of precision indices and coefficients of
variation for a 95% confidence interval using Eq. 5; the results are shown in Table 4.
Table 4: Required number of tests from Eq. (5) according to p value for the investigation importance.
Sample
No.
Number of
Tested
Samples
Indentation Modulus Critical Transition Force
CVob (%)
Required Test Number CVob
(%)
Required Test Number
p≤1.50 a p≤1.35 b p≤1.20 c p≤1.50 a p≤1.35 b p≤1.20 c
S1 39 26.88 8 14 37 48.23 25 44 116
S2 37 17.61 4 7 16 41.47 19 33 87
S3 40 20.70 5 9 22 33.94 13 22 58
S4 35 26.21 8 14 35 49.97 24 42 111
S5 39 18.09 4 7 17 42.38 19 34 90
S6 30 28.11 9 16 41 28.62 10 16 42
a: Protodyakonov (1960, 1969) and Vutukuri et al. (1974) for laboratory investigations.
b: Gill et al. (2005) for long life mining structures and civil engineering works.
c: Gill et al. (2005) for vital underground excavation and research work.
Note that the required number of tests varies in relation to the importance of the
investigations. Larger number of tests is required to achieve a higher precision index. The
number of fragments in this investigation satisfies the p ≤ 1.20 and p ≤ 1.35 for IM and CTF,
respectively. Thus, the number of test specimens in this study, i.e. 35-40 for each specimen
group, provided a representative mean value and guaranteed the accuracy of correlation
between indentation indices and UCS based on small sampling theory (see Table 4).
Regarding to the number of tests carried out in this investigation and guides on p-value, field
applications of the correlation equations were recommended; correlation equations between
IMn and UCS can be applied for all engineering applications while those of the CTFn and
UCS can be used for long-life mining structures and civil engineering projects. All of the
suggested equations are applicable for the laboratory investigations.

13
Generally, possible factors causing scattering of results in a specimen group can be the size of
fragments, heterogeneity, fragment microstructure, diameter and thickness of disk, number of
fragments in a specimen group, and the mechanical properties of resin. The last three
parameters were kept constant in all these tests to minimize their influence on the test results.
The number of fragments in a specimen group can directly influence the indentation
parameters. However, their effects can be minimized when considering a reasonable precision
index based on the project importance. Using statistical methods for determining the required
number of tests, results in a representative population and reliable assessment of the mean
value of indentation parameters. Based on the findings in this investigation, the fragment size
had the greatest effect. Therefore, we suggest normalizing the indentation indices by the
fragment size to reduce the size effect.
3.2 Normalized indentation indices
The obtained IM and CTF were normalized using Eqs. (1) and (2), see Table 5. The mean
normalized indices for each sample were plotted against the corresponding UCS to examine
possible correlations. Different types of regression curves were used and their correlation
coefficients were determined. Ringstad et al. (1998) and Mateus et al. (2007) used a linear
regression while Santarelli (1996) and Zausa et al. (1997) employed exponential function for
similar correlations. We examined both linear and exponential regression types (Fig. 7) and
the correlation equations were obtained as follows:
Linear regression for:
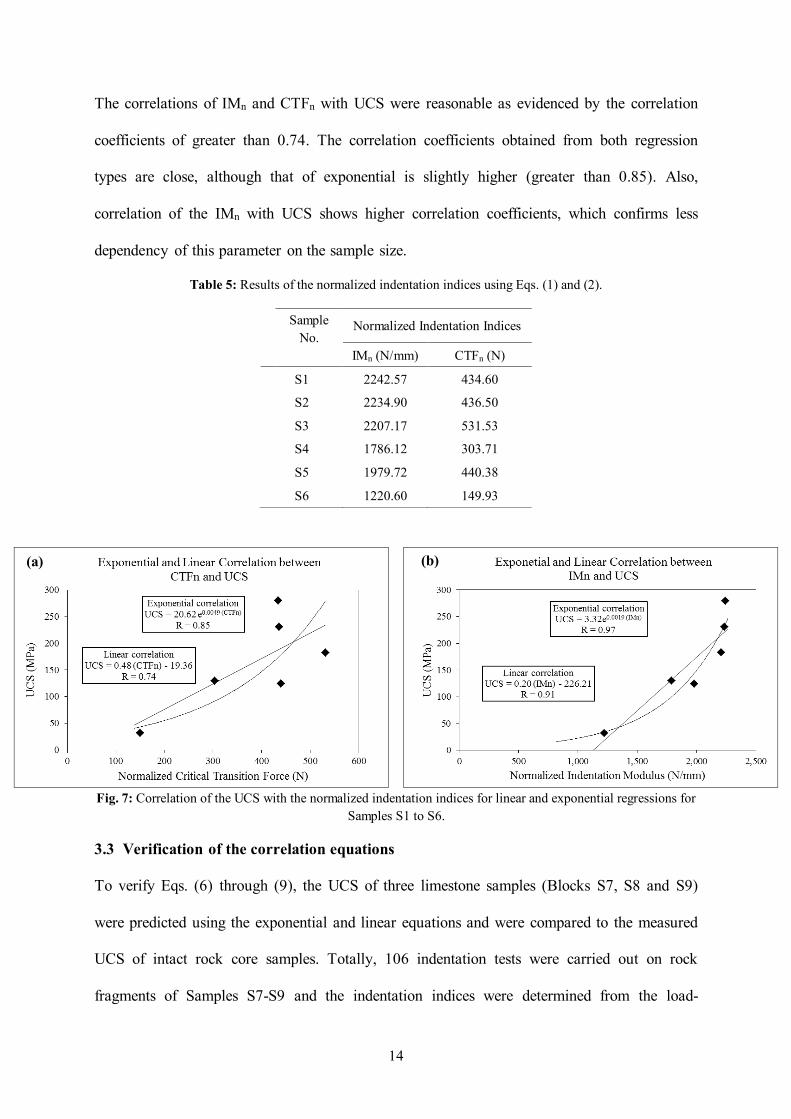
IMn and UCS UCS = 0.20 (IMn) – 226.21 R = 0.91 (6)
CTFn and UCS UCS = 0.48 (CTFn) – 19.36 R = 0.74 (7)
Exponential regressions for:
IMn and UCS UCS = 3.32 e0.0019 (IMn) R = 0.97 (8)
CTFn and UCS UCS = 20.62 e0.0049 (CTFn) R = 0.85 (9)
14
The correlations of IMn and CTFn with UCS were reasonable as evidenced by the correlation
coefficients of greater than 0.74. The correlation coefficients obtained from both regression
types are close, although that of exponential is slightly higher (greater than 0.85). Also,
correlation of the IMn with UCS shows higher correlation coefficients, which confirms less
dependency of this parameter on the sample size.
Table 5: Results of the normalized indentation indices using Eqs. (1) and (2).
Sample
No. Normalized Indentation Indices
IMn (N/mm) CTFn (N)
S1 2242.57 434.60
S2 2234.90 436.50
S3 2207.17 531.53
S4 1786.12 303.71
S5 1979.72 440.38
S6 1220.60 149.93
Fig. 7: Correlation of the UCS with the normalized indentation indices for linear and exponential regressions for
Samples S1 to S6.
3.3 Verification of the correlation equations
To verify Eqs. (6) through (9), the UCS of three limestone samples (Blocks S7, S8 and S9)
were predicted using the exponential and linear equations and were compared to the measured
UCS of intact rock core samples. Totally, 106 indentation tests were carried out on rock
fragments of Samples S7-S9 and the indentation indices were determined from the load-
(a) (b)

15
penetration curves (see the average values in Table 6). Next, the indentation indices were
normalized using Eqs. (1) and (2) (see Table 6). The normalized indentation indices (IMn and
CTFn) were utilized to estimate the UCS of the rocks using the linear (Eqs. (6) and (7) and
exponential (Eqs. (8) and (9)) correlations. The estimated UCS values were plotted against the
measured UCS and the correlation coefficient in the linear regression type was obtained using
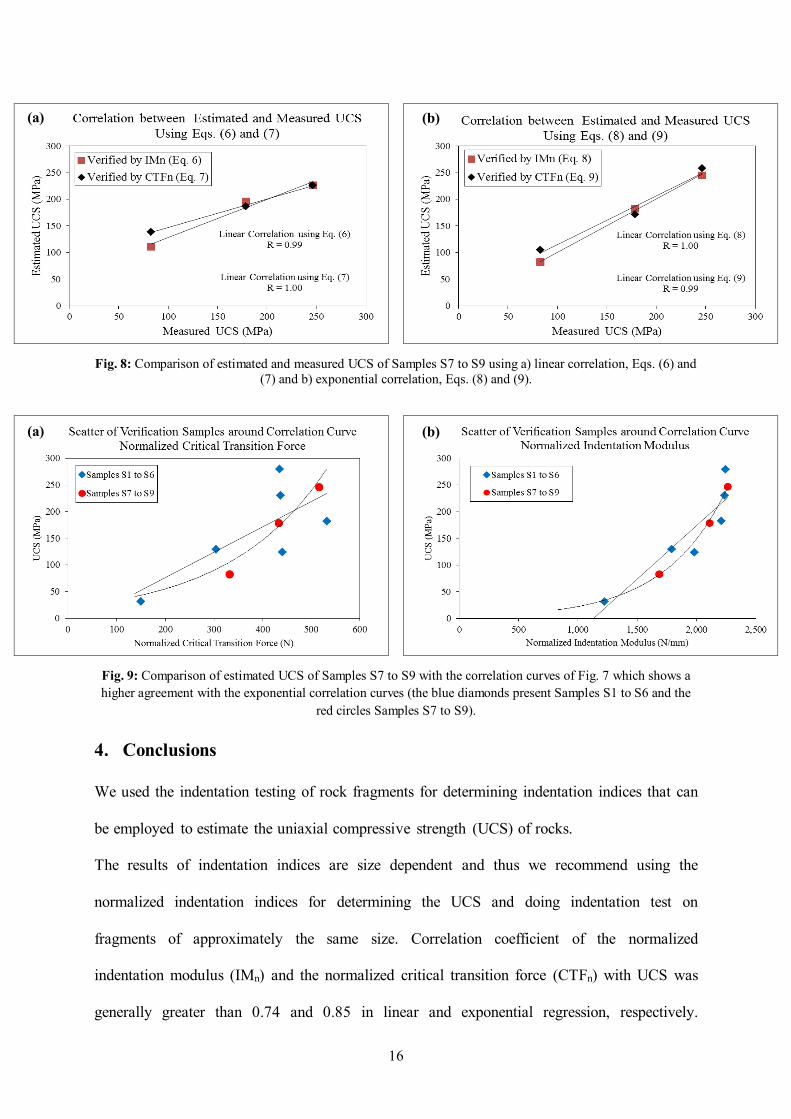
the least square method (Fig. 8). A strong agreement (R≈1.00) between the estimated and
measured UCS resulted. The UCS estimated from both IMn and CTFn were accurate, but the
estimated value by IMn in the exponential regression type was closer to the measured value.
The laboratory UCS of Sample S7 to S9 was plotted along with the correlation curves of Fig.
7 to examine the agreement with the correlations (see Fig. 9). The estimated UCS values were
reasonably close to both linear and exponential curves, but the estimated values were closer to
the exponential correlation curves for IMn and CTFn.
It is to be noted that the UCS of samples used for developing the correlation equations was in
the range of 30-280 MPa. Further the UCS of the verification samples was between 83 and
245 MPa. Extending the UCS range of the samples used in the correlation development can
further refine the correlation.
Table 6: Results of the indentation tests on Sample S7, S8 and S9 for correlation verification. Conventional
indentation indices were normalized using Eqs. (1) and (2) and the UCS values were estimated by Eqs. (6) to
(9).
Sam
ple
No.
No.
of
Tes
ts
Conventional
Indentation Indices
Normalized
Indentation Indices
Mea
sure
d U
CS
by L
ab T
est
(MP
a)
Estimated UCS (MPa)
Linear Eqs. (6) and (7) Exponential Eqs. (8) and (9)
IM
(N/mm) CTF (N)
IMn
(N/mm)
CTFn
(N)
UCS from
IMn
UCS from
CTFn
UCS from
IMn
UCS from
CTFn
S7 40 4113.35 936.96 2262.47 515.44 246.32 226.51 226.25 244.56 257.74
S8 32 4089.38 844.99 2108.73 432.47 178.45 195.75 186.72 182.61 171.65
S9 34 3788.02 745.83 1685.44 331.90 82.89 111.05 138.79 81.70 104.86
16
Fig. 8: Comparison of estimated and measured UCS of Samples S7 to S9 using a) linear correlation, Eqs. (6) and
(7) and b) exponential correlation, Eqs. (8) and (9).
Fig. 9: Comparison of estimated UCS of Samples S7 to S9 with the correlation curves of Fig. 7 which shows a
higher agreement with the exponential correlation curves (the blue diamonds present Samples S1 to S6 and the
red circles Samples S7 to S9).
4. Conclusions
We used the indentation testing of rock fragments for determining indentation indices that can
be employed to estimate the uniaxial compressive strength (UCS) of rocks.
The results of indentation indices are size dependent and thus we recommend using the
normalized indentation indices for determining the UCS and doing indentation test on
fragments of approximately the same size. Correlation coefficient of the normalized
indentation modulus (IMn) and the normalized critical transition force (CTFn) with UCS was
generally greater than 0.74 and 0.85 in linear and exponential regression, respectively.
(a) (b)
(a) (b)
17
Between the two normalized indices mentioned above, the IMn showed less scattered results
and stronger correlation coefficient.
The proposed correlations were verified using the normalized indentation indices of three
other limestone samples that had not been used in developing the correlations. Results showed
that the correlation coefficient between the estimated and measured UCS was near 1.00.
Obviously, the near perfect match in this case is accidental and such a close match should not
be generally expected.
The strong correlation between indentation indices and UCS, verification results and
simplicity of indentation testing indicate great promise for real-time rock strength and
borehole stability assessments.
It should be noted that the proposed correlations are valid only for the limestone rocks with
rock fragment sizes between 2-5 mm using the same sample preparation method and testing
manner as was presented in this paper. Further investigations are required to study the impact
of the rock fragment sizes (particularly thickness and area), penetration rate and indenter
diameter on the indentation indices as well as refining the correlations by including data from
other geographical locations and different lithologies.
References
ASTM, American Society for Testing and Materials, 1984. Standard test method for
unconfined compressive strength of intact rock core specimens. ASTM D2938.
Chang, C., 2004. Empirical rock strength logging in boreholes penetrating sedimentary
formations. Geol. Environ. Scien., Chungnam National University, Daejeon. Vol. 7, No.
3, PP. 174-183.
Chang, C., Zoback, M.D. and Khaksar, A., 2006. Empirical relations between rock strength
and physical. J. of Petrol. Sci. and Eng. Vol. 51, PP. 223-237.

18
Cook, J.M. and Thiercelin, M., 1989. Indentation resistance of shale: the effects of stress state
and strain rate. Rock Mechanics as a Guide for Efficient Utilization of Natural Resources,
PP. 757-764.
Fjar, E. 1999. Static and dynamic module of weak sandstones. In: Amadei B, et al., editors.
Rock mechanics for industry. Rotterdam: Balkema. PP. 675–81.
Garcia, R.A., Saavedra, N.F., Calderon, Z.H. and Mateus, D., 2008. Development of
experimental correlations between indentation parameters and unconfined compressive
strength (UCS) values in shale samples. CT&F-Ciencia Tecnologíay Futuro. Vol. 3, No.
4, PP. 61-81.
Gill, D.E., Corthesy, R. and Leite, M.H., 2005. Determining the minimal number of
specimens for laboratory testing of rock properties. Engineering Geology, Vol. 78, PP.
29–51.
Holt, R.M., Brignoli, M. and Kenter, C.J., 2000. Core quality: quantification of coring
induced rock alteration. Int. J. Rock Mech. Min. Sci., Vol. 37, No. 6, PP. 889–907.
Holt, R.M., Kjølaas, J., Larsen, I., Pillitteri, G.A. and Sønstebø, E.F., 2005. Comparison
between controlled laboratory experiments and discrete particle simulations of the
mechanical behavior of rock, International Journal of Rock Mechanics & Mining
Sciences, Vol. 42, PP. 985–995.
Horsrud, P., 2001. Estimating mechanical properties of shale from empirical correlations. SPE
Drill Completion, PP. 68–73.
ISRM, International Society of Rock Mechanics 1979. Suggested methods for determining
the uniaxial compressive strength and deformability of rock materials. Int. J. Rock Mech.
Min. Sci. Geomech. Abs., Vol. 16, No. 2, PP. 135-140.
19
Jaramillo, R.A., 2004. Estudio geomecánico estadístico de l’estabilidad durante la perforación
de pozos en el Piedemonte Llanero, campo Recetor. Tesis profesional Fac. Minas.,
Universidad Nacional de Colombia. Medellín, Colombia.
Kekec, B., Unal, M., and Sensogut, C., 2006. Effect of the textural properties of rocks on their
crushing and grinding features, Journal of University of Science and Technology Beijing,
Vol. 13, No. 5, PP. 385-389.
Mateus, J., Saavedra, N.F., Calderón, Z.H. and Mateus, D., 2007. Correlation development
between indentation parameters and uniaxial compressive strength for Colombian
sandstones. CT&F-Ciencia Tecnologíay Futuro. Vol. 3, No. 3, PP. 125-135.
Mehrabi Mazidi, S., Haftani, M., Bohloli, B. and Cheshomi A., 2012. Measurement of
uniaxial compressive strength of rocks using reconstructed cores from rock cuttings.
Journal of Petroleum Science and Engineering Vols. 86–87, PP. 39–43.
Nes, O.M., Horsrud, P., Sonstebo, E.F., Holt, R.M., Ese, A.M., Okland, D. and Kjorholt, H.,
1998. Rig-Site and laboratory use of CWT acoustic velocity measurements on cuttings,
paper SPE 36854 presented at the 1996 SPE European Petroleum Conference, Milan,
Italy.
Plumb, R., 1994. Influence of composition and texture on the failure properties of clastic
rocks. In: SPE/ISRM Proceedings of the Eurock’94. Rock mechanics in petroleum
engineering, Rotterdam: Balkema, PP. 13–20.
Protodyakonov, M.M., 1960. Me´thodes nouvelles de de´termination des proprie´te´s
me´caniqes des terrains miniers. C.-R. Conf. Int. Pressions de Terrains, Paris, PP. 172–
181.
Protodyakonov, M.M., 1969. Method of determining the strength of rock under uniaxial
compression. Mech. prop. of rocks. Acad. Sci. USSR, PP. 1–8.

20
Ringstad, C., Lofthus, E.B., Sonstebo, E.F., Fjar, E., Zausa, F., and Fuh G.F., 1998. Prediction
of rock parameters from micro-indentation measurements: the effect of sample size.
EUROCK ’98, Trondheim, Norway, July 8-10. SPE 47313.
Santarelli, F.J., Marshala, A.F., Brignoli, M., Rossi, E., and Bona N., 1996. Formation
evaluation from logging on cuttings. SPE Permian Basin Oil and Gas Recovery
Conference, Midland, Texas, March 27-29. SPE 36851.
Spiegel, M.R., 1961. Theory and problems of statistics. Schaum’s Outline Serie. McGraw-
Hill. 359 PP.
Suarez-Rivera, F.R., Cook, N.G.W., Cooper, G.A. and Zheng, Z., 1990. Indentation by pore
collapse in porous rocks. Rock Mechanics Contributions and Challenges, PP. 671-678.
Suarez-Rivera, F.R., Cook, P.J., Cook, N.G.W. and Myer, L.R., 1991. The role of wetting
fluids during indentation of porous rocks. Proc. 32nd U. S. Sym., PP. 683-692.
Thiercelin, M. and Cook, J., 1988. Failure mechanisms induced by indentation of porous
rocks. Key questions in Rock Mechanics, PP. 135-142.
Thiercelin, M., 1989. Parameters controlling rock indentation-rock at great depth, Proc.
ISMR/SPE Symp., PP. 85-92.
Tugrul, A. and Zarif, I.H., 1999. Correlation of mineralogical and textural characteristics with
engineering properties of selected granitic rocks from Turkey, Engineering Geology, Vol.
51, PP. 303–317.
Uboldi, V., Civolani, L., and Zausa, F., 1999. Rock strength measurements on cutting as input
data for optimizing drill bit selection. SPE Annual Conference and Exhibition, Houston,
Texas, October 3-6. SPE, ENI SpA 56441.
Vutukuri, U.S., Lama, R.D. and Saluja, S.S., 1974. Handbook on mechanical properties of
rocks: Volume I. testing techniques and results. Trans Tech. Pub. 280 PP.

21
Zausa, F. and Santarelli, F.J., 1995. A new method to determine rock strength from an index
test on fragments of very small dimension. VIII ISRM International Congress on Rock
Mechanics, Tokyo, Japan.
Zausa, F., Civolani, L., Brignoli, M. and Santarelli, F.J., 1997. Real time wellbore stability
analysis at the rig site. SPE/IADC Drilling Conference, Amsterdam, SPE 37670.
Zorlu, K., Gokceoglu, C., Ocakoglu, F., Nefeslioglu, H.A. and Acikalin, S., 2008. Prediction
of uniaxial compressive strength of sandstones using petrography-based models,
Engineering Geology, Vol. 96, PP. 141–158.