Embed Size (px)
Citation preview

A new computational paradigm in multiscale simulationswith applications to brain blood flow
Leopold GrinbergDivision of Applied Math.
Brown UniversityProvidence, RI 02912
Vitali MorozovArgonne National Laboratory
9700 South Cass AvenueArgonne, IL 60439
Dmitry FedosovInstitute of Complex Systems
FZ JuelichJuelich, 52425, Germany
Joseph InsleyArgonne National Laboratory
9700 South Cass AvenueArgonne, IL [email protected]
Michael PapkaArgonne National Laboratory
9700 South Cass AvenueArgonne, Illinois 60439
Kalyan KumaranArgonne National Laboratory
9700 South Cass AvenueArgonne, Illinois [email protected]
George Em KarniadakisDivision of Applied Math.
Brown UniversityProvidence, RI 02912
ABSTRACTInterfacing atomistic-based with continuum-based simula-tion solvers is now required in many multiscale physicaland biological systems. We present the computational ad-vances that have enabled the first multiscale simulation on131,072 processors by coupling a high-order (spectral ele-ment, SEM) Navier-Stokes solver with a stochastic (coarse-grained) Molecular Dynamics solver based on DissipativeParticle Dynamics (DPD). We study blood flow in a patient-specific cerebrovasculature with a brain aneurysm, and an-alyze the interaction of blood cells with the arterial wallsthat lead to thrombus formation and eventual aneurysmrupture. The macro-scale dynamics (more than 3 billionunknowns) are resolved by NEKTAR - a multi-level parallelSEM solver – while the micro-scale flow and cell dynam-ics within the aneurysm is resolved by an in-house versionof DPD-LAMMPS (more than a billion molecules). Thekey contributions are: proper interface conditions for over-lapped domains, topology-aware communication, SIMDiza-tion of all basic operations, and multiscale visualization.
Categories and Subject DescriptorsH.4 [Information Systems Applications]: Miscellaneous;D.2.8 [Software Engineering]: Metrics—complexity mea-
sures, performance measures
Permission to make digital or hard copies of all or part of this work forpersonal or classroom use is granted without fee provided that copies arenot made or distributed for profit or commercial advantage and that copiesbear this notice and the full citation on the first page. To copy otherwise, torepublish, to post on servers or to redistribute to lists, requires prior specificpermission and/or a fee.Copyright 2011 ACM X-XXXXX-XX-X/XX/XX ...$10.00.
KeywordsCoupled solvers, Continuum-atomistic simulations, Multi-scale modeling, Cerebrovascular circulation
1. INTRODUCTION
Figure 1: (in-color) Human arterial tree: telescop-ing multi-scale modeling approach. Major arteriesof the brain, reconstruction from MRI images. Aflow in a small sub-region inside the aneurysm iscomputes using a coarse-grained molecular dynam-ics approach. Modeling interaction of the flow andthe red and white blood cells and platelets ...
needed: on importance of multiscale simulations-> transiotion to coupled simulations -> transition

to blood flowThe cardiovascular system of the human body is the envy
of every engineer. In just one minute, the average heartbeats about 70 times pumping the entire blood supply of5 liters through 62,000 miles of vessels, that is one-fourththe distance between the Moon and the Earth! The hu-man brain, in particular, although less than 2% of the bodyweight, receives about 20% of the resting cardiac outputof blood and 25% of body’s oxygen supply. Interactions ofblood flow in the human brain occur between different scales,determined by flow features in the large arteries (diameterof 0.5 mm or larger), the smaller arteries and arterioles (500µm to 10 µm), and the capillaries (mean diameter of 5 µm)all being coupled to cellular and sub-cellular biological pro-cesses. While many biological aspects have been studied sys-tematically, surprisingly less effort has been put into study-ing blood flow patterns and oxygen transport within thebrain, i.e., the fundamental biomechanical processes of theintegrated intracranial vascular network. However, recentpioneering 3D imaging of the human brain by Cassot et al.in [3] and of the mouse brain by Mayerich et al. [4] providesstatistical information for constructing realistic topologicalmodels on which future brain simulations will be based.
Following these results, we have been focusing on the de-velopment of an integrated model of the vascular networkin the human brain (cerebrovasculature) characterized bythree distinct spatial length scales: (1) The macrovascularnetwork (MaN) consisting of large arteries, down to diam-eter of 0.5 mm, which are patient-specific and can be re-constructed from CT/MR imaging. Typically, about 1001such arteries start from the circle of Willis, which is formeddownstream of the four main arterial inlets at the neck (twocarotids and two vertebral arteries); (2) The mesovascularnetwork (MeN) consisting of small arteries and arterioles,from 500 µm down to 10 µm, which follow a tree-like struc-ture governed by specific fractal laws. The human braincontains about (10 millions)2 small arteries and arterioles.(3) The microvascular network (MiN) consisting of the cap-illary bed, which follows a net-like structure; its topologicalstatistics have been recently quantified for the human brainin [3]. The typical number of capillary segments in the brainis more than 1 billion.
Previous works have shown that the resolution of each ofthem is extremely important and must be led with unprece-dented accuracy to eliminate computational artifacts andreduced confidence in the simulation results [REFERENCE?]. In this study, we report the results of the first of its kindsimulation of the patient-specific brain blood flow. We haveperformed an image-based 3D Navier-Stokes simulations forfully resolving MaN, coupled to subpixel stochastic simula-tions of MeN and MiN. To this end, for MaN/MiN was sim-ulated by NεκT αr– a spectral/hp element based parallelcode [?] with more than 90% parallel efficiency on 132,760BG/P cores. For MiN, we have employed dissipative parti-cle dynamics (DPD) simulations on representative capillarydomains modeling explicitly (down to protein-level) the redblood cells. We have implemented DPD using the Sandiacode LAMMPS [1], also leading to more than 90% parallelefficiency on that scale.
Our work targets biological applications and specificallythe arterial blood circulation, which is a multi-scale pro-cess where time and space scales range from nanoseconds(nanometers) to seconds (meters). The macro-vascular scales
describing the flow dynamics in larger vessels are coupledto the meso-vascular scales of individual blood cells. Themeso-vascular events are coupled to the micro-vascular onesaccounting for blood perfusion, platelets aggregation, adhe-sion of the blood cells to the arterial walls, etc.
Simulating the interactions between these macro-, meso-and micro-scales is a grand computational challenge, whichrequires state-of-the-art algorithms and computers. Besidesthe multiscale nature of the problem, its size often presentsa substantial computational challenge even for simulationsconsidering a single scale.
Here we simulate flow circulation in the major brain ar-teries with an aneurysm - a pathological extrusion of thearterial wall that posses a risk of rapture with possibly dev-astating outcome. Aneurysm treatment often incudes coilinsertion or clipping, both reduce the local flow circulation,lead to flow stagnation and thrombus (blood clot) formation.The body uses platelets and fibrin to form a clot. Simulationof such process must be based on resolving the macro- andmeso-vascular flow dynamics and also interaction of bloodand the endothelial cells forming the inner layer of arte-rial wall. Such process is clearly a multiscale in nature andconsequently requires different models appropreate for eachscale.
To accurately resolve the interaction between macro-, meso-and micro-vascular events we couple scalable parallel solversvia light-weight interfaces; each solver has a capability tosolve a single scale problem using physiologicaly correct math-ematical models. The two solvers are also capable to run ona hundred thousands computer cores solving billions degreesof freedom problems.
Prior works: LG add short literature review includ-ing results from SC10 and emphasizing the differ-ence with our
In this paper we describe a new computational paradigmin multiscale simulations enabling the aformentioned mul-tiscale flow simulations. We also focus on the structure ofNεκT αrG - a metasolver developed by our team for thatpurpose; and report on the performance of the solver. Re-sults of multiscale patient specific simulation performed onArgonne’s Blue Gene/P supercomputer are presented.
2. BLOOD PHYSIOLOGYBlood is a physiological fluid that consists of red blood
cells (RBCs), white blood cells (WBCs), platelets, and plasmawith various molecules. Blood transports oxygen and nutri-ents to cells of the body, removes waste products, and circu-lates a number of molecules and cells which mediate manyvital processes in the organism such as immune response,tissue repair, etc. The volume fraction of RBCs is approx-imately 45%, of WBCs around 0.7%, and the rest is takenup by blood plasma and its substances. Due to a high vol-ume fraction of RBCs, the rheological properties of bloodare mainly determined by the RBC properties.
In vitro experiments [5, 15, 14] of blood flow in glass tubeswith diameters ranging from 3 µm to 1000 µm have showna dependence of the apparent blood viscosity on the tubediameter, RBC volume fraction, cell aggregability, and flowrate. Thus, in tubes with diameters larger than 400−500 µmblood can be assumed to be a nearly Newtonian fluid with aconstant effective viscosity, while in smaller tubes it showscomplex rheological behavior. This supports the applicationof continuum type methods within the MaN where a char-

acteristic vessel size is larger than 500 µm. However, accu-rate blood flow representation in MeN and in MiN requiresexplicit modeling of blood cells [12, 6] using mesoscale tech-niques (e.g., DPD). Moreover, continuum modeling of bloodflow is not able to capture active processes in blood (e.g.,RBC aggregation, WBC adhesion, blood clotting) which canbe modeled using mesoscale methods.
Blood flow in aneurysm can be significantly reduced re-sulting in thrombus formation. Blood clots are formed mostlyby platelets and fibrin, and may appear at sites of endothe-lial lining damages. Thrombus formation is a very com-plex process which involves a number of biochemical con-stituents, cells, and flow conditions. Recent modeling ofplatelet thrombi formation and growth in tube flow [13] as-sumed platelets to be spherical particles and introduced ef-fective adhesive interactions between them. The model wasable to capture essential dynamics of thrombus formation inflow and is adapted in this work to model blood clotting inthe aneurysm coupled to the blood flow in the large portionof MaN network.
3. COMPUTATIONAL ALGORITHMSOur multiscale solver NεκT αrG is based on coupling
of several massively parallel codes. Each code uses differentmathematical model and is effective for flow simulations atcertain spatial and temporal scales. The original codes havebeen modified such that they can effectively exchange datarequired to impose boundary condition. The solvers sharethe default World communicator, while compute local solu-tion in parallel over derived subcommunicators. The conti-nuity in the overall solution is acheived by imposing properinterface conditions. The treatment of interface conditionsis optimized to minimize the inter-solver communication,which leads to effective implementation of the coupled codeon computers with heterogenious interconnect. The reuse ofan existing software allows almost a non-intrusive approachin scaling-up the performance and the solver’s capabilities,as the overall scalability of the coupled code depends almostexclusively on the performence of its components.
The schematic representation of NεκT αrG’s structure isgiven in Figure 2. The three major components ofNεκT αrG
Figure 2: Overall structure of the metasolverNεκT αrG.
are:1)NεκT αr-3D – a high-order spectral/hp element (SEM/hp)solver for unsteady three-dimensional (3D) flow problems[?].NεκT αr-3D uses semi-implicit high-order time steppingscheme providing high temporal resolution and SEM/hp al-lows high spatial accuracy and easy discretization of complexgeometry domains with curved boundaries. The Helmholtz
and Poisson iterative solvers for solution of the velocity andpressure fields are based on conjugate gradient method andscalable low-energy preconditioner[?, ?]. The solver’s con-vergence is also accelerated by predicting a good initial state[?].2) NεκT αr-1D – a high-order spectral/hp element solverfor unsteady 1D flow problems[?]. The 1D model is basedon coarsening of the 3D model. It is computationally inex-pensive and provides relaible information on pressure distri-bution and massflow distribution at multiple arteries [?, ?,?]. Coupled to the 3D model, the 1D model can be used toaccount for flow dynamics in peripherial arterial networksinvisible to the MRI or CT scanners.3) DPD-LAMMPS – a modified version of LAMMPS withmajor enhancements in DPD simulations for unsteady flowsand complex geometries. DPD [9, 8] is a mesoscopic particle-based simulation technique, where each particle represents acluster of atoms or molecules rather than an individual atom.DPD particles interact through pairwise soft forces and moveaccording to the Newton’s second law of motion. The mainchallenge here is in imposing non-periodic boundary condi-tions (BCs) for unsteady flows in complex geometries. Theboundary of a DPD domain is discretized (e.g., triangulated)into small enough elements where local BC velocities are set.In general, we impose effective boundary forces Feff on theparticles near boundaries that represent solid walls and in-flow/outflow BCs. Such forces impose no-slip at solid wallsand control flow velocities at inflow/outflow. The Feff canbe calculated during pre-processing, see [11] for details. Inaddition, at inflow/outflow we insert/delete particles accord-ing to local particle flux [11]. The algorithm allows to han-dle multiple particle species to enable simulations of variousprocesses at mesoscale such as platelet aggregation.
NεκT αr-1D and NεκT αr-3D are employed for solu-tion of flow problems at the continuum but with differ-ent level of resolution; in the current study we focus onNεκT αr-3D. DPD-LAMMPS is used for meso- and micro-scale problems, such as simulations of RBCs and plateletsdynamics. Each solver can be called by NεκT αrG multi-ple times; for example it is possible to couple through light-weight interfaces two or more 3D domains (patches), i.e.,NεκT αr-3D to NεκT αr-3D coupling, 3D domains to anumber of 1D domains and also to domains where solutionis obtained using the DPD method.
In the current study the flow at the macro-vascular scaleis computed by a continuum solver. The computational do-main ΩC is subdivided to four overlapping patches as illus-trated in Figure 1, this requires NεκT αr-3D toNεκT αr-3D coupling [?] at three artificial interfaces. Flow dynamicsat the meso-vascular scale is computed by atomistic solverDPD-LAMMPS. Subdomain ΩA is embedded into one ofthe patches of ΩC as illustrated in Figure 1, this requiresNεκT αr-3D to DPD-LAMMPS coupling.
In the following we describe the general approach for cou-pling parallel solvers. First, we describe the Multilevel Com-municating Interface (MCI) designed for efficient couplingtwo or more parallel solvers. Second, we review theNεκT αr-3D toNεκT αr-3D coupling. Third, we describe theNεκT αr-3D to DPD-LAMMPS coupling.
3.1 Multilevel Communicating InterfaceLet us consider a flow problem defined in a computational
domain Ω, which can be subdivided to overlapping or non-overlapping subdomains Ωj , j = 1, 2, .... The key feature of

Figure 3: (in color) Multilayer Communicating In-terface: MPI COMM WORLD is subdivided ac-cording to the computer topology to form threenon-overlapping process sub-group (Level 2 sub-communicators, Sj), The L2 groups are sub-divided using task-oriented splitting and four non-overlapping groups (Level 3 sub-communicators, Tj)are created. Cells represent processes.
the MCI architecture is the hierarchical decomposition of thedefault World communicator into subcommunicators. Thecommunicator splitting is done accordingly to the decompo-sition of domain Ω into Ωj , and is performed in several stagesas illustrated in Figure 3. At the first stage the topology-oriented splitting is performed, and the processors from dif-ferent computers or racks are grouped into Level 2 (L2) sub-communicators. In simulations on computer with homoge-nious network the L2 communicator is set to be the same asthe default communicator. The L2 groups are further subdi-vided according to the task-decomposition into Level 3 (L3)non-overlapping groups. The communications required forsolving tightly coupled problem by either NεκT αr-3D orDPD-LAPPMS are thus limited to a subset of processorscommunicating within L3 group.
The L3 sub-communicators used by each solver are fur-ther subdivided accordingly to low-level task-parallelism toform the Level 4 (L4) sub-communicators. For example,calculations and communications required for interface con-ditions are performed on small subsets of processors (L4groups) mapped to partitions intersected by the interfaces.Data required by the interface conditions is communicatedbetween the roots of the corresponding L4 groups, as illus-trated in Figure 4. Such communications are performed onlyfew times at each time step and thus have negligible impacton the performance. The communications between the L4groups will be covered in more detail in Section 3.2.
3.2 NεκT αr-3D to NεκT αr-3D couplingThe scalability of effective solvers in large-scale parallel
flow simulations based on semi-implicit time-stepping dete-riorates as the number of processors increases. One of thebig bottlenecks in scalability is solution of linear system,caused by effective preconditioners which often require highvolume of communications and are typically not scalable onmore then a thousand of processors. The multi-patch do-main decomposition implemented in NεκT αrG addressesthis issue as follows. A large monolithic domain is subdi-vided into a series of loosely coupled subdomains (patches)of a size for which good scalability of the parallel solver can
Figure 4: (in color) Multilayer Communicating In-terface. Three-step algorithm for inter-patch com-munication.
be achieved. Once at every time step the data required bythe interface conditions is transfered between the adjacentdomains, and then the solution is computed in parallel ineach patch. Such approach limits the processor count par-ticipating in the high volume of blocking and non-blockingcommunications, which alleviates the scalability limitationsand leads to optimal allocation of computational resources.The mathematical formulation of the algorithm is describedin [?]; here we focus on the parallel implementation of thealgorithm applied to the domain of arteries presented in Fig-ure 1.
Following this geometric domain decomposition of Ω intofour patches Ωj , j = 1, ..., 4, four L3 sub-communicatorsare created. The size of the L3 sub-communicators is cho-sen a priory such that solution in each Ωj can be obtainedwithin approximately the same wall-clock time at each time-step, and in general it is related to the number of degreesof freedom in each Ωj . Each patch is subsequently parti-tioned into non-overlapping partitions in order to apply aparallel solver locally. The boundaries of Ω are the arte-rial walls, inlets and outlets. Decomposition of Ω into fouroverlapping Ωj introduces six artificial interfaces (three in-lets and three outlets), where inter-patch conditions must beimposed to enforce continuity in the velocity and pressurefields. To handle operations associated with boundary andinterface conditions at each inlet and outlet, the L4 sub-communicators are derived from the corresponding L3. Forexample, in sub-domain of the right ICA (shown in red inFigure 1) four L4 groups are created: one contains elementsfacing the inlet of Ω, one contains elements facing the outletof Ω and two with elements facing the two interfaces withthe adjacent sub-domain. In Figure 4 we illustrate the pro-cess of data transfer between the two adjacent patches. Thedata exchange is a three-step process; at the first step dataare gathered on the root of L4; on the second step roots fromcorresponding two L4 groups communicate over World; atthe final step data is scattered from the root of L4 to otherranks.
3.3 NεκT αr-3D to DPD-LAMMPS couplingTo couple NεκT αr-3D to DPD-LAMMPS we adopt the
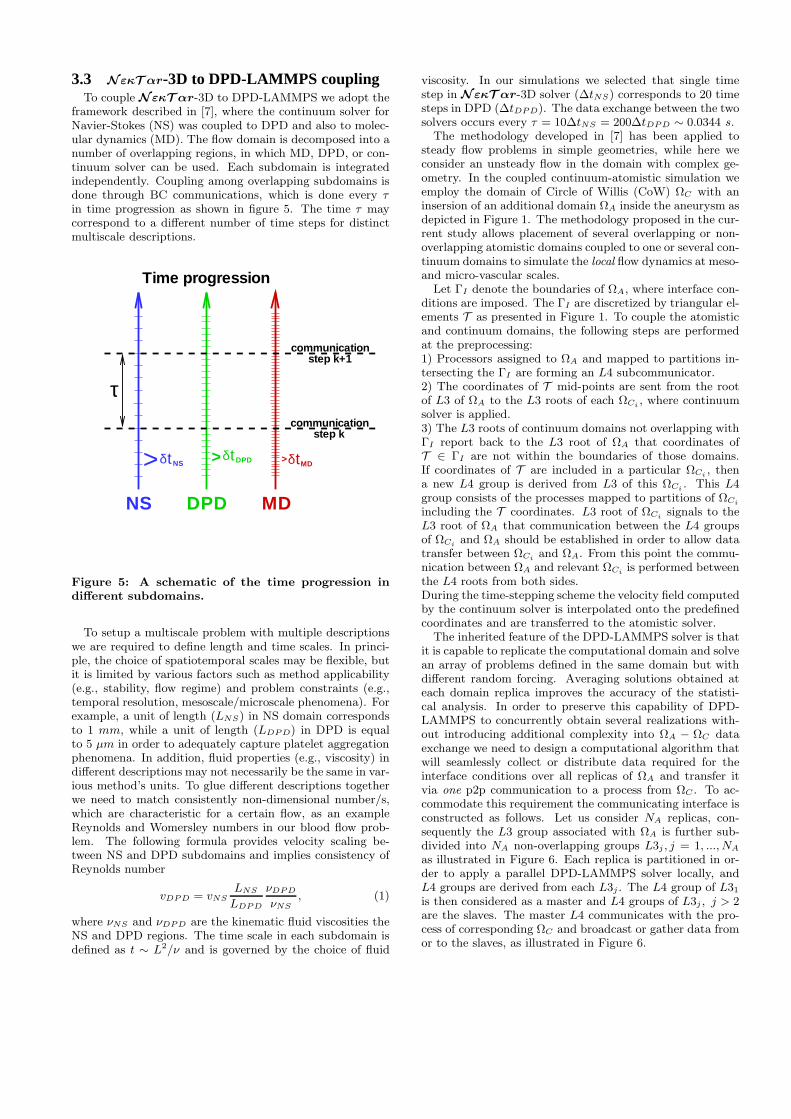
framework described in [7], where the continuum solver forNavier-Stokes (NS) was coupled to DPD and also to molec-ular dynamics (MD). The flow domain is decomposed into anumber of overlapping regions, in which MD, DPD, or con-tinuum solver can be used. Each subdomain is integratedindependently. Coupling among overlapping subdomains isdone through BC communications, which is done every τin time progression as shown in figure 5. The time τ maycorrespond to a different number of time steps for distinctmultiscale descriptions.
communicationstep k+1
communicationstep k
τ
Time progression
NS DPD MD
δtDPD δtMDδtNS> > >
Figure 5: A schematic of the time progression indifferent subdomains.
To setup a multiscale problem with multiple descriptionswe are required to define length and time scales. In princi-ple, the choice of spatiotemporal scales may be flexible, butit is limited by various factors such as method applicability(e.g., stability, flow regime) and problem constraints (e.g.,temporal resolution, mesoscale/microscale phenomena). Forexample, a unit of length (LNS) in NS domain correspondsto 1 mm, while a unit of length (LDPD) in DPD is equalto 5 µm in order to adequately capture platelet aggregationphenomena. In addition, fluid properties (e.g., viscosity) indifferent descriptions may not necessarily be the same in var-ious method’s units. To glue different descriptions togetherwe need to match consistently non-dimensional number/s,which are characteristic for a certain flow, as an exampleReynolds and Womersley numbers in our blood flow prob-lem. The following formula provides velocity scaling be-tween NS and DPD subdomains and implies consistency ofReynolds number
vDPD = vNSLNS
LDPD
νDPD
νNS
, (1)
where νNS and νDPD are the kinematic fluid viscosities theNS and DPD regions. The time scale in each subdomain isdefined as t ∼ L2/ν and is governed by the choice of fluid
viscosity. In our simulations we selected that single timestep in NεκT αr-3D solver (∆tNS) corresponds to 20 timesteps in DPD (∆tDPD). The data exchange between the twosolvers occurs every τ = 10∆tNS = 200∆tDPD ∼ 0.0344 s.
The methodology developed in [7] has been applied tosteady flow problems in simple geometries, while here weconsider an unsteady flow in the domain with complex ge-ometry. In the coupled continuum-atomistic simulation weemploy the domain of Circle of Willis (CoW) ΩC with aninsersion of an additional domain ΩA inside the aneurysm asdepicted in Figure 1. The methodology proposed in the cur-rent study allows placement of several overlapping or non-overlapping atomistic domains coupled to one or several con-tinuum domains to simulate the local flow dynamics at meso-and micro-vascular scales.
Let ΓI denote the boundaries of ΩA, where interface con-ditions are imposed. The ΓI are discretized by triangular el-ements T as presented in Figure 1. To couple the atomisticand continuum domains, the following steps are performedat the preprocessing:1) Processors assigned to ΩA and mapped to partitions in-tersecting the ΓI are forming an L4 subcommunicator.2) The coordinates of T mid-points are sent from the rootof L3 of ΩA to the L3 roots of each ΩCi
, where continuumsolver is applied.3) The L3 roots of continuum domains not overlapping withΓI report back to the L3 root of ΩA that coordinates ofT ∈ ΓI are not within the boundaries of those domains.If coordinates of T are included in a particular ΩCi
, thena new L4 group is derived from L3 of this ΩCi
. This L4group consists of the processes mapped to partitions of ΩCi
including the T coordinates. L3 root of ΩCisignals to the
L3 root of ΩA that communication between the L4 groupsof ΩCi
and ΩA should be established in order to allow datatransfer between ΩCi
and ΩA. From this point the commu-nication between ΩA and relevant ΩCi
is performed betweenthe L4 roots from both sides.During the time-stepping scheme the velocity field computedby the continuum solver is interpolated onto the predefinedcoordinates and are transferred to the atomistic solver.
The inherited feature of the DPD-LAMMPS solver is thatit is capable to replicate the computational domain and solvean array of problems defined in the same domain but withdifferent random forcing. Averaging solutions obtained ateach domain replica improves the accuracy of the statisti-cal analysis. In order to preserve this capability of DPD-LAMMPS to concurrently obtain several realizations with-out introducing additional complexity into ΩA − ΩC dataexchange we need to design a computational algorithm thatwill seamlessly collect or distribute data required for theinterface conditions over all replicas of ΩA and transfer itvia one p2p communication to a process from ΩC . To ac-commodate this requirement the communicating interface isconstructed as follows. Let us consider NA replicas, con-sequently the L3 group associated with ΩA is further sub-divided into NA non-overlapping groups L3j , j = 1, ..., NA
as illustrated in Figure 6. Each replica is partitioned in or-der to apply a parallel DPD-LAMMPS solver locally, andL4 groups are derived from each L3j . The L4 group of L31is then considered as a master and L4 groups of L3j , j > 2are the slaves. The master L4 communicates with the pro-cess of corresponding ΩC and broadcast or gather data fromor to the slaves, as illustrated in Figure 6.

Figure 6: (in color) Schematic sketch for couplingNεκT αr-3D and DPD-LAMMPS. Cells correspondto processors of L3 sub-communicator of ΩN (blue)and L3j , j = 1, 2, 3 sub-communicator of ΩDL (green).Cells marked by colors with gradients represent pro-cessors of L4 sub-communicators. Communicationbetween the L4 processors of ΩN and ΩDL is via rootsof L4 communicators derived from corresponding L3and L31 communicators.
3.4 Processing non-stationary atomistic dataEnsemble average solution u(t,x) and thermal fluctua-
tions u′(t,x) of the velocity field are two very importantcharacteristic in analysis the atomistic simulation. However,computing these two parameters in non-stationarry processis extreamely difficult.
In stationary flow simulations the average solution u(x)is typically computed by sampling and averaging the trajec-tiories of the particles over a subdomain (bin) Ωp and over avery large time interval. In non-stationary flow simulations,an ensemble average u(t,x) is required, but it is not obvioushow to define a time interval T ≫ ∆t over which the solutioncan be averaged. It is possible to perform phase averaging, ifthe flow exhibits a limit cycle and integrate the solution overa large number of cycles. Constructing the ensemble basedon number of realizations Nr improves the accuracy by afactor of
√Nr. In our simulation we utilized about 130K
compute cores by the atomistic solver, doubling the numberof realisations would require more computational resourcesthan available, while resulting in only
√2 accuracy improve-
ment.To this end, we have developed a window proper orthogo-
nal decomposition (WPOD) of general atomistic simulationsthat leads to a significant reduction of the computationalload and enhances the quality of the numerical solutions.WPOD applied to the atomistic data computed in stochas-tic simulations helps to extract information on collective andcorrelated in time and space motion of particles. We will em-ploy the method of snapshots [?] and extend it to analyzea certain space-time window adaptively. A similar exten-sion but for continuum based systems was presented in [?],where WPOD was employed for the analysis of intermittentlaminar-turbulent flows.
In Figure 7 we present the results of DPD simulationsof healthy and diseased RBCs. The WPOD was appliedas a co-processing tool performing spectral analysis of thevelocity field to compute u(t,x) and u′(t,x).
In the following we briefly review the WPOD methodol-ogy. The WPOD is a spectral analysis tool based on trans-formation of the velocity field into orthogonal temporal andspatial modes: u(t,x) =
∑Npod ak(t)φk(x). The tempo-
Figure 7: (in color) DPD-simulation of healthy (red)and diseased RBCs (blue): application of WPOD.Ensemble average solution obtained with the stan-dard averaging and WPOD and probability densityfunction (PDF, bottom plot) of the streamwise ve-locity oscilations computed with WPOD. Red curvecorresponds to gaussian PDF with σ = 1.03.
ral modes are computed as the eigenvectors of correlationmatrix constructed from the inner product of velocity fields(snapshots) computed at different times. The velocity fieldsnapshots are computed by sampling (averaging) data overshort time-intervals, typically Nts = [50 500] time-steps.The data is sampled over spatial bins of a size comparableto the cut off radius rc. To compute the u(t,x) we analysethe eigenspectrum of the correlation matrix, specifically theconvergence rate of its eigenvalues λk. The high modes rep-resent small-scale features with very short correlation time,i.e., the thermal fluctuations, and convergence rate of thehigh modes is very slow. In contrast, the λk for the lowmodes converge very fast. We separate the POD eigenspec-trum based on the convergence rate of the modes. We canthen compute the ensemble average from the low most en-ergetic modes while the fluctuations (u′(t,x)) from the high
slowly decaying modes. The number of POD modes k re-
quired to compute u(t,x) =∑k=k
k=1ak(t)φk(x) is determined
adaptively by analysing the eigenspectrum.In Figure 8 we plot the POD eigenspectrum for two ve-
locity components in unsteady flow simulation. The differ-ence in the convergence rate of the low-order (correlated)modes and high-order (uncorrelated) modes is clear. Com-puted with WPOD u(t,x) was about one order of magnitudemore accurate than computed with standard averaging pro-ceedure. Comparable accuracy was acheived by performing25 concurent realizations, which demanded 25 times morecomputational resources. The smoother velocity field recon-structed with the WPOD allows better accuracy in predict-ing the mean wall shear stress, which is a very a importantquantity in biological flows.
3.5 Performance tuning and optimizaionThe exploit advantages of specific architectural differences
of modern supercomputers, we have carried out performancetuning of our computational kernels as well as communica-tion strategy to maximize the messaging rate. Specifically,our single core performance tuning is based on the fact that

Figure 8: (in color) DPD-simulation: 3D pipe flowdriven by a time-periodic force. Eigenspectra ofvelocity in x− (stream-wise velocity component,black dots) and y−direction (red crosses), and threePOD themporal modes. Right top - velocity pro-file (streamwise component) reconstructed with thefirst two POD modes. Nts = 50, Npod = 160
most microprocessors provide additional floating point hard-ware unit, which maximizes the floating point performancerate by executing SIMD instructions. In such, based onAMD Opteron microprocessors, the Cray XT5 supercom-puter can execute SIMD SSE instructions. Similarly, basedon PowerPC 450 microprocessor with special Double Hum-mer floating point unit, the Blue Gene/P supercomputer canexecute double FPU instructions. Both types of micropro-cessors set certain restrictions on the usage of SIMD instruc-tions (see details in References [2, 10]), which we address asfollows. Specifically, we focus on the following optimiza-tion tasks: a) proper data alignment is enforced by the useof posix memalign call to guarantee the memory allocationwith 16 bytes alignment for the most important data struc-tures; and b) a number of the kernel routines with high flopand/or memory access rate requirements are identified andstudied if they can benefit from SIMD instructions. We ei-ther explicitly instruct a compiler to automatically generatevector instructions (by providing proper pragmatic informa-tion with “#pragma” statements), or in such cases when acompiler cannot resolve dependencies, write SIMD specificcode with the use of compiler intrinsics. In many cases,additional optimization, such as loop unrolling is also re-quired. Results of our optimization for selected routinesare presented in Table 1. As one may see, we may gener-ally achieve a factor of 1.5 to 4 fold speed up depending ona routine. One should also mention that the benefit fromSIMD instructions is more pronounced when the data arelocated in cache, and therefore we pay special attention onkeeping the participating vectors in use as long as possible.
function speed-up factori = [0,N-1] Cray XT5 BG/P
z[i] = x[i] ∗ y[i] 2.00 3.40a =
∑i x[i] ∗ y[i] ∗ z[i] 2.53 1.60
a =∑
ix[i] ∗ y[i] ∗ y[i] 4.00 2.25
Table 1: SIMD performance tuning speed-up factor.
Blue Gene/P compute nodes are connected with three net-works that the application may use: a 3D torus networkthat provided point-to-point (p2p) messaging capability, acollective network which implements global broadcast-typeoperations, and a global interrupt network for fast barriersynchronizations.
On the 3D torus, packets are routed on an individual basiswith either deterministic or adaptive routing. With deter-ministic routing, all packets between a pair of nodes followthe same path along X,Y,Z dimensions in that order. Withadaptive routing, each packet can choose a different pathbased on the load on the torus router ports. The BG/P ar-chitecture also has a Direct Memory Access (DMA) engineto facilitate injecting and receiving packets to/from the net-work. To maximize the messaging rate, all 6 links of thetorus can be used simultaneously.
The Blue Gene/P specific implementation of the messageexchange library is implemented in NεκT αrGbased on theinformation provided by the personality structure, such asthe torus coordinates (X,Y,Z) of the node, the CPU id num-ber T within the node, and the coordinates of the p2p tar-gets. In particularly communication intensive routines, suchas a parallel block-sparse matrix-vector multiplication, wecreate a list of communicating pairs and schedule the com-munications so that at each time, the node have at least6 outstanding messages targeted all directions of the torussimultaneously. The incoming messages are processed onthe “first come, first served” basis. For partitioning of thecomputational domain into non-overlapping partitions weemploy the METIS PartGraphRecursive routine of theMETIS library [16]. In unstructured meshes a relativelyhigh number (O(10)−O(100)) of adjacent elements sharingvertex, edge and face may exist, hence the large volume ofp2p communications. To minimize the communication be-tween partitions we provide to METIS the full adjacencylist including elements sharing only one vertex. The weightsassociated with the links are scaled with respect to the num-ber of shared degrees of freedom per link. According to ourmeasurements, the topology-aware p2p communication al-gorithm reduces the overall run time for the application byabout 3 to 5% while using 1024 to 4096 compute cores ofBlue Gene/P. In Table 2 we compare the computational timerequired in simulations of a turbulent flow in carotid arterywhere: a) partitioning considers only elements sharing theface degrees of freedom and b) all neighbor elements aretaken into account.
N cores 512 1024 2048 4096a 1181.06 654.94 381.53 238.05b 1171.82 638.00 361.65 219.87
Table 2: BG/P Simulations with two partitionningstrategies: CPU-time (seconds) required for 1000time-steps.
4. RESULTSIn the following we present the performance ofNεκT αrG in
unsteady 3D flow simulations. The computations have beencarried on IBM BlueGene/P[?] (BG/P), CRAY-XT5[?] andSun Constellation Linux Cluster[?] computers. The supe-rior parallel performance in simulations with NεκT αr-3Dand multipatch decomposition compared to a single patch
is presented in [?]. The accuracy of the method is also dis-cussed in the same publication. Here we present scaling ob-tained in solving macro-scale flow problems with very largenumber of degrees of freedom.
4.1 PerformanceFirst, we consider a 3D flow problem in a very large com-
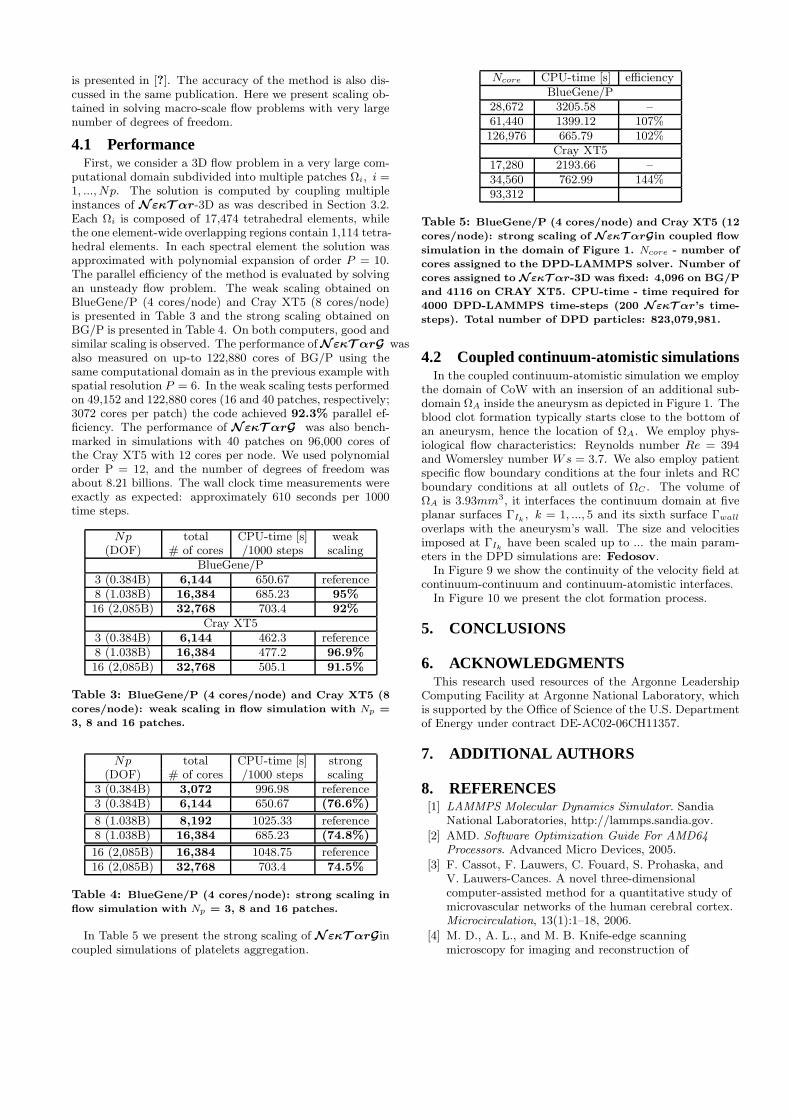
putational domain subdivided into multiple patches Ωi, i =1, ..., Np. The solution is computed by coupling multipleinstances of NεκT αr-3D as was described in Section 3.2.Each Ωi is composed of 17,474 tetrahedral elements, whilethe one element-wide overlapping regions contain 1,114 tetra-hedral elements. In each spectral element the solution wasapproximated with polynomial expansion of order P = 10.The parallel efficiency of the method is evaluated by solvingan unsteady flow problem. The weak scaling obtained onBlueGene/P (4 cores/node) and Cray XT5 (8 cores/node)is presented in Table 3 and the strong scaling obtained onBG/P is presented in Table 4. On both computers, good andsimilar scaling is observed. The performance ofNεκT αrG wasalso measured on up-to 122,880 cores of BG/P using thesame computational domain as in the previous example withspatial resolution P = 6. In the weak scaling tests performedon 49,152 and 122,880 cores (16 and 40 patches, respectively;3072 cores per patch) the code achieved 92.3% parallel ef-ficiency. The performance of NεκT αrG was also bench-marked in simulations with 40 patches on 96,000 cores ofthe Cray XT5 with 12 cores per node. We used polynomialorder P = 12, and the number of degrees of freedom wasabout 8.21 billions. The wall clock time measurements wereexactly as expected: approximately 610 seconds per 1000time steps.
Np total CPU-time [s] weak(DOF) # of cores /1000 steps scaling
BlueGene/P3 (0.384B) 6,144 650.67 reference8 (1.038B) 16,384 685.23 95%16 (2,085B) 32,768 703.4 92%
Cray XT53 (0.384B) 6,144 462.3 reference8 (1.038B) 16,384 477.2 96.9%16 (2,085B) 32,768 505.1 91.5%
Table 3: BlueGene/P (4 cores/node) and Cray XT5 (8
cores/node): weak scaling in flow simulation with Np =
3, 8 and 16 patches.
Np total CPU-time [s] strong(DOF) # of cores /1000 steps scaling
3 (0.384B) 3,072 996.98 reference3 (0.384B) 6,144 650.67 (76.6%)
8 (1.038B) 8,192 1025.33 reference8 (1.038B) 16,384 685.23 (74.8%)
16 (2,085B) 16,384 1048.75 reference16 (2,085B) 32,768 703.4 74.5%
Table 4: BlueGene/P (4 cores/node): strong scaling in
flow simulation with Np = 3, 8 and 16 patches.
In Table 5 we present the strong scaling of NεκT αrGincoupled simulations of platelets aggregation.
Ncore CPU-time [s] efficiencyBlueGene/P
28,672 3205.58 –61,440 1399.12 107%126,976 665.79 102%
Cray XT517,280 2193.66 –34,560 762.99 144%93,312
Table 5: BlueGene/P (4 cores/node) and Cray XT5 (12
cores/node): strong scaling of NεκT αrGin coupled flow
simulation in the domain of Figure 1. Ncore - number of
cores assigned to the DPD-LAMMPS solver. Number of
cores assigned to NεκT αr-3D was fixed: 4,096 on BG/P
and 4116 on CRAY XT5. CPU-time - time required for
4000 DPD-LAMMPS time-steps (200 NεκT αr’s time-
steps). Total number of DPD particles: 823,079,981.
4.2 Coupled continuum-atomistic simulationsIn the coupled continuum-atomistic simulation we employ
the domain of CoW with an insersion of an additional sub-domain ΩA inside the aneurysm as depicted in Figure 1. Theblood clot formation typically starts close to the bottom ofan aneurysm, hence the location of ΩA. We employ phys-iological flow characteristics: Reynolds number Re = 394and Womersley number Ws = 3.7. We also employ patientspecific flow boundary conditions at the four inlets and RCboundary conditions at all outlets of ΩC . The volume ofΩA is 3.93mm3, it interfaces the continuum domain at fiveplanar surfaces ΓIk , k = 1, ..., 5 and its sixth surface Γwall
overlaps with the aneurysm’s wall. The size and velocitiesimposed at ΓIk have been scaled up to ... the main param-eters in the DPD simulations are: Fedosov.
In Figure 9 we show the continuity of the velocity field atcontinuum-continuum and continuum-atomistic interfaces.
In Figure 10 we present the clot formation process.
5. CONCLUSIONS
6. ACKNOWLEDGMENTSThis research used resources of the Argonne Leadership
Computing Facility at Argonne National Laboratory, whichis supported by the Office of Science of the U.S. Departmentof Energy under contract DE-AC02-06CH11357.
7. ADDITIONAL AUTHORS
8. REFERENCES[1] LAMMPS Molecular Dynamics Simulator. Sandia
National Laboratories, http://lammps.sandia.gov.
[2] AMD. Software Optimization Guide For AMD64
Processors. Advanced Micro Devices, 2005.
[3] F. Cassot, F. Lauwers, C. Fouard, S. Prohaska, andV. Lauwers-Cances. A novel three-dimensionalcomputer-assisted method for a quantitative study ofmicrovascular networks of the human cerebral cortex.Microcirculation, 13(1):1–18, 2006.
[4] M. D., A. L., and M. B. Knife-edge scanningmicroscopy for imaging and reconstruction of

Figure 9: Brain vasculature, coupled continuum-atomistic simulation: countours of pressure andvelocity at y− direction at sub-domain interfaces.Streamlines and vectors depict instanteneous flowdirection. Re = 394, Ws = 3.75.
three-dimensional anatomical structures of the mousebrain. J. of Microscopy, 231(1):134–143, 2008.
[5] R. Fahraeus and T. Lindqvist. Viscosity of blood innarrow capillary tubes. The American Journal of
Physics, 96:562–568, 1931.
[6] D. A. Fedosov, B. Caswell, A. S. Popel, and G. E.Karniadakis. Blood flow and cell-free layer inmicrovessels. Microcirculation, 17:615–628, 2010.
[7] D. A. Fedosov and G. E. Karniadakis. Triple-decker:Interfacing atomistic-mesoscopic-continuum flowregimes. Journal of Computational Physics,228:1157–1171, 2009.
[8] R. D. Groot and P. B. Warren. Dissipative particledynamics: Bridging the gap between atomistic andmesoscopic simulation. Journal of Chemical Physics,107(11):4423–4435, 1997.
[9] P. J. Hoogerbrugge and J. M. V. A. Koelman.Simulating microscopic hydrodynamic phenomenawith dissipative particle dynamics. EurophysicsLetters, 19(3):155–160, 1992.
[10] IBM. Using the IBM XL Compilers for Blue Gene.International Business Machines Corporation, 2007.
[11] H. Lei, D. A. Fedosov, and G. E. Karniadakis.Time-dependent and out bow boundary conditions fordissipative particle dynamics. Journal ofComputational Physics, 230:3765–3779, 2011.
[12] J. L. McWhirter, H. Noguchi, and G. Gompper.Flow-induced clustering and alignment of vesicles andred blood cells in microcapillaries. Proceedings of the
National Academy of Sciences USA,106(15):6039–6043, 2009.
[13] I. V. Pivkin, P. D. Richardson, and G. E. Karniadakis.Blood flow velocity effects and role of activation delaytime on growth and form of platelet thrombi.
Figure 10: Brain vasculature, coupled continuum-atomistic simulation: Platlets aggregation on thewall of aneurysm. Yellow spheres - active platelets,red spheres - inactive platelets. Streamlines depictinstantaneous velocity field. Re = 394, Ws = 3.75.
Proceedings of the National Academy of Sciences USA,103(46):17164–17169, 2006.
[14] A. R. Pries, D. Neuhaus, and P. Gaehtgens. Bloodviscosity in tube flow: dependence on diameter andhematocrit. American Journal of Physiology,263(6):H1770–H1778, 1992.
[15] W. Reinke, P. Gaehtgens, and P. C. Johnson. Bloodviscosity in small tubes: effect of shear rate,aggregation, and sedimentation. American Journal of
Physiology, 253:H540–H547, 1987.
[16] K. Schloegel, G. Karypis, and V. Kumar. Parallelstatic and dynamic multi-constraint graphpartitioning. Concurrency and Computation: Practice
and Experience, 14(3):219–240, 2002.


![arXiv:1411.4980v1 [q-bio.NC] 18 Nov 2014Keywords: Hybrid stochastic-deterministic simulations, hybrid spatial nonspatial simulations, multiscale simulation, rule-based models, com-](https://img.dokumen.tips/doc/110x75/60fb398067de066b2a7ebf18/arxiv14114980v1-q-bionc-18-nov-2014-keywords-hybrid-stochastic-deterministic.jpg)