Embed Size (px)
DESCRIPTION
Jiqing Tan
Citation preview

- 21 -
http://www.ivypub.org/RSS/
Remote Sensing Science August 2013, Volume 1, Issue 2, PP.21-26
A New Classification of Typhoons over Western
North Pacific Jiqing Tan
Earth Science Department, Zhejiang University, Hangzhou 310027, P.R. China
Email: [email protected]
Abstract
After the classification of typhoons by Coching Chu has been replaced by Saffir-Simpson Hurricane Scale (SSHS) method in
China for about 40 years, forecasters have found SSHS method worked badly in some situations. Some forecasters in USA
complained about SSHS worked too badly and claimed to call for new classification method of hurricanes in 2006. Here in this
paper, a new classification method of typhoons from the idea of the Coching Chu in 1924 based on the diagnostic results of
statistic characteristic of typhoon activity from 1949 to 2009 has been developed. This new classification method works very well
and the negative correlated relationship between the annual total numbers of typhoons at two categories (category 1 and category
2), in addition, the positive correlated relationship between the annual total number of sub-categories 3D typhoons and the annual
total number of Niño-3.4 SST anomalies have also been found .
Keywords: Typhoon; Saffir-Simpson Hurricane Scale; Classification Method; SST; El Niño
1 INTRODUCTION
―A typhoon‖ is the nickname of a tropical cyclone (TC) over the Western North Pacific (WNP) just as ―a hurricane‖
for a TC over the Atlantic Ocean. Results of the study on the characteristic of the typhoon activity (TA) in a period
of time have usually been the evidence to explore the mechanism of the formation of TC (Palmen, 1948; Riehl, 1948,
1950; Sawer, 1947; Syono, 1951; Haque, 1952; Lily, 1960; Charney and Eliassen, 1964: Kuo, 1965; Yanai, 1961;
Ooyama, 1969; Pederson and Rasmussen, 1985; Emanuel, 1991). Therefore, the inaccuracy of the method describing
TA and classifying TCs would lead to misunderstanding of the true mechanism of the formation of TCs.
The earliest classification of typhoons with modern climatological method can be traced back to the classification of
typhoons by Coching Chu (1924). Because of the difficulties in being applied to other regions where TCs occur over
Atlantic Ocean, India Ocean and South Pacific Ocean, the earliest classification of typhoons by Coching Chu has
been replaced by the Saffir–Simpson Hurricane Scale (SSHS) method. After SSHS has been used for more than 40
years, however, many forecasters distrusted the SSHS and called for new classification of hurricanes
(www.livescience. com/1521-forecasters-call-hurricane-classification.html). Many experts on typhoons have also
criticized the method as being too simplistic. For example, Kantha (2006, 2008) complained that the SSHS is only a
valuable tool in warning hurricanes, but the level of surge and surge-related damage is not well correlated with the
maximum wind speeds at landfall. Recently, Thomas et al (2010) pointed out that the investigation of TCs and
climate change has often been obtained with conflicting results. Therefore, a more accurate quantity reflects TA and
a more accurate classification method of TCs are needed at this stage. Here in this paper, a new classification method
of typhoons has been developed from the idea of Coching Chu in 1924; by introducing a more accurate diagnostic
quantity to reflect TA.
2 DATA AND METHODS
2.1 Data
The data used in this paper is best-track data of TCs (positions and intensity) (see: http://www.jma.go.jp/jma/jma-

- 22 -
http://www.ivypub.org/RSS/
eng/jma-center/rsmc-hp-pub-eg/besttrack. html)
2.2 The Method to characterize “Typhoon Activity”
FIG. 1 ANNUAL OCCURRENCES OF TYPHOONS OVER WESTERN NORTH PACIFIC FROM 1949 TO 2008
Traditional way of diagnostic analysis of annual TA is to use the annual total numbers of typhoons over the WNP
(see Figure 1). From this figure, the activity of typhoons in the first periods from 1949 to 1978 is considered to be
stronger than the periods from 1979 to 2008. From Figure 1, it could be seen that the year of 2005 is one of the
weakest years for TA. However, 2005 is considered to be one of the strongest years of TA because some very
stronger landing typhoons, such as Matsa, Longwan and Haitang typhoons occurred in 2005. Therefore, the annual
total numbers of typhoons cannot be a good diagnostic quantity to reflect the strength of the TA in a year. Tan Jiqing
et al (2011) put forward a new diagnostic quantity, called ―Most Direct Impact Area‖ (MDIA) to reflect the TA in a
year. MDIA of typhoons is better because MDIA can reveal the characteristic of geographic distribution of TCs. The
method to calculate MDIA can also be seen in the literature (Tan et al, 2011). Here, we show the results of the
geographic distribution of MDIA of two periods. Figure 2 is the geographic distribution of MDIA of the periods
from 1949 to 1978 and Figure 3 is the geographic distribution of MDIA of the periods from 1979 to 2008.
Comparing figure 2 with figure 3, we draw the conclusion that typhoon activities in the period from 1979 to 2008 is
much stronger than those in the period from 1949 to 1978.
FIG. 2 The geographic Distribution of MDIA (1949-1978) FIG. 2 The geographic Distribution of MDIA (1979-2008)
2.3 New Method to Classify Typhoons
Figure 4 is the geographic distribution of MDIA in 61 years over the Northwest Pacific Ocean calculated based on
- 23 -
http://www.ivypub.org/RSS/
the track data of all the tropical cyclones from 1949 to 2009. From figure 4, we can clearly see that five MDIA
centres: the first is located in the region east of Japan islands, the second is located in the region south of Japan
islands, the third is located in the region east of the Philippines islands, the fourth is located in the region over China
sea and the fifth is located in the region east of Taiwan.
FIG. 4 THE GEOGRAPHIC DISTRIBUTION OF MDIA IN 61 YEARS (1949-2009)
From figure 4, it can also be seen that the geographic distribution of MDIA in 61 years is shaped as "L", which is the
result for typhoons moving along the atmospheric environment background wind field of the western Pacific
subtropical high. Thus, we define two baselines are defined: one is a parallel to the coastline of China Mainland from
the point A (170 W, 60 N) to the point B (120 E, 20 N), the other straight line begin at point C (180 E, 10 S) and
cross point B. Therefore, geographic distribution of MDIA in 61 years can be divided into four regions (see Figure 4).
According to the idea of the typhoon classification by Coching Chu, that is to identify different categories of
typhoons based on the beginning points and dead points of tropical cyclones, we define four major categories of
typhoons are defined. The method in detail lists below:
1) Typhoons are divided into four categories according to the locations of the dead points for typhoons. For example,
category 1 typhoons mean that the locations of the dead points for typhoons are in region 1, and so on.
2) Sub-categories of the same category are divided into A,B,C and D sub-categories according to the locations of the
beginning point for a typhoon. For example, 1A typhoon means that both the locations of dead point of a typhoon
and beginning point of a typhoon are at region 1. 1B typhoon means that the location of dead point of a typhoon is at
region 1, but the location of the beginning point of a typhoon is at region 2, and so on.
3 RESULTS
3.1 Statistic results for different categories and sub-categories
TABLE 1 STATISTICAL RESULT FOR DIFFERENT CATEGORIES AND SUB-CATEGORIES OF TYPHOONS IN 61 YEARS
A B C D Total
Category 1 55 29 110 377 571
Category 2 9 79 299 122 509
Category 3 0 1 144 69 214
Category 4 9 11 117 666 803
From table 1, we could obtain following viewpoints:
A) Most of typhoons belong to 4D typhoons, which begin in region 4 and end in region 4.They take 82.9% of
category 4 and 31.8% of all typhoons in 61 years. Therefore, the annual trend of this sub-category is very important
- 24 -
http://www.ivypub.org/RSS/
for us to judge the trend of climate change over tropic region.
B) The numbers of 2A, 3A ,4A ,1B,3B and 4B typhoons are very small, which meaning that rare typhoons begin in
offshore, and end in No:2 ,No:3 and NO;4 region. Study on those typhoons beginning at offshore is valuable for us
to understanding special behaviour of typhoons.
C) Because of the background wind of sub-tropical High over northwest Pacific Ocean, most typhoons begin over
No.3 and No.4 regions. Therefore, 1C, 1D, 2C, 2D, 3C and 3D typhoons should be concerned more than other sub-
category typhoons, which take about 53% of all the typhoons in 61 years.
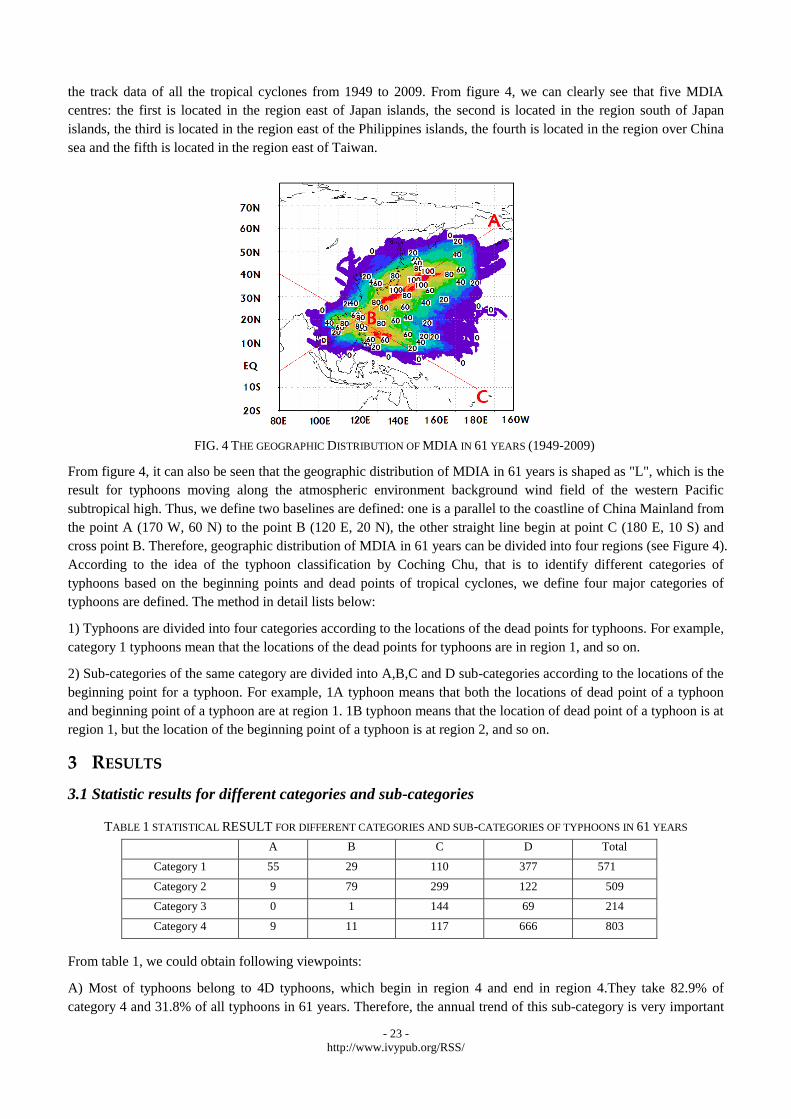
3.2 The Geographic Distribution of MDIA in 61 Years for Different Categories
(a) (b)
(c) (d)
FIG. 5 THE GEOGRAPHIC DISTRIBUTION OF MDIA OF FOUR CATEGORIES IN 61 YEARS (1949-2009)
From Fig. 5a to Fig. 5d, we could see that typhoons of different categories have different MDIA, which show the
different active regions: Over Japan and Mainland China are affected by typhoons at categories 1 (see figure fig.5a).
Over Southwest of China and Northern part of China Sea are affected by typhoons at categories 2 (see fig.5b). Over
the Philippines islands and the middle of China Sea are affected by typhoons at categories 3 (see fig. 5c). Most of
typhoons at category 4 affect over the Northwest part of the Pacific Ocean (see fig.5d).
3.2 The statistic annual total numbers for different categories
Figure 6 is the annual variation of occurrence of typhoons in different categories in the period from 1949 to 2009.

- 25 -
http://www.ivypub.org/RSS/
From this figure, it can be seen that the annual total numbers of typhoons in category 1 and 2 are valley values
during the ten El Niño years (1951, 1957, 1963, 1965, 1969, 1977, 1983, 1987 and 1993).
FIG. 6 THE GEOGRAPHIC DISTRIBUTION OF MDIA IN 61 YEARS (1949-2009)
3.4 The relationship between typhoons activity and El Niño
In order to investigate the relationship between typhoons activity and El Niño, we have calculated the coefficients
between the annual total of Niño3.4 index and the annual total number of all typhoons in different sub-categories,
(see table 2).
TABLE 2 THE CORRELATION COEFFICIENTS BETWEEN THE ANNUAL OCCURRENCES OF TYPHOONS AND ANNUAL TOTAL SUM
OF NIÑO 3.4 INDEX FROM 1949 TO 2009
B C D Total
Category 1 -0.277 — -0.175 -0.312 -0.389
Category 2 — -0.217 -0.217 — -0.264
Category 3 — — -0.215 0.256 —
Category 4 — — -0.243 — —
* Only those correlations are significant at 99% confidence level are marked in Table.
From Table 2, it can be seen that the correlation coefficients between the annual total of Niño3.4 index and the total
annual numbers of category 1 and 2 between El Niño are negative, so do the correlation coefficients between the
annual total of Niño3.4 index and most of sub-categories. Only the correlation coefficients between the annual total
of El Niño3.4 index and 3D are positive.
4 RESULTS
The old classification of typhoons by Coching Chu had been replaced by Saffir-Simpson hurricane scale in 1971
because the latter can be easily applied for tropical cyclones over all the regions while the former can be used only
over WNP. However, with more and more defects of SSHS have been found, it is time to re-consideration of the old
classification of typhoons by Coching Chu. Because there are too many qualitative standards for categories in the
classification by Coching Chu, a new quantitative standard for categories and sub-categories has been developed.
Results of statistic analysis on all the track data of typhoons from 1949 to 2009 show that the classification of
typhoons works well and the relationship between typhoons and El Niño have been found. In near future, we would
apply this classification on identifying the tropical cyclones over Atlantic Ocean, India Ocean and South Pacific
Ocean.
ACKNOWLEDGMENT
This paper is supported by Natural Science Foundation of China. The project granted number is 40875091.
- 26 -
http://www.ivypub.org/RSS/
REFERENCES
[1] Palmen, E. ―On the formation and structure of Tropical Hurricanes, Geophysica‖, 3(1948): 26-38
[2] Riehl,H. ―On the formation of Typhoons. J. Met‖. 5(1948): 254-264
[3] Riehl, H.. ―A model of Hurricane Formation‖. J.Appl.Phys.21(1950): 917-925
[4] Sawer, S. ―Notes on the Theory of Tropical Cyclones‖. Q.J.R.M.S.73(1947): 101-126
[5] Syono, S. ―On the strucyure of Atmospheric Vortuces‖. J. Met. 22(1951): 103-119
[6] Haque, S.M.A., ―Initial of cyclonic circulation in a vertically unstable stagnant air mass‖.Quart. J. R. Meteo. Society, 78(1952):
394-406
[7] Lily, D.K., ―On the theory of Disturbances in a conditionally unstable atmosphere‖. Mon.Wea.Rev.,88(1960): 1-17
[8] Charney, J., and A. Eliassen, ―On the growth of the hurricane depression‖. J. Atmos. SCI., 21(1964): 68-75
[9] Kuo H.L. ―On Formation and Intensification of Tropical Cyclones through Latent Heat Release by Cumulus Convection‖. J.
Atmos. SCI. 22(1965): 40-63
[10] Yanai, M. ―A detail analysis of typhoon formation‖. J. Meteor. Soc. Japan, 39(1961): 187-213
[11] Ooyama, K., ―Numerical simulation of the life cycle of tropical cyclones‖. J. Atmos.Sci.,26(1969): 3-40
[12] Pederson, T.S and E. Rasmussen, ―On the cut-off problem in linear cisk models‖. Tellus.37A(1985): 394-402
[13] Emanuel, K, ―The finite-amplitude nature of tropical cyclogensis‖. J. Atmos. Sci., 46(1991): 3431-3456
[14] Chu, C.C. ―A new classification of typhoons of the Far East. Monthly Weather Review‖. 52(1924): 136-139
[15] Chu, C.C. ―The place of origin and recurvature of typhoons‖. Monthly Weather Review, 53(1925): 1-5
[16] Kantha, L. ―Time to Replace the Saffir–Simpson Hurricane Scale?‖ Eos 87(2006): 3-6
[17] Kantha, L. ―Tropical Cyclone Destructive Potential by Integrated Kinetic Energy‖. Bulletin of the American Meteorological Society,
89(2008): 219-221.
[18] Thomas R. and Coauthors. ―Tropical Cyclones and Climate Change‖. Nature Geosciences, 3(2010): 157-163
[19] Tan J.Q, H.Q. Li and Z.X. Zheng, ―New Climate Diagnostic Method of Activity of Typhoons over the Northwestern Pacific
Ocean Applied Mechanics and Materials‖. 71-78(2011): 3118- 3122
AUTHOR
Jiqing Tan, Associate Professor of
Zhejiang University. 1980-1984, BS of
Zhongshan University, Guangzhou, China;
1989-1993, PhD in Inst. of Atmospheric
Physics, Chinese Academia of Science,
Beijing, China. Research fields: Dynamics
of Meteorology; Environment Meteorology;
Synoptic meteorology; Climatology. He once worked in Peking
University as a postdoctoral researcher from 1993-1995 and
worked as a lecture in the department of geophysics department
of Peking University from 1995 to 1996. Later he worked in
NMC, CMA as an associate meteorologist from 1996 to 2000.
During the period from 200 to 2002, he worked as a
meteorologist in MRI, JMA in Japan. Since 2002, he has been an
associate professor in the Earth Science Department, Zhejiang
University. He has published about 40 papers which cover at
least four directions in the fields of atmospheric sciences as the
first paragraph of this resume indicates.
He has also been the chairman of three projects supported by
National Natural Science Foundation of China, the granted
numbers are: (40345025; 40475043&40875091)