Embed Size (px)
Citation preview

White Paper
A new class of performance and profitabilityClass 4 Microwave Backhaul Antennas promise greater capacity and financial opportunities for operators
John Cole, Dipesh Rattan, Brian Eichenser, Donald Gardner
January 2015

2
Executive Summary 3
Introduction 4
Method 5
Results 6
Over $5m TCO saved over five years 6
$44k TCO saved in license fees 8
$4.5m TCO savings based on a wider frequency channel opportunity 9
iQ.link®XG analysis process description 9
Summary of analysis results for all the links in the 40GHz band 9
3,000 more links 10
582-hour QoS (dropped call) improvement 13
31 percent of failed links in 10GHz were assigned a channel 14
Reducing antenna size and TCO tower lease cost 15
Antennas 16
Sample performance findings by vendor 16
The environment 18
Antenna appearances can be deceiving 18
Conclusion 18
Recommendations 19
Contents

3
Executive summaryIn designing a microwave link, a link planning engineer accepts the statement of compliance provided by the antenna manufacturer and utilizes the declared information to ensure that every link delivers the planned performance—including data throughput, and hence the associated revenue—at the expected level. Therefore, it is critical that antennas deployed meet their published specifications.
In 2009, CommScope undertook an exhaustive study on microwave radio link backhaul antenna performance. Sample antennas were obtained on the open market from every manufacturer known to be providing backhaul point-to-point (dish) antennas to the industry at that time. The results showed that a significant proportion of antennas were substantially non-compliant to their published specification (mainly the declared sidelobe or off-axis gain performance along with cross-polar performance). Furthermore, it was noted that antennas exhibited changing performance with the sidelobe or off-axis gain performance degrading over time. Of course, this is bad news for the industry because the declared sidelobe or off-axis gain affects link performance and, therefore, capacity. It is a statement on the interference threat that one link presents to another. If interference does occur, then link availability and capacity—and hence data throughput—are compromised, leading to a reduction in the operator’s revenue.
In response to the findings of this study, CommScope examined the cost to the network operator in terms of capacity and quality of service (QoS). Unsurprisingly, it was found that both were negatively impacted; however, in addition, there were significant constraints on the ability to reuse spectrum (frequency reuse), potentially limiting the number of links that can be deployed for a given amount of spectrum.
CommScope then chose to investigate the potential benefits to capacity and QoS when antennas were overly compliant, offering substantially better than specified performance. In this case, moving from the industry standard European Telecommunications Standards Institute (ETSI) Class 3 to Class 4.
The outcome has been shown to be surprisingly positive, especially where spectrum availability is constrained and where frequency reuse is important.
In 2010, as a consequence of these investigations, CommScope launched a family of antennas that do, in fact, offer significant improvement over existing sidelobe or off-axis gain standards.
In conjunction with EE (and in agreement with H3G), and using iQ.link®XG link planning
software from Comsearch, CommScope studied the benefits of deploying these new antennas in a real network.
On two frequency bands in the network of approximately 4,000 and 2,000 links, the core findings were:
• Over $5m in total cost of ownership (TCO) saved over five years
• $44k TCO saved in license fees over five years
• $4.5m TCO per year based on optimizing capacity by freeing congested channels
• 3,000 more radio links can be added to the network—when none had been possible before
• 582-hour QoS (dropped call) improvement
• 96 percent and 31 percent of frequency congested links in 40 and 10 GHz respectively were assigned a channel
• A strong opportunity to trade some of the above by reducing antenna size and thus reducing TCO on tower lease costs.
AcknowledgementsCommScope would like to thank Andy Sutton, Principal Network Architect at EE along with Baljit Panesar and Steve Odell, Senior Designers, Mobile Backhaul Infrastructure Design at EE for their support and expertise in the development of this white paper.
4
It should be noted that every network will benefit differently when designed with the better antennas. These results suggest that microwave link planners should seriously consider using better antennas or, at least, modelling their network with the improved specifications as validation of their current implementation efficiency.
The opportunity coming from utilizing better antennas highlights the risks associated with using inferior ones. CommScope found that, when poor-quality antennas are used, the design objectives for radio links are not met. As a result, many networks underperform or do not meet their design capacity as data throughput demands rise. This adversely affects the subscriber experience and, consequently, may contribute to increased churn of mobile customers.
IntroductionBack in the 1990s, as the use of mobile phones exploded, the demand for better signal coverage drove the need for more cell towers. Everywhere you looked, it seemed that another cell tower was being erected.
Today, signal coverage is still as relevant as ever, but the demand for ever-higher capacity data gives rise to a new discussion on the importance of the antennas—the critical, yet often understated, component of the microwave radio system.
This paper is focussed on microwave line-of-sight point-to-point (P2P) wireless radio backhaul, and the planning or coordination of P2P links. It shows the extraordinary opportunity that improved antenna performance offers the backhaul network operator, as well as the threats posed by using inferior antennas. P2P wireless backhaul refers to signal transportation from the cell tower to another place, often a rooftop or second tower, and ultimately into the core fibre networks.
As an indicator of the importance of this subject, it is worth pointing out that more than half of the world’s cell-site backhaul is accomplished using microwave radios with parabolic dish antennas. Additionally, P2P microwave radio links are employed in a wide range of applications—all of which benefit from better antennas.
The dish antenna’s performance has become a compelling opportunity as well as a significant threat to QoS. Its anonymity and lack of control has led to QoS problems, as well as P2P links that cannot possibly deliver their design capacity, particularly given the increased use of adaptive coding and modulation. In the face of growing capacity demands—particularly the exponential growth of mobile video applications—the performance of the antenna in backhaul applications can no longer be ignored.
This paper will explain two crucial trends in the P2P antenna industry. One is optimistic and the other pessimistic. The root topics are link planning—i.e., signal-to-noise (S/N) coordination—and antenna design and manufacturing integrity.
5
MethodThe P2P microwave wireless backhaul network evaluated in this study is located in the United Kingdom and is shared by two organizations, EE and H3G. It is managed by MBNL, an organization originally formed by T-Mobile UK and H3G to consolidate their 3G access networks (the mobile masts and infrastructure that connect to each operator’s separate core network). In turn, MBNL subcontracts the majority of the network planning and implementation to third-party managed service partners. CommScope is indebted to EE and H3G for the provision of planning data such as link length, location coordinates used, antenna heights, frequencies utilized, radios used and antenna types.
In all cases, the antennas were declared as conforming to the de facto sidelobe or off-axis gain standard, the ETSI Class 3 specification.
As a group, MBNL owned Fixed Services spectrum in three bands, 10.5, 32 and 40 GHz. It is entirely in their interest to reuse this spectrum as much as possible because, if they were to use spectrum outside these bands, they would incur substantial additional operating costs.
Maximizing spectrum reuse in any given geographic area is therefore essential—and any proposed technique to accomplish maximum spectral density in this way is of obvious value. The CommScope proposal for better antennas served as the trigger for the work herein.
EE and CommScope evaluated the impact on network performance of the new ETSI Class 4 Sentinel® antennas from their Andrew solutions portfolio compared to existing Class 3 antennas for the same frequency bands and antenna diameters. A simulation of network interference and other key performance parameters using Sentinel antennas and existing Class 3 antennas was conducted in order to assess their respective impacts on network throughput.
This network case study was done on MBNL’s microwave backhaul network of 6,259 links in the United Kingdom that operate in the 40 and 10 GHz frequency bands. Comsearch’s iQ.link®
XG, an industry-leading microwave planning and optimization tool, was used to model the network.
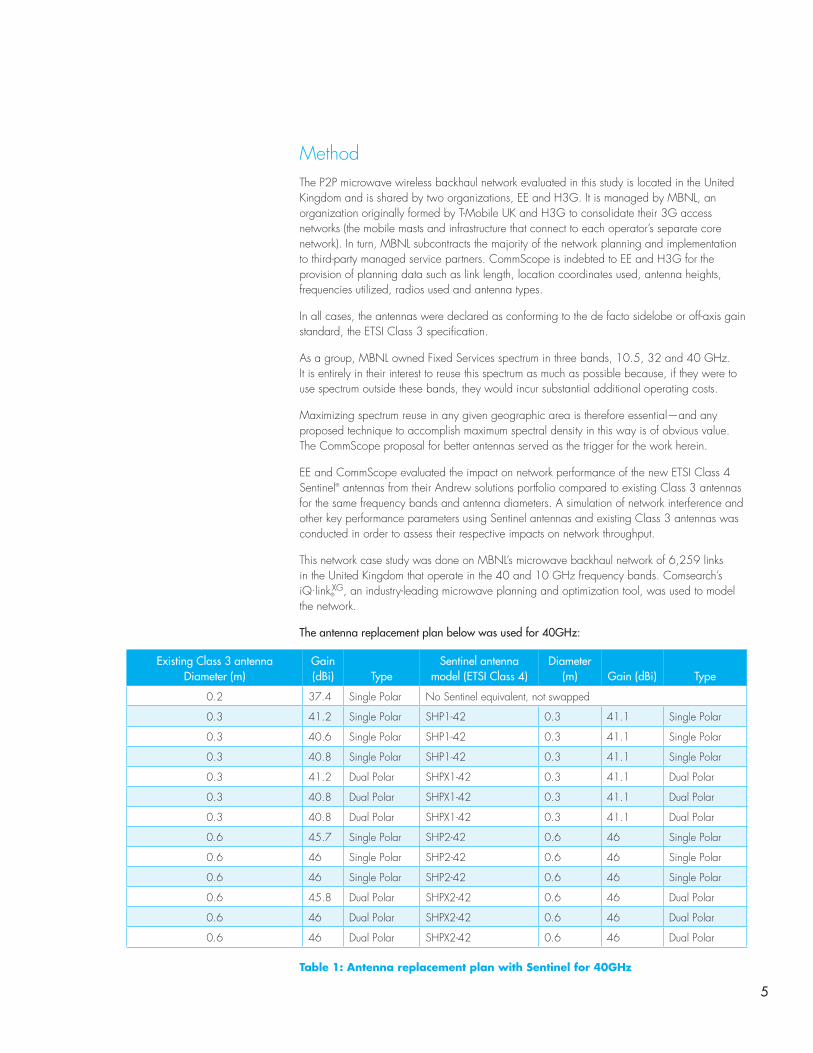
The antenna replacement plan below was used for 40GHz:
Table 1: Antenna replacement plan with Sentinel for 40GHz
Existing Class 3 antenna Diameter (m)
Gain (dBi) Type
Sentinel antenna model (ETSI Class 4)
Diameter (m) Gain (dBi) Type
0.2 37.4 Single Polar No Sentinel equivalent, not swapped
0.3 41.2 Single Polar SHP1-42 0.3 41.1 Single Polar
0.3 40.6 Single Polar SHP1-42 0.3 41.1 Single Polar
0.3 40.8 Single Polar SHP1-42 0.3 41.1 Single Polar
0.3 41.2 Dual Polar SHPX1-42 0.3 41.1 Dual Polar
0.3 40.8 Dual Polar SHPX1-42 0.3 41.1 Dual Polar
0.3 40.8 Dual Polar SHPX1-42 0.3 41.1 Dual Polar
0.6 45.7 Single Polar SHP2-42 0.6 46 Single Polar
0.6 46 Single Polar SHP2-42 0.6 46 Single Polar
0.6 46 Single Polar SHP2-42 0.6 46 Single Polar
0.6 45.8 Dual Polar SHPX2-42 0.6 46 Dual Polar
0.6 46 Dual Polar SHPX2-42 0.6 46 Dual Polar
0.6 46 Dual Polar SHPX2-42 0.6 46 Dual Polar

6
ResultsThe sections below detail the results achieved by replacing the existing Class 3 antennas with Sentinel Class 4 antennas.
Over $5m TCO saved over 5 years This section details how MBNL could potentially save $70,000 per link in operating expenses (OpEx) by turning on microwave links in the available spectrum using Sentinel instead of using leased Ethernet lines for backhaul.
This scenario evaluated the impact of Sentinel Class 4 antennas on the network performance of “failed links” reported by MBNL. Failed links are defined as links that are not deployed due to frequency congestion. In other words, the links that cannot be assigned a channel due to interference and availability objectives not being met in the available spectrum.
Figure 1: Radiation pattern for Sentinel compared with Class 3 antenna
Figure 1 shows the distribution of energy 360 degrees off axis for the existing 40GHz 0.3 m Class 3 antennas (blue) in MBNL’s network compared to the Sentinel 40GHz 0.3 m Class 4 antenna (red).
The shape described in Figure 1 is called the radiation pattern envelope (RPE) for the P2P microwave antennas and is declared by the antenna manufacturer.
Existing Class 3
Gai
n (d
Bi)
Off Axis Angle (deg)
Sentinel Class 4
-180 -80 -30
50
40
30
20
10
0
-20
-10
-30
20 70 120 170 -130
Co-Polar Gain Comparision

7
Figure 2 shows the improvement in signal-to-noise ratio with a Sentinel antenna. It represents the improvement in discrimination vs. off-axis angle.
Figure 2: Interference rejection of Sentinel antenna
Table 2 is a summary of failed links vs. potential improvement achieved with Sentinel. EE reported 148 failed links in the 10GHz frequency band and 44 failed links in the 40GHz frequency band using existing Class 3 antennas for microwave backhaul.
Once the existing Class 3 antennas were replaced by Sentinel as detailed in Table 1—and the network re-analyzed using iQ.link®
XG—the total number of failed links that were recovered or “fixed” is:
• 46 links in the 10GHz band • 42 links in the 40GHz band
This implies a 31 percent and 96 percent improvement in 10GHz and 40GHz bands, respectively.
The number of recovered 40GHz links is greater than recovered 10GHz links in the same geographic boundary. This is due to the higher density of 40GHz links in a given area and the larger number of available channels in the 40GHz band.
In other words, there were fewer opportunities to improve the 10GHz links because there were fewer links within the specific geographic boundary and a limited number of channels to reuse.
At a minimum, 192 links failed in both 40GHz and 10GHz frequency bands as reported by EE. These links were not operational with existing Class 3 antennas due to microwave signal frequency congestion. EE would therefore have two choices to deploy backhaul in these frequency-congested zones:
1. Use Ethernet lease lines for backhaul
2. Buy additional licenses for a minimum of two channels from OfCom* (*If spectrum is available)—to remove frequency congestion with existing antennas
However, by using Sentinel Class 4 antennas on the failed links, a minimum of 88 of these total 192 failed microwave links can be recovered in the available spectrum.
MBNL Report Summary
Frequency Band 10GHz 40GHz
Total failed links* 148 44
Operational links with Sentinel 46 42
Improvements with Sentinel 31% 96%
Table 2: Summary of improvement in MBNL failed links with Sentinel
Inte
rfere
nce
Reje
ctio
n (d
B)
Off Axis Angle (deg)
-180 -80 -30
1513
11
9
7
5
3
1
-1 20 70 120 170 -130
Inteference Improvement of Class 4, over Class 3

8
Cost trends, ethernet leased lines vs. microwave backhaul
Figure 3: EE TCO model of Ethernet vs microwave backhaul
The TCO model for EE suggests there are significant cost savings in using microwave radio link compared to Ethernet lease lines for backhaul. Figure 3 represents the opportunity to minimise the TCO in the MBNL backhaul network by having the optimal balance between Ethernet leased lines and microwave radios.
According to established EE models, the TCO for a microwave radio link is $23,000 over five years; for Ethernet backhaul, the corresponding cost is $93,000. Hence, there is a potential saving in TCO of $70,000 over five years by using microwave backhaul rather than an Ethernet lease line.
With the use of Sentinel antennas in microwave backhaul, 88 failed links can now be recovered. Hence, deploying Sentinel antennas could save MBNL a minimum of $6,160,000 over five years (88 links x $70,000 saved per link) by using microwave radio links instead of Ethernet leased lines.
In summary, Sentinel allows MBNL to save money by eliminating the need to lease Ethernet lines, reducing OpEx and enhancing EE’s and H3G’s bottom line.
$44k TCO saved in license feesThis section further elaborates on the cost benefit of Sentinel antennas used to turn on failed links in 10GHz and 40GHz microwave backhaul networks without using additional spectrum.
If the failed links must be recovered using existing Class 3 antennas in the network, the problem of frequency congestion must be overcome. But, with existing antennas in the network, a channel cannot be allocated to these failed links; the failed links cannot meet interference and availability objectives using existing Class 3 antennas in the available spectrum.
If existing antennas have to be used to make the failed links work, then a minimum of of two channels would have to be licensed from the regulator (which, in the case of the UK networks, is OfCom). These channels are not necessarily available; therefore, an alternative band would need to be assigned, driving additional equipment and support costs.
From published OfCom documents and EE spectrum license fee information provided, the minimum license fee is $500 per link/per channel.1 In order to make these 88 failed links work with Class 3 antennas, the additional cost of spectrum licensing would be 88 multiplied by $500, which equals $44,000 per year.
However, with the use of Sentinel antennas, 88 failed (frequency congested) links could now be assigned a channel whilst using the available spectrum and without buying additional
1 Source: Fixed Service Unit—Fixed Link License Fee Algorithm in force from 2nd June 2005 FWILF circulation
18,000 sites = 100% of macrocell sites
3,600 = 20% of macrocell sites
lower TCO
higher TCO
7,200 sites = 40% of macrocell sites
Ethernet Leased Lines (GE) Opportunity to minimize TCO Microwave Radio Systems
7,200 sites = 40% of macrocell sites

9
channel licenses from OfCom, thus saving additional spectrum license cost. This demonstrates how the tighter and cleaner radiation patterns of Sentinel help the operator save $44,000 TCO in spectrum license fees.
$4.5m TCO savings based on a wider frequency channel opportunityThis section discusses the impact of Sentinel antennas in microwave backhaul capacity upgrade over a geographic area. An important part of the high-capacity upgrade project for MBNL’s backhaul network is to upgrade the 40GHz radios from existing 28MHz channels to 56MHz channels.
Note that iQ.link®XG is a comprehensive wireless microwave link design and optimization
software solution. Its powerful interference analysis capabilities allow “what-if” scenarios to be examined by the link planner.
iQ.linkXG analysis process descriptionThis section explains the step-by-step process carried out in iQ.linkXG to analyze the impact of Sentinel antennas on capacity upgrades for microwave backhaul links in the 40GHz network.
1. The first step is to replace the existing radios on all 40GHz microwave P2P links to high-capacity radios using 56MHz bandwidth channels. The transmit output power was set to the original output power within the radio’s minimum and maximum power range.
2. The iQ.linkXG algorithm is then run to automatically recalculate the availability of every link with the higher-capacity radios.
3. For links that no longer meet the target 99.99 percent atmospheric availability objective, the transmit power was increased to the maximum value of the radio.
4. Link availability is recalculated again with the new adjusted transmit power.
5. All links that are able to meet the availability target of 99.99 percent are now marked as candidate links for the capacity upgrade analysis. All links that do not meet the availability target are discarded from further analysis and marked as having insufficient fade margin with the higher-capacity radios.
6. Next, the Automatic Frequency Planning (AFP) module of iQ.linkXG is performed on all candidate links. Links assigned an interference-free channel are saved with their new channel. AFP automatically assigns the best available frequency to each microwave link under analysis, according to user-specified interference criteria.
7. For links that could not be assigned an interference-free channel, the antennas are upgraded to Sentinel Class 4 antennas.
8. The AFP analysis is now performed on the links that have been upgraded with Sentinel antennas—the best available channels are assigned to all links.
9. A final availability calculation is performed on all links, considering any threshold degradation present from the final interference analysis. The additional links that now meet the required availability objective are the links where Sentinel enabled them to have a higher-capacity 56MHz radio channel assigned and still achieve required availability targets.
Summary of analysis results for all the links in the 40GHz bandOf 4,096 links in the 40GHz network, 2,315 are candidates for a higher-capacity 56MHz radio upgrade in that they are able to meet the required availability objectives with the new radios as explained in Step 5 above. The remaining 1,825 links do not have sufficient fade margin to meet the availability objective with the new radios.

10
Out of the candidate 2,315 links for radio upgrade, 68 links could not be upgraded to 56MHz radio using existing Class 3 antennas because the signal-to-noise ratio on these 68 links was not high enough to meet the availability objective with high-capacity radios.
However, by using Sentinel antennas, all of these 68 links could be upgraded to higher-capacity 56MHz wide channel radios and meet the availability objective. This is due to superior, lower sidelobes of the Sentinel Class 4 antenna, which helps achieve higher signal-to-noise ratio on the microwave link.
Thus, it can be concluded that, without using Sentinel, 68 links could not be upgraded to higher-capacity radios. One of MBNL’s choices is to use Ethernet lease lines to increase backhaul capacity in these zones.
As stated earlier, MBNL’s five-year TCO savings for microwave compared to Ethernet lease line is $70,000 per link. The positive impact of Sentinel on higher-capacity radio upgrade is on 68 links, giving a total potential saving of $4,760,000 over five years compared to Ethernet lease lines.
3,000 more links This section expands on the benefits of ETSI Class 4 radiation patterns such as Sentinel on channel distribution and frequency reuse on microwave links. Sentinel antennas improve spectral efficiency in a microwave point-to-point environment. The scenario below describes an alternative frequency plan using Sentinel antennas to plan the existing 4,140 links in the 40GHz network. It requires the use of fewer channels in comparison with Class 3 antennas—hence, freeing spectrum for future network expansion. The following two cases were studied.
• Case A: AFP was performed on links with both the 28MHz and 56MHz bandwidth radios (frequency channels).
• Case B: AFP was performed on the 28MHz links before and after the replacement with Sentinel antennas. The 56MHz links were ignored in this analysis.
Case A results In Case A, AFP was performed on the 28MHz links first. Next, AFP was performed on the 56MHz links, and channels were assigned in reverse order. Table 3 is a comparison of channel distribution before and after Sentinel antenna replacement on all the links.
Bandwidth (MHz) Channel Number of total links before Sentinel swap Number of total links after Sentinel swap
28 1C 2249 2430
28 2C 844 762
28 3C 448 228
28 4C 141 59
28 5C 52 231
28 6C 15 36
28 7C 6 9
28 8C 4 7
56 1B 8 0
56 2B 6 3
56 3B 51 43
56 4B 289 315
Not Assigned – 28 18
Table 3: Channel distribution with new frequency plan on both 28MHz and 56MHz links

11
Table 4 shows the shift in frequency reuse with Sentinel as a percentage of the total number of links using each frequency channel. For example, Channel 1B was originally used on 0.19 percent of the total links. When Sentinel antennas are used, it is a free channel and not used on any link.
As a result of the new frequency plan, the channel distribution for 56MHz channel 1B drops from eight links to zero links by using Sentinel. Similarly, channel 3B is used on 43 links, down from 51 links before using Sentinel.
Using Sentinel in the network therefore means that the 56MHz channels 1B, 2B and 3B can be used to plan more links. Figure 4 shows results from Table 3 in graphical form and clearly shows that Sentinel antennas allow the consolidation of the network into considerably fewer channels.
Bandwidth (MHz) Channel Percentage of total links before Sentinel swap Percentage of total links after Sentinel swap
28 1C 54.31% 58.68%
28 2C 20.38% 18.40%
28 3C 10.82% 5.51%
28 4C 3.40% 1.42%
28 5C 1.26% 5.58%
28 6C 0.36% 0.87%
28 7C 0.14% 0.22%
28 8C 0.10% 0.17%
56 1B 0.19% 0.00%
56 2B 0.14% 0.07%
56 3B 1.23% 1.04%
56 4B 6.98% 7.61%
Not Assigned - 0.68% 0.43%
Table 4: Frequency reuse on both 28MHz and 56MHz links, with and without Sentinel
Figure 4: Channel distribution with new frequency plan on both 28MHz and 56MHz links

12
to assign a new frequency plan to the 28MHz channel links using Sentinel antennas instead of the Class 3 antennas already deployed. The results of the new frequency allocation with Sentinel indicate that, by reusing channel 1C, the use of other channels was considerably reduced and the need for channel 7C eliminated.
The channel distribution in the new frequency plan is summarized in Table 5 and Figure 5.
Bandwidth (MHz) Channel Number of total links before Sentinel swap Number of total links after Sentinel swap
28 1C 2249 2453
28 2C 844 745
28 3C 448 440
28 4C 141 101
28 5C 52 27
28 6C 15 12
28 7C 6 0
Table 5: Channel distribution with new frequency plan on 28MHz links
With this new frequency plan for 28MHz links using Sentinel, all the links can be distributed in the first few channels, freeing up two channels for future expansion, such as for small cell microwave backhaul.
Frequency reuse conclusion In both cases, the low sidelobes of Sentinel antennas have improved the frequency reuse in an existing network. Assuming similar network geometry, up to 3,000 new links could be deployed using the two free channels. Thus, it may be concluded that Sentinel antennas have a huge impact on the spectrum efficiency and enable substantial future network expansion using existing available spectrum.
Figure 5: Channel distribution with new frequency plan on 28MHz links

13
582-hour QoS (dropped call) improvementA decrease in the fade margin of microwave links is caused by threshold degradation due to internal and external interference sources. This, in turn, leads to increased unavailability and, hence, lower QoS.
The lower sidelobes and superior radiation pattern performance of Sentinel ETSI Class 4 antennas can improve QoS by reducing the interference level—thereby improving availability for link traffic.
Interference analysis results—40GHz A total of 4,140 microwave links were analyzed in the 40GHz frequency band (8,280 receivers). The improvement in signal-to-noise ratio achieved using Sentinel antennas is summarized in Table 6.
QoS conclusion 1The total threshold degradation of all links in the 40GHz network is reduced by 422.69 dB after using Sentinel antennas. Put another way, the signal-to-noise ratio across the network improves by 422.69 dB with Sentinel. See Table 7.
The improvement in signal-to-noise ratio has a direct impact on the availability of the network, and thus QoS. In this case, an improvement by 422.69 dB equates to a reduction in annual outage by 582 hours.
Interference analysis results—10GHz Conducting a similar analysis of 2,352 microwave links in the 10GHz frequency band (4,704 receivers) gives the results shown in Table 8.
Saturation may be defined as the point at which system-wide cumulative interference reaches the point of degrading the reliability of certain links in the network. By deploying Sentinel antennas, the number of saturated links in 10GHz band decreases by 47.13 percent.
Table 9 shows the improvement in total threshold degradation on 4,704 receivers (link ends) before and after using Sentinel:
QoS conclusion 2The total threshold degradation on 10GHz links in the network decreases by 1,497.7 dB, reflecting the improved signal-to-noise ratio with Sentinel ETSI Class 4 antennas. This improvement has a direct impact on the availability of the network, and thus QoS. In this case, an improvement by 1,497.7 dB equates to a reduction in annual outage of 24,841 hours. See Table 10.
Overall QoS conclusionMBNL’s network has a microwave backhaul design goal of 1 Gbps throughput per microwave link available for 99.99 percent of time. However, the off-axis radiation of energy from the existing dish antenna can be an obstacle to meeting this target.
In this section, it has been demonstrated that Sentinel ETSI Class 4 antennas can reduce the total threshold degradation and improve the signal-to-noise ratio for 40GHz links by 422 dB (582 hours)—and for 10GHz links by 1,497 dB (24,841 hours).
The above results imply that, as the reliability of links is improved, network availability goes up—demonstrating that Sentinel antennas improve QoS in the network.
Total threshold degradation
before Sentinel antenna swap
Total threshold degradation after Sentinel antenna swap
2,822 dB 2,400 dB
Table 6: Threshold degradation before and after Sentinel in 40GHz
Total threshold degradation
improvement (before – after Sentinel)
Total outage improvement (before – after
Sentinel)
423 dB 2,094,959 sec = 582 hours
Table 7: Improvement in QoS with Sentinel in 40GHz
Number of saturated link ends
before Sentinel antenna swap
Number of saturated link ends after
Sentinel antenna swap
157 83
3.38% 1.76%
Table 8: Improvement in saturation with Sentinel in 10GHz
Total threshold degradation
before Sentinel antenna swap
Total threshold degradation after Sentinel antenna
swap
3,235 dB 1,738 dB
Table 9: Improvement in signal-to-noise with Sentinel in 10GHz
Total threshold degradation
improvement (before – after Sentinel)
Total improvement in outage (before –
after Sentinel)
1,498 dB 89,429,383 sec = 24,841 hours
Table 10: Improvement in QoS with Sentinel in 10GHz

14
Reduced threshold degradation provides:
• Potential improvement in traffic carried by microwave links due to improved availability• Potential benefit when increasing capacity by cross-polarized interference cancellation (XPIC)
featured radio upgrade• Potential to increase the number of links and effectively utilise the spectrum
31 percent of failed links in 10GHz were assigned a channel It was demonstrated earlier that Sentinel could fix the failed links in both 10GHz and 40GHz microwave backhaul network. This section shows how the frequency-congested failed links in the 10GHz network were assigned a channel—and how many links in the environment would have to be replaced with Sentinel antennas to fix these failed or frequency-congested links.
Below is a description of the step-by-step analysis performed to evaluate the impact of Sentinel on channel assignment to failed links in the 10GHz network. The congested links were identified or filtered out from the database provided by EE. Consequently, Sentinel analysis was performed on 190 highly congested links.
Step 1.
The AFP utility in iQ.link®XG was performed on 190 congested links of the 10GHz network.
No Sentinel ETSI Class 4 antenna exchanges were performed in this case.
Result: See Table 11
Step 2.
The AFP utility in iQ.linkXG was performed on 190 congested links of the 10GHz network. However, this time, Sentinel ETSI Class 4 antennas from CommScope family of Andrew solutions were deployed.
Result: See Table 12
Step 3.
With reference to the results achieved in Case A and Case B above, the number of additional congested links where AFP can assign interference-free channels with Sentinel antennas is:
88 – 42 = 46 links.
Step 4.
This step defines the minimum number of Sentinel ETSI Class 4 antennas required for interference-free operation of these 46 highly congested links, including affected environment links.
Manual redesign and antenna swap to Sentinels were performed on 46 congested links and environment links in the area.
Number of congested links assigned a channel successfully:
Number of congested links where AFP failed to assign a channel:
42 148
Table 11: Frequency allocation for congested links without Sentinel
Number of congested links assigned a channel successfully:
Number of congested links where AFP failed to assign a channel:
88 102
Table 12: Frequency allocation for congested links with Sentinel

15
Conclusion on link repairAccording to the results of manual link planning in this step, Table 13 shows the number of Sentinel antenna swaps required to achieve interference-free operation of 46 highly congested links:
For 46 highly congested links: 92 Sentinel changes
For environment links: 21 Sentinel changes
Total: 113 Sentinel changes
Table 13: Sentinel changes required to fix congested links in 10GHz
Therefore, a total of 113 Sentinel antenna changes would be required to fix the 46 congested failed links in the 10GHz band.
Below is the Google Earth graphic mapping the 46 congested links in MBNL’s UK network that could be fixed by Sentinel.
Figure 6: Google Earth view of congested links fixed by Sentinel
Reducing antenna size and TCO tower lease costIf an operator is switching from fixed modulation radios to adaptive modulation, there is a strong opportunity to generally select smaller antennas.
One of the strategies traditionally used by operators to reduce interference is to deploy larger antennas than nominally necessary and benefit from the improved signal-to-noise ratio, albeit at the cost of increased tower space and initial purchase price. Sentinel antennas allow you to use smaller antennas without exposing the link to additional interference.
By using Sentinel antennas, it may be possible to use the next-smaller dish antenna compared to the existing antenna size on microwave backhaul links and still meet the availability target.
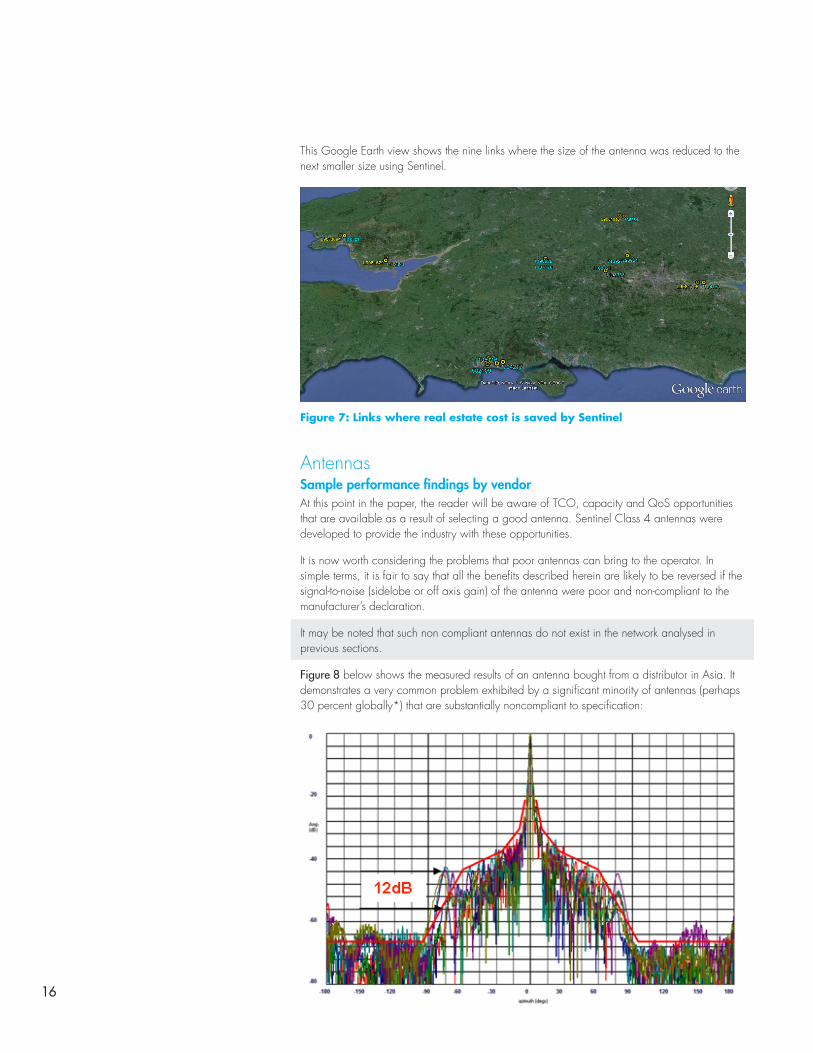
In the MBNL microwave backhaul network, it is possible to replace existing Class 3 0.6 m antennas with the next-smaller Sentinel 0.3 m diameter antenna on at least nine links in the 40GHz band and still meet the interference/availability targets.
In other words, the freight bill for these nine links—comprising 18 antennas—could have been reduced by half. Additionally, there is a minimum savings of $21,600 a year on tower lease costs for these nine links, assuming a typical lease cost per tower for an antenna is $100 per foot/month.
16
This Google Earth view shows the nine links where the size of the antenna was reduced to the next smaller size using Sentinel.
Figure 7: Links where real estate cost is saved by Sentinel
AntennasSample performance findings by vendorAt this point in the paper, the reader will be aware of TCO, capacity and QoS opportunities that are available as a result of selecting a good antenna. Sentinel Class 4 antennas were developed to provide the industry with these opportunities.
It is now worth considering the problems that poor antennas can bring to the operator. In simple terms, it is fair to say that all the benefits described herein are likely to be reversed if the signal-to-noise (sidelobe or off axis gain) of the antenna were poor and non-compliant to the manufacturer’s declaration.
It may be noted that such non compliant antennas do not exist in the network analysed in previous sections.
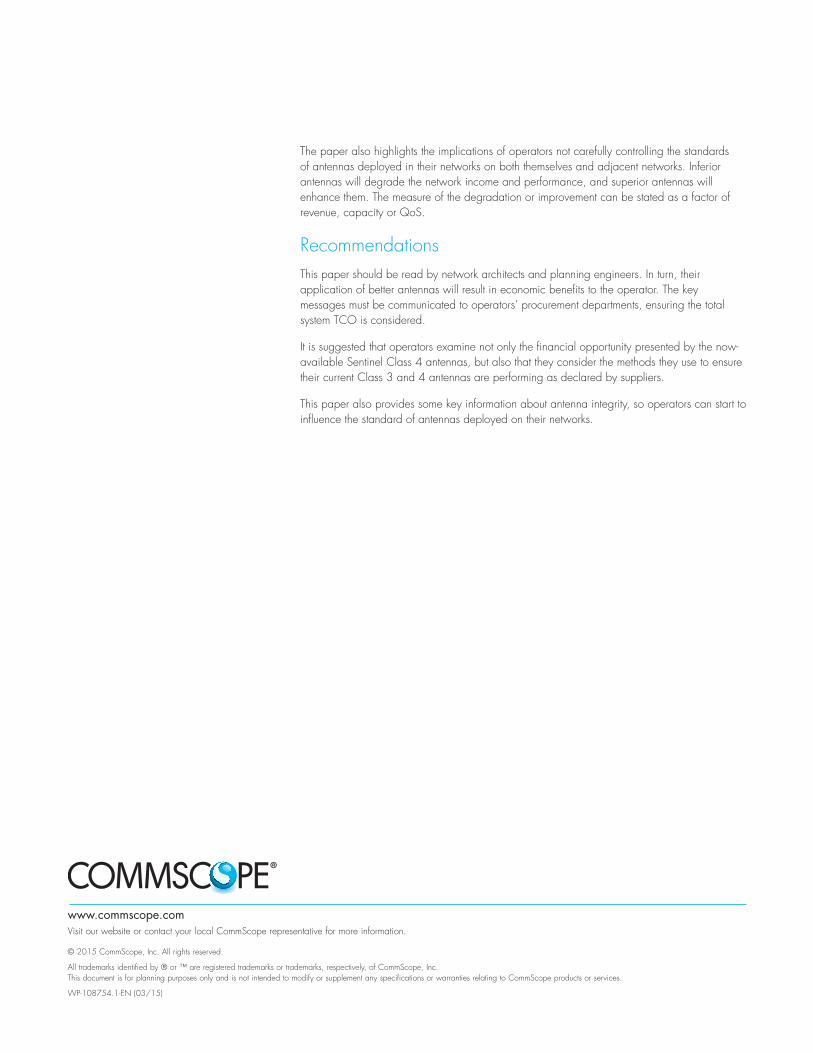
Figure 8 below shows the measured results of an antenna bought from a distributor in Asia. It demonstrates a very common problem exhibited by a significant minority of antennas (perhaps 30 percent globally*) that are substantially noncompliant to specification:

17
Figure 8: Measurements of an inferior antenna’s performance
The multicolored lines are sidelobe measurements taken at sample frequencies within the operational band. Note the non-compliances to the red ETSI Class 3 specification and, in particular, the 12 dB noncompliance. Consider what this noncompliance means in practical terms:
• This problem is unknown to the operator • It could be contributing to link or network capacity underperformance• It could be contributing to link or network QoS underperformance• It could be causing interference in transmit mode to adjacent links and networks owned by
the operator• Other operators’ links could be causing intersystem interference to the operator’s network—or
intrasystem interference could exist for both operators• Overall, it contributes to dissatisfaction from the mobile network user
Antenna mechanical dimensions A P2P antenna is a passive mechanical device that has an electrical application and function. Mechanical dimensions are highly relevant to the electrical performance and, as operational frequency rises, so does the demand on the mechanical dimensions. As an example, for a 10GHz antenna to retain its compliance to its declared specification, certain mechanical dimensions must be held to within a tolerance of 0.12 mm. If the frequency was increased by four times to 40GHz, then the tolerance on mechanical dimensions would need to be divided by four—thus, being tightened to 0.03 mm.
Inferior antennas generally have poor control over their mechanical dimensions both during manufacture and over their operational lifetimes.
Reflecting surfaces like the dish are susceptible to deformation in manufacture and during their operational lifespans. The deformation cannot be seen with the naked eye but the result can be a 1 dB drop in on-axis gain, or a 10 dB increase in sidelobe or off-axis gain.
These unexpected new sidelobes are destructive in the network and oppose most of the advantages set out in the executive summary above.
Antenna cross-polarization discrimination (XPD) One parameter that is very sensitive to mechanical dimensions is XPD. Any asymmetry in the antenna is a threat to XPD. Again, the dimensional errors can be very small and still will manifest in a significant XPD noncompliance with consequential impact of XPIC radio performance.
Antenna flange interface XPD A lack of precision control at the input to the antenna can generate problematic XPD energy. It is essential that high compression and mechanical symmetry exist at the flange interface, and that this control makes any radio mate properly with any antenna.
Antenna radome XPD and gain drop Inferior antennas often lack control in the production and fit of the radome, which covers and protects the front of the antenna. The material is highly engineered and controlled in order to ensure compliance to the declared specification. Symmetry, material homogeneity, dielectric constant, color and surface finish are all key parameters that require long-term control both in production and during the operational life of the antenna.
Antenna shield absorber In many antennas, there is often radiation-absorbing material that is used to absorb off-axis microwave energy and therefore control sidelobes. If poor-quality materials are used, the active component can leach from the material over the months and years following its installation; in these instances, the off-axis gain or sidelobes can increase by 10 dB or more.

18
The environment Ultraviolet light The radome must cope with intense ultraviolet (UV) light energy when the antenna is in operation. UV can, of course, discolor plastics and cause them to crack; however, the bigger threat comes from the dielectric constant of the material, which can change due to UV exposure. If it does, then the on-axis gain of the antenna will drop by up to 3 dB and the sidelobe or off-axis gain or sidelobes can increase by 10 dB or more.
Handling and wind shocks The reflecting surfaces of the antenna dish must be stable over the operational wind speed of the antenna and fully recover from survival loadings without any permanent deformation. Control of raw metal material properties is critical to yield this result. Not only must yield strength and hardness be tightly and highly controlled, but also the grain structure of the material—to ensure uniformity of the reflector surface. This degree of control is required so that, in mass production, the perfect shape is consistently achieved, e.g., to within 0.1 mm of an ideal shape. Both reflector number one and reflector number 5,000 must comply with equal precision. In addition, great care must be taken in selecting the correct alloys to ensure that the risk of corrosion over the life of the antenna is minimized.
Water & ice Water ingress to antenna feed systems—where the radio is connected directly or indirectly to the antenna—has become more common. The basic reason for the issue is not only poor installation practice, but, also increasingly, the antenna interface has not been proven to be compatible with the connecting components, such as couplers. The flanges leak water and microwave energy, and both are a problem. Water causes a direct attenuation of the received signal while RF leakage increases the susceptibility of the antenna to interference in the same way as a bad sidelobe or off-axis gain or sidelobe) performance does.
The suggestion here is to make sure all devices are engineered together and proven on an antenna testing range such as that shown in Figure 9.
Antenna appearances can be deceivingIt is often the case that an inferior antenna and a good antenna, put on the table side by side, will appear the same. The mechanical dimension problems with the inferior one are very hard to see, as are any vulnerabilities to UV light. In fact, most of the threats are not at all evident so it is easy to conclude, incorrectly, that both antennas are of equal quality and value.
ConclusionThe work described in this paper has shown that deploying better backhaul antennas, such as those of CommScope’s Class 4 Sentinel antennas, in the example backhaul radio network would result in:
• Over $5m TCO saved over five years
• $42k TCO saved in license fees over five years
• $4.5m TCO per year based on optimising capacity by freeing congested channels
• 3,000 more radio links can be added to the network when none had been possible before
• 582-hour QoS (dropped call) improvement
• 96% and 31% of failed links in 40 and 10 GHz respectively were assigned a channel
• A strong opportunity to trade some of the above by reducing antenna size and thus saving TCO on tower lease costs
The root reason for EE’s and H3G’s success is the application of antennas that offer better discrimination to interference, improving signal-to-noise ratios in the links and across the network as a whole.
Figure 9: A typical P2P antenna test facility
The paper also highlights the implications of operators not carefully controlling the standards of antennas deployed in their networks on both themselves and adjacent networks. Inferior antennas will degrade the network income and performance, and superior antennas will enhance them. The measure of the degradation or improvement can be stated as a factor of revenue, capacity or QoS.
RecommendationsThis paper should be read by network architects and planning engineers. In turn, their application of better antennas will result in economic benefits to the operator. The key messages must be communicated to operators’ procurement departments, ensuring the total system TCO is considered.
It is suggested that operators examine not only the financial opportunity presented by the now-available Sentinel Class 4 antennas, but also that they consider the methods they use to ensure their current Class 3 and 4 antennas are performing as declared by suppliers.
This paper also provides some key information about antenna integrity, so operators can start to influence the standard of antennas deployed on their networks.
www.commscope.comVisit our website or contact your local CommScope representative for more information.
© 2015 CommScope, Inc. All rights reserved.
All trademarks identified by ® or ™ are registered trademarks or trademarks, respectively, of CommScope, Inc. This document is for planning purposes only and is not intended to modify or supplement any specifications or warranties relating to CommScope products or services.
WP-108754.1-EN (03/15)


![SASD Microwave$$ Oven$System - Konkukdslab.konkuk.ac.kr/Class/2013/13SE/ClassA/team_project/3... · 2013-10-17 · SASD Microwave$$ Oven$System [T1]$ 201211325권세미$ 201211357](https://img.dokumen.tips/doc/110x75/5f1d070f8a5a40682047a957/sasd-microwave-ovensystem-2013-10-17-sasd-microwave-ovensystem-t1-201211325eoee.jpg)