Embed Size (px)
Citation preview

RESEARCH Open Access
A new approach to social inequality:inequality of income and wealth in SouthKoreaKwang-Yeong Shin
Correspondence: [email protected] of Sociology,Chung-Ang University, 84Heukseok-ro Dongjak-gu, Seoul,Korea
Abstract
This paper attempts to provide a new approach to social inequality, focusing onincome and wealth inequality and the relationship between income inequality andwealth inequality. With an analysis of the data linking survey data with administrativedata in South Korea, this paper reports that wealth, employment status, family size,and education are significant contributors to income inequality. However, incomeand loans are the two most significant factors contributing to wealth inequality.Income derived from economic activity and loans based on the leverage in thefinancial market have exacerbated wealth inequality as higher income groups tendto utilize more loans in the financialized economy, widening the gap between therich and the poor. Wealth inequality has different dynamics from income inequality,mediated through leverage in South Korea.
Keywords: Income inequality, Wealth inequality, Regression-based inequalitydecompostion, Administrative data, South Korea
IntroductionThis paper attempts to explore income inequality and wealth inequality and their rela-
tionship, revealing that the two main indicators of inequality have different dynamics
of making economic inequality in contemporary South Korea. Analyzing the linked
data of the Survey of Household Finance and Living Conditions (SHFLC) collected by
the Statistical Office with the administrative data on household income by the National
Tax Office in South Korea, this paper identifies contributing factors to household in-
come inequality and wealth inequality. It also shows that the traditional approaches to
social stratification have limitations to fully understand the issue of rising economic in-
equality in the post-industrial society characterized by the growing elderly population
and the changing family system as well as the transformation of industrial production.
Economic inequality has become an important political issue as well as an academic
issue worldwide in the twenty-first century (Piketty and Saez, 2003; Piketty, 2013;
Atkinson, 2015; Stiglitz, 2012). Sociologists have not been successful in explaining the
rise of income inequality. Piketty has shown how income and wealth have been
© The Author(s). 2020 Open Access This article is licensed under a Creative Commons Attribution 4.0 International License, whichpermits use, sharing, adaptation, distribution and reproduction in any medium or format, as long as you give appropriate credit to theoriginal author(s) and the source, provide a link to the Creative Commons licence, and indicate if changes were made. The images orother third party material in this article are included in the article's Creative Commons licence, unless indicated otherwise in a creditline to the material. If material is not included in the article's Creative Commons licence and your intended use is not permitted bystatutory regulation or exceeds the permitted use, you will need to obtain permission directly from the copyright holder. To view acopy of this licence, visit http://creativecommons.org/licenses/by/4.0/.
The Journal ofChinese Sociology
Shin The Journal of Chinese Sociology (2020) 7:17 https://doi.org/10.1186/s40711-020-00126-7

concentrated into top income groups in the advanced industrial democracies since the
late twentieth century. As many sociologists have already argued, however, sociologists
have not been successful in providing sociological explanations of the rising inequality
(Western, 1999, Myles, 2003; Kenworthy, 2007; Savage and Burrows, 2007). While soci-
ologists have been concerned with inequality of mobility chance or social fluidity be-
tween social groups such as social class, gender, and race, sociologists have not
significantly contributed to an understanding of the rising income inequality and wealth
inequality.
The traditional approach to social stratification has focused on individual work and
occupation. The work-based approach to social inequality has been a core of social
stratification and class analysis in sociology. It has formed a research paradigm in social
stratification which focuses on the role of education mediating the relationship between
family background and individual occupation (see Blau and Duncan, 1965; Breen and
Muller, 2020; Erikson and Goldthorpe, 2000; Featherman and Hauser, 1975; Hout and
DiPrite, 2006; OECD, 2018). Occupation has played a key role as an origin (father’s oc-
cupation) and destination (children’s occupation) in the social mobility research, while
education has worked as a social elevator for upward social; mobility over generations.
Thus, the OED model has been the core research framework in social stratification for
the past decades, called “a disciplinary default” (Savage, 2016).
There have been good reasons why sociologists have focused on occupation rather
than income and wealth. There have been practical reasons for occupation rather than
income as a key area on research on social stratification. In practice, measurement
error is serious in getting information about income and wealth. For example, many re-
spondents do not know their income exactly, or they do not want to tell their income
to others. Therefore, almost all survey questionnaires asked income in an interval scale
with the open-ended top income, making a precise measurement of income inequality
impossible.
Sociologists have been preoccupied with the working population, excluding the eld-
erly mostly out of the labor forces. The majority of the elderly population who are not
working has been excluded from the research on social stratification. In the past,
women were excluded in the social stratification research until the 1970s, whereas the
elderly were excluded in the social stratification research in the late twentieth century
(for the case of women, see Acker, 1973). Much of the research on social mobility and
sex segregation of jobs has focused on the working population.
Sociologists have assumed individuals as a unit of analysis of social stratification,
while they have conceived family background as an essential factor to shape children’s
education and occupation. Household as a social institution of pooling family member’s
income has not been emphasized. Educational investment in children’s education has
been made by family or household level, not an individual level. Family or household is
a unit of family consumption, children’s education, and daily social life.
Finally, most of the research on social stratification has not paid attention to wealth
inequality, while wealth inequality is much more severe than any other dimension of
inequality in almost all countries (Alvaredo et al., 2018; Therborn, 2013; Piketty, 2013).
Some magazines, such as Forbes, report the global rich with narratives of the success
story of the people in business (Kroll and Dolan, 2019). But there has been little re-
search in sociology on how wealth is associated with social stratification and inequality.
Shin The Journal of Chinese Sociology (2020) 7:17 Page 2 of 15

Research on the labor market and gender has focused on wage disparity among the em-
ployees. Owners of capital, such as stockholders or building owners, get a much higher
income than the earnings of employees, though some do not have jobs and
occupations.
This paper investigates two dimensions of inequality, income inequality and wealth
inequality, and examines the relationship between the two by using linked administra-
tive and survey data. In the next section, we will discuss the relationship between in-
come and wealth and explore the relationship between wealth and income inequality.
In the third section, we will explain the Survey of Household Finance and Living Con-
ditions (SHFLC) and the linking of survey data to administrative data from different
governmental agencies to get accurate information about income. Then, we will briefly
explain the regression-based-inequality decomposition method used in the statistical
analysis. The fourth section reports the results of an empirical analysis, identifying
major contributing factors to income inequality and wealth inequality. In the last sec-
tion, some implications of the finding of this research will be addressed concerning re-
search on social stratification.
Household income and wealthRecently, income has been a focal point of discourse on inequality. While income has
been considered as a primary dimension of economic inequality in social sciences, in-
come has seldom been the main topic of theoretical discourse or a subject of empirical
research in sociology. Research on inequality and stratification has paid more attention
to structural or institutional factors that are assumed to generate socio-economic in-
equality that we observe every day. For example, status attainment approaches have fo-
cused on the relationship among social origins (parents’ occupation), education
(respondents’ education), and destination (respondents’ occupations) called the OED
model. However, the relationship between occupation and income has not been fully
elaborated. The only average of earnings of occupation has been assumed to represent
the income level of each occupation without recognizing that the variation of an indi-
vidual’s earnings has been affected by other factors than occupation, such as industry,
firm size, employment status, and gender.
Individual occupation has been considered as a proxy of socioeconomic status or so-
cial stratification in sociology. Does an individual’s occupation represent one’s eco-
nomic wellbeing? Does it affect the distribution of household income that influences
family expenditure and educational investment for children? The answer is yes, but
only partially true. With an increasing diversification and flexibility in the labor market,
there have been increasing numbers of non-standard workers who get less paid by em-
ployers, less secured by unions, and less protected by the state (Kalleberg, 2000; OECD,
2019; Shin, 2013). The rise of precarious work challenges the validity of occupation as a
cornerstone of earning inequality.
Earnings refer to economic rewards from work, and there are many other economic
gains from other than work. Income refers to a flow of money that includes not only
economic rewards from work but also economic gains from factors such as capital,
land, and pension and entitlement. Thus, it has a variety of forms, such as wage, public
transfer, profits, rent, interest, and dividends. As the capitalist economy develops and
employment relation becomes a dominant form of the economic system, the majority
Shin The Journal of Chinese Sociology (2020) 7:17 Page 3 of 15

of the people receive wage or salary in exchange for their work as employees. Those
who hire others in their business get profits. Thus wage or salary comes from a part of
the profits gained by employers.
However, new forms of income are derived from non-producing capital. Nowadays,
as the financial sector dominates the economy and everyday life, more people tend to
own stocks and bonds to get more economic benefits. Those who own stocks and
bonds get capital gains through a transaction of them in the stock market or a dividend
given to stockholders by a corporation. Financialization of the economy leads to the in-
creasing importance of the financial sector in the economy relative to the economy,
and the growing number of people engages in the financial market and gets income
from financial capital (Davis and Kim, 2015). The ascendancy of the financial sector
has led to the new rules of accumulation without producing material goods, enabling
middle-class members to engage in the stock market transaction and real estate mar-
kets for short-term profits. With the digitalization of the daily trading of stocks at
home, “profits without producing” has been possible for middle-class households as
well as the global financial investors (Sawyer, 2013). Financialization has completely
transformed the distribution of income and wealth through the mediation of financial
institutions such as investment banks and financial firms specialized in real estate
speculation. At the household level, households utilizing credit systems begin to use le-
verage to purchase an asset, mostly housings and stocks, with the expectation of the in-
creasing return of investment. In particular, the rising housing price in many countries
has instigated middle-class households and wealthy investors to use debt financing or
bank loans to invest in the housing market and real estate markets. Increasing house-
hold debt has been observed in several countries where housing bubbles were made,
generating high household indebtedness ratio. South Korea displays a very high level of
household indebtedness and debt-to-total asset ratio among OECD countries (OECD,
2020).1
Income is determined by the monthly economic gains derived from economic activ-
ities or profits from investment or rent, including houses or offices. In this case, for the
majority of the people, one’s occupation or social class is an essential factor in explain-
ing an individual’s income. However, substantial social changes that occurred in the
late twentieth century challenged the long tradition of approach to income inequality.
The first challenge is that an individual’s income may be quite different from household
income because the growing number of married couples jointly participates in the labor
force (Esping-Andersen, 1999: ch. 4). Thus, household income is a pooled income of in-
dividual household members when more than one family member engaged in economic
activity. The growth of dual-earner family contributes to the divergence of household
income from individual income in the labor market in post-industrial societies.
Household income is also affected by the development of welfare programs to cope
with social problems such as poverty and unemployment. An effect of the development
of the welfare state has been an increase of public transfer to the people with low in-
come or unemployment. Also, the rise of the aged population retired from the labor
market also increases the proportion of the people who receive pension or benefits not
1In South Korea, the household debt level was 184.20% of the net household disposable income in 2018,which was more than twice that of Germany and Japan. It was 147.53% in 2010. See OECD (2020) for thedetails.
Shin The Journal of Chinese Sociology (2020) 7:17 Page 4 of 15
associated with work. The growth of the population getting pension benefits contrib-
utes to the growing impact of public transfer in income distribution. The impacts of
welfare programs on income distribution have been associated with the level of public
social expenditure and tax rate. On average, OECD countries reduce more than one-
quarter of market income inequality via tax and cash transfers. Korea was one of the
least redistributive countries in the OECD, with less than a 10% decrease in the Gini
index of income inequality in 2014 (OECD, 2020).
Wealth is a stock of valuable assets, including a share of stocks of companies, savings
in banks, the ownership of property, insurance schemes, pension, and luxury goods.
Some form of wealth, such as a house or a car, is visible, whereas other forms of wealth,
such as ownership of stocks and insurance, are entirely invisible to outsiders. As some
wealth such as savings, lands, or estates themselves generate income, “a disproportion-
ate share of the highest income comes from wealth” (Davis, 2019: 128). Besides, parts
of wealth itself are convertible to market income by selling stocks and houses.
Wealth can function as a private safety net in case of unemployment, severe illness,
divorce, industrial injury industry, and retirement. In particular, housing ownership
plays a role as a social safety net against the various social risks in one’s life in countries
where social welfare is not sufficiently institutionalized. Housing ownership can be a
functional equivalence to social welfare in South Korea. Thus, the ratio of housing
ownership has increased even after the income has decreased in their 60s. When
earners decease, of course, the earned income disappears. But, the wealth of the de-
ceased is inheritable to children. Thus, wealth inequality is much more stable than in-
come inequality over time.
Then, how is wealth formed? There are many pathways through which wealth is
formed and wealth inequality is generating. The typical pathway is the accumulation of
some part of disposable income as savings for a period at an individual level or the
household level. Thus, the surplus income, that is, income minus expenditure, are kept
in banks or invested in the stock market or real estate markets. The formation of a fi-
nancial asset can be a stock of saved income. Higher-income earners tend to save a
more substantial part of their income. Those who have their own housings can save
more than renters of housings. For example, in South Korea, the top 10% of income
group has 22.39 times higher savings than the lowest 10% of income groups in 2017.
The second pathway is the rise of values of possessed wealth, such as ownership of
capital, houses, or other property. Thomas Piketty (2013) argues that the dynamics of
increasing wealth inequality is simply based on the fact that the rate of return on cap-
ital r is greater than the rate of return to labor g (r > g). Also, financial assets and real
estate multiply itself through capital value change. The rise in the price of real estate,
stocks, and bonds also contributed to the growth of wealth for renters. In addition, the
rise in rent also played a vital role in the growth of wealth. Wealth has been more se-
verely affected by market fluctuation than income. Sometimes, the asset bubble bursts
out when the asset-inflated price exceeds the intrinsic value of the asset.
The third pathway is the role of wealth as leverage of loans. Wealth can function as
collateral for borrowing loans from banks. Financial organizations utilize a credit sys-
tem to reduce the risk of bad credit. Even speculative mortgage loans have been pos-
sible for new investment in the financial market. Thus, profits without producing real
values dominate the global economy in recent years. The wealthy people can utilize the
Shin The Journal of Chinese Sociology (2020) 7:17 Page 5 of 15

loans to invest in the stock market and the financial market. Therefore, credit inequal-
ity becomes a new type of inequality emerging in the period of financialization. While
debt-to-equity ratios increased on average, wealthy people utilize financial resources
easier than the poor in new investments.
The fourth pathway is the transmission of parents’ wealth to children through private
transfer or inheritance after parents’ death. Thus, the family’s wealth has contributed to
the wealth formation of descendants over generations. Children of the rich family ac-
quire the properties of their parents after or before their parents pass away. The impact
of inheritance of wealth on wealth inequality depends on the inheritance tax rate and
the number of heirs in each country. Persistent wealth inequality and the stability of
wealthy people have been common across countries. In short, economic inequality is
largely ameliorated by the unequal ownership of income-producing assets and rent sav-
ing property.
Data and methodData and variables
In this paper, we used the data of the Survey of the Household Finance and Living
Conditions (SHFLC), which is the linked data of the survey data and administrative
data. The SHFLC has been collected by the Statistical Office in South Korea since
2010. The Statistical Office of South Korea began to collect information about house-
hold income, debt, wealth, and welfare to know the dynamics of finance after the global
financial crisis in 2008–2009. The sample size was 10,000 cases until 2011, and after
that, it increased to 20,000 households since 2012. The SHFLC has been replaced by
20% of the total sample every year. Thus the SHFLC will be utterly new after 5 years.
In this paper, we used SHFLC 2017 with the sample size 18,497 in 2017. The Statis-
tical Office in South Korea began to link the SHFLC with the administrative data to
overcome shortcomings of the survey data on income. Linking survey data with regis-
tered administrative data provides a new research possibility on inequality research
with more accurate information on personal and household income. Administrative
registered data in the SHFLC included the various data source to measure household
income: the annual income and tax from the National Tax Office, the transfer income
and pension from the Social Insurance Office, the health insurance and health service
information from the National Health Insurance, educational allowance from the Min-
istry of Education, and child allowance from the Ministry of Health and Welfare.
Table 1 reports different measures of inequality of income and wealth in the survey
data and the linked data in 2017. As we expected, the linked data displays a higher
maximum income than the survey data, revealing that the survey data underreport the
income of the top income. It also shows that the survey data do not accurately identify
the income of the low-income groups since the median shifts from 3698 to 3966. As a
result, Gini coefficients measured by the linked data, 0.4416, is higher by 4.25% than
that of the survey data, 0.4236.2 The linked data that uses income from the
2The Gini coefficient in the SHFLC 2017 is much larger than the Gini coefficient reported to the OECD bythe Statistical Office Korea. The Gini coefficient reported to the OECD is based on the Household Incomeand Expenditure Survey (HIES) with a smaller sample size than the SHFLC. Instead of the HIES, theStatistical Office Korea began to report the statistical indicators of income distribution from the SHFLC since2015. For example, the Gini coefficient in 2017 was 0.355, whereas it was .307 in 2012. The difference mainlycame from the data with sample size.
Shin The Journal of Chinese Sociology (2020) 7:17 Page 6 of 15

administrative record shows the fact that the survey data collected by the Statistical Of-
fice in South Korea tend to underestimate the level of the top income and the degree
of inequality of the household income. The concentration of income on the top 10%
and top 20% of income groups also increases from 0.2883 in the survey data to 0.3165
in the linked data. The share by the top 10% and the top 20% also show a similar pat-
tern of the rising concentration of income. However, p90/p10, which indicates the in-
come gap between the income of the lowest 10% and the highest 10% income group,
shows a slightly different pattern, by reducing the ratio by 1.85%. On the contrary, the
gap between the poor 40% and the richest 10% widen when the linked data is used.
The Palma ratio, the ratio of the richest 10% of the households’ share of income divided
by the poorest 40%, shows an increase from 2.4542 to 2.6421.
Wealth inequality is much higher than income inequality across the whole country
(Sierminska, Smeeding, and Allegrezza, 2013; Jäntti, Sierminska, and Kerm, 2013). On
average, the popular perception of the rising inequality has been derived by not only in-
come inequality but also wealth inequality. Wealthy persons consume luxury goods and
cars and live expensive housings in gated communities. Also, the increasing housing
price contributes to the perception of wealth inequality as well as wealth inequality it-
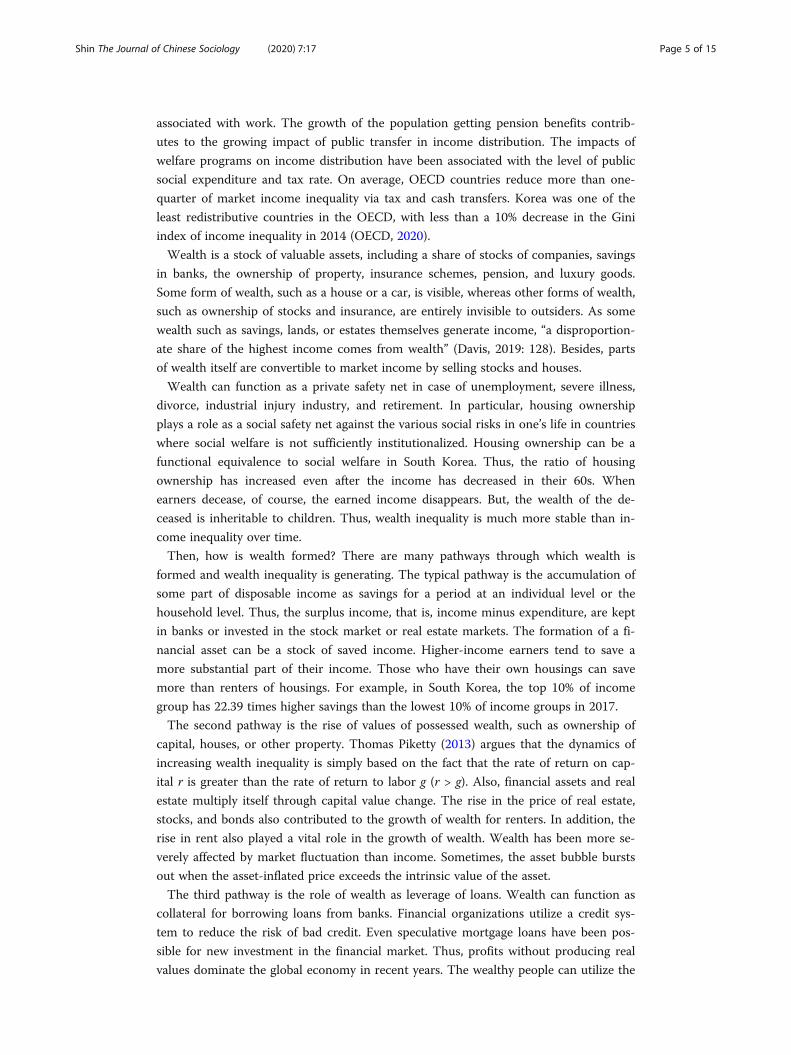
self. In South Korea, the rising housing price in recent years has contributed to the fear
of the youth of the middle class and the working class, as housing ownership was very
low among young adults (see Fig. 1). The Korean youth has shown the lowering mar-
riage rate and birth rate of the married couple mainly due to the housing shortage and
housing bubbles over the decades as well as the high rate of unemployment (Kim,
2017).
In this paper, income is measured by annual household income containing the mar-
ket income and public transfer income. The market income includes earnings from
work, profits from business, property income such as interests or rents, and the private
Table 1 Measurement of income inequality and wealth inequality, 2017
Survey data Linked data
Income
Median 3,698 3,966
Maximum 102,400 161,310
Gini coefficient .4236 .4416
Share by top 10% .2883 .3165
Share by top 20% .4598 .4901
p90/p10 12.5800 12.3469
Palma ratio 2.4542 2.6421
Wealth
Median 21,482 21,482
Maximum 2,670,220 2,670,220
Gini coefficient .5738 .5738
Share by top 10% .4389 .4389
Share by top 20% .6147 .6147
p90/p10 55.6727 55.6727
Palma ratio 7.2046 7.2046
Note: The unit of income and wealth is 10 thousand Won, which is equivalent to roughly 9 US Dollars. The linked datause information about income from the tax agency, but it uses information about wealth from the survey data
Shin The Journal of Chinese Sociology (2020) 7:17 Page 7 of 15
transfer. Pre-tax income will be used in the following to focus on the impacts of con-
tributors to before-tax income inequality. Wealth is measured by the price of a variety
of possession, including properties such as houses, lands, buildings, and cars. Linking
the survey data with the administrative data provides more accurate data on income
and wealth than any other data set in South Korea.
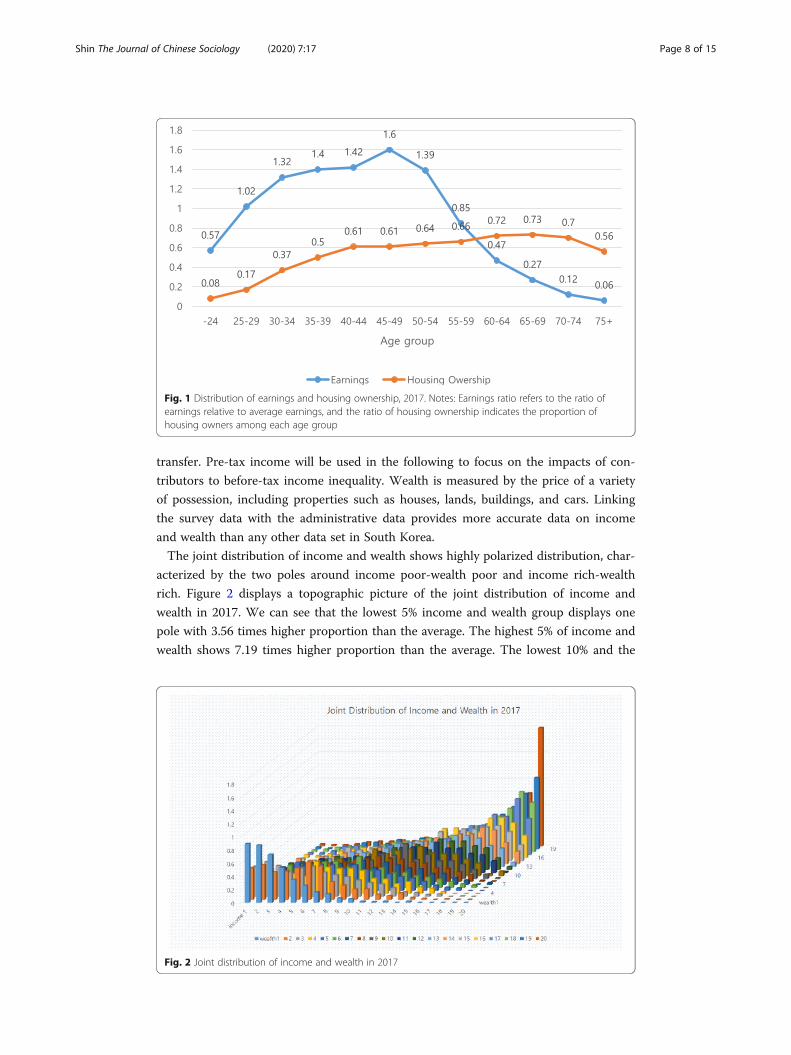
The joint distribution of income and wealth shows highly polarized distribution, char-
acterized by the two poles around income poor-wealth poor and income rich-wealth
rich. Figure 2 displays a topographic picture of the joint distribution of income and
wealth in 2017. We can see that the lowest 5% income and wealth group displays one
pole with 3.56 times higher proportion than the average. The highest 5% of income and
wealth shows 7.19 times higher proportion than the average. The lowest 10% and the
Fig. 1 Distribution of earnings and housing ownership, 2017. Notes: Earnings ratio refers to the ratio ofearnings relative to average earnings, and the ratio of housing ownership indicates the proportion ofhousing owners among each age group
Fig. 2 Joint distribution of income and wealth in 2017
Shin The Journal of Chinese Sociology (2020) 7:17 Page 8 of 15
highest 10% in both income and wealth distribution show the second-highest density.
However, in the middle of income and wealth distribution in Fig. 2, there is more fre-
quent mobility than any other parts of the joint distribution of income and wealth. It
shows that there is a low level of association between income and wealth in the middle
of income group and in the middle wealth group. High income and high wealth clusters
are formed in the poles.
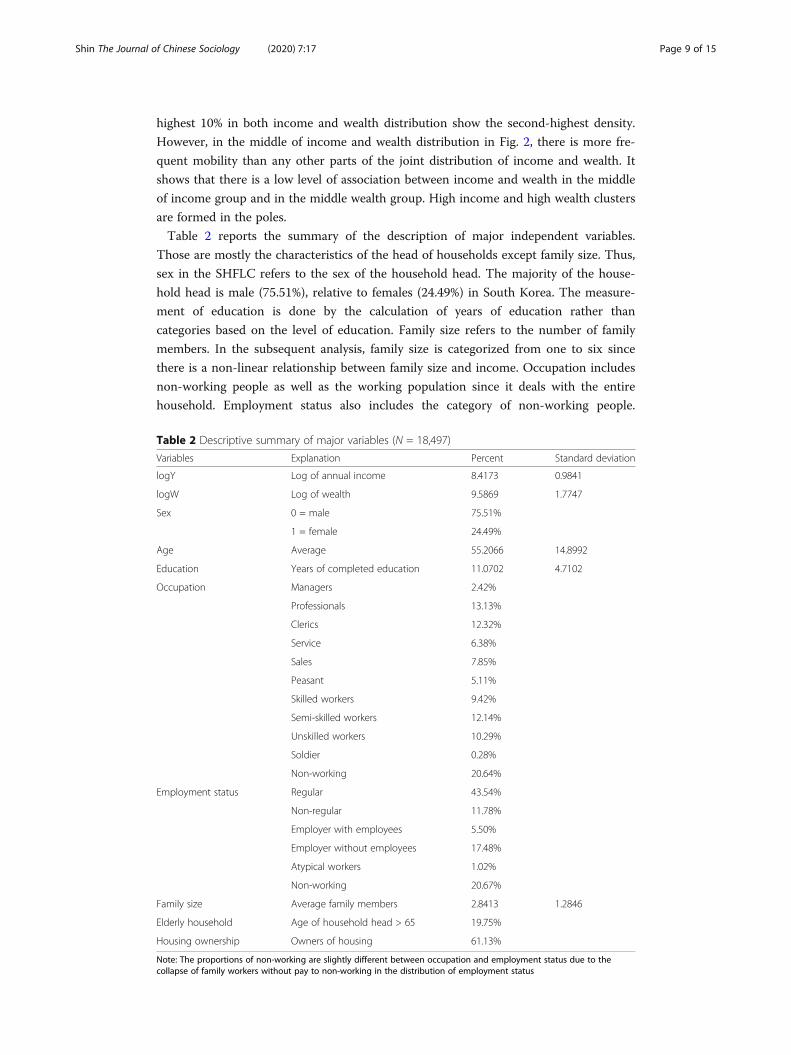
Table 2 reports the summary of the description of major independent variables.
Those are mostly the characteristics of the head of households except family size. Thus,
sex in the SHFLC refers to the sex of the household head. The majority of the house-
hold head is male (75.51%), relative to females (24.49%) in South Korea. The measure-
ment of education is done by the calculation of years of education rather than
categories based on the level of education. Family size refers to the number of family
members. In the subsequent analysis, family size is categorized from one to six since
there is a non-linear relationship between family size and income. Occupation includes
non-working people as well as the working population since it deals with the entire
household. Employment status also includes the category of non-working people.
Table 2 Descriptive summary of major variables (N = 18,497)
Variables Explanation Percent Standard deviation
logY Log of annual income 8.4173 0.9841
logW Log of wealth 9.5869 1.7747
Sex 0 = male 75.51%
1 = female 24.49%
Age Average 55.2066 14.8992
Education Years of completed education 11.0702 4.7102
Occupation Managers 2.42%
Professionals 13.13%
Clerics 12.32%
Service 6.38%
Sales 7.85%
Peasant 5.11%
Skilled workers 9.42%
Semi-skilled workers 12.14%
Unskilled workers 10.29%
Soldier 0.28%
Non-working 20.64%
Employment status Regular 43.54%
Non-regular 11.78%
Employer with employees 5.50%
Employer without employees 17.48%
Atypical workers 1.02%
Non-working 20.67%
Family size Average family members 2.8413 1.2846
Elderly household Age of household head > 65 19.75%
Housing ownership Owners of housing 61.13%
Note: The proportions of non-working are slightly different between occupation and employment status due to thecollapse of family workers without pay to non-working in the distribution of employment status
Shin The Journal of Chinese Sociology (2020) 7:17 Page 9 of 15
Soldiers in the occupational category are excluded in the following analysis because the
market does not determine their incomes.
Analytical methods
To identify the extent to which some factors contribute to inequality of income and
wealth, we use the regression-based inequality decomposition developed by Gary Fields
(2003).
Assuming that the income is
ln y ¼ Xβþ ε ð1Þ
where y is an n × 1 vector of incomes; X is an n × (K + 1) matrix of individual and
household characteristics (age, education, employment status, occupation, household
size, etc.) including the constant; β is a (K + 1) × 1 vector of coefficients, and ε is an n
× 1 vector of residuals. A sample of observations {yi, xi, i = 1, 2,...n} can be used to esti-
mate the model.
The linear model (1) can be rewritten as:
ln y ¼ β0 þ β1X1 þ β2X2…þ βKXK þ ε ð2Þ¼ β0 þ Z1 þ Z2…þ ZK þ ε ð3Þ
where each Zk is a “composite” variable, equal to the product of a regression coeffi-
cient and its variable (Zk = βKXK), with k = 0, 1,...K and X0 = 1.
For inequality decomposition calculations, the value of β0 is irrelevant as it is con-
stant for every observation.
The OLS estimate of (3) can be used for inequality decomposition:
ln y ¼ b0 þ b1X1 þ b2X2… þ ⋯ þ bkXk þ ∈ ð4Þ
Marginal contribution of the kth factor (Zk = bbkXk ) to the variance of logarithm of
income is as follows:
Sk ¼ bbk cov Xk; lnyð Þ=σ2 lnyð Þ ð5ÞXk
i¼1Sk ¼
Xk
i¼1bk cov Xk; ln yð Þ=σ2 ln yð Þ ¼ σ2 ln yð Þ=σ2 lnyð Þ ¼ R2 ð6Þ
The less ∈ in Eq. (4), the larger the explanatory power (R2).
ResultsHow can we explain the high level of household income inequality and wealth inequal-
ity in South Korea? Which factors contribute to inequality of income and wealth? Does
an individual’s occupation explain the inequality of household income? Do demo-
graphic factors and family change affect the distribution of household income? How is
income inequality associated with wealth inequality? The regression-based inequality
decomposition method might be helpful for getting answers to some of those
questions.3
3We used ineqrbd, the STATA module, to calculate the regression-based inequality decomposition proposedby Fiorio and Jenkins (2007).
Shin The Journal of Chinese Sociology (2020) 7:17 Page 10 of 15

We take two steps to decompose inequality of household income and wealth by each
contributing factor. The first step is to specify income functions and wealth functions,
respectively, and estimate coefficients of variables in those functions by linear regres-
sion analyses. The second step is to estimate the variance of household income ex-
plained by the covariance of each independent variable and household income. It is a
decomposition of the total explained variance (R2) into contributions by each independ-
ent variable based on Shapley value.
Table 3 reports the results of the regression-based inequality decomposition based on
the model that specifies some income functions. The best-fitting models, that is, the
model with the highest R2 and significant coefficients, are used to estimate the contri-
bution of each variable to the variance of household income and wealth. The residuals
refer to the unexplained variance of inequality of household income by the model, 1-
R2. The number indicates the proportion of the variance of household income ex-
plained by each variable. For example, the sex of household head explains 2.0593% of
the total variance of household income, whereas education explains 4.8322% of it.
Those are relatively low because household dynamics are different from individual
earnings in the labor market.
In Table 3, the occupation of the household head is the largest contributor to the
variance of household income.4 It explains 31.0587% of the explained variance of
household income. Individual characteristics such as sex and age do not contribute to
the variance of household income that much, while education exerts modest influence
on it by 7.9632%. Household wealth is the second largest contributor to the variance of
household income by 27.8768%. Family size plays a significant role in household in-
come inequality. It explains 22.0512% of the explained variance of household income.
Model 2 in Table 3 provides a more parsimonious model in which occupation and in-
dustry of household head are excluded, and only the employment status of the house-
hold head is included. Employment status consists of regular employment, non-regular
employment, employing other employees, self-employment without employees and
atypical workers, and non-working person. Model 2 fits the data as good as the model
1 with the almost same explained variance, R2 0.606816 vs. 60.0000. The impact of em-
ployment status on household income inequality comes from inequality between
Table 3 Household income inequality decomposed through multivariate variables (%)
Model 1 Model 2
Sex 2.0593 3.3936 1.5893 2.6488
Age + Age-squared 3.4320 5.6558 0.2023 0.3372
Education 4.8322 7.9632 5.8808 9.8001
Employment status 2.7471 4.5271 13.1029 21.8382
Occupation 18.8469 31.0587 - -
Industry 4.9104 8.0921 - -
Wealth 16.9161 27.8768 17.5451 29.2418
Family size 13.3810 22.0512 16.5935 27.6558
Residuals 39.3184 - 39.9171 -
R2 100.00 60.6816 100.00 60.0000
Total 100.00 100.00 100.00 100.00
Shin The Journal of Chinese Sociology (2020) 7:17 Page 11 of 15

working persons and non-working persons. Both occupation and employment status
include non-working persons, who increased household income inequality
substantially.
Table 4 displays the contribution of each variable to the total variance of wealth, fol-
lowing the same equation for household income and a modified equation dropping oc-
cupation and industry and adding loans. Model 1 in Table 4 includes household
income in the independent variables to explain wealth. Unlike the decomposition of in-
come inequality, individual characteristics and work-related variables do not display
large impact on wealth inequality. Household income and education explain more than
60% of wealth inequality. Model 2 introduces loans and drops occupation and industry
in the wealth equation to explain wealth inequality. While debt might be a survival re-
source for the poor, it can be a resource for the middle class and the rich for new in-
vestment. Thus, loans can be a leverage for enhancing wealth for the rich. As Fig. 3
illustrates, the high-income groups are more likely to utilize loans than low-income
groups. The high-income groups have more chance to eleviate their wealth and pro-
mote their life chances through the financial markets. We observe the polarization of
the financial markets in favor of the wealthy class.
Significant contributors to wealth inequality are quite different from those of in-
come inequality. When we apply the same variables in the equations, we find out
very different impacts on income and wealth. First of all, human capital variables
are very weak in their impact on wealth inequality. Therefore, we include only
selected variables that were significantly affecting wealth inequality. The model
selected through regression analysis is presented in model 2 in Table 4 in which
income and loans explain almost 75% of inequality of wealth. Loans alone
contribute to wealth inequality by 43.9148%, and household income contributes to
32.6228%. Although the accumulation of income for a period could contribute to
the growth of wealth, loans seem to be more directly associated with wealth. As
housing price has continued to increase in the twenty-first century, the deregula-
tion of financial markets and severe competition among financial institution has
promoted the mortgage loans to the middle class. As the real estate bubble grows
for a while, wealth inequality will continue to increase as well.
The above results display two things. First, the dynamics of income and wealth are
different from each other. While income inequality and wealth inequality are significant
dimensions of economic inequality, the mechanisms of the formation of income and
wealth are very different. Income is an outcome of economic activities as well as profits
from the capital, whereas loans are a financial resource based on income and wealth.
Second, the credit system as a core institution in the financialized economy functions
for the social group, which already enjoys the advantage. That exacerbates income dis-
tribution and economic inequality.
4The contribution of categorical variables to inequality is based on dummy coding. For example, theoccupation in this data has 11 categories; 9 occupational categories, one non-working, and soldiers. Manager-ial occupation is a reference (base) category. The contribution of each categorical variable to inequality is thesum of the contribution by each category. It will generate the same result though we change the referencecategory for any reason.
Shin The Journal of Chinese Sociology (2020) 7:17 Page 12 of 15

ConclusionAnalyzing the SHFLC data that linked the survey data with administrative data in South
Korea, this paper attempts to explore income inequality and wealth inequality and their
reciprocal relationship mediated by financial behavior. While income inequality and
wealth inequality are the two major dimensions of social inequality, sociologists did not
pay much attention to income inequality and wealth inequality. Rather, individual social
mobility based on occupation has been a core research topic among sociologists in so-
cial stratification. Wage inequality has been a focal arena among sociologists in the re-
search on the labor market and gender gap. Therefore, sociologists have stopped at the
individual’s occupation, fall short of a comprehensive understanding of the rising in-
equality of income and wealth since the late twentieth century.
The analysis of inequality of income and wealth in this paper reveals at least five find-
ings. First, the linked data combining the survey data with administrative data shows
higher income inequality than the survey data. The SHFLC data provide more accurate
information about household income, which was registered information around
Table 4 Wealth inequality decomposed through multivariate variables (%)
Model 1 Model 2
Sex 0.7435 1.3959 0.8202 .6488
Age + Age-squared − 1.2328 − 0.0216 0.8311 0.3372
Education 6.9042 12.1185 3.5798 6.9621
Employment status 1.1242 1.9732 4.0311 7.8399
Occupation 0.3763 0.6605 - -
Industry 4.8705 8.5489 - -
Income 24.5113 48.9305 16.7739 32.6228
Loans - - 22.5800 43.9148
Family size 5.9041 10.3631 3.9844 7.7490
Residuals 56.9722 - 48.5823 -
R2 100.00 43.0278. 100.00 51.4177
Total 100.00 100.00 100.00 100.00
Fig. 3 Debt by income decile
Shin The Journal of Chinese Sociology (2020) 7:17 Page 13 of 15
different governmental agencies. It provides a new possibility for social scientists to in-
vestigate income inequality.
Second, wealth inequality is much more severe than income inequality in South
Korea. Almost all indicators of inequality, such as the Gini coefficient, the top 10%
share, and p90/p10, display that wealth is much more concentrated into the top 10%
than income. While ordinary people perceive wealth inequality as a core of economic
inequality, sociologists did not pay much attention to it for various reasons.
Third, the joint distribution of income and wealth shows the highly bi-polarized dis-
tribution in which the pole with the highest 5% of income and the highest 5% of wealth
shows the highest density, indicating the concentration of both income and wealth at
the top 5% of the rich household. The opposite pole with the lowest 5% income and
the lowest 5% wealth shows the second-highest density, revealing the concentration of
poverty in the lowest 5% of the household.
Fourth, the dynamics of income and income inequality are different from the dynam-
ics of wealth and wealth inequality. Household income has been affected by occupation
and family size as well as work-related variables, such as employment status and occu-
pation. Unlike the expectation of researchers on occupation, the effect of occupation
on income inequality is not based on the technical division of labor but the division be-
tween working and non-working population. Thus, employment status rather than oc-
cupation provides a better fitting model with fewer variables. Wealth has been most
affected by household income and loans in South Korea. It indicates that income dir-
ectly affects wealth, and loans mediate the formation of wealth. As the housing market
bubble has grown for the last decade, loans and credit systems play a significant role in
aggravating wealth inequality.
Fifth, the positive feedback loops are working between income and wealth through
capital income and credit systems. The multiplicative effect of the feedback loops has
contributed to the concentration of income and wealth on the top 5 or 10% in recent
years, widening the gap further between the rich and the poor. As wealth is the most
significant factor of income inequality and income is the second most important factor
of wealth inequality, income inequality tends to increase further with the rise of the real
estate price in recent years in South Korea.
There are some limitations to this paper. One is the problem of the representative-
ness of the survey data. Although the size of the Survey of the Household Finance and
Living Conditions is much larger than the previous survey data, the wealthy families re-
ported in the media are not sufficiently included in the data. Furthermore, the ex-
tremely poor are also excluded due to the limitation of accessibility to them. Thus, the
underestimation of income and wealth inequality may be possible. While the linked
data was used, at least the problem of under-representation and inaccessibility remains
unabated. In particular, underrepresentation of the super-rich may result in a much
lower estimation of income inequality and wealth inequality.
Another limitation is the lack of information about an inheritance from parents to
children. The survey data used in this research cannot capture the exact amount of in-
heritance because the information entirely depends on respondents’ answers to survey
questionnaires. Information about inheritance may be a piece of sensitive information
that cannot be revealed by survey interviewers. In addition, most of the heirs of prop-
erty do not pay inheritance tax because the tax bracket is too high, and most of the
Shin The Journal of Chinese Sociology (2020) 7:17 Page 14 of 15

heirs are exempted from taxation. Nevertheless, inheritance has been an essential part
of wealth formation of the people, and wealth transmission over a generation has been
an institutionalized pathway of the rich to maintain their socioeconomic positions
across all societies. We need different data, such as the fully merged administrative
data, as so to thoroughly investigate the dynamics of income and wealth inequality.
AbbreviationsOED: Origin-Education-Destination; SHFLC: The Survey of Household Finances and Living Conditions
Author’s contributionsAll works are done by the author alone.
FundingNo funding
Availability of data and materialsThe data used in this paper is a public data accessible to any researchers, if they register to the Statistical Office Koreavia the Internet.
Competing interestsI declare that there is no competing interest.
Received: 5 February 2020 Accepted: 6 July 2020
ReferencesAcker, Joan. 1973. “Women and social stratification: a case of intellectual sexism,” American Journal of Sociology 78(4): 936-945.Alvaredo, Facundo, Lucas Chancel, Thomas Piketty, Immanuel Saez, and Gabriel Zucman. 2018. World inequality report 2018.
Berlin: World Inequality Lab.Atkinson, Tony. 2015. Inequality. Cambridge, Mass.: Harvard University Press.Breen, Richard and David Muller. 2020. Education and intergenerational social mobility in Europe and the United States,
Stanford: Stanford University Press.Davis, Gerald F., and Suntae Kim. 2015. Financialization of the economy. Annual Review of Sociology 41: 12–211.Esping-Andersen, Gøsta. 1999. Social foundation of the postindustrial economies. Oxford: Oxford University Press.Fiorio, Carlo V., and Stephen P. Jenkins, 2007. “INEQRBD: Stata module to calculate regression-based inequality decomposition,”
Statistical Software Components S456960, Boston College Department of Economics, revised 02 Apr 2010.Jäntti, Markus, Eva Sierminska, and Philippe Van Kerm. 2013. The joint distribution of income and wealth. In Income inequality:
Economic disparities and the middle class in affluent countries, ed. Janet Gornick and Markus Jäntti, 285–311. Stanford:Stanford University Press.
Kalleberg, Arne L. 2000. Nonstandard employment: Part-time, temporary and contract work. Annual Review of Sociology 26 (1):341–365.
Kenworthy, Lane. 2007. Inequality and sociology. American Behavioral Scientist 50 (5): 584–602.Kim, Keuntae. 2017. The changing role of employment status in marriage of formation among young Korean adults.
Demographic Research 36 (5): 145–172.Kroll, Luisa and Kerry A. Dolan. 2019. “Billionaire: the richest people in the world,” Forbes March 5, 2019Myles, John. 2003. Where have all the sociologists gone? Explaining economic inequality. The Canadian Journal of Sociology
28 (4): 551–559.OECD. 2018. A broken social elevator? How to promote social mobility. Paris: OECD.OECD. 2019. Employment outlook 2019: The future of work. Paris: OECD.OECD. 2020. Household debt (http://lps3.www.oecd-ilibrary.org.proxy.cau.ac.kr/economics/household-debt/indicator/english_
f03b6469-en, accessed by January 13, 2020).Piketty, Thomas. 2013. Capital in the 21st century. Cambridge, Mass.: Harvard University Press.Piketty, Thomas, and Emmanuel Saez. 2003. Income inequality in the United States, 1913-1998. Quarterly Journal of Economics
118 (1): 1–39.Savage, Mike. 2016. “Are we seeing a new “inequality paradigm” in social sciences?” (https://blogs.lse.ac.uk/politicsandpolicy/
are-we-seeing-a-new-inequality-paradigm-in-social-science/ accessed by January 10, 2020)Savage, Mike, and Rogers Burrows. 2007. The coming crisis of empirical sociology. Sociology 41 (5): 885–843.Sawyer, Malcolm. 2013. What is financialization? International Journal of Political Economy 42 (4): 5–18.Shin, Kwang-Yeong. 2013. Economic crisis, neoliberal reforms, and the rise of precarious work in South Korea. American
Behavioral Scientist 57 (3): 353–355.Sierminska, Eva, Timothy M. Smeeding, and Serge Allegrezza. 2013. The distribution of asset and debt. In Income inequality:
Economic disparity and the middle class in affluent countries, ed. Janet Gornick and Markus Jäntti, 285–311. Stanford:Stanford University Press.
Stiglitz, Joseph. 2012. The price of inequality: How today’s divided society endangers our future. New York: W. W. Norton.Therborn, Goran. 2013. The killing fields of inequality. Cambridge: Polity.
Publisher’s NoteSpringer Nature remains neutral with regard to jurisdictional claims in published maps and institutional affiliations.
Shin The Journal of Chinese Sociology (2020) 7:17 Page 15 of 15