Embed Size (px)
Citation preview

Turk J Elec Eng & Comp Sci
(2017) 25: 3515 – 3527
c⃝ TUBITAK
doi:10.3906/elk-1610-225
Turkish Journal of Electrical Engineering & Computer Sciences
http :// journa l s . tub i tak .gov . t r/e lektr ik/
Research Article
A new and secure digital image scrambling algorithm based on 2D cellular
automata
Gizem DURSUN, Fadime OZER, Ufuk OZKAYA∗
Department of Electronics and Communication Engineering, Faculty of Engineering, Suleyman Demirel University,Isparta, Turkey
Received: 18.10.2016 • Accepted/Published Online: 25.01.2017 • Final Version: 05.10.2017
Abstract: In this work, a new and secure digital image scrambling algorithm for grayscale images is presented. The
main goal of this algorithm is to change and reorder the positions of the pixel values of the grayscale images according to
the rules of Conway’s Game of Life. For this purpose, an image scrambling matrix is proposed. The proposed algorithm
is mostly applied to known benchmark images of various sizes and histograms. Moreover, the proposed algorithm is
applied to noisy and low-contrast images to evaluate the performance of the algorithm in consumer applications. The
scrambling performance of the algorithm is examined through the evaluation of the correlation values between adjacent
pixels in horizontal, vertical, and diagonal directions and the gray difference degree between a pixel value and its neighbor
pixel values of the plain and scrambled images. Furthermore, the performance of our algorithm is compared to various
state-of-the-art methods. Additionally, in order to measure the reliability of the algorithm, we perform attack analyses
such as damage and occlusion. Results show that the proposed algorithm is robust and ensures high security with a
powerful scrambling performance. Finally, the proposed algorithm can be used in applications providing security of
information, such as image encryption and watermarking.
Key words: Cellular automata, Game of Life, digital image scrambling
1. Introduction
Internet and computer usage is prevalent today due to considerable developments in communication technolo-
gies. At the same time, the necessity of transmission and storage of information shows a huge daily increase.
Information must be preserved from destruction, change, and damage by unauthorized people during trans-
mission and storage. Thus, information security is the most important concern in individual tasks such as
Internet banking, social media, and online shopping, and it is influenced by increasing rates of Internet usage.
Additionally, it is a critical issue in many important applications, especially in military, medical, and public
institutions, where the transmission of data that include vital information is required. In addition to data trans-
mission, medical applications need to store private data in huge databases to be able to use them to observe
the treatment of a patient.
Among multimedia components, images are the most widely used in transmission or storage. Several
methods are proposed for providing security to the information covered by images, and the most commonly
used methods are image encryption and data-hiding. Data-hiding aims to embed the information in a cover
image so that unauthorized people cannot obtain it. Image encryption is a technique that transforms an original
image to a new, visually meaningless image, defined as an encrypted image, in order to preserve the content of
∗Correspondence: [email protected]
3515

DURSUN et al./Turk J Elec Eng & Comp Sci
the image from unauthorized people. Among recent approaches, digital image watermarking [1,2] and digital
image scrambling [3,4] are the most commonly used methods.
Cellular automata (CA) are discrete and dynamic systems that are influentially used for image water-
marking [5,6] and encryption [7–9] applications. The Game of Life (GoL), the most widely known type of cellular
automata, is a relatively new method of digital image scrambling [10–12] that can present simple solutions to
complex problems such as image encryption. The basic principle in digital image scrambling is to ruin the
correlation between adjacent pixels in the original image by changing and rearranging the position of the pixels
in the image. Thus, a new image, composed of adjacent pixels that have the minimum possible correlation, is
generated. Various algorithms and methods have been proposed for digital image scrambling. These methods
are elementary cellular automata [13,15,19], chaos maps [14], Sudoku [16], discrete prolate spheroidal sequences
[17], and ASCII coding [18].
In order to devastate the strong correlation between neighboring pixels and create a resistive scrambled
image towards attacks, powerful scrambling approaches are required. For this purpose, a new digital image
scrambling algorithm is proposed in this work. The main originality of this work is in using a newly introduced
image scrambling matrix, generated by means of Conway’s GoL. The main feature of this matrix is composing
a wide range of integers in its domain. Therefore, this feature enables the algorithm to powerfully scramble the
pixel positions so as to minimize the correlation between adjacent pixels.
2. Cellular automata
Cellular automata, discovered in the 1940s by Ulam and von Neumann, are dynamic systems in time that depend
on the finite states of a regular grid of cells. All cells in these systems have two states. Cells in black and white
are represented as ‘1’ and ‘0’, respectively. The state of each cell is updated at each iteration, called a generation.
The state of each cell at the next generation is estimated based on the states of its neighbors. A method using
cellular automata provides a simple solution to solving complex problems. Thus, cellular automata can have
several application areas such as random number generation, airplane and ship design, urban design, games,
and image processing. In this work, the GoL is the most common type of cellular automata used in the digital
image scrambling procedure. Theoretical details will be given in the next subsection.
2.1. Game of Life
The GoL theory, established in the 1970s by Conway, is the most common type of two-dimensional cellular
automata. GoL theory starts with a random m × n seed matrix A0 . The state of each cell at the next
generation in the seed matrix is determined by checking the cell neighbors’ states. In GoL theory, the state
of each cell is updated in the Moore and von Neumann neighborhood. In this work, the updating process
for each cell is performed in the Moore neighborhood with 8 neighbors. The state of each cell at the next
generations An (n = 1, 2, 3, ...) is determined by state updating, defined between a cell and its neighbors. At
each generation, the state of each cell is updated simultaneously. All cells are updated according to the four
rules of GoL theory [10].
In this work, we utilize these rules to create new generations and form an image scrambling matrix to
scramble the pixel positions of the image powerfully.
3. Proposed approach
In this paper, we present a new approach to the digital image scrambling procedure. Our approach consists of
two phases. In the first phase, the correlation values between adjacent pixels are decreased, and in the second
3516

DURSUN et al./Turk J Elec Eng & Comp Sci
phase, the scrambling effect is increased. The image scrambling matrix (ISM), defined for the first time in the
literature, is proposed for executing the digital image scrambling procedure. The ISM matrix is generated by
evaluating GoL theory rules to the new generation matrices. The distinctive property of the ISM matrix is
being composed of immense and diverse matrix elements. Thereby, the ISM matrix powerfully changes the
position of the pixels in the plain image. The main steps of the proposed approach are given as follows:
Step 1: A random seed matrix (A0) is generated. The size of the seed matrix (m × n) is the same as
that of the plain image.
Step 2: The GoL is executed and new generation matrices An (n = 1, 2, 3, ...) are obtained. The
generation number is equal to the scrambling level. Increasing the scrambling level (n) causes considerable
diversity in the ISM , which leads to a more powerful scrambling performance. However, this also leads to
increased computation costs. Thus, the scrambling level is chosen as 15 in this paper.
Step 3: The ISM is obtained by Eq. (1), given below. The generation of the ISM for n = 5 is shown
in Figure 1.
ISM (i, j) =n∑
k=1
Ak (i, j) × 2(k−1) (1)
Step 4: The first phase of the approach starts at this step. The pixel values of the plain image are changed
in row-first order, according to the values of the ISM , from minimum to maximum value in row-first order.
Figure 2 imitates the changing of positions of the pixel values of an artificial 4 × 4 pixel plain image.
Figure 1. Generation of image scrambling matrix for n = 5.
Step 5: The second phase of the approach starts at this step. The pixel values of the prescrambled
image are changed in row-first order, according to the values of ISM , from maximum to minimum value in
column-first order. Figure 3 imitates the changing of positions of the pixel values of an artificial 4 × 4 pixel
plain image.
3517

DURSUN et al./Turk J Elec Eng & Comp Sci
Figure 2. Scrambling procedure in the first phase.
At the end of these steps, a scrambled image is obtained. To recover the plain image, the inverse of
the scrambling algorithm using keys is executed. In this work, the key is composed of the initial random seed
matrix A0 and the scrambling level n .
Figure 3. Scrambling procedure in the second phase.
4. Studied example
Several analyses are performed in this paper to test the effectiveness of the proposed method. Several grayscale
images are chosen for these analyses. Our method is implemented to test images from the Berkeley Segmen-
tation Dataset and Benchmark (www.eecs.berkeley.edu/Research/Projects/CS/vision/bsds/), USC-SIPI Image
Database (http://sipi.usc.edu/database/), Lena, and cameraman images. In order to investigate the scram-
bling performance of the algorithm, test images of different sizes and histogram distributions are acquired.
Noisy and low-contrast images are used in most mobile and web-based applications. Therefore, our algorithm’s
scrambling performance is also investigated on noisy and low-contrast images. Our algorithm is implemented
to each grayscale test image 10 times. The initial matrix, called seed matrix A0 , is randomly generated, and
the scrambling level (n) is chosen as 15 for each implementation. Increasing the scrambling level (n) causes
considerable diversity in the ISM and this leads to a more powerful scrambling performance; however, it also
leads to considerably higher computation costs. As a result, the scrambling level is chosen as 15 in order to
obtain optimum results.
All the obtained results are used to evaluate the performance of the approach and the two following
parameters are examined. The first performance parameter is the correlation coefficient between adjacent
pixels. The correlation coefficient is calculated from Eq. (2) in three directions: horizontal, vertical, and
diagonal.
3518

DURSUN et al./Turk J Elec Eng & Comp Sci
ρx,y =Cov(x, y)
σxσy=
Cov(x, y)√D(x)
√D(y)
Cov (x, y) =1
N
N∑i=1
[xi − E(x)] [yi − E(y)]
E (x) =1
N
N∑i=1
xi
D (x) =1
N
N∑i=1
[xi − E (x)]2
(2)
Cov (x, y) and σ represent the covariance matrix and standard deviation value, respectively. The correlation
coefficient calculated in Eq. (2) has a value between –1 and +1. In the scrambling procedure, the correlation
coefficient between adjacent pixels in the plain image is expected to be close to 1. On the contrary, the correlation
coefficient between adjacent pixels in the scrambled image is expected to be close to 0.
Another performance parameter is the gray difference degree (GDD), which defines the scrambling effect
of the proposed method and is calculated between the plain image and the scrambled image. The scrambling
effect provides information about the robustness of the scrambled image against passive attacks [10]. The GDD
value is calculated from Eq. (3) as follows:
GD (i, j) =1
4
∑(i′,j′)
[P (i, j) − P (i′, j′)]2
E (GD (i, j)) =
M−1∑i=2
N−1∑j=2
GD (i, j)
(M − 2) × (N − 2)
GDD =E′ (GD (i, j)) − E (GD (i, j))
E′ (GD (i, j)) + E (GD (i, j))
(3)
GD (i, j) represents the gray difference between a pixel and its horizontal and vertical adjacent pixels. E (GD (i, j))
and E′(GD (i, j)) are gray difference values of the plain image and scrambled image, respectively. This param-
eter, which is only implemented to grayscale images, is used to test the scrambling performance of the method
and has a value between –1 and +1. In the scrambling procedure, the GDD value is expected to be close to 1.
5. Results and discussion
In this section, we give the results obtained from several performed analyses. These analyses include corre-
lation coefficients between adjacent pixels, gray difference degree values, size and noise analyses, low-contrast
performances, wrong key analyses, and attack analyses. Test images used in the first analysis have different
histogram distributions and the results obtained using these images are shown in Figures 4a–4f. Correlation
distributions of plain and scrambled images in three directions, given in Figures 4d–4f, are represented for 4000
random sample pixels in the images.
Correlation behavior graphs in Figures 4d–4f show that correlation values between adjacent pixels of all
plain images have linear distribution, contrary to the scrambled images. The proposed method succeeds in
ruining the linear distribution of the correlation values in plain images. The numerical results of the correlation
values between adjacent pixels for plain and scrambled images are given in Table 1. All the correlation values
3519

DURSUN et al./Turk J Elec Eng & Comp Sci
Figure 4. Results of image scrambling: a) plain image, b) histogram distribution of plain images, c) scrambled image,
d) correlation behavior of horizontal adjacent pixels for plain (red) and scrambled (gray) images, e) correlation behavior
of vertical adjacent pixels for plain (red) and scrambled (gray) images, f) correlation behavior of diagonal adjacent pixels
for plain (red) and scrambled (gray) images.
3520

DURSUN et al./Turk J Elec Eng & Comp Sci
in Table 1 are calculated from all the adjacent pixels in the images. The proposed approach is implemented 10
times for each image, and the correlation values of the scrambled images with four types of statistical information
including minimum, maximum, median, and standard deviation values are given in Table 1. The correlation
coefficient has a value between –1 and +1; thus, the median value is calculated instead of the mean value in
order to evaluate results obtained from 10 implementations. In other words, the effectiveness of the proposed
method is proportional to the correlation coefficient between adjacent pixels being close to zero.
The scrambling performance of the proposed algorithm is given and compared to the performance of CA,
GoL, and other methods. In Table 2, these methods are categorized into two groups: methods based on CA
and GoL, and other methods. The GDD value in bold font indicates the best scrambling performance. Results
show that our algorithm obviously outperforms the CA- and GoL-based methods, apart from two test images.
For these test images, our results are close to the best ones. Here it must be emphasized that the GDD values
of our algorithm are median values of 10 implementations for each image.
To test the achievement of the proposed approach, size and noise analyses are performed. The results
obtained from these analyses are shown in Figure 5. The purpose of performing the analyses is to examine the
performance of the approach with respect to the image size and noise level, because the images used in mobile
and web applications have various size and noise levels. For the size analysis, cameraman, Lena, and man
images are resized. In order to evaluate the noise performance, Gaussian noise with zero mean and 5 different
standard deviation values varying linearly from 0.002 to 0.01 are applied to the original cameraman, Lena, and
man images. The obtained results are shown in Figure 5 as an average of GDD values for each size. Figure
5 shows that as the size of the original image increases, our algorithm achieves a more powerful scrambling
performance. A similar situation is also presented in Table 2. The comparison of GDD values between our
algorithm and the other CA- and GoL-based methods indicates that our algorithm outperforms at larger image
size values. Therefore, the proposed algorithm achieves more suitable high-definition images. On the other
hand, Figure 5 shows that noise affects scrambling performance negatively. The main reason for this situation
is that adding Gaussian noise to any image makes its histogram more uniform. This situation is valid not only
for our algorithm, but also for the other CA- and GoL-based scrambling algorithms.
Figure 5. GDD performance of our algorithm with respect to image size and noise.
3521

DURSUN et al./Turk J Elec Eng & Comp Sci
Table
1.Resultsofcorrelationcoeffi
cien
tsoftheplain
andscrambledim
ages.
Imag
esLena
Cam
eram
an23
9096
1570
5513
5069
6901
5Man
(Size)
(256
×25
6)(256
×25
6)(321
×48
1)(321
×48
1)(321
×48
1)(481
×32
1)(102
4×
1024)
Correlation
Horizon
tal
0.945
60.93
350.97
500.94
980.97
100.96
170.97
74
coeffi
cientof
Vertical
0.972
70.95
920.98
280.95
400.96
270.96
320.98
13
plain
imag
esDiago
nal
0.921
30.90
870.96
570.92
450.94
350.92
740.96
71
Horizon
tal
Min
0.000
70.00
080.00
070.00
180.00
110.01
010.00
10
Max
0.006
30.01
000.00
770.01
080.00
890.01
620.00
43
Median
0.003
90.00
460.00
340.00
410.00
350.01
480.00
29
St.
dev.
0.002
80.00
300.00
220.00
300.00
280.00
220.00
10Correlation
Vertical
Min
0.018
30.02
170.01
200.01
700.02
280.03
290.01
87coeffi
cient
Max
0.035
90.03
820.02
210.03
150.03
410.04
420.02
32of
Median
0.023
10.03
240.01
640.02
660.02
650.03
630.02
06scrambled
St.
dev.
0.005
40.00
490.00
300.00
420.00
340.00
390.00
17im
ages
Diago
nal
Min
0.002
10.00
040.00
080.00
010.00
070.00
770.00
03
Max
0.013
20.00
990.00
700.00
840.00
800.01
820.00
51
Median
0.005
60.00
370.00
270.00
550.00
320.01
320.00
24
St.
dev.
0.004
30.00
310.00
270.00
280.00
240.00
350.00
14
3522

DURSUN et al./Turk J Elec Eng & Comp Sci
Table 2. Comparison of GDD values of scrambling algorithms.
Work Method Cameraman Lena Man 69015 157055 239096 135069 5.1.12 7.1.04 7.1.09
[16] Sudoku 0.9165 0.9663 - 0.9439 0.9359 0.9672 - - - -
[17] DPSS 0.1315 0.1353 - 0.5397 0.2752 0.4502 - - - -
[18] ASCII 0.8832 0.9010 - 0.8646 0.878 0.8976 - - - -
[14] CM 0.9118 0.9618 - 0.9406 0.9218 0.9670 - - - -
[10] GoL 0.8971 0.9320 - 0.8827 0.8821 0.9388 - - - -
[12] GoL 0.8816 - 0.9521 - - - - 0.9208 0.9372 0.8879
[12] GoL 0.8845 - 0.9524 - - - - 0.9238 0.9395 0.8896
[12] GoL 0.8877 - 0.9562 - - - - 0.9282 0.9420 0.8940
[15] CA 0.8780 - 0.8460 - - - - 0.8980 0.8810 0.8800
[19] CA 0.8926 0.9311 - 0.8789 0.8731 0.9134 - - - -
Ours GoL 0.8954 0.9200 0.9590 0.9259 0.9066 0.9580 0.9348 0.9317 0.9456 0.8975
The proposed algorithm is also implemented to various low-contrast images. In order to compare the
obtained GDD values to those in other works, common test images are utilized. To obtain generalized
information about the low-contrast performance of the algorithm, this analysis is enriched with extra test
images. The numerical results in Table 3 show that the algorithm can effectively scramble the pixel position
despite the low-contrast constraint.
Table 3. Scrambling performances of CA and GoL methods on low-contrast images.
7.1.08 5.1.11 5.1.09 7.1.01 7.1.02 7.1.03 7.1.07[12] 0.8785 0.8942 - - - - -[12] 0.8806 0.9038 - - - - -[12] 0.8849 0.9076 - - - - -[15] 0.8690 0.8770 0.8640 - - - -Ours 0.8917 0.9139 0.8493 0.8879 0.8965 0.8838 0.7853
In the recovery procedure, the original key determined by the proposed approach is used to accurately
recover the original image. In this paper, the original key is composed of two components, including scrambling
level and the seed matrix (A0). The original image should not be recovered if the content of the original key
has changed. Therefore, wrong key analysis is one of the security analyses performed to examine the success
of the proposed approach. In this analysis, the first row of the seed matrix is changed randomly and then
the recovering procedure is performed, and the GDD values of the obtained recovered image are calculated.
Similarly, the first column of the seed matrix is changed randomly and the GDD values of the recovered image
are calculated. The scrambling level, which is 15 in the original key, is changed to 14 and 16. All these processes
are implemented to all test images and repeated 10 times for each image. The average values of the obtained
results are given in Table 4. The results show that the original image cannot be recovered when the wrong key
is used in the recovery procedure.
Finally, attack analyses are performed to evaluate the reliability of the proposed method. To conduct
these analyses, the content of the scrambled image is ruined and then the recovery procedure is applied to the
ruined image. The differences between the obtained recovered image and the plain image are examined, and
the peak signal-to-noise ratio (PSNR) is calculated. The PSNR is used to evaluate the quality of the image and
is calculated from Eq. (4) as follows:
3523

DURSUN et al./Turk J Elec Eng & Comp Sci
Table 4. Results of wrong key analyses.
Images
GDD values
GDD values of recovered images using wrong keyof scrambledImages
Seed matrix Seed matrix Scrambling Scramblingwith random with random level levelfirst row first column n = 14 n = 16
Lena 0.9199 0.9189 0.9191 0.9192 0.9193Cameraman 0.8955 0.8952 0.8846 0.8959 0.8961Image 239096 0.9580 0.9576 0.9534 0.9578 0.9579Image 157055 0.9067 0.9061 0.9106 0.9067 0.9066Image 135069 0.9348 0.9347 0.9261 0.9351 0.9352Image 69015 0.9259 0.9256 0.9169 0.9261 0.9261Man 0.9590 0.9587 0.9528 0.9589 0.9590
PSNR = 10 logI2max
MSE(dB)
MSE =1
MN
M∑i=0
N∑j=0
(Yi,j − Si,j)2
(4)
Figure 6. Procedure of occlusion and damage attack analyses.
Table 5. Obtained PSNR values for occlusion and damage attacks.
Images Occlusion attack analysis Damage attack analysisPSNR value PSNR value PSNR value PSNR valueof 25% of 50% of 25% of 50%ruined image ruined image ruined image ruined image
Lena 11.5021 8.4979 11.4860 8.4907Cameraman 11.5786 8.5905 10.6317 7.6323Image 239096 13.9523 10.9278 9.1240 6.1224Image 157055 9.9110 6.9076 12.6600 9.6359Image 135069 13.2386 10.2297 10.8121 7.8003Image 69015 16.8099 13.8000 8.2064 5.1980Man 13.6318 10.6190 9.2485 6.2399
3524
DURSUN et al./Turk J Elec Eng & Comp Sci
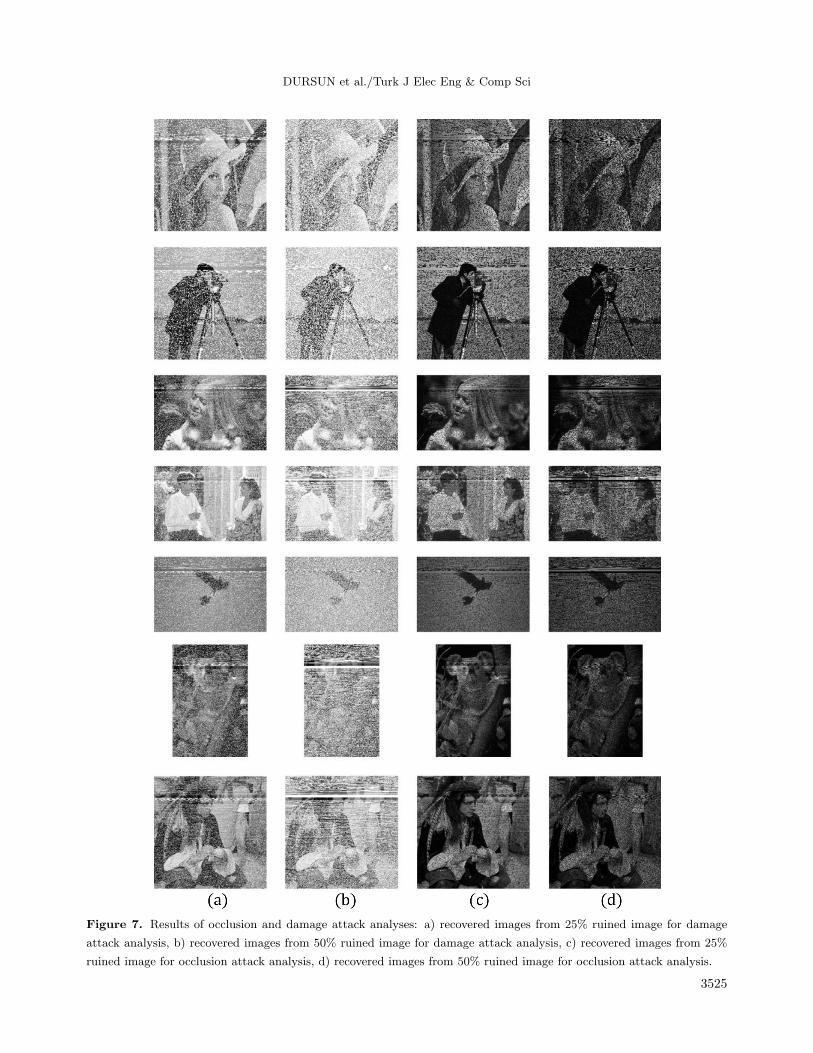
Figure 7. Results of occlusion and damage attack analyses: a) recovered images from 25% ruined image for damage
attack analysis, b) recovered images from 50% ruined image for damage attack analysis, c) recovered images from 25%
ruined image for occlusion attack analysis, d) recovered images from 50% ruined image for occlusion attack analysis.
3525

DURSUN et al./Turk J Elec Eng & Comp Sci
Imax and MSE in Eq. (4) are the maximum grayscale level of the plain image (which is generally 255) and
the mean square error value, respectively. M and N are the number of rows and columns in the image,
respectively. Si,j is the pixel value of the plain image and Yi,j is the pixel value of the ruined scrambled image.
The PSNR increases when the difference between the plain and ruined images decreases. In other words, the
PSNR calculated from the same images is infinite.
Occlusion and damage attacks are chosen for use in attack analyses, since grayscale images are used in
implementations. The specific region of the scrambled image is changed into a white region for damage attack
analysis. Similarly, the specific region of the scrambled image is changed into a black region for occlusion attack
analysis. For example, the size of the specific region is determined as 50 × 50, and the occlusion and damage
attack analyses using this region are implemented to Image 69015. This procedure is shown in Figure 6.
To evaluate the reliability of the proposed method, occlusion and damage attacks are implemented to
one-quarter and half of an image. This procedure is repeated 10 times for each attack analysis and the PSNR
values are computed. The obtained results from these analyses are shown in Figure 7 and calculated PSNR
values for both attack analyses are given as average values in Table 5. The obtained results from these attack
analyses confirm the reliability of the proposed method. The recovered image can still be determined to be
recovered from which image easily, even if half of this image is ruined. In other words, when the scrambled
image is exposed to external attacks, the method resists these attacks powerfully.
6. Conclusion
In this work, we presented a new secure digital image scrambling algorithm. The main purpose of the algorithm
is to minimize the strong correlation between adjacent pixels to obtain a new visually meaningless image by
reordering the pixels of a grayscale plain image. For this purpose, we used an image scrambling matrix based
on a relatively new approach in image scrambling known as the GoL. In order to investigate the scrambling
performance, the algorithm was implemented to several benchmark test images. To evaluate the achievement
of the algorithm, several analyses were performed, including correlation coefficients, GDD values, wrong key
analyses, and attack analyses. Moreover, a rigorous analysis including size analysis, noise analysis, and low-
contrast performance was conducted. The results obtained from these analyses show that this method is quite
successful for grayscale images and can be used effectively in any image watermarking and image encryption
applications. Moreover, as discussed in the previous sections, the algorithm can be augmented for use in color,
high-resolution, noisy, and low-contrast images.
References
[1] Hongqin S, Fangliang LV. A blind watermark algorithm for color image based on dual scrambling technique. In:
IEEE 2010 Intelligent Information Technology and Security Informatics Symposium; 2–4 April 2010; Jinggangshan,
China. New York, NY, USA: IEEE. pp. 781-785.
[2] Yongqi W, Zhang H. A color image blind watermarking algorithm based on chaotic scrambling and integer wavelet.
In: IEEE 2011 Network Computing and Information Security Conference; 14–15 May 2011; Guangxi, China. New
York, NY, USA: IEEE. pp. 413-416.
[3] Quadir F, Peer M. Digital image scrambling based on two dimensional cellular automata. Int J Comput Netw 2013;
2: 36-41.
[4] Lou Y, Hu T. A novel image security system based on cellular automata and improved chaotic system. In: IEEE
2012 Image and Signal Processing Congress; 16–18 October 2012; Chongqing, China. New York, NY, USA: IEEE.
pp. 1139-1142.
3526

DURSUN et al./Turk J Elec Eng & Comp Sci
[5] Wu HL, Zhou JL, Gong XG. A novel image watermarking algorithm based on two-dimensional cellular automata
transform. In: IEEE 2011 Joint International Information Technology and Artificial Intelligence Conference; 20–22
August 2011; Chongqing, China. New York, NY, USA: IEEE. pp. 206-210.
[6] Moniruzzaman M, Hawlader MAK, Hossain MF. Watermarking scheme based on game of life cellular automaton.
In: IEEE 2014 Informatics, Electronics and Vision Conference; 23–24 May 2014; Dhaka, Bangladesh. New York,
NY, USA: IEEE. pp. 1-6.
[7] Rong WC, Jing LJ, Ying LG. A DCT SVD domain watermarking algorithm for digital image based on Moore-
model cellular automata scrambling. In: IEEE 2010 Intelligent Computing and Integrated Systems Conference;
22–24 October 2010; Guilin, China. New York, NY, USA: IEEE. pp. 104-108.
[8] Wolfram S. Cryptography with cellular automata. Lect Notes Comp Sci 1986; 218: 429-432.
[9] Lafe O. Data compression and encryption using cellular automata transforms. In: IEEE 1996 International Joint
Symposia on Intelligence and Systems; 4–5 November 1996; Rockville, MD, USA. New York, NY, USA: IEEE. pp.
234-241.
[10] Dalhoum ALA, Mahafzah BA, Awwad AA, Aldhamari I, Ortega A, Alfonseca M. Digital image scrambling using
2D cellular automata. IEEE Multimedia 2012; 19: 28-36.
[11] Murugan B, Gounder AGN, Manohar S. A hybrid image encryption algorithm using chaos and Conway’s game-of-life
cellular automata. Secur Commun Netw 2016; 9: 634-651.
[12] Kechaidou MG, Sirakoulis GC. Game of Life variations for image scrambling. J Comput Sci (in press).
[13] Chen T, Zhang M, Wu J, Yuen C, Tong Y. Image encryption and compression based on Kronecker compressed
sensing and elementary cellular automata scrambling. Opt Laser Technol 2016; 84: 118-133.
[14] Ye G. Image scrambling encryption algorithm of pixel bit based on chaos map. Pattern Recogn Lett 2010; 31:
347-354.
[15] Dalhoum ALA, Madain A, Hiary H. Digital image scrambling based on elementary cellular automata. Multimed
Tools Appl 2015; 75: 17019-17034.
[16] Wu Y, Zhou Y, Agaian S, Noonan JP. 2D Sudoku associated bijections for image scrambling. Inform Sci 2016; 327:
91-109.
[17] Van De Ville D, Philips W, Van de Walle R, Lemahieu I. Image scrambling without bandwidth expansion. IEEE T
Circ Syst Vid 2004; 14: 892-897.
[18] Ye G, Huang X, Zhu C. Image encryption algorithm of double scrambling based on ASCII code of matrix element.
In: IEEE 2007 Computational Intelligence and Security Conference; 15–19 December 2007; Heilongjiang, China.
New York, NY, USA. pp. 843-847.
[19] Ye R, Li H. A novel image scrambling and watermarking scheme based on cellular automata. In: IEEE 2008
Electronic Commerce and Security Symposium; 3–5 August 2008; Guangzhou, China. New York, NY, USA: IEEE.
pp. 938-941.
3527