Embed Size (px)
Citation preview

A New Action-based Dataset of Fiscal Consolidation
Pete Devries, Jaime Guajardo, Daniel
Leigh, and Andrea Pescatori
WP/11/128

© 2011 International Monetary Fund WP/11/128 IMF Working Paper Research Department
A New Action-based Dataset of Fiscal Consolidation
Prepared by Pete Devries, Jaime Guajardo, Daniel Leigh, and Andrea Pescatori
Authorized for distribution by Petya Koeva Brooks
June 2011
Abstract
This Working Paper should not be reported as representing the views of the IMF. The views expressed in this Working Paper are those of the author(s) and do not necessarily represent those of the IMF or IMF policy. Working Papers describe research in progress by the author(s) and are published to elicit comments and to further debate.
This paper presents a new dataset of fiscal consolidation for 17 OECD economies during1978-2009. We focus on discretionary changes in taxes and government spending primarilymotivated by a desire to reduce the budget deficit and not by a response to prospectiveeconomic conditions. To identify the motivation and budgetary impact of the fiscal policychanges, we examine contemporaneous policy documents, including Budgets, BudgetSpeeches, central bank reports, Convergence and Stability Programs submitted by theauthorities to the European Commission, and IMF and OECD reports. The resulting series canbe used to estimate the macroeconomic effects of fiscal consolidation. JEL Classification Numbers: E62, H20, H5, H6 Keywords: Fiscal policy, taxation, government expenditure Author’s E-Mail Address: [email protected], [email protected], [email protected],

2
Contents
I. Introduction ........................................................................................................................... 3
II. Methodology ........................................................................................................................ 4
A. Motivation of Measures ................................................................................................... 4 B. Budgetary Effects ............................................................................................................. 5
III. Country-by-Country Summary of Our Findings ................................................................. 6
A. Australia ........................................................................................................................... 6 B. Austria ............................................................................................................................ 12 C. Belgium .......................................................................................................................... 15 D. Canada ............................................................................................................................ 20 E. Denmark ......................................................................................................................... 29 F. Finland ............................................................................................................................ 31 G. France ............................................................................................................................. 34 H. Germany ......................................................................................................................... 38 I. Ireland .............................................................................................................................. 46 J. Italy .................................................................................................................................. 49 K. Japan .............................................................................................................................. 54 L. Netherlands ..................................................................................................................... 60 M. Portugal ......................................................................................................................... 65 N. Spain .............................................................................................................................. 68 O. Sweden ........................................................................................................................... 71 P. United Kingdom ............................................................................................................. 73 Q. United States .................................................................................................................. 80
Appendix ................................................................................................................................. 86
References ............................................................................................................................... 88

3
I. INTRODUCTION1
This paper constructs a new database of fiscal consolidation measures taken by the governments of 17 OECD economies to reduce budget deficits during 1978-2009. The existing literature usually identifies fiscal policy consolidation using a statistical concept such as the increase in the cyclically-adjusted primary budget balance (CAPB). However, as a number of studies explain, using the CAPB to estimate the macroeconomic effects of fiscal consolidation is problematic. First, cyclical adjustment methods suffer from measurement errors that are likely to be correlated with economic developments. In particular, cyclical adjustment typically fails to remove the impact of sharp swings in economic activity and asset prices from fiscal data, resulting in changes in the CAPB that are correlated with economic activity but are not necessarily linked to policy actions. For example, a boom in the stock market improves the CAPB by increasing capital gains and cyclically-adjusted tax revenues and is also likely to raise domestic demand. Second, even if the change in the CAPB accurately reflects discretionary changes in fiscal policy, those can be motivated by a desire to respond to cyclical fluctuations, raising reverse causality concerns. For example, governments may cut government spending in an overheating economy, implying a positive correlation between fiscal policy tightening and rapid growth. These shortcomings complicate efforts to estimate the macroeconomic effects of fiscal consolidation, and are likely to bias the analysis toward finding evidence of expansionary effects.2 To avoid these problems associated with the conventional approach, we identify fiscal consolidation actions using a historical approach similar to that of Ramey and Shapiro (1998), Ramey (2011), and Romer and Romer (2010). In particular, we examine policymakers’ intentions and actions as described in contemporaneous policy documents, and identify measures motivated primarily by deficit reduction. As Romer and Romer (2010) explain, such fiscal actions represent a response to past decisions and economic conditions rather than to prospective conditions. As a result, they are unlikely to be systematically correlated with other developments affecting output in the short term, and are thus valid for estimating the macroeconomic effects of fiscal consolidation. The historical sources we examine include Budget Reports, Budget Speeches, central bank reports, Convergence and Stability Programs submitted by the authorities to the European Commission, IMF reports and OECD Economic Surveys. In addition, we examine country-specific sources, such as the Congressional Budget Office (CBO) reports and the Economic Report of the President for the United States, the Journal Officiel de la Republique Francaise for France, Ministry of Finance press releases and publications, and, in one case, a transcript of a television
1 We are especially grateful to David Romer for his valuable guidance. We are also grateful to John Bluedorn, Petya Koeva Brooks, Roberto Perotti, Keiko Takahashi, and Kiichi Tokuoka for helpful comments; to Sue Borlo and Rebecca West of the Joint Bank-Fund Library for their support in locating the historical records cited in this paper; and to Murad Omoev, Min Song, and Jessie Yang for excellent research assistance. An earlier version of this database was used for analysis in IMF (2010). 2 For a further discussion of the pitfalls of using cyclically-adjusted fiscal data, see, for example, Romer and Romer (2010), Milesi-Ferretti (2009), Morris and Schuknecht (2007), and Wolswijk (2007).

4
interview. These documents provide evidence of what policymakers believed at the time that decisions were taken, as well as the budgetary impact of the measures. Based on this approach, our sample includes 173 fiscal policy adjustments in 17 OECD economies between 1978 and 2009. The data are presented at an annual frequency. The countries included in our sample are Australia, Austria, Belgium, Canada, Denmark, Finland, France, Germany, Ireland, Italy, Japan, the Netherlands, Portugal, Spain, Sweden, the United Kingdom and the United States. A quantitative comparison of our series of deficit-driven fiscal consolidations and the change in the CAPB is provided in Guajardo, Leigh and Pescatori (2011). Part II describes how we determine the motivation of fiscal actions and their budgetary effects from the historical record. Part III provides detailed citations for each case of fiscal consolidation we identify. The appendix tabulates the new series of fiscal consolidation and provides a breakdown into spending and tax measures.
II. METHODOLOGY
A. Motivation of Measures
A key step in the analysis is to examine policymakers’ intentions to ensure that the tax and spending measures that we include in our database were motivated primarily by the desire to reduce the budget deficit and not by a response to prospective economic conditions. The documents for the 17 OECD countries in our sample indicate two principal motivations for discretionary fiscal contraction: a desire to reduce the budget deficit to shore up government financial sustainability; and a desire to restrain domestic demand for cyclical reasons. In most cases, governments introduce fiscal consolidation measures based on a desire to reduce the budget deficit. Austria in 1996 provides an example of such a policy change. The authorities introduced austerity measures to conform to the budget deficit criteria for European Monetary Union (EMU) accession, agreed under the terms of the 1992 Maastricht Treaty, and not because there was a risk of economic overheating. Another example is the U.S. Omnibus Budget Reconciliation Act of 1993, which involved raising taxes and cutting spending not to reduce the risk of economic overheating, but because policymakers saw it as a prudent policy change with potential long-term benefits.3 In other cases, the motivation for cutting government spending or raising taxes is restraining domestic demand. Finland in the mid 1980s provides an example, as the 1985 IMF Recent Economic Developments reports (pp. 24-25): “As the international recovery gathered strength during 1983, it was judged necessary to tighten fiscal policy so as to offset the strong stimulus likely to derive from the expected surge in the growth of external demand and to counter the mounting imbalances in the economy… The shift to a contractionary fiscal stance
3 In a number of cases, the objective of deficit reduction is part of a medium-term strategy aimed at limiting the size of government.

5
had the desired result, and the growth of domestic demand decelerated notably, just as the boom in exports was developing.” For the purposes of our analysis, we only record fiscal actions primarily motivated by the desire to reduce the budget deficit in the dataset. If consolidation is motivated primarily by restraining domestic demand, we note its occurrence in the paper, but do not include it in our database. By the same token, we record fiscal consolidation in our database even if it is followed by an adverse shock and an offsetting countercyclical discretionary stimulus. For example, imagine that two countries adopt identical fiscal consolidation policies at the beginning of the year, but then one is hit by an adverse shock and so adopts discretionary stimulus that completely offsets the fiscal consolidation. Thus, there may be no overall deliberate policy tightening in the country hit by the adverse shock, despite the presence of the same consolidation measures as in the other country. In such cases, to avoid selection bias––omitting fiscal consolidations associated with unfavorable shocks––we include the associated fiscal consolidation measures in our database. The case of Finland in 1992 provides a real-world counterpart to this hypothetical example. The authorities introduced government spending cuts in the 1992 Budget motivated by the desire to reduce a large fiscal deficit (1993 IMF Recent Economic Developments, p. 16). However, the budgetary savings were offset by discretionary government spending increases, including financial support to domestic banks, in response to deteriorating economic conditions. At the same time, if fiscal consolidation is offset by fiscal actions not primarily motivated by cyclical fluctuations, such as a tax cut motivated by long-run supply-side considerations, we compute the sum of the measures and conclude that consolidation occurred if the overall change in policy yields budgetary savings. For example, if spending cuts motivated by deficit reduction are fully offset by tax cuts associated with long-run supply-side considerations, we conclude that no fiscal consolidation occurred. The United States in the early 1980s provides real-world counterparts to these hypothetical examples. In 1977, Congress legislated tax hikes for 1979-1982 to strengthen the solvency of the Social Security system, but in 1981 Congress passed income tax cuts for 1981-1984 “largely for ideological or long-term reasons” (Romer and Romer, 2009, pp. 68-69). In 1982, the sum of these two opposing tax changes––a tax hike and a tax cut––amounted to a fiscal expansion, and we therefore conclude that 1982 was not a year of fiscal consolidation, despite the presence of a deficit-reducing tax increase.
B. Budgetary Effects
The historical sources and records described above provide the estimated budgetary impact of fiscal consolidation measures. Following Romer and Romer (2010), we use the contemporaneous estimates contained in these sources since retrospective estimates are rarely available. We record the budgetary effect of the fiscal consolidation measures in the year in which they come into effect. Unless otherwise stated, the concept of government corresponds to the general government. To facilitate empirical work using the series, we scale the budgetary impact of the measures in percent of GDP.
6
If measures were announced but the historical record suggests that they were not implemented, we do not include them in the database. To assess whether measures were implemented, we examine subsequent editions of the historical documents that report on recently implemented policy actions. The case of Japan in the late 1990s provides an example of fiscal consolidation that was announced but not fully implemented. In particular, Japan’s multi-year fiscal consolidation plan for 1997-2003 (the Fiscal Structural Reform Act) was suspended at the end of 1998. The FY 2004 Budget explains that “in December 1998, Government decided to suspend the effect of the Fiscal Structural Reform Act, in the light of doing its best to recover from the weak economy” (“History of Japan’s Public Finance,” FY 2004 Budget, p. 1). Fiscal consolidation did not resume until 2003. We therefore do not record fiscal consolidation during 1999-2002 in the database. The case of Italy in the early 1980s provides another example. As reported in the Banca d’Italia Annual Report 1982 (p. 78), implementation of the 1982 deficit-reduction package was hampered by “[t]he late approval of the budget and finance bills, the dropping of several measures subsequently resubmitted in a separate bill in August, and the abandonment of others, such as higher health service charges.” We therefore do not record this fiscal consolidation in the database. We also distinguish between permanent and temporary measures. Temporary policy measures are recorded as having a positive budgetary impact (implying an increase in saving) when they come into effect and a negative impact when they expire. For example, we record a one-year increase in taxes of $1 billion in year t as having an impact of $1 billion in year t and of –$1 billion in year t+1. In contrast, a permanent measure is recorded as having a positive budgetary impact when it comes into effect and zero thereafter. For example, a permanent tax hike of $1 billion would be coded as $1 billion in year t and zero thereafter. Overall, therefore, the budgetary effects can be both negative and positive.
III. COUNTRY-BY-COUNTRY SUMMARY OF OUR FINDINGS
In this section, we attempt to provide a sufficient number of quotations and citations from the historical record so that readers can see the evidence behind our conclusions regarding the motivation and budgetary impact of fiscal consolidation actions.
A. Australia4
Australia 1985 A multiyear program of deficit reduction began in 1985 based on spending cuts, with measures totaling 0.45 percent of GDP in 1985. After the December 1984 elections, the Government announced a set of medium-term fiscal policy commitments, known as the Trilogy, aimed at reducing a large inherited budget deficit by cutting government spending. As the 1985-1986 Budget Speech explained, “The Trilogy requires the Government not to increase the percentage of tax revenue above the 1984-85 share of taxation in the total 4 All fiscal measures refer to the federal government. Since the fiscal year (FY) runs July 1-June 31, an A$1 measure taken in “FY t/t+1” is split across the two calendar years as follows: A$½ to year t and A$½ to year t+1, unless otherwise stated. The sources consulted for Australia are various issues of the Budget Speech, IMF Recent Economic Developments, IMF Staff Report, and the OECD Economic Surveys.

7
economy. The Trilogy also commits us to reducing commonwealth government expenditure as a proportion of the total economy. And it requires a reduction in the size of the deficit” (1985-86 Budget Speech, p. 3). The Trilogy formed the basis for the 1985-86 budgetary strategy. The 1985-86 Budget Speech emphasized the importance of deficit reduction in FY 1985-86 (p. 3): “Our Trilogy of budgetary commitments will be more than met in 1985-86… The deficit has been cut sharply, both as a proportion of the economy and in money terms.” In line with the Trilogy framework, the measures were on the spending side: on May 14, the Treasurer announced expenditure cuts totaling $A 1,259 million (0.9 percent of GDP), with the majority of the cuts on recurrent expenditure side (OECD Economic Surveys 1986/1987, p. 86). The calendar-year allocation of the spending cuts is recorded as 0.45 percent of GDP in both 1985 and 1986.5 Australia 1986 The fiscal consolidation initiated in 1985 continued in 1986, with measures totaling 1.02 percent of GDP, most of which were on the spending side. Fiscal consolidation continued to be motivated by deficit reduction, in line with the medium-term Trilogy commitment (see entry for 1985). The 1987 IMF Recent Economic Developments (p. 35 and p. 54) reports a number of spending cuts that yielded cumulative savings of $A 1.98 billion in FY 1986/87 and $A 1.45 billion in FY 1987/88.6 At the same time, tax measures (Medicare 5 Notes on 1978-1984. While fiscal policy tightening did occur during 1978-1982, it was primarily motivated by restraining demand and reducing inflation. Therefore, we do not record these policy measures as fiscal consolidation motivated primarily by deficit-reduction and fiscal sustainability considerations. The OECD Economic Surveys 1979 (p. 30) reports that the main objective of fiscal consolidation in 1979 was “reducing inflation through the maintenance of tight demand management policies.” Accordingly, the 1978-1979 Budget introduced tax hikes totaling $A 1.8 billion in FY 1978-79 (OECD Economic Surveys 1979, p. 30), of which $A 686 million corresponded to temporary personal income tax increases (FY 1978-79 only). Based on our convention for allocating budgetary effects to calendar years, the budgetary impact of these cyclically-motivated measures was $A 0.9 billion (0.87 percent of GDP) in 1978. The 1979-80 Budget re-emphasized the authorities’ commitment to restraining inflation, and introduced further tax increases worth $A 1.0 billion in FY 1979-80, including a temporary extension of the income tax surcharge introduced in the 1978-79 Budget (OECD Economic Surveys 1980, pp. 38-39). Based on our convention for allocating budgetary effects to calendar years, cyclically-motivated fiscal tightening thus amounted to $A 1.1 billion in 1979 (0.93 percent of GDP), and, due to the end of the temporary extension of the personal income tax measure, $A –122 million (–0.09 percent of GDP) in 1980. The key objective of the 1981-82 Budget was disinflation, as the OECD Economic Surveys 1981-1982 explains (p. 36): “The 1981/82 Budget brought down on 18th August 1981 was designed primarily to constrain and then reduce the increasing inflationary pressures in the economy.” Spending cuts occurred based on the Review of Commonwealth Functions, with cuts of $A 600 million over 18 months, of which about ⅔ ($A 400 million) coincided with FY 1981-82 (p. 38). There was also a net tax increase in FY 1981-82 of $A 48 million (a tax increase of $A 553 partly offset by a tax reduction of $505). Overall, fiscal contraction amounted to $A 448 million in FY 1981-82, which implied, based on our convention for allocating budgetary effects to calendar years, a contraction of $A 224 million in 1981 (0.15 percent of GDP). During 1982-84, fiscal policy eased in response to short-term economic developments, namely, to support the recovery from the sharp recession which started in late 1981 (OECD Economic Surveys 1982-1983, p.7, p. 64, OECD Economic Surveys 1983-1984, p. 39, and OECD Economic Surveys 1984/1985, p. 29).
6 The spending cuts fell on a broad range of categories including, as explained in the 1987 IMF Recent Economic Developments (pp. 36-37), reductions in capital assistance to the States, making social security and welfare programs more efficient, defense, education, health, culture and recreation, transport and communications, industry assistance and development, overseas aid, and a reduction of 2,000 in the number of federal public servants.
8
levy, company tax, excise duties, wholesale sales tax) yielded cumulative savings of $A 2.08 billion in FY 1986/87 and $A 1.74 in 1986/87 (p. 35 and pp. 40-41). Finally, a tax reform occurred, which had a cumulative impact on taxes of –$A 1.23 billion in 1986/87 and –$A 3.64 billion in FY 1987/88.7 On the spending side, the change in savings related to spending cuts was thus $A 1.98 billion in FY 1986/87 and –$A 0.53 billion in 1987/88 (1.45–1.98). On the revenue side, the total change in budgetary savings related to revenue measures and the tax reform was $A 0.85 billion in 1987/88 and –$A 2.75 billion in 1987/88 (–1.90–0.85). In $A billion, the allocation of these changes in saving across calendar years 1986-1988 was: Spend: 0.99 (1.98/2) in 1986; 0.725 (1.98/2–0.53/2) in 1987; and –0.265 (–0.53/2) in
1988. Tax: 0.425 (0.85/2) in 1986; –0.525 (0.85/2–1.90/2) in 1987; and –0.85 (–1.90/2) in
1988. In percent of GDP, the allocation of these changes in saving across calendar years was: Spend: 0.40 percent in 1986; 0.26 percent in 1987; and –0.08 percent in 1988. Tax: 0.17 percent in 1986; 0.19 percent in 1987; and –0.27 percent in 1988. Total: 0.57 percent in 1986; 0.45 percent in 1987; and –0.35 percent in 1988. Finally, given the impact of the spending cuts introduced in FY 1985/86 (0.45 percent of GDP––see entry for 1985 above), total fiscal consolidation amounted to 1.02 percent of GDP in 1986, with spending cuts of 0.85 percent of GDP (0.40+0.45), and tax hikes of 0.17 percent of GDP. Australia 1987 Fiscal consolidation totaled 0.90 percent of GDP, with spending cuts of 0.71 percent of GDP and tax hikes of 0.19 percent of GDP. The Budget Speech 1987-88 (pp. 1-2) announced further spending cuts motivated by deficit-reduction: “This Government, having inherited a prospective budget deficit of almost $A 10,000 million, the largest in the Nation’s history, has in the space of just 5 budgets wiped that dismal legacy out… This Budget also lays the foundations for sound budgets over the life of this Parliament. The decisions which have cut outlays by $A 3.500 million this year will produce the same reductions next year. In other words, the savings are on-going.” As the 1988 IMF Recent Economic Developments, pp. 25-26 reports, the gross savings generated by the spending cuts mentioned in the Budget Speech were partly offset by a number of new initiatives so that, overall, “policy decisions by the Government in developing the budget reduced forward estimates of outlays by a net $A 2.5 billion (or 0.9 percent of GDP) in 1987/88.” The spending cuts fell mainly on assistance to the States, social security and welfare (“improve administration, tighten eligibility criteria,
7 The tax reform resulted in a fall in tax revenue for the following reason: “The main element in the package that caused this revenue loss was a lowering of marginal tax rates on personal income in order to improve economic incentives” (1987 IMF Recent Economic Developments, p. 38).
9
and counter fraud and abuse in the payment of income support”, p. 26), defense, and transport. The allocation of these spending cuts across calendar years is as follows: 0.45 percent of GDP in 1987 and 1988, respectively. Taking into account the impact of measures introduced in the 1986/1987 Budget (see entry for 1986 above), fiscal consolidation implemented in 1987 amounted to 0.90 percent of GDP, with spending cuts of 0.71 percent of GDP (0.26+0.45) and tax increases of 0.19 percent of GDP.
Australia 1988 Fiscal consolidation totaled 0.10 percent of GDP, with spending cuts of 0.37 percent of GDP largely offset by tax cuts of 0.27 percent of GDP. These measures implemented in 1988 were decided upon in FY 1986/87 and FY 1987/1988 and were motivated by deficit reduction (see entries for 1986 and 1987 above). Spending cuts amounted to 0.37 percent of GDP (–0.08+0.45), while tax cuts amounted to 0.27 percent of GDP.
Australia 19948 Fiscal consolidation totaled 0.25 percent of GDP based entirely on tax measures. The August 1993 Budget provided for a small countercyclical fiscal stimulus in FY 1993/94––the economy was still recovering from the recession in the early 1990s––but also announced a four-year consolidation plan to reduce the budget deficit to around 1 percent of GDP by FY 1996/97 (OECD Economic Surveys 1994, p. 37). As the Budget Speech 1994-95 (pp. 6-7) emphasizes, the fiscal policy tightening starting in FY 1994/95 was motivated by deficit reduction to raise national saving and private-sector investment: “By winding back the deficit, the public sector reduces its call on national saving. This increases our capacity to finance further private sector investment without the need for greater recourse to other nations’ savings through increased overseas borrowing... The Government fully recognizes this and has implemented one of the most rigorous fiscal consolidation programs of all industrial countries.” The Budget Speech 1994-95 (p. 7) also discussed some of the deficit-reducing measures legislated in the FY 1993/94 Budget that would reduce deficits over the next few years: “Last year the Government legislated major steps to implement its deficit reduction strategy, and ensure that the 1996-97 outcome would accord with its commitment. This involved a package of measures which improved the projected outcome for 1996-97 by almost 1¾ percent of GDP.” The bulk of the saving measures over the four years were planned on the revenue side (OECD Economic Surveys 1994, p. 41). The main tax measures included the deferral of previously scheduled personal income tax cuts, increases in excise duties on fuel products and tobacco, and higher wholesale sales taxes (p. 41). In FY 1994/95 fiscal consolidation amounted to 0.5 percent of GDP due to tax measures (p. 41). At the same time, there was an increase in spending in FY 1994/95 of about 0.4 percent of GDP, mainly on the Working Nation program (OECD Economic Surveys 1995, p. 46). However, as the
8 Notes on 1989-1993. During 1989-1990, no fiscal consolidation measures motivated by deficit-reduction were introduced. There were some minor tax reductions and an increase in social security taxes. Following the 1990 recession, consolidation was again postponed given the priority of supporting the recovery: “Fiscal policy has actively supported economic recovery in recent years” (OECD Economic Surveys 1994, p. 37). Looking back at the early 1990s, the Budget Speech 1994-95 (p. 6) explains that “When an economy is in recession, it is entirely appropriate that budgetary policy be deployed to support the economy and the community. That involves a rising deficit.”
10
Budget Speech 1994-95 clarifies (p. 8), “These programs are primarily aimed at reducing unemployment.” Since this spending increase was a response to economic developments, we do not record it in our dataset. Total fiscal consolidation motivated by deficit reduction in FY 1994/95 thus amounted to 0.5 percent of GDP, with all consolidation measures the tax side. The calendar year allocation of the consolidation is 0.25 percent of GDP in both 1994 and 1995 (0.5/2).
Australia 1995 Implementation of the multiyear fiscal consolidation program announced in the FY 1993/94 Budget continued in 1995, with measures amounting to 0.50 percent of GDP on the tax side. The fiscal consolidation was motivated by deficit reduction (see entry for 1994). As the 1996 IMF Recent Economic Developments reports (p. 22), the measures in FY 1995/96 included “a second round of wholesale sales tax increases and the bringing forward of company tax payments (total yield equivalent to about ½ percent of GDP).” The calendar-year allocation of the consolidation is 0.25 percent of GDP in both 1995 and 1996. In calendar year 1995, fiscal consolidation thus totaled 0.5 percent, consisting of the 0.25 percent of GDP tax measures implemented in each of the two fiscal years overlapping with 1995 (FY 1994/95 and FY 1995/96).
Australia 1996 Fiscal consolidation accelerated in 1996 with a new multiyear fiscal consolidation program, and measures totaling 0.62 percent of GDP, mainly on the tax side. After winning the 1996 federal elections, the new Coalition government implemented a new fiscal consolidation plan aimed at eliminating the budget deficit by FY 1998/99 (OECD Economic Surveys 1997, p. 58). The 1996-97 Budget Speech (pp. 1-2) underlines that the motivation was to reduce a large inherited budget deficit: “Our predecessors had Australia on a path of deficit and debt to the next century… Our Government could not stand back and ignore the problem. Although we did not create it, we will take the responsibility to fix it. The measures I announce tonight will reduce the underlying deficit by around $4 billion this year and $7.2 billion over two years. These measures will balance the budget over the term of this Parliament.” The OECD Economic Surveys 1997 reports (p. 59) the following impact of the spending and tax measures introduced in the FY 1996-97 Budget over the next three years: A cumulative impact on spending of –$A 2.929 billion in FY 1996-97, –$A 5.197 billion
in FY 1997-98, and –$A 4.847 billion in FY 1998–99.9 The change in saving related to spending measures was thus $A 2.929 billion in FY 1996-1997 (0.55 percent of GDP), 2.260 billion (5.197–2.929) in FY 1997-98 (0.4 percent of GDP), and –0.350 billion in 1998-99 (–0.06 percent of GDP).
A cumulative impact on tax revenue of $A 0.979 billion in FY 1996-97, $A 1.955 billion in FY 1997-98, and $A 1.524 billion in FY 1998-99. The change in saving related to tax measures was thus $0.979 billion in FY 1996-1997 (0.18 percent of GDP), 0.976 billion
9 The spending adjustment relied mainly on “the government reassessing its existing spending priorities and aiming to achieve greater efficiency and effectiveness in the delivery of public services” (1997 IMF Recent Economic Developments, p. 19).
11
(1.955–0.979) in FY 1997-98 (0.17 percent of GDP), and –0.431 billion in 1998-99 (–0.07 percent of GDP).
In percent of GDP, the allocation of these changes in saving across calendar years was: Spend: 0.275 in 1996 (0.55/2); 0.475 in 1997 (0.55/2 + 0.4/2); 0.17 in 1998 (0.4/2 –
0.06/2) and –0.03 in 1999 (–0.06/2). Tax: 0.09 in 1996 (0.18/2); 0.175 in 1997 (0.18/2 + 0.17/2); 0.05 in 1998 (0.17/2 –
0.07/2); and –0.035 in 1999 (–0.07/2) Total: 0.365 in 1996; 0.65 in 1997; 0.22 in 1998; and –0.065 in 1999. Finally, given the impact of the revenue measures introduced in FY 1995/96 (0.25 percent of GDP––see entry for 1995 above), total fiscal consolidation in 1996 amounted to 0.62 percent of GDP, with spending cuts of 0.28 percent of GDP, and tax hikes of 0.34 percent of GDP (0.25+0.09).
Australia 1997 Implementation of the fiscal consolidation program initiated in 1996 continued in 1997 and, with some additional measures, amounted to 0.70 percent of GDP, mostly on the spending side. The Budget Speech 1997-98 (p. 1) reasserted the importance of tightening fiscal policy to reduce the large budget deficit inherited from the previous administration: “Our country had been on a losing strategy––a path of deficit and debt to the next century. So we took that problem––not one of our making––we faced it and we determined to fix it. You can’t fix years of neglect overnight. But our Government laid out its strategy and got on with the job. Tonight I can report we have made very significant progress. And tonight I announce measures to consolidate and extend that progress, measures which can secure our objective to put the Commonwealth budget into surplus in this our first term of Government.” The measures introduced in the FY 1997/98 Budget (which came on top of those introduced in the multiyear program of the FY 1996/97 Budget) were mainly on the spending side, and yielded cumulative savings of, in percent of GDP, 0.1 in FY 1997/98, 0.3 in 1998/99, 0.3 in 1999/2000 and 0.3 in 2000/01 (OECD Economic Surveys 1998, p. 49).10 The impact of these additional measures on the change in saving was thus, in percent of GDP, 0.1 in FY 1997/98, 0.2 (0.3–0.1) in FY 1998/99, and zero thereafter. The calendar-year allocation of these measures is as follows: 0.05 in 1997 (0.1/2), 0.15 in 1998 (0.1/2 + 0.2/2), and 0.1 in 1999 (0.2/2). Including the measures introduced in FY 1996/97 (see entry for 1996 above), fiscal consolidation in 1997 thus amounted to 0.70 percent of GDP, with spending cuts of 0.525 percent of GDP (0.1/2+0.475) and tax measures of 0.175 percent of GDP.
10 These effects are due to measures introduced after the FY 1996/97 budget (but before the FY 1997/98 budget), and those included in the FY 1997/98 budget, as described in Table 8 in OECD Economic Surveys 1998 (p. 49). They can be replicated as: second line (underlying balance before all measures since the 1996-97 Budget) minus last line (underlying balance, 1997-98 Budget).

12
Australia 1998 Fiscal consolidation totaled 0.37 percent of GDP, almost all on the spending side. Given the substantial fiscal consolidation introduced in the previous two Budgets (see entries for 1996 and 1997 above) further restraint was not introduced in the FY 1998/99 Budget (OECD Economic Surveys 1999, p. 54). The Budget Speech 1998-99 expressed satisfaction at the pace of deficit reduction, and reaffirmed the commitment to reduce government debt accumulated during the previous administration: “We wanted to get the budget out of deficit–out of the red and into the black––in three years… That was two years ago. This coming year is the third year of the journey. We will finish the first leg in good shape. We have achieved our goal. Our budget is now in surplus… And now we set out on the second leg of our journey. Our second leg is to pay our way now and set up opportunities for the future by repaying Labor’s debt. Repaying the debts of the past will secure the jobs for the future. Lower debt means lower interest payments.” Based on the measures introduced in the FY 1996/97 and FY 1997/98 Budgets, fiscal consolidation in 1998 amounted to 0.37 percent of GDP, with spending cuts of 0.32 percent of GDP (0.17+0.15) and tax measures of 0.05 percent of GDP. Australia 1999 A small fiscal consolidation of 0.035 percent of GDP occurred, based on spending cuts. In particular, measures introduced in the FY 1996/97 and FY 1997/98 Budgets (see entries for 1996 and 1997 above) implied a small fiscal consolidation in 1999 of 0.035 percent of GDP (–0.065+0.1), with the savings based on spending restraint (net spending cuts of 0.07 versus a tax impact of –0.035).11
B. Austria12
Austria 1980 Fiscal consolidation totaled 0.80 percent of GDP, with spending cuts of 0.69 percent of GDP and tax hikes of 0.11 percent of GDP. Fiscal consolidation was motivated by deficit reduction, as the 1979 IMF Recent Economic Developments reports (p. 28): “With the 1980 budget the authorities announced their aim to lower the deficit in the medium term to some 2½ percent of GDP, in order to increase the scope for stimulative fiscal policies when warranted by future economic developments. Therefore, in the budget proposals for 1980 restrictive measures were incorporated aimed at a reduction of the federal deficit.” The 11 Notes on 2000-2007. In 2000, fiscal policy relaxation occurred due to a landmark tax reform designed to improve economic efficiency costing about 1 percent of GDP per year from FY 2000/01 onwards (1999 IMF Staff Report, p. 18). In addition, as reported in the OECD Economic Surveys 2000-2001 (p. 31), government spending was boosted by Australia’s peacekeeping commitments in East Timor and increased spending on refugees. Fiscal policy was also expansionary after the turn of the century in response to weaker growth (OECD Economic Survey 2002-2003 (p. 58). Finally, the OECD Economic Surveys 2008 (p. 10) reports that “Since 2002/03, the federal government has regularly redistributed additional tax revenues derived from the terms of trade gains, thus pursuing an expansionary fiscal policy. The cumulative stimulus to the economy may have amounted to around 2½ per cent of GDP until 2007/08.”
12 The sources consulted for Austria are various issues of the IMF Recent Economic Developments, IMF Staff Report, and the OECD Economic Surveys.
13
specific measures taken to reduce the deficit were primarily on the spending side, with spending cuts of S 7.2 billion (0.69 percent of GDP) and tax measures of S 1.2 billion (0.11 percent of GDP), as reported in the 1981 IMF Recent Economic Developments (p. 25).13 Austria 1981 Fiscal consolidation totaled 1.56 percent of GDP, with tax hikes of 0.50 percent of GDP and spending cuts of 1.06 percent of GDP. Fiscal consolidation was motivated by the government’s medium-term deficit-reduction objective, as the 1981 IMF Recent Economic Developments explains (p. 25): “the Austrian authorities decided to continue consolidating the budget, and they projected the attainment of the medium-term target of a net deficit of 2½ per cent of GDP in the current fiscal year. It was agreed that consolidation measures at the present time were essential, if fiscal policy were to be ready to assume all expansionary stance at times of need.” The deficit reduction measures amounted to S 17.5 billion (1.56 percent of GDP), as the 1982 IMF Recent Economic Developments reports (p. 15), of which 0.50 percent of GDP was due to tax hikes (p. 16). The spending cuts fell on the pensions, while the tax hikes included a hike in the VAT rate on energy, a new tax on credit institutions and gasoline stations, and the suspension of part of the savings incentive system (p. 15).
Austria 1984 Fiscal consolidation totaled 2.04 percent of GDP, with tax hikes of 1.30 percent of GDP and spending cuts of 0.74 percent of GDP. Fiscal consolidation was motivated by deficit reduction, as the OECD Economic Surveys 1983-1984 explains (p. 23): “Policy shifted again towards restriction in 1984, following the Federal Government’s decision that, in view of the strong rise in deficits over the past years, important consolidation measures were required to ensure that growth of debt and debt-servicing obligations would not further narrow the scope for counter-cyclical fiscal policy in the future.” The primary aim of the 1984 Budget was thus
13 Notes on 1978-1979. Fiscal tightening occurred in 1978, but the main motivation was restraining demand in response to a large and growing trade deficit, as the 1978 IMF Staff Report explains (p. 7): “as the trade deficit grew in the course of 1977 and it became clear that the underlying causes were of a fundamental nature, a reorientation of policies took place.” As the 1979 IMF Staff Report explains (p. 1): “In the second half of 1977, the authorities adopted a number of restrictive fiscal and monetary measures to curb domestic demand, in particular for expensive imported consumer goods such as cars. On January 1, 1978, the VAT rate for a number of consumer goods with a high import content was raised.” The 1979 IMF Recent Economic Developments reports that the main fiscal policy objective in 1978 was reducing the external imbalance (p. 28): “the position of the current account of the balance of payments, which had been the main reason for the restrictive fiscal action undertaken in 1978, had improved considerably during the years 1978 and 1979.” The budgetary impact of these restrictive fiscal measures in 1978 was estimated at S 8.2 billion (0.91 percent of GDP), as reported in the 1978 IMF Recent Economic Developments (p. 37), after the exclusion of “financial transactions” and “revenue from abroad.” In 1979, fiscal consolidation was primarily motivated by deficit reduction, as the 1981 IMF Recent Economic Developments explains (p. 22): “The authorities were particularly worried about the rate of increase of the debt service. Consolidation efforts at the present would increase the room for maneuver later on” (p. 22). The budgetary impact of the consolidation measures was S 6 billion, of which S 3 billion consisted of tax hikes and spending cuts, and the remainder reflected statistical operations (p. 32). However, the S 3 billion in tax hikes and spending cuts were more than offset by a tax reform that became effective on January 1st with a budgetary cost of S 4.5 billion in 1979 (OECD Economic Surveys 1978, p. 46).

14
to reduce the budget deficit, and the Budget introduced tax hikes of S 17.5 billion (1.30 percent of GDP) and spending cuts of S 10 billion (0.74 percent of GDP), as reported by the OECD Economic Surveys 1984/1985 (p. 56). The tax measures included VAT rate hikes, a new tax on interest from schilling deposits, and an increase in the road transportation contribution, the motor vehicle tax, insurance tax and unemployment and pension insurance contributions (pp. 56-57). Spending cuts fell mainly on the housing grant and on social benefits (p. 57).
Austria 1996 Fiscal consolidation totaled 2.41 percent of GDP, with spending cuts of 1.53 percent of GDP and tax hikes of 0.88 percent of GDP. Fiscal consolidation was motivated by deficit reduction and achieving the Maastricht deficit criteria for participation in EMU, as the 1997 IMF Staff Report explains (p. 4): “With first-round participation in EMU the top economic priority since EU membership in 1995, the federal government agreed with the social partners and the lower levels of government on a phased two-year consolidation package to reduce the structural deficit.” As part of the deficit-reduction package, spending cuts in 1996 amounted to S 38.3 billion (1.53 percent of GDP), as reported in the 1997 IMF Staff Report (p. 13), with an additional cut of S 28.4 billion in 1997 (see entry for 1997 below). In addition, the deficit-reduction package introduced tax hikes of S 22 billion in 1996 (0.88 percent of GDP), with an additional cut of S 11.3 billion in 1997 (p. 13). Total consolidation thus amounted to 2.41 percent of GDP (1.53+0.88). The key spending measures were cuts to wages and the number of public employees (including postal workers), and cuts to a number of social transfers and subsidies, as reported in the 1996 IMF Recent Economic Developments (p. 13) The tax measures applied to both direct and indirect taxes (p. 13). Austria 1997 Fiscal consolidation totaled 1.56 percent of GDP, with spending cuts of 1.12 percent of GDP and tax hikes of 0.44 percent of GDP. Fiscal consolidation was motivated by deficit reduction and achieving the Maastricht fiscal criteria for EMU accession, and was based on the deficit-reduction package put in place in 1996 (see entry for 1996 above). Spending cuts amounted to S 28.4 billion (1.12 percent of GDP) and tax hikes amounted to S 11.3 billion (0.44 percent of GDP), both on the direct and on the indirect side (see entry for 1996 above). Total fiscal consolidation thus amounted to 1.56 percent of GDP (1.12+0.44).
Austria 200114 Fiscal consolidation totaled 1.02 percent of GDP, with tax hikes of 0.90 percent of GDP and spending cuts of 0.12 percent of GDP. Fiscal consolidation was motivated by deficit reduction, as the 2001 IMF Staff Report explains (p. 9): “Faced with strong criticism from the EU and international institutions over the unambitious March 2000 update of their Stability Program, the authorities prepared a revised Stability Program that places greater emphasis on 14 Note on 2000. Although tax hikes and spending cuts motivated by deficit reduction were implemented in 2000 based on the March Stability Program (2000 IMF Staff Report, p. 13) and the June tax package (OECD Economic Surveys 2000/2001, p. 46), they were more than offset by the cost of tax reform (1999 IMF Staff Report, p. 28) which was motivated by long-run considerations.
15
fiscal consolidation and targets reaching general government balance by 2002 and maintaining it thereafter.” The cumulative budgetary impact of the fiscal consolidation measures was as follows: Sch. 30.4 billion in 2001 and Sch. 47 billion in 2002, as reported in the 2001 IMF Staff Report (p. 10).15 The change in saving due to the measures was thus as follows: Sch. 30.4 billion in 2001 (1.02 percent of GDP) and Sch. 16.6 billion in 2002 (47–30.4), or 0.55 percent of GDP. The change in saving due to spending cuts is as follows: 0.12 percent of GDP in 2001 and 0.55 percent of GDP in 2002 (p. 10). The change in saving due to tax measures (which are on both the direct and the indirect side) is as follows: 0.90 percent of GDP in 2001 (p. 10). Thus, fiscal consolidation in 2001 amounted to 1.02 percent of GDP (0.12+0.90).
Austria 2002 Fiscal consolidation totaled 0.55 percent of GDP based on spending cuts. Fiscal consolidation continued to be motivated by the deficit-reduction program started in 2001, as the 2002 IMF Staff Report explains (p. 10): “The authorities intended to stick to the previously mapped out fiscal adjustment path, which they considered key for the credibility of their policies.” Measures amounted to 0.55 percent of GDP based on spending cuts (see entry for 2001 above).16
C. Belgium17
Belgium 1982 Fiscal consolidation totaled 1.66 percent of GDP, based entirely on spending cuts. Following the substantial increase in the fiscal deficit during 1974-1981 to an estimated 13 percent of GNP in 1981, a multi-year program was announced by a new government following the November 1981 election aimed at reducing the fiscal deficit to 7 percent of GNP by 1985 (1981/1982 OECD Economic Surveys, p. 21). As the 1983 IMF Recent Economic Developments (p. 29) reports, “The 1982 budget was drafted with this medium-term objective in mind.” Fiscal consolidation measures implemented in 1982 consisted of spending cuts totaling BF 69 billion (1.66 percent of GDP), of which more than half fell on social benefits, and the rest on subsidies to public enterprises, education, and public employment and salaries (1982 IMF Recent Economic Developments, p. 22).
Belgium 1983 Fiscal consolidation totaled 1.79 percent of GDP, with spending cuts of 1.10 percent of GDP and tax hikes of 0.69 percent of GDP. Fiscal consolidation continued in 1983
15 These savings do not include those due to lower interest payments, since we do not consider these as spending cuts for the purposes of the analysis.
16 The 2002/2003OECD Economic Surveys (p. 45), reports the introduction of two tax packages aimed at stimulating growth in 2002. However, since these packages were motivated by cyclical considerations, we do not subtract their cost from the budgetary impact of fiscal consolidation measures. 17 The sources consulted for Belgium are various issues of the IMF Recent Economic Developments, IMF Staff Report, National Bank of Belgium Annual Report, and the OECD Economic Surveys.
16
motivated by the multi-year deficit-reduction plan initiated in 1982. On January 1, 1983, the standard VAT rate rose from 17 to 19 percent with estimated savings of BF 15 billion, or about 0.40 percent of GDP (1983 OECD Economic Surveys, p. 58). In addition, the government introduced supplementary measures in March amounting to BF 50 billion, or 1.30 percent of GDP (p. 22), of which BF 41 billion (1.10 percent of GDP) corresponded to expenditure cuts and the remainder corresponding to revenue measures––a hike in social security contributions yielding BF 6 billion (0.16 percent of GDP), and an increase in taxes on petrol products, yielding BF 5 billion, or 0.13 percent of GDP (p. 58). Fiscal consolidation in 1983 thus totaled 1.79 percent of GDP, with spending cuts of 1.1 percent of GDP, and tax measures of 0.69 percent of GDP (0.4+0.16+0.13).
Belgium 1984 Fiscal consolidation totaled 0.69 percent of GDP, with spending cuts of 0.41 percent of GDP and tax hikes of 0.28 percent of GDP. Fiscal consolidation in 1984 was motivated by a new deficit-reduction program for 1984-1987 initiated in March 1984, as the 1984 IMF Recent Economic Developments (p. 34) explains: “the awareness that the borrowing requirement was approaching a self-perpetuating level through the ‘snowball effect’ on interest payments, induced the authorities in March 1984 to adopt a three-year fiscal adjustment program.” The March 1984 fiscal consolidation measures had an impact in 1984 on taxes and non-interest spending estimated at BF 13.4 billion (0.28 percent of GDP) and BF 19.7 billion (0.41 percent of GDP), respectively (p. 47), implying a total fiscal consolidation of 0.69 percent of GDP (0.28+0.41). In 1985, the March 1984 program generated additional savings (over those achieved in 1984) of BF 36.8 billion (0.73 percent of GDP) in higher taxes and BF 44.6 billion (0.88 percent of GDP) in lower spending (p. 47).
Belgium 1985 Fiscal consolidation totaled 1.61 percent of GDP, with spending cuts of 0.88 percent of GDP and tax measures of 0.73 percent of GDP. Fiscal consolidation continued in 1985, motivated by the March 1984 deficit-reduction plan that generated additional fiscal savings in 1985 of 1.61 percent of GDP, as described above (entry for 1984 above). Belgium 1987 Fiscal consolidation totaled 2.80 percent of GDP, with spending cuts of 2.80 percent of GDP. In the first half of 1986, the authorities announced the “Sint-Ana” or “Val Duchesse” deficit reduction plan that would lower the fiscal deficit to 8 percent of GNP in 1987 based entirely on spending cuts (1987 IMF Staff Report, p. 1). The budgetary impact of the consolidation measures was estimated at BF 130 billion (1987/88 OECD Economic Surveys, p. 62), or 2.4 percent of GDP. The program consisted of “expenditure cuts, affecting social transfers, subsidies, and the Government’s own expenditure including public investment” (1987 IMF Staff Report, p. 2), and were of a permanent nature. In addition, the Government reviewed the execution of the program in February 1987, and implemented additional expenditure cuts in 1987 worth BF 21 billion (0.40 percent of GDP) to reach the targeted deficit (p.5). Therefore, total expenditure cuts in 1987 amounted to 2.80 percent of GDP (2.40+0.40).

17
Belgium 1990 Fiscal consolidation totaled 0.60 percent of GDP, with spending cuts of 0.20 percent of GDP and tax hikes of 0.40 percent of GDP. Fiscal consolidation was motivated by the government’s medium-term strategy, which, as the 1989 IMF Staff Report (p. 4) explains, had as its main objective “the breaking of the snowball effect––the rise in the debt ratio engendered by the interaction of the deficit, indebtedness, and interest payments… which drastically reduced budgetary flexibility and made the budget unacceptably vulnerable to external interest rate shocks.” The main revenue measures, described in the 1990/1991 OECD Economic Surveys (p. 50), were corporate tax base-broadening, yielding savings of BF 10 billion (0.15 percent of GDP); non-application of the indexation of personal income tax parameters, yielding BF 6 billion (0.10 percent of GDP); an increase in excise taxes, yielding BF 3 billion (0.05 percent of GDP); a speeding up of withholding taxes on earned income, yielding BF 5 billion (0.07 percent of GDP); and a hike in the road tax on motor vehicles (BF 1 billion, less than 0.02 percent of GDP). These revenue measures together generated BF 25 billion (about 0.40 percent of GDP). On the spending side, measures totaled BF 11 billion, or 0.20 percent of GDP (p. 50). Total savings were thus about 0.60 percent of GDP (0.40+0.20).
Belgium in 1992 Fiscal consolidation totaled 1.79 percent of GDP, with spending cuts of 0.80 percent of GDP and tax hikes of 0.99 percent of GDP. The March 1992 Budget introduced a package of fiscal consolidation measures motivated by deficit reduction. The objective of deficit reduction was formalized in June in the government’s “Convergence Plan” for reaching a budget deficit-to-GDP ratio of 3 percent in 1996 (OECD Economic Surveys 1994, p. 48). Evidence that fiscal tightening occurred because of concerns regarding the budget deficit and not because policymakers believed the economy was overheating is clear from the National Bank of Belgium Annual Report 1992 (p. 17): “The reduction of the public deficit is an urgent matter. This necessity would make it derisory, in Belgium, to adopt any policy of restimulating demand by resorting to the budgetary instrument, or to delay the rehabilitation effort in any way. This is the spirit in which the multi-annual so-called ‘convergence’ plan prepared by the Government during the summer of 1992 and since approved by the EC Council of Ministers must be examined.” The 1992 IMF Recent Economic Developments Report (p. 6) estimates the budgetary impact of the tax hikes and spending cuts at BF 74 billion (0.99 percent of GDP) and BF 59.5 billion (0.80 percent of GDP), respectively, implying a total fiscal consolidation of 1.79 percent of GDP (0.99+0.80). At the same time, about half of the tax hikes and half of the spending cuts were temporary (p. 6), implying a budgetary impact in the following year, 1993, of –0.89 percent of GDP (–0.50 due to taxes and –0.40 due to spending, see entry for 1993 below). The tax measures consisted primarily of an increase in indirect taxes, as the 1994 OECD Economic Surveys (p. 48) notes: VAT and excise duties increased, new taxes were introduced on new cars, pleasure boats and aircraft, and there was an increase in the rate of general contributions to the health care scheme. Spending cuts concentrated on public investment, national defense, and compensation of civil servants (pp. 49–50).
Belgium 1993 Fiscal consolidation totaled 0.92 percent of GDP, with spending cuts of 0.49 percent of GDP and tax hikes of 0.43 percent of GDP. As in 1992, fiscal consolidation was intended
18
to keep the deficit in line with the multi-year Convergence Plan motivated by the prospect of EMU accession (see entry for 1992 above). The measures implemented in 1993 were as follows: First, the 1993 Budget of the summer of 1992 included spending cuts of BF 60 billion, as
reported in the and tax hikes (both direct and indirect) worth BF 40.5 billion, as reported by the 1992 IMF Recent Economic Developments (p. 8).18
Second, in October 1992, supplementary revenue measures for 1993 were introduced worth BF 22 billion (p. 8) of which BF 10 billion corresponded to asset sales and BF 12 billion to tax measures. For the purposes of our analysis, only the tax measures are recorded in the dataset.
Third, at the time of the budget control exercise in April 1993, the authorities introduced a sizeable additional deficit-reduction package with a full-year budgetary impact estimated by the 1993 IMF Recent Economic Developments (p. 10) at BF 105 billion. One quarter of the savings––BF 26.3 billion––were due to spending cuts (p. 10). The remaining three-quarters of savings (BF 78.8 billion) included tax hikes of BF 63.8 billion and asset sales of BF 15 billion (1994 IMF Recent Economic Developments, p. 50). Since many of the measures did not become effective until July 1, however, the budgetary impact in 1993 amounted to about 30 percent of the full-year effect (OECD Economic Surveys 1994, p. 51). Thus, the calendar-year impact of the April 1993 measures is recorded as follows: spending cuts of BF 7.9 (26.3×30 percent) in 1993 and BF 18.4 billion in 1994; and tax hikes of BF 19.1 billion (63.8×30 percent) in 1993 and BF 44.6 billion in 1994 (see entry for 1994 below).
Overall, therefore, spending cuts in 1993 amounted to BF 67.9 billion (60+7.9), or 0.89 percent of GDP, and tax hikes amounted to BF 71.6 billion (40.5+12+19.1), or 0.93 percent of GDP. However, due to the expiration in 1993 of 0.40 percent of GDP of temporary spending cuts introduced in 1992 (see entry for 1992 above), the budgetary impact of spending measures in 1993 was only 0.49 percent of GDP (0.89–0.40). Similarly, the expiration in 1993 of 0.50 percent of GDP of temporary tax hikes introduced in 1992 implied a budgetary impact of tax measures in 1993 of only 0.43 percent of GDP (0.93–0.50). Total fiscal consolidation in 1993 thus amounted to 0.92 percent of GDP (0.49+0.43).
Belgium 1994 Fiscal consolidation totaled 1.15 percent of GDP, with spending cuts of 0.60 percent of GDP and tax hikes of 0.55 percent of GDP. The motivation for fiscal consolidation in 1994 was deficit reduction, as the 1994 OECD Economic Surveys (p. 46) reports: “The primary objective of budgetary policy is medium-term fiscal consolidation in order to achieve the Maastricht targets. This approach was formalized in the multi-annual ‘Convergence Plan’ that the Government presented in June 1992. It set annual targets for the progressive reduction of the general government deficit to 3 percent of GDP in 1996.” Measures
18 The authorities also conducted asset sales. Since the analysis focuses on tax spending measures, we do not record such asset sales as fiscal consolidation.

19
introduced in 1993 but with their full budgetary impact in 1994 (see entry for 1993 above) yielded BF 44.6 billion in tax hikes (0.55 percent of GDP) and BF 18.4 billion in spending cuts (0.23 percent of GDP). Also, as the 1994 OECD Economic Surveys reports, new measures generated additional savings of BF 50 billion in 1994 (p. 51). Of these measures, BF 30 billion (0.37 percent of GDP) corresponded to current spending cuts, including a reorganization of the public sector based on an in-depth study (p. 51). The remainder (BF 20 billion) corresponded to asset sales and other operations not directly related to tax hikes or spending cuts (p. 51), and are therefore excluded from our dataset. Therefore, spending cuts in 1994 totaled 0.60 percent of GDP (0.23+0.37); tax hikes amounted to 0.55 percent of GDP, and overall fiscal consolidation totaled 1.15 percent of GDP (0.60+0.55).
Belgium 1996 Fiscal consolidation totaled 1.00 percent of GDP, with spending cuts of 0.50 percent of GDP and tax hikes of 0.50 percent of GDP. Fiscal consolidation in 1996 was motivated, as in previous years, by meeting the Maastricht criteria. Also, as the 1996 IMF Staff Report explains (p. 24): “the authorities confirmed that they are maintaining their objective of achieving a primary surplus in excess of 6 percent of GDP over the next few years, given the need to secure a continuing decline in the public debt ratio and to prepare for longer-term demographic pressures on public expenditure.” Fiscal consolidation in 1996 was based on deficit-reduction measures in the 1996 Budget with 0.50 percent of GDP in spending cuts (1996 IMF Recent Economic Developments, p. 11) and 0.90 percent of GDP in revenue measures (of which 0.10 percent of GDP of sales of buildings, which we exclude from our dataset). The tax measures included increases in both indirect and direct taxes, while the spending cuts fell on a range of categories including social benefits, subsidies, and defense (p. 11). In addition, one-off measures amounted to 0.50 percent of GDP (p. 11), which we allocate equally across spending and tax measures. Therefore, the budgetary impact of fiscal consolidation was 1.30 percent of GDP in 1996, with 0.50 percent of GDP of spending cuts and 0.80 percent of GDP of tax hikes; and –0.50 percent of GDP in 1997, with –0.25 percent of GDP each due to tax measures and spending measures (see entry for 1997 below). Belgium 1997 Fiscal consolidation amounted to 0.91 percent of GDP, with spending cuts of 0.50 percent of GDP and tax hikes of 0.41 percent of GDP. Fiscal consolidation in 1997 was, as in previous years, motivated by debt reduction and meeting the Maastricht criteria, as the 1997 OECD Economic Surveys (p. 44) explains: “The stated aim of the Government is to reduce the general government deficit to less than 3 percent of GDP in 1997 and set the debt-to-GDP ratio on a firmly declining trend.” The 1997 Budget included corrective measures worth BF 80 billion (1 percent of GDP) that were “split evenly between spending cuts and revenue increases” (1997 OECD Economic Surveys, p. 44). The spending measures were mainly on the current side, with 17 billion (0.21 percent of GDP) consisting of cuts in subsidies to public enterprises and military expenditure; and BF 23 billion (0.29 percent of GDP) corresponding to cuts in health care, and other social allowances. On the revenue side, there were BF 33 billion in tax measures (0.41 percent of GDP), and BF 7 billion in asset sales (p. 45). The tax measures consisted, amongst others, of stepped up anti-fiscal-fraud activity, and a new tax to be paid by banks on the amount of their deposits (p. 45). As noted by the 1999 OECD Economic Surveys, the measures implemented in 1997 were of a permanent nature, with a lasting positive impact on the budget (p. 98).

20
D. Canada19
Canada 1984 Fiscal consolidation totaled 0.27 percent of GDP based on tax hikes. The “Budget Strategy” outlined by Minister of Finance Lalonde in the February 1984 Budget Speech (p. 5) highlights “Reducing the Deficit” as a key priority: “I remain committed to bringing the federal deficit down in a way that does not damage our economic prospects. The fiscal strategy I set out last April has proved itself to be the right course of action. In the coming fiscal year, taking into account the impact of the measures proposed in this budget, the deficit will fall by almost $2 billion… In the medium term, the deficit will continue to fall, consistent with the strategy set out last April, from over 8 percent of gross national product this year to about 4.7 percent by 1987-88.” The April 1983 Budget introduced tax hikes motivated by deficit reduction with a budgetary impact of C$ 1.2 billion (0.27 percent of GDP) in 1984, which included hikes in personal income and consumption taxes.20 The budgetary impact of these tax hikes grew over the next two years, as Table 1 reports. 21
19 The fiscal year is April-March. Therefore, a tax hike worth C$1 billion in 1997/98 is allocated as follows: C$¾ billion in 1997 and C$ ¼ billion in 1998. The sources consulted for Canada are various issues of the Budget, Budget Papers, Budget Speech, Fiscal Plan, IMF Staff Report, and IMF Recent Economic Developments.
20 The 1983 Budget also introduced some countercyclical initiatives aimed at supporting the economic recovery in its early stages, as the 1983 IMF Staff Report explains (p. 8): “The budget contained new measures designed to foster the growth of employment in 1983 and 1984, including additional spending on public capital projects and tax incentives for fixed investment by the private sector.” However, for the reasons explained above, we do not subtract the cost of measures motivated by responding to cyclical fluctuations from the budgetary impact of deficit-driven fiscal consolidation measures.
21 Notes on 1978-1983. Fiscal consolidation occurred in 1978-1983, but was primarily motivated by restraining aggregate demand and reducing inflation. Therefore, we do not record these policy measures as fiscal consolidation motivated primarily by deficit-reduction and fiscal sustainability considerations. In 1978, the government cut spending, but the motivation was primarily to reduce inflation, as the Statement by the Honourable Jean Chretien Minister of Finance on August 24, 1978, made clear (p. 1): “The government believes that the example of discipline over its own spending will contribute to the continuing exercise of needed discipline in the community at large as price and wage controls are phased out. This will be a very great help in controlling inflation.” Similarly, the 1978 Budget Speech (p. 17) stated “this budget will make a significant contribution to the containment of our domestic costs in the post-control era.” Accordingly, the 1978 Budget introduced spending cuts with a budgetary impact of C$ 550 million (0.23 percent of GDP) in 1978 and an additional C$ 2.0 billion (0.73 percent of GDP) in 1979. An anti-inflation policy based on demand restrained also underlay the 1980 Budget, as the 1981 IMF Recent Economic Developments explains (p. 32): “On October 28, 1980 the Government presented to Parliament a budget which reaffirmed that demand policies must be geared toward a gradual reduction of inflation.” Similarly, as the 1982 IMF Recent Economic Developments explains (p. 34): “The budget presented in November 1981 reaffirmed the Government’s commitment to policies aimed at bringing down inflation. The budget speech stated that the control of the money supply by the Bank of Canada was an essential element in the strategy to fight inflation, but it had to be supported by greater fiscal restraint.” Accordingly, the 1981 Budget introduced tax hikes with a budgetary impact of C$ 140 million in FY 1981-82 growing to C$ 1.4 billion in FY 1982-83. Based on our convention for allocating budgetary effects to calendar years, and considering the impact of the measures introduced in the 1980 Budget, the budgetary impact of these measures in 1981 was C$ 3.7 billion (1.01 percent of GDP). The 1982 Budget also aimed at reducing inflation, as the 1983 IMF Recent Economic Developments reports (p. 32): “In the budget
(continued…)
21
Canada 1985 Fiscal consolidation totaled 1.03 percent of GDP, with tax hikes of 0.53 percent of GDP and spending cuts of 0.50 percent of GDP. The Fiscal Plan published together with the May 1985 Budget makes it clear that reducing a large budget deficit was the principal motivation for fiscal consolidation. It warns of the dangerous “vicious circle of deficits, growing debt and ever-increasing debt carrying charges” (p. 1) and that “To ignore the reality of the current fiscal situation would be to severely endanger the economic future of this country” (p. 2). It therefore announces that “This budget represents a major step towards controlling the growth of the federal public debt” (p. 2). The 1985 Budget introduced measures aimed at deficit reduction worth C$ 2.3 billion in FY 1985-86, with tax hikes of C$ 1.4 billion and spending cuts of C$ 0.8 billion (Table 1). In addition, measures motivated by deficit reduction introduced in the November 1984 Expenditure and Program Review and the 1983 Budget raised the budgetary impact of fiscal consolidation in FY 1985-86 to C$ 6.6 billion, split roughly evenly across tax hikes and spending cuts (Table 1). Based on our convention for allocating budgetary effects to calendar years, the budgetary impact of deficit-reduction measures in 1985 was C$ 5.2 billion, with tax hikes of C$ 2.8 billion and spending cuts of C$ 2.4 billion (Table 1). Part of these savings were offset by the budgetary cost of other initiatives with a long-term motivation introduced in the 1985 Budget (Table 1), so that the total savings achieved in 1985 amounted to C$ 5.0 billion (1.03 percent of GDP), with C$ 2.6 billion (0.53 percent of GDP) on the tax side and C$ 2.4 billion (0.50 percent of GDP) on the spending side.
Canada 1986 Fiscal consolidation totaled 0.99 percent of GDP, with tax hikes of 0.84 percent of GDP and spending cuts of 0.15 percent of GDP. The 1986 Budget makes it clear that the motivation for fiscal consolidation in 1986 was reducing a large inherited budget deficit (pp. iii-iv): “When this government came to power, the state of the nation’s finances had been allowed to deteriorate to an alarming degree. An unbroken string of deficits beginning in 1970-71 had resulted in a massive accumulation of debt… As a result of previous initiatives, and those I am announcing today, I expect that the deficit will decline a further $4.8 billion next fiscal year and another $3.5 billion in 1987-88.” The 1986 Budget introduced deficit-reduction measures amounting to C$ 2.6 billion in FY 1986-87, with tax hikes of C$ 1.9
introduced in June 1982 it was emphasized that a substantial reduction of inflation was necessary to achieve a lasting decline in interest rates, the restoration of substantial growth of output and productivity, and the solution of the country’s unemployment problem. Accordingly, the budget continued to stress the need for policies aimed at restraining the growth of demand.” A key anti-inflation measure was a government wage restraint policy known as the “6&5” program: “With a view to assisting the anti-inflationary effort, the June budget set a ceiling on wage increases in the federal sector of 6 percent in the year beginning July 1, 1982 and 5 percent in the following year” (1983 IMF Recent Economic Developments, p. 32). The program was implemented, and The Budget Speech of 1984 (p. 2) emphasized its results: “Canadians can be proud of our collective achievement in bringing inflation down from almost 12 percent in June 1982 to 4.5 percent at the end of last year. The government’s 6&5 Program has contributed substantially to this achievement. Restraint in federal wages and prices has helped to lead inflation down.” Based on our convention for allocating budgetary effects to calendar years, the budgetary impact of the cyclically-motivated contractionary measures introduced in the 1981 Budget and 1982 Budget was C$ 2.8 billion (0.74 percent of GDP) in 1982 and C$ 1.7 billion (0.41 percent of GDP) in 1983.
22
billion and spending cuts of C$ 0.7 billion (Table 1). Fiscal consolidation measures introduced in earlier budgets raised the total savings achieved in FY 1986-87 to C$ 5.2 billion.22 Based on our convention for allocating budgetary effects to calendar years, the budgetary impact of deficit-reduction measures in 1986 was C$ 5.5 billion, with tax hikes of C$ 4.8 billion and spending cuts of C$ 0.8 billion (Table 1). Part of these savings were offset by the budgetary cost (C$ 0.5 billion) of other measures with a long-term motivation introduced in the 1985 Budget (Table 1), so that the total savings achieved in 1986 amounted to C$ 5.0 billion (0.99 percent of GDP), with C$ 4.3 billion (0.84 percent of GDP) on the tax side and C$ 0.7 billion (0.14 percent of GDP) on the spending side.
Canada 1987 Fiscal consolidation totaled 0.28 percent of GDP, with tax hikes of 0.14 percent of GDP and spending cuts of 0.14 percent of GDP. Fiscal consolidation was again primarily motivated by deficit reduction, as discussed in the Budget Papers accompanying the 1987 Budget (p. 1): “There are a number of key elements in the overall strategy for economic renewal but the most important is fiscal restraint and control of the national debt: deficits and growth of the debt must be reduced if we are to have an economic and financial environment that promotes private sector expansion and job creation… Substantial improvement in the fiscal situation has already been achieved, but further progress must be made.” Accordingly, spending cuts and tax hikes motivated by deficit reduction amounted to C$ 2.9 billion in FY 1987-88 (Table 1), about half of which were introduced in the 1986 Budget and the rest reflected measures introduced in earlier budgets. Based on our convention for allocating budgetary effects to calendar years, the budgetary impact of deficit-reduction measures in 1987 was C$ 3.5 billion, with tax hikes of C$ 2.8 billion and spending cuts of C$ 0.8 billion (Table 1). However, about two-thirds of these savings were offset by the budgetary cost of the first stage of the June 1987 tax reform, which was motivated by long-term efficiency considerations, as the 1987 IMF Staff Report explains (p. 12):
In June 1987, the Canadian Government presented its proposals for a comprehensive tax reform aimed at greater economic efficiency, improved fairness, and increased reliability in revenue collection. The reform is intended to be revenue neutral and is to be implemented in two stages. The first stage–to be completed by FY 1989/90–will involve substantial reductions in statutory tax rates for both personal and corporate income taxation together with the reduction (or elimination) of certain tax expenditures to broaden the personal and corporate tax bases. In the second stage, a new multi-stage sales tax (akin to a value-added tax) is to be introduced to replace the existing manufacturers sales tax.
The budgetary impact of the first stage of this reform in 1987 was C$ 2.0 billion (Table 1). Net of this budgetary cost, fiscal consolidation in 1988 totaled C$ 1.5 billion (0.28 percent of GDP), with tax hikes of C$ 0.8 billion (0.14 percent of GDP) and spending reductions of C$ 0.8 billion (0.14 percent of GDP).
22 The end of some one-time spending reductions introduced in the FY 1984 Budget offset the budgetary savings of the spending cuts introduced in the 1986 Budget.
23
Canada 1988 Fiscal consolidation totaled 0.30 percent of GDP, with tax hikes of 0.33 percent of GDP and a spending increase of 0.03 percent of GDP. Fiscal consolidation in 1988 was motivated by the desire to reduce the budget deficit, as The Fiscal Plan accompanying the 1988 Budget explains (p. 5): “With the fiscal plan presented in this budget, the government sets out a solid five-year fiscal track of significant deficit reduction and debt control, a fiscal outlook that stands in sharp contrast to the performance in the previous four years.” The 1988 Budget introduced tax hikes with a budgetary impact of C$ 275 million in FY 1988-89, as Table 1 reports. Measures introduced in the previous budgets raised the budgetary impact of fiscal consolidation in FY 1988-89 to C$ 685 million, with savings of C$ 35 million on the spending side and C$ 650 on the tax side. Based on our convention for allocating budgetary effects to calendar years, the budgetary impact of deficit-reduction measures in 1988 was C$ 1.3 billion, with tax hikes of C$ 1.0 billion and spending cuts of C$ 0.3 billion (Table 1). In addition, measures motivated by long-run considerations introduced in previous budgets generated additional budgetary savings of C$ 0.6 billion in 1988, and reflected the tax base broadening of the June 1987 tax reform (see entry for 1987 above). Overall, net fiscal consolidation in 1988 totaled C$ 1.8 billion (0.30 percent of GDP), with tax hikes of C$ 2.0 billion (0.33 percent of GDP) and a spending increase of C$ 160 million (0.03 percent of GDP).23
Canada 1989 Fiscal consolidation totaled 0.31 percent of GDP, with tax hikes of 0.24 percent of GDP and spending cuts of 0.08 percent of GDP. Fiscal consolidation in 1989 was motivated by the need to reduce the budget deficit, as the Fiscal Plan of the 1989 Budget explains (p. 2): “The principal objective of the fiscal strategy presented in this budget is to reduce the growth of debt through deficit reduction. Three key elements are combined to achieve the debt-control objective: further expenditure restraint, additional revenue increases, and sustained economic growth.” On the tax side, the 1989 Budget introduced tax hikes motivated by deficit reduction of C$ 3.7 billion in FY 1989-90 (Table 1) based on higher rates on personal income tax, corporate income tax, and indirect taxes. The 1989 Budget also cut spending by C$ 1.4 billion in FY 1989-90 (Table 1). Based on our convention for allocating budgetary effects to calendar years, the budgetary impact of these deficit-reduction measures in 1989 was C$ 4.0 billion, with tax hikes of C$ 3.0 billion and spending cuts of C$ 1.1 billion (Table 1). In addition, measures introduced in previous budgets motivated by long-run considerations had a budgetary cost of C$ 1.9 billion in 1989, and mainly reflected the impact of the June 1987 tax reform (see entry for 1987 above). Net of this cost, fiscal consolidation in 1989 amounted to C$ 2.1 billion (4–1.9), or 0.31 percent of GDP, with tax hikes of C$ 1.6 billion (0.24 percent of GDP) and spending cuts of C$ 0.6 billion (0.08 percent of GDP).
23 The spending increase was mostly part of the 1987 tax reform package. Since the additional spending was associated with a long-term motivation rather than countercyclical stimulus, we subtract its cost from the budgetary impact of fiscal consolidation.

24
Canada 1990 Fiscal consolidation totaled 0.86 percent of GDP, with tax hikes of 0.57 percent of GDP and spending cuts of 0.29 percent of GDP. Fiscal consolidation in 1990 was again motivated by debt reduction, as the 1990 Budget (p. 91) explains: “Although substantial progress has been made, the task is not yet complete. The enormous build-up of debt over the last 15 years means that we are on a treadmill dominated by growth in public debt and debt servicing costs… Further fiscal action is required to hold to the fiscal framework set out in the April 1989 budget. Through the Expenditure Control Plan, the substantial expenditure actions taken in this budget reinforce the momentum of earlier measures and help to ensure that the goals of the April 1989 budget will be reached.” The December 1989 Update and the February 1990 Budget introduced spending cuts with a budgetary impact of 1.9 billion in FY 1990-91, as Table 1 reports. In addition, spending cuts introduced in the April 1989 Budget raised the total of spending cuts in FY 1990-91 to C$ 2.4 billion. On the tax side, the April 1989 Budget introduced tax hikes with a budgetary impact of C$ 3.3 billion in 1990 (Table 1). Based on our convention for allocating budgetary effects to calendar years, the budgetary impact of these deficit-reduction measures in 1990 was C$ 5.5 billion, with spending cuts of C$ 2.1 billion and tax hikes of C$ 3.4 billion (Table 1). Measures introduced in previous budgets motivated by long-run considerations yielded additional budgetary savings of C$ 0.3 billion in 1991, mainly reflecting the second stage of the June 1987 tax reform (see entry for 1987 above). Overall, fiscal consolidation in 1990 amounted to C$ 5.8 billion (0.86 percent of GDP), with spending cuts of C$ 2.0 billion (0.29 percent of GDP) and tax increases of C$ 3.9 billion (0.57 percent of GDP). Canada 1991 Fiscal consolidation totaled 0.40 percent of GDP with spending cuts of 0.27 percent of GDP and tax hikes of 0.13 percent of GDP. Fiscal consolidation in 1991 was clearly motivated by deficit and debt reduction and not because policymakers thought that the economy was overheating. Indeed, the government was aware that a recession had started and that “Many Canadian have lost their jobs; many others have lost confidence in the economic future” (1991 Budget Speech, p. 1). Despite the recession, the 1991 Budget Speech explained that “Ours is not a plan for increased spending. That approach has been tried in the past and failed” (p. 2). Instead, the Budget reinforced expenditure restraint to cut the deficit: “We will put the government finances firmly on the course to a balanced budget… The Expenditure Control Plan announced in the 1990 budget will be extended. The government will legislate mandatory program spending limits... We will severely restrain the operations of government. Operating budgets will be frozen at current levels and the wages and salaries of Cabinet Ministers, Members of Parliament, all Order-in-Council appointments, and all federal public servants will be tightly restrained.” The aim of the spending cuts was to “ensure that we achieve key fiscal goals in line with the plan set out in my 1989 and 1990 budgets: We will eliminate new federal borrowing in financial markets after 1993-94” (p. 3). Spending cuts motivated by deficit reduction implemented in FY 1991-92 had a budgetary impact of C$ 2.5 billion, of which C$ 1.0 billion was introduced in the February 1991 Budget, and the rest reflected the impact of measures introduced in earlier budgets, as reported in Table 1. Tax hikes motivated by deficit reduction introduced in the April 1989 Budget had a small additional impact of C$ 25 million in FY 1991-92. Based on our convention for allocating budgetary effects to calendar years, the net budgetary impact of

25
deficit-reduction measures in 1991 was C$ 3.3 billion, with spending cuts of C$ 2.5 billion and tax hikes of C$ 0.8 billion (Table 1). In addition, measures introduced in previous budgets motivated by long-run considerations had a budgetary cost of C$ 0.5 billion in 1991, and mainly reflected temporary spending associated with the 1991 sales tax reform. Net of this cost, fiscal consolidation in 1992 amounted to C$ 2.8 billion (0.40 percent of GDP), with spending cuts of C$ 1.9 billion (0.27 percent of GDP) and tax increases of C$ 0.9 billion (0.13 percent of GDP). Canada 1992 Fiscal consolidation totaled 0.21 percent of GDP with spending cuts of 0.22 percent of GDP, and a tax reduction of 0.01 percent of GDP. The fiscal consolidation initiated in 1991 continued in 1992 and the motivation was deficit reduction, as the February 1992 Budget Speech (p. 2) made clear: “We will substantially reduce the deficit. Despite the economic slowdown, we will hold the deficit to $31.4 billion in the 1991-92 fiscal year. We will reduce it by almost $4 billion to $27.5 billion 1992-93… We will cut spending by $1 billion in 1992-93 and by $7 billion over five years. These savings will be used to cut taxes.” The Budget Speech also emphasized the economic benefits of deficit cuts (p. 4): “Reducing the deficit is essential for sustained economic growth and prosperity. It is also an essential foundation for the confidence, at home and abroad, that will ensure a strong recovery.” Spending cuts introduced in the 1991 Budget motivated by deficit reduction had an incremental budgetary impact of C$ 1.0 billion in FY 1992-93 (see Table 1). Based on our convention for allocating budgetary effects to calendar years, the budgetary impact of these cuts and others introduced in previous budgets was C$ 1.3 billion in 1992. In addition, other measures with a long-run motivation generated an additional net budgetary yield of 177 million in 1992 (Table 1), with some spending cuts and a small tax reduction reflecting the impact the 1991 sales tax reform. Therefore, fiscal consolidation in 1992 amounted to C$ 1.5 billion (0.21 percent of GDP), with spending cuts of C$ 1.6 billion (0.22 percent of GDP) and tax reductions of 63 million (0.01 percent of GDP). Canada 1993 Fiscal consolidation totaled 0.35 percent of GDP with spending cuts of 0.36 percent of GDP and a tax reduction of 0.01 percent of GDP. Fiscal consolidation in 1993 was part of the government’s strategy motivated by deficit reduction (see entry for 1992 above). Spending cuts motivated by deficit reduction implemented in FY 1993-94 had a budgetary impact of C$ 3.1 billion, of which C$ 2.6 billion was due to measures introduced in the December 1992 Economic Statement and the April 1993 Budget (Table 1). The cuts fell mainly on government consumption and unemployment insurance benefits. Based on our convention for allocating budgetary effects to calendar years, the net budgetary impact of these measures and others introduced in previous budgets, such as the introduction of a unified child tax benefit in the February 1992 Budget, was C$ 2.6 billion in 1993. In percent of GDP, fiscal consolidation amounted to 0.35 percent of GDP, with spending cuts of 0.36 percent of GDP and a tax reduction of 0.01 percent of GDP.
Canada 1994 Fiscal consolidation totaled 0.49 percent of GDP, with spending cuts of 0.45 percent of GDP and tax hikes of 0.04 percent of GDP. Fiscal consolidation in 1994 was again motivated by deficit reduction with explicit numerical deficit targets over the medium term,
26
as the 1994 Budget emphasizes: “the decisions presented in this budget set the deficit on a path to meeting the government’s deficit-to-GDP target of 3 percent in 1996-97.” Spending cuts motivated by deficit reduction implemented in FY 1994-95 had a budgetary impact of C$ 3.3 billion, of which C$ 2.2 billion was introduced in the February 1994 Budget, and the rest reflected the impact of measures introduced in earlier budgets, as reported in Table 1. The cuts fell mainly on unemployment benefits and on government consumption. Tax hikes motivated by deficit reduction implemented in FY 1994-95 had a budgetary impact of C$ 0.6 billion and consisted of personal and corporate income tax hikes introduced in the February 1994 Budget. In addition, measures introduced in previous budgets and motivated by long-run considerations had a small additional budgetary impact of C$ 71 million in FY 1994-95 (Table 1). Based on our convention for allocating budgetary effects to calendar years, the net budgetary impact of deficit-reduction measures in 1994 was C$ 3.8 billion (0.49 percent of GDP), with spending cuts of C$ 3.5 billion (0.45 percent of GDP) and tax hikes of C$ 279 million (0.04 percent of GDP).
Canada 1995 Fiscal consolidation totaled 0.99 percent of GDP, with spending cuts of 0.81 percent of GDP and tax hikes of 0.18 percent of GDP. The 1995 Budget Speech (pp. 2-3) emphasizes that the consolidation measures introduced in the Budget were intended to “restore the nation’s finances to health,” and emphasized the risks of not acting to reduce the deficit: “The debt and deficit are not inventions of ideology. They are facts of arithmetic. The quicksand of compound interest is real. The last thing Canadians need is another lecture on the dangers of the deficit. The only thing Canadians want is clear action… Taking the next two fiscal years together, this budget delivers cumulative savings of $15.6 billion, with spending cuts accounting for $13.4 billion, more than 85 per cent of the total.” Spending cuts motivated by deficit reduction implemented in FY 1995-96 had a budgetary impact of C$ 7.6 billion, of which C$ 3.9 billion were introduced in the 1995 Budget (1995 Budget Fact Sheet, p. 4), and the rest reflected the impact of measures introduced in earlier budgets, as reported in Table 1. Tax hikes motivated by deficit reduction implemented in FY 1995-96 had a budgetary impact of C$1.8 billion, of which C$ 0.9 billion were introduced in the 1995 Budget (1995 Budget Fact Sheet, p. 4). Based on our convention for allocating budgetary effects to calendar years, the budgetary impact of fiscal consolidation measures in 1995 was C$ 8.0 billion (0.99 percent of GDP), as reported in Table 1, with spending cuts of C$ 6.6 billion (0.81 percent of GDP) and tax hikes of C$ 1.4 billion (0.18 percent of GDP).
Canada 1996 Fiscal consolidation totaled 0.97 percent of GDP, with spending cuts of 0.88 percent of GDP and tax hikes of 0.09 percent of GDP. The 1996 Budget Speech makes it clear that the main motivation driving fiscal consolidation was deficit reduction, and it renews the commitment to achieving numeric deficit targets by cutting spending (p. 4): “This budget is our third in a comprehensive and determined effort to restore fiscal health to this country… The attack on the deficit is irrevocable and irreversible. Let there be no doubt about that… We will hit the 3-percent deficit target. We will hit the 2-percent target announced last November. Indeed, we are announcing the actions today which will enable us to go beyond those targets, to keep us moving towards budget balance.” Spending cuts motivated by deficit reduction implemented in FY 1996-97 had a budgetary impact of C$ 7.4 billion, of which C$ 56 million was introduced in the 1996 Budget (1996 Budget Plan, “Summary of Fiscal

27
Savings”, p. 18) and the rest reflected the impact of measures introduced in earlier budgets, as reported in Table 1. Tax hikes motivated by deficit reduction implemented in FY 1996-1997 had a budgetary impact of C$ 470 million, all of which were introduced in previous budgets, as reported in Table 1. In addition, the 1996 Budget introduced additional spending of C$ 160 million in FY 1996-97 motivated by long-run considerations such as “to enhance education and employment opportunities of the young, to foster technology and innovation and to realize Canada’s trade potential” (1996 Budget Plan, pp. 17-18). Based on our convention for allocating budgetary effects to calendar years, the budgetary impact of fiscal consolidation in 1996, net of these other long-run measures, was C$ 8.1 billion (0.97 percent of GDP), with spending cuts of C$ 7.4 billion (0.88 percent of GDP) and tax hikes of C$ 0.8 billion (0.09 percent of GDP). Canada 1997 Fiscal consolidation totaled 0.47 percent of GDP with spending cuts of 0.47 percent of GDP and tax measures of 0.01 percent of GDP. Fiscal consolidation continued in 1997, again guided by the government’s deficit-reduction strategy, as the February 1997 Budget Speech emphasizes (p. 3): “This budget will show that our effort to restore health to the nation’s finances is very clearly on track, that we are well ahead of our target, and that we are staying the course of deficit reduction.” Spending cuts motivated by deficit reduction introduced in previous budgets had a budgetary impact in FY 1997-1998 of C$ 3.5 billion, while tax hikes introduced in previous budgets had a budgetary impact of C$ 165 million, as reported in Table 1. However, part of these savings were offset by the cost of other initiatives motivated by long-run considerations, which had a budgetary cost C$ 0.7 billion in FY 1997-98. Much of this cost related to tax cuts and spending increases introduced in the 1997 Budget, which aimed at promoting long-term growth through investment in education and innovation (1997 Budget Plan, Table 4.1), and at improving social equity (1997 Budget Plan, Tables 5.1 and A6.1). Based on our convention for allocating budgetary effects to calendar years, the budgetary impact of fiscal consolidation in 1997, net of these other long-run initiatives, was C$ 4.2 billion (0.47 percent of GDP), with spending cuts of C$ 4.1 billion (0.47 percent of GDP) and tax hikes of C$ 46 million (0.01 percent of GDP).24
24 Note on 1998-99. The budgetary impact of deficit-reduction measures were offset by the budgetary cost of other initiatives with a long-term motivation, such as tax reform, in 1998-99. In particular, the 1998 Budget announced that “Over the next three years, $7 billion in tax relief is being provided to Canadians” (1998 Budget in Brief, p. 6) and this was motivated by long-run considerations–restructuring the tax system–rather than by providing short-term fiscal stimulus, as the 1998 IMF Staff Report explains (16): “In considering how part of the fiscal dividend would be used for other purposes the authorities saw a particular need for restructuring the tax system.” Net of these other measures with a long-term motivation, there was no deficit-driven fiscal consolidation.

28
Table 1. Canada: Budgetary Impact of Fiscal Consolidation Measures (Millions of Canadian dollars)
Source: Canada Department of Finance, Budget, various years, and authors’ calculations.
Fiscal Year 1984-85 1985-86 1986-87 1987-88 1988-89 1989-90 1990-91 1991-92 1992-93 1993-94 1994-95 1995-96 1996-97 1997-98
Budget 1983SpendTax 1,215 2,915 3,710 3,710 3,710 3,710 3,710 3,710 3,710 3,710 3,710 3,710 3,710 3,710
November 1984 Expenditure and Program ReviewSpend -2,414 -540 -493 -493 -493 -493 -493 -493 -493 -493 -493 -493 -493Tax 193 193 193 193 193 193 193 193 193 193 193 193 193
May 1985 BudgetSpend -838 -1,971 -2,728 -2,728 -2,728 -2,728 -2,728 -2,728 -2,728 -2,728 -2,728 -2,728 -2,728Tax 1,428 3,973 4,857 4,857 4,857 4,857 4,857 4,857 4,857 4,857 4,857 4,857 4,857
February 1986 BudgetSpend -683 -1,000 -1,035 -1,035 -1,035 -1,035 -1,035 -1,035 -1,035 -1,035 -1,035 -1,035Tax 1,905 2,940 3,315 3,315 3,315 3,315 3,315 3,315 3,315 3,315 3,315 3,315
February 1988 BudgetSpendTax 275 300 305 305 305 305 305 305 305 305
April 1989 BudgetSpend -1,370 -1,884 -2,169 -2,169 -2,169 -2,169 -2,169 -2,169 -2,169Tax 3,695 6,950 6,975 6,975 6,975 6,975 6,975 6,975 6,975
December 1989 Update/February 1990 BudgetSpend -1,877 -3,059 -2,947 -2,947 -2,947 -2,947 -2,947 -2,947Tax
February 1991 BudgetSpend -1,017 -2,061 -2,597 -2,597 -2,597 -2,597 -2,597Tax
December 1992 Economic Statement/April 1993 BudgetSpend -2,554 -3,696 -4,122 -4,122 -4,122Tax
February 1994 BudgetSpend -2,191 -5,474 -7,343 -7,343Tax 575 1,395 1,530 1,530
February 1995 BudgetSpend -3,867 -9,383 -12,596Tax 940 1,275 1,440
March 1996 BudgetSpend -56 -368Tax
Fiscal YearCumulative Saving: Deficit-driven Measures
Spend 0 3,252 3,194 4,221 4,256 5,626 8,017 10,501 11,432 14,522 17,855 25,431 32,872 36,397Tax 1,215 4,536 9,781 11,700 12,350 16,070 19,330 19,355 19,355 19,355 19,930 21,690 22,160 22,325
Change in Saving: Deficit-driven MeasuresTotal 1,215 6,573 5,187 2,946 685 5,090 5,651 2,509 932 3,090 3,908 9,336 7,911 3,690Spend 0 3,252 -58 1,027 35 1,370 2,391 2,484 932 3,090 3,333 7,576 7,441 3,525Tax 1,215 3,321 5,245 1,919 650 3,720 3,260 25 0 0 575 1,760 470 165
Calendar Year 1984 1985 1986 1987 1988 1989 1990 1991 1992 1993 1994 1995 1996 1997Change in Saving: Deficit-driven Measures
Total 1,215 5,233 5,533 3,506 1,250 3,989 5,511 3,295 1,326 2,550 3,704 7,979 8,267 4,745Spend 0 2,439 769 756 283 1,036 2,136 2,461 1,320 2,550 3,272 6,515 7,475 4,504Tax 1,215 2,794 4,764 2,751 967 2,953 3,375 834 6 0 431 1,464 793 241
Change in Saving: Other Long-term Policy MeasuresTotal 0 -229 -448 -1,957 585 -1,926 332 -536 177 1 71 41 -120 -580Spend 0 0 0 0 -443 -538 -159 -611 246 55 224 85 -120 -385Tax 0 -229 -448 -1,957 1,027 -1,389 491 75 -69 -54 -153 -44 0 -195
Change in Saving: TotalTotal 1,215 5,004 5,086 1,549 1,835 2,062 5,843 2,759 1,503 2,552 3,775 8,020 8,147 4,165Spend 0 2,439 769 756 -160 499 1,977 1,850 1,566 2,605 3,496 6,600 7,355 4,119Tax 1,215 2,566 4,316 793 1,995 1,564 3,866 909 -63 -54 279 1,420 793 46
Total (percent of GDP)Total 0.27 1.03 0.99 0.28 0.30 0.31 0.86 0.40 0.21 0.35 0.49 0.99 0.97 0.47Spend 0.00 0.50 0.15 0.14 -0.03 0.08 0.29 0.27 0.22 0.36 0.45 0.81 0.88 0.47Tax 0.27 0.53 0.84 0.14 0.33 0.24 0.57 0.13 -0.01 -0.01 0.04 0.18 0.09 0.01
MemorandumNominal GDP 449,582 485,714 512,541 558,949 613,094 657,728 679,921 685,367 700,480 727,184 770,873 810,426 836,864 882,733
29
E. Denmark25
Denmark 198326 Fiscal consolidation totaled 2.77 percent of GDP, with spending cuts of 1.85 percent of GDP and tax hikes of 0.92 percent of GDP. Fiscal consolidation in 1983 was motivated by deficit reduction, as the 1984 IMF Recent Economic Developments makes clear (p. 39): “the Government that came into office in September 1982 immediately adopted an economic policy program, inter alia, designed to stop and eventually reverse the upward trend in the public sector deficit. The main thrust of the 1983 budget was to improve the public sector balance by cutting expenditure mainly through incomes policy, while revenue measures included an introduction of taxes on pension funds and an increase in contributions to the social security system.” The government intended the deficit to continue to fall over a number of years, as the 1983 IMF Staff Report reports (p. 7): “As to the medium term, the Government intends to reduce the budget deficit year-by-year and to achieve approximate balance by the end of this decade.” Spending cuts introduced in 1983 amounted to DKr 16 billion (1984 IMF Recent Economic Developments, p. 40), with the budgetary impact spread across 1983 and 1984 as follows: DKr 10 billion in 1983 (1.85 percent of GDP) and DKr 6 billion in 1984 (see entry for 1984 below). The main spending measures were cuts in public sector wages and salaries, and a freeze in social benefit levels (p. 39). Tax hikes amounted to DKr 5 billion in 1983 (p. 40), or 0.92 percent of GDP. The tax hikes included a wealth tax rate hike on pension funds and insurance companies, higher contribution rates for unemployment insurance, and a hike in local authorities’ income tax rates (p. 40). Overall, fiscal consolidation in 1983 totaled 2.77 percent of GDP (1.85+0.92).
Denmark 1984 Fiscal consolidation totaled 2.38 percent of GDP, with spending cuts of 1.71 percent of GDP and tax hikes of 0.67 percent of GDP. Fiscal consolidation continued in 1984 motivated by deficit reduction as in 1983. Spending cuts put in place in 1983 had a budgetary impact of DKr 6 billion in 1984 (see entry for 1983 above). Additional fiscal measures for 1984––spending cuts of DKr 3.1 billion and tax increases of DKr 3.7 billion––were agreed in November 1983 (1984 IMF Recent Economic Developments, p. 44). In April 1984, more fiscal consolidation measures were agreed, with additional spending cuts of DKr 1.1 billion and tax hikes of DKr 0.3 billion (1985 IMF Recent Economic Developments, p. 46). Therefore, spending cuts in 1984 amounted to DKr 10.2 billion (6+3.1+1.1), or 1.71 percent
25 The sources consulted for Denmark are various issues of the IMF Recent Economic Developments, and IMF Staff Report.
26 Notes on 1978-1979. While some fiscal tightening occurred during 1978-1979, the primary motivation was restraining domestic demand to reduce inflation. Therefore, we do not record these policy measures as fiscal consolidation motivated primarily by deficit-reduction and fiscal sustainability considerations. As the 1979 IMF Staff Report (p. 3) explains: “The adjustment strategy adopted since the second half of 1976 relies heavily on incomes policy to influence the growth of domestic costs and tax policy to control the growth of private domestic demand, with the policies reinforcing each other.” However, the savings achieved based on these measures were offset by expansionary measures aimed at reducing unemployment (1979 IMF Staff Report, p. 3): “Unfortunately these effects have been offset by increase expenditure to improve social services, to reduce costs of employers, and particularly, since late 1977, to create employment.”
30
of GDP, and tax hikes amounted to DKr 4.0 billion (3.7+0.3), or 0.67 percent of GDP. Total fiscal consolidation amounted to 2.38 percent of GDP (1.71+0.67).
Denmark 1985 Fiscal consolidation totaled 1.54 percent of GDP, with spending cuts and tax hikes of 0.77 percent of GDP each. Fiscal consolidation in1985 was motivated by deficit reduction, as the 1985 IMF Recent Economic Developments explains (pp. 42-43): “On returning to power after general elections in early 1984, the Government reconfirmed the target of a gradual reduction of the central government deficit… To this end central government noninterest expenditure would be kept unchanged in real terms in 1985 and subsequent years.” The associated budgetary savings were estimated at Kr. 5 billion in 1985 (OECD Economic Surveys 1985/1986, p. 77), or 0.77 percent of GDP. On the tax policy side, savings were of a one-off nature, as the 1985 IMF Recent Economic Developments explains (p. 48): “The settlement by taxpayers of underpayment of PAYE-taxes has been moved forward by one year, implying that in 1985 final settlement will be collected for two years, 1983 and 1984; this will yield a once-for-all increase in taxes in 1985 of about DKr 5 billion” (0.77 percent of GDP). The end of this one-time tax measure implied a budgetary impact of –DKr 5 billion in 1986 (–0.72 percent of GDP). Overall, fiscal consolidation in 1985 amounted to 1.54 percent of GDP (0.77+0.77).27
Denmark 1995 Fiscal consolidation totaled 0.30 percent of GDP based on tax hikes. Fiscal consolidation in 1995 was motivated by reducing the budget deficit, as the 1995 IMF Staff Report (p. 11) explains “The focus of fiscal policy had now switched back to consolidation. Thus, in accordance with the original intentions of the strategy, a withdrawal of fiscal stimulus equivalent to 0.3 percent of GDP had been targeted for 1995… As a result of these measures and the operation of automatic stabilizers, the general government deficit was projected to fall to 2.5 percent of GDP, implying that the deficit criterion of the Maastricht Treaty would
27 Note on 1986. Although fiscal policy tightened in 1986, the principal motivation was restraining domestic demand to reduce overheating. Therefore, we do not record these policy measures as fiscal consolidation motivated primarily by deficit-reduction and fiscal sustainability considerations. As the 1987 IMF Staff Report explains (p. 2): “In order to curb demand pressures and reduce overheating in certain sectors of industry, the Danish authorities introduced a package of fiscal measures in December 1985. This package included increased energy taxes and cutbacks in public works, as well as stepped up education and training to promote Labor market flexibility and reduce bottlenecks. Despite these measures, domestic demand continued to grow rapidly and pressures on the external accounts mounted. The authorities responded by introducing another package of fiscal measures in mid-March 1986, consisting mainly of increased energy taxes. The two packages together were estimated to strengthen the budget by some 2 l/2 percent of GDP, and to move the public sector into significant surplus. The authorities expected that these measures would hold the growth of domestic demand to less than 3 percent in 1986, and reduce the external current account deficit to about 2 3/4 percent of GDP... ” In addition, “Concern over the strength of domestic demand and the widening external deficit led the authorities to introduce yet another fiscal package in October 1986, the third within a year. The main measure was a 20 percent tax on net interest payments on consumer credit, aimed at discouraging borrowing for private consumption” (p. 6). The OECD Economic Surveys 1986/1987 refers to this October package as follows (p. 9): “large policy package aimed at damping private consumption in 1986––the so-called ‘potato diet’ introduced in October.” Overall, therefore, since fiscal tightening in 1986 was primarily motivated by the need to restrain domestic demand, we do not record it as a fiscal consolidation motivated by deficit reduction.

31
comfortably be met.” The fiscal consolidation of 0.30 percent of GDP was implemented mainly through increases in indirect taxes and social security contributions.
F. Finland28
Finland 199229 Fiscal consolidation totaled 0.91 percent of GDP based on spending cuts. Fiscal consolidation was motivated by deficit reduction, as the 1993 IMF Staff Report (p. 4) reports: “Reaction to the large fiscal imbalances included the establishment in February 1992 of the target of bringing the level of real central government expenditures in 1995 back to 1991 levels.” The 1993 IMF Recent Economic Developments (p. 12) notes that: “The authorities have shifted their focus to reducing the widening structural fiscal imbalances.” Fiscal consolidation consisted of spending cuts, with Fmk 4 billion of spending cuts in the 1992 Budget (p. 16), and Fmk 484 million of cuts in the June 1992 Supplementary Budget (p. 17). The spending cuts fell on categories such as education, health care, and employment promotion (p. 17). Overall, spending cuts implemented in 1992 totaled Fmk 4.484 billion (4 +0.484), or 0.91 percent of GDP.30
Finland 1993 Fiscal consolidation totaled 3.71 percent of GDP based on spending cuts. Fiscal consolidation was motivated by the multi-year deficit-reduction plan adopted in 1992 (see
28 The sources consulted for Finland are various issues of the Finland Ministry of Finance Press Release, IMF Recent Economic Developments, IMF Staff Report, and OECD Economic Surveys.
29 Notes on late 1970s and 1980s. In the late 1970s, fiscal policy tightened, but the motivation was primarily restraining domestic demand to improve the external current account balance and reduce inflation. Therefore, we do not record these policy measures as fiscal consolidation motivated primarily by deficit-reduction and fiscal sustainability considerations. As the IMF Recent Economic Developments explains (p. 22): “In formulating the ordinary budget for 1976, the policy priorities continued to be the improvement of the external current account position and the checking of inflation.” Following fiscal relaxation in the early 1980s, fiscal policy tightened again in the mid- to late-1980s, but the motivation was primarily countercyclical––restraining domestic demand, as the 1985 IMF Recent Economic Developments explains (pp. 24-25): “As the international recovery gathered strength during 1983, it was judged necessary to tighten fiscal policy so as to offset the strong stimulus likely to derive from the expected surge in the growth of external demand and to counter the mounting imbalances in the economy… The withdrawal of fiscal stimulus [in 1984] was calculated at roughly 1 percent of GDP… The shift to a contractionary fiscal stance had the desired result, and the growth of domestic demand decelerated notably, just as the boom in exports was developing. In the budget for 1985, a further tightening of the fiscal position is sought, in support of the official inflation objective… The withdrawal of fiscal stimulus [in 1985] is calculated at 0.6 percent of GDP (general government basis).” Similarly, in 1988, fiscal policy tightened to cool domestic demand, as the OECD Economic Surveys 1987/1988 explains (p. 15): “The 1988 budget foresees a tightening of the fiscal policy stance because of concerns about rapid private consumption growth and a deteriorating current account balance.” The associated budgetary impact was estimated at 0.6 percent of GDP by the 1988 IMF Recent Economic Developments (p. 24). 30 Note that a number of government spending increases also occurred in 1992 in response to the deterioration in economic conditions, including higher spending on unemployment compensation and supporting domestic banks (1993 IMF Recent Economic Developments, pp. 16-17). However, since the motivation for this additional spending was a countercyclical response to economic activity, we do not subtract its budgetary impact from that of the fiscal consolidation measures.
32
entry for 1992 above). In 1993, this medium-term deficit-reduction framework was supplemented with a government debt target for 1997, as the 1995 IMF Recent Economic Developments (p. 27) explains: “The expenditure objective was supplemented in early 1993 by the goal of stabilizing the central government debt-to-GDP ratio at below 70 percent by 1997.” Spending cuts introduced in April 1992 had a budgetary impact of Fmk 10 billion in 1993 (1993 IMF Recent Economic Developments, p. 16), and additional spending cuts introduced in October 1992 had a budgetary impact of Fmk 8.5 billion (p. 17). The cuts fell on social benefits, agriculture and forestry, education, housing, transport and communications, public administration, and defense (p. 18). Fiscal consolidation thus amounted to Fmk 18.5 billion (10+8.5), or 3.71 percent of GDP. Finland 1994 Fiscal consolidation totaled 3.46 percent of GDP with 2.77 percent of GDP in spending cuts, and 0.69 percent of GDP in tax measures. Fiscal consolidation was motivated by the government’s multi-year deficit-reduction plan (see entries for 1992 and 1993 above). The 1994 Budget introduced spending cuts of Fmk 14.5 billion (2.77 percent of GDP), as reported by the 1995 IMF Recent Economic Developments (p. 27).31 In addition, the payment by the government of tax refunds due in 1994 was postponed to 1995, generating one-off savings of Fmk 3.6 billion (p. 29), or 0.69 percent of GDP, in 1994 and a budgetary impact of –Fmk 3.6 billion in 1995 (see entry for 1995 below). Therefore, fiscal consolidation in 1994 amounted to 3.46 percent of GDP (2.77+0.69). Finland 1995 Fiscal consolidation amounted to 1.65 percent of GDP with 2.28 percent of GDP in spending cuts partly offset by the expiration of a temporary tax measure worth 0.63 percent of GDP. Fiscal consolidation in 1995 was motivated by deficit reduction, as the 1997 IMF Staff Report (p. 7) explains: “At the inception of its mandate in early 1995, the government enacted a fiscal consolidation program aimed at restoring confidence in central government solvency, and, more specifically, at reversing the increase in its debt-to-GDP ratio before the 1999 general elections.” In particular, as the 1995 IMF Recent Economic Developments reports (p. 30), the government decided to make the Fmk 11.5 billion (2.02 percent of GDP) of spending cuts in the 1995 Budget permanent. The 1996 Budget approved in June 1995 also introduced additional spending cuts totaling Fmk 10.1 billion (p. 31), with a budgetary impact of Fmk 1.5 billion (0.26 percent of GDP) in 1995, and Fmk 8.65 billion (1.47 percent of GDP) in 1996 (see entry for 1996 below). Finally, the payment by the government of the 1994 tax refund which had been postponed by one year (see entry for 1994 above) had a budgetary impact of –Fmk 3.6 billion (0.63 percent of GDP) in 1995. Fiscal consolidation in 1995 thus amounted to 1.65 percent of GDP with spending cuts of 2.28 percent of GDP (2.02+0.26) partly offset by the tax refund of 0.63 percent of GDP.
31 Note that three supplementary budgets introduced spending increases in 1994, but the additional spending was a direct response to the weakness of economic activity (1995 IMF Recent Economic Developments, pp. 27-28). Therefore, since the additional spending was motivated by cyclical considerations, we do not subtract its budgetary impact from that of fiscal consolidation.

33
Finland 1996 Fiscal consolidation totaled 1.47 percent of GDP based on spending cuts. Fiscal consolidation was, as in 1995, motivated by debt reduction and the need to meet the Maastricht criteria, as the 1996 IMF Staff Report (p. 13) explains: “The authorities noted that fiscal policy in Finland is currently driven by one main goal: to reverse the trend in the central government debt-to-GDP ratio by 1999––a key electoral commitment of the Government. They also aim at meeting the EMU criteria for the general government in 1997.” The 1996 Budget adopted in June 1995 introduced spending cuts with a budgetary impact of 1.47 percent of GDP in 1996 (see entry for 1995 above). Note that the improvement in general government finances in 1996 allowed Finland to meet the EMU budget deficit and government debt criteria (1997 IMF Staff Report, p. 7).
Finland 1997 Fiscal consolidation totaled 0.23 percent of GDP with spending cuts of 0.93 percent of GDP partly offset by tax cuts of 0.70 percent of GDP. Fiscal consolidation was motivated by the debt-reduction objectives defined in 1995 and 1996 (see above). In line with this debt-reduction strategy, the 1997 Budget included new spending cuts worth Fmk 6 billion (0.93 percent of GDP), as reported in the OECD Economic Surveys 1997 (p. 103). The spending cuts fell on social benefits, defense, health care and university organizations, amongst other categories (p. 101). However, these spending cuts were largely offset by income tax cuts of Fmk 5.5 billion partly financed by a Fmk 1 billion hike in environment-based taxes (p. 101). There was thus a net tax cut of Fmk 4.5 billion (5.5–1), or 0.70 percent of GDP. The tax cuts were motivated by the long-run need to reduce Finland’s high income tax burden which was “required from a structural standpoint” (1996 IMF Staff Report, p. 15). Given that the tax cut was primarily driven by a long-run supply-side motivation rather than by the need for countercyclical stimulus, we subtract its budgetary impact from the size of fiscal consolidation in 1997. Therefore, fiscal consolidation amounted to 0.23 percent of GDP with spending cuts of 0.93 percent of GDP partly offset by tax cuts of 0.70 percent of GDP.32
32 Notes on 1998-2000. The acceleration of economic growth and the rapid rise of asset prices and inflation from late 1997 onwards motivated a fiscal policy tightening in 1998, as the 1998 IMF Staff Report explains (p. 10): “The authorities noted that concerns about a possible overheating intensified during the second half of 1997… In response to these developments, monetary and fiscal policies had been tightened… As to fiscal policy, the freeze in state budget expenditure had been confirmed in the 1998 budget and in the 1999 budget guidelines issued in February.” Similarly, the OECD Economic Surveys 1998 notes (p. 49) that “In order to limit the risk of economic overheating… the government included additional spending cuts of around Mk 2 billion (½ percent of GDP) in the 1998 budget.” A similar countercyclical motivation guided spending cuts in the 1999 budget, as the OECD Economic Surveys 1998-1999 notes (p. 33): “The draft 1999 budget included FIM 4 billion (0.6 percent of GDP) additional spending cuts compared to the preliminary expenditure guideline aimed at limiting the risk of overheating. At the same time, it included income tax cuts of around FIM 4 billion.” Since the spending cuts were largely motivated by restraining domestic demand and the income tax cuts were motivated by long-run supply-side considerations as in 1997 (see entry for 1997 above), we do not consider 1999 as a year of fiscal consolidation motivated by deficit reduction. Additional tax cuts occurred in 2000, again motivated by long-run considerations (OECD Economic Surveys 1999-2000, p. 40). The budget surplus increased in 2000 despite further income tax cuts motivated by long-run considerations, but this improvement was mainly due to the sharp upswing in economic activity, as the OECD Economic Surveys 2000-2001 explains (p. 37): “The 2000 budget outcome: a very high surplus was mainly due to one-off factors. In 2000, the rise in general government tax revenues on income and wealth was exceptionally strong (23 percent)
(continued…)
34
G. France33
France 1979 Fiscal consolidation totaled 0.85 percent of GDP based on tax increases. Fiscal consolidation in 1979 consisted of a hike in social security contributions motivated by deficit reduction, as the 1979 IMF Staff Report (pp. 6-7) explains: “The area of greatest concern to the authorities within the sphere of public finance remains the social security system… The importance attached by the authorities to restoring the financial integrity of the social security system was demonstrated recently by the Government’s decision to stake its continuation in office on the passage by Parliament of a bill subjecting certain retirement pensions to social security contributions.” The 1980 OECD Economic Surveys (p. 43) reports that higher social security contributions raised revenue by F 22 billion (0.85 percent of GDP) in 1979.34
as substantial one-off revenues came on top of a sharp increase due to very rapid growth.” In addition, spending cuts occurred in 2000, but the motivation was primarily to restrain domestic demand and reduce the risk of overheating, as the Ministry of Finance Press Release of March 7 2000 clarified (p. 1): “Signs of overheating are becoming alarmingly widespread in the Finnish economy… In these conditions, it has become justifiable to adopt a tough stance in fiscal policy to ensure that economic developments remain on a balanced course.” Spending cuts in 2000 amounted to about 2 percent of GDP and helped to restrain aggregate demand, as the 2001 IMF Staff Report (p. 8) reports: “staff estimates a fiscal withdrawal in 2000, brought about by a tightening of structural primary spending relative to GDP, of some 2 percentage points of GDP––strongly counteracting the monetary stimulus.” 33 The sources consulted for France are various issues of the IMF Recent Economic Development, IMF Staff Report, Journal Officiel de la Republique Francaise, and OECD Economic Surveys, and a transcript of a television interview (Antenne 2 Journal télévisé de 20 H).
34 Notes on 1981-4. During 1981-82, a fiscal policy expansion occurred motivated by the need to reduce unemployment (OECD Economic Surveys 1983-84, p. 8). Fiscal policy tightened in 1983, motivated primarily by the need to reduce the external current account deficit by restraining domestic demand as the 1983 IMF Recent Economic Developments (p. 3) explains: “In response to the widening current account deficit since late 1981, the authorities announced a package of measures on March 25, 1983 aimed at reducing domestic demand… The package consisted of public spending cuts, tax increases, and measures to increase private saving.” In a television interview on March 25, 1983, Jacques Delors, then Minister of Finance, justified the fiscal consolidation measures by referring to the growing French trade deficit (Antenne 2 Journal télévisé de 20 H, March 25 1983, transcript, p. 1): “We cannot continue to consume more than we produce, to buy more than we sell abroad. For three, four years, France is in this situation. This must change, and fast… We designed these measures as much as possible by reducing public deficits, and the least possible by directly reducing household incomes…. This effort is only temporary. It must be massive enough to allow the rapid decline in imports in an open economy without protectionism.” The budgetary impact of the March 1983 package is estimated at FF 51 billion (1.22 percent of GDP) in 1983, split roughly evenly across tax and spending measures (OECD Economic Surveys 1983-1984, p. 15). The fiscal tightening introduced in 1983 motivated by the need to reduce the external current account deficit was maintained in 1984, as the 1984 IMF Staff Report (p. 8) explains: “The French representatives considered that in 1983 substantial progress had been made in achieving the Government's immediate objectives. They said that policies would remain in place that targeted an elimination of the current account deficit by the end of 1984 and that would achieve a further reduction in the rate of inflation to 5 percent through 1984. For the longer term, their objectives were to reduce the rate of inflation at least to the average of partner countries, and to achieve a current account surplus in 1985 and beyond.” Overall, since fiscal policy tightening during 1983-84 was primarily motivated the need to restrain domestic demand and
(continued…)
35
France 1987 Fiscal consolidation totaled 0.26 percent of GDP in 1987, with spending cuts of 0.76 percent of GDP partly offset by tax reductions of 0.50 percent of GDP. The newly elected government implemented fiscal consolidation in 1987 aimed at reducing the fiscal deficit to provide room for maneuver to fiscal policy and lowering the tax burden (1988 IMF Recent Economic Developments, p. 29). In a Speech to the Assemblee Nationale on April 9, 1986 (Journal Officiel de la Republique Francaise, 1986, p. 87) the Prime Minister highlighted the deterioration of the public finances in recent years and the need for an independent report on government debt, the budget deficit and the social security accounts. Fiscal consolidation in 1987 relied on spending cuts, as the 1988 IMF Recent Economic Developments (p. 30) reports: “increases in the efficiency of the [central] government sector, principally through large reductions in the government payroll” with some F 30 billion in estimated savings in 1987. In addition, cuts to health care spending amounted to F 10 billion based on the “rationalization of the health insurance system (CNAM), the so-called Plan Seguin. This plan is estimated to have saved some F 10 billion, or more than 2 percent of total health spending in 1987… The principal savings from the Plan Seguin have derived from the reduction in the reimbursement rate on nonessential medical prescriptions and from changes in the coverage of selected treatments” (pp. 34-35). Thus total spending cuts amounted to F 40 billion in 1987 (30+10) or 0.76 percent of GDP. On the tax side, a number of tax hikes designed to reduce the deficit were more than offset by other tax cuts based on long-run considerations. Regarding the tax hikes, effective July 1, 1987, an emergency plan (“plan d’urgence,” p. 35) involved temporary tax hikes for a 12-month period with a budgetary impact of F 21.3 billion (0.40 percent of GDP) over 12 months based on higher employee contributions to the pension system, an income tax surcharge, a 2 percent increase on tobacco taxes, and a 1 percent tax on unearned income from property and investments. Since the tax increases started in mid-1987 and ended in mid-1988, the allocation of the budgetary impact across calendar years is: 0.20 percent of GDP in 1987 and –0.20 percent of GDP in 1989. At the same time, tax cuts in 1987 amounted to F 37 billion in 1987 (0.70 percent of GDP, p. 30). The motivation for the tax cuts was largely a long-term one, such as “to meet the tax harmonization targets of the EEC” (p. 30)––rather than a response to short-term economic developments. The tax cuts were also motivated by the government’s medium-term objective of reducing the tax burden to unleash economic dynamism, as the Prime Minister articulated in a Speech to the Assemblee Nationale on April 9 1986 (Journal Officiel de la Republique Francaise, 1986, p. 9). Therefore, there was a net tax cut of 0.50 percent of GDP in 1987 (0.20–0.70) and the budgetary impact of tax measures put in place in 1987 was thus –0.50 percent of GDP in 1987 and –0.20 percent of GDP in 1989 (see entry for 1989 below). Overall, fiscal consolidation in 1987 totaled 0.26 percent of GDP, with spending cuts of 0.76 percent of GDP partly offset by a tax cut of 0.50 percent of GDP.
France 1989 The temporary tax hike introduced in 1987 expired in 1989 with a budgetary impact of –0.20 percent of GDP. See entry for 1987 above.
the growing current account deficit, we do not record it as a case of fiscal consolidation motivated by deficit reduction in our database.

36
France 1991 Fiscal consolidation totaled 0.25 percent of GDP, based entirely on spending cuts. Fiscal consolidation in 1991 was motivated the government’s commitment to reduce the budget deficit, as the 1991 IMF Recent Economic Developments (p. 9) reports. To meet the deficit-reduction commitment despite an increase in spending associated with the Gulf war—about F 10 billion (p. 10)—and a slowdown in economic activity, a number of fiscal consolidation measures were taken. In particular, “achievement of the deficit objective verged crucially on stringent expenditure control” (p. 9). Spending cuts of F 10.2 billion in 1991 were decided upon in March (p. 10), consisting of “a reduction by 5 percent of current expenditure and 10 percent of capital expenditure, mostly affecting a few departments such as urban development and housing, and transportation.” Also, “An additional F 17 billion package was put forth in May, F 10 billion of which constituted permanent expenditure cuts” (p. 10). Therefore, spending cuts in 1991—net of the increase in Gulf war spending—amounted to F 17.2 billion (–10+10.2+17), or 0.25 percent of GDP, of which F 7 billion (17–10), or 0.1 percent of GDP, was temporary. The budgetary impact of these spending cuts was thus 0.25 percent of GDP in 1991 and –0.1 percent of GDP in 1992. France 1992 Temporary spending cuts introduced in 1991 expired in 1992, with a budgetary impact of –0.10 percent of GDP. See entry for 1991 above. France 1995 Fiscal consolidation totaled 0.28 percent of GDP, with tax hikes of 0.43 percent of GDP partly offset by spending increases of 0.15 percent of GDP. The new government adopted a multi-year fiscal consolidation plan aimed at reducing the general government deficit from 6.0 percent of GDP in 1994 to 3.0 percent in 1997 (1996 IMF Recent Economic Developments, p. 12). Evidence that policymakers were concerned about the large budget deficit is clear in the text of the Guidance Law on the Control of Public Finances passed in January 1994, which mentions “a serious budgetary crisis” due to the increase in the fiscal deficit during 1990-1993.35 The law states that the stabilization and then the reduction of government debt is the key objective of fiscal policy and introduces multiyear fiscal targets designed to allow France to satisfy the Maastricht Treaty criteria for accession to EMU by 1997. The Supplementary Budget announced by the newly elected government in June included tax hikes estimated at F 33 billion and a net increase in spending of F 15 billion (p. 13). Additional spending initiatives later in the year amounted to F 16.2 billion (disaster relief for the Netherlands Antilles, military spending in the Balkans, and a back-to-school allowance). Since these spending initiatives were not a response to domestic economic activity, we subtract their budgetary impact—F 31.2 billion (15+16.2)—from the size of fiscal consolidation in 1995. In addition, tax receipts declined due a weakening in activity (p. 14). In response, the government announced in October that “achieving EMU would henceforth be the highest economic policy priority” (p. 12) and introduced fiscal
35 See “Loi n°94-66 du 24 janvier 1994 d'orientation quinquennale relative à la maîtrise des finances publiques” in Journal Officiel de la Republique Francaise (1994) available on the internet at http://legifrance.gouv.fr/affichTexte.do?cidTexte=JORFTEXT000000181666

37
consolidation measures in a Supplementary Budget in November with F 20 billion in expenditure cuts in 1995 (p. 14).36 Overall, fiscal consolidation in 1995 amounted to F 21.8 billion (0.28 percent of GDP) with F 33 billion in tax hikes (0.43 percent of GDP) partly offset by a net spending increase of F 11.2 billion (31.2–20), or 0.15 percent of GDP. France 1996 Fiscal consolidation totaled 1.33 percent of GDP, with tax hikes of 0.86 percent of GDP and spending cuts of 0.47 percent of GDP. Fiscal consolidation continued in 1996, motivated by deficit reduction and the need to meet the Maastricht criteria (see entry for 1995). Tax hikes introduced in the second half of 1995 had their full-year budgetary impact of 1996, estimated at F 70 billion (1996 IMF Recent Economic Developments, p. 15). This represents a change in saving of F 37 billion (F 70 billion minus the budgetary impact of the tax hikes in 1995––F 33 billion). In addition, additional tax hikes occurred in 1996: “New measures taken in 1996 are valued at F 10½ billion and include increases in taxes on gasoline, alcohol, and tobacco” (p. 15). Thus tax hikes had a budgetary impact of F 48 billion in 1996 (0.59 percent of GDP). On the spending side, in February, the government announced additional expenditure cuts amounting to F 20 billion in 1996 (p. 15) or 0.25 percent of GDP. In addition, “As part of its effort to reduce the general government deficit to 3 percent of GDP by 1997, the government in November 1995 announced a sweeping reform of social security” (p. 17). The reform was adopted in 1996 and generated savings estimated at 0.50 percent of GDP in 1996 and 0.70 percent of GDP in 1997 (pp. 17-18), of which slightly less than half was due to spending cuts. Spending cuts due to the reform generated cumulative savings of about 0.22 percent of GDP in 1996 and 0.31 percent of GDP in 1997, while tax hikes due to the reform generated cumulative savings of about 0.28 percent of GDP in 1996 and 0.39 percent of GDP in 1997 (p. 17). Therefore, the change in saving due to the reform was 0.50 percent of GDP in 1996 (0.22+0.28) and 0.20 percent of GDP (0.31+0.39–0.50) in 1997 (see entry for 1997 below). Total spending cuts in 1996––including the social security reform measures––thus amounted to 0.47 percent of GDP (0.25+0.22). Total tax hikes in 1996––including the social security reform measures––amounted to 0.86 percent of GDP (0.59+0.28, rounding). Thus, fiscal consolidation in 1996 amounted to 1.33 percent of GDP (0.47+0.86), mainly based on tax hikes.
France 1997 Fiscal consolidation totaled 0.50 percent of GDP, with tax hikes of 0.41 percent of GDP and spending cuts of 0.09 percent of GDP. Fiscal consolidation continued in 1997, motivated by the need to meet the Maastricht criteria. Following parliamentary elections in May/June 1997, Socialist Party leader Mr. Jospin became the head of a government that included some members of the communist and ecological parties, and spending increases were announced, as the 1997 IMF Staff Report (p. 11) explains: “Shortly after taking office in June, the new government decided on spending increases in 1997 of some 0.1 percent of
36 The spending cuts included F 3.5 billion in military procurement, F 1.1 billion in housing subsidies, and F 0.7 billion in cultural activities (p. 14). The Government also received a payment of F 15 billion from the Caisse des Depots et Consignations, a government-controlled financial institution (p. 14), but, for reasons explained above, this additional receipt does not constitute a tax hike or a spending cut for the purposes of our analysis.

38
GDP. However, in late July, when an audit of the public finances concluded that the fiscal deficit was set to reach 3.5 to 3.7 percent of GDP in 1997, the government decided on corrective measures amounting to 0.4 percent of GDP,” with spending cuts amounting to about 0.1 percent of GDP. Tax hikes amounted to about 0.3 percent of GDP and were based on a temporary increase in corporation tax for businesses (p. 11). The tax hike was then reduced by one-third in 1999 and terminated in 2000 as explained by the OECD Economic Surveys 1999 (p. 41). The budgetary impact of the temporary tax hike is thus recorded as 0.30 percent of GDP in 1997, –0.10 percent of GDP in 1999, and –0.20 percent of GDP in 2000 (see below). In addition, the budgetary impact of the social security reform adopted in 1996 was 0.20 percent of GDP in 1997, with spending cuts of 0.09 percent of GDP and tax hikes of 0.11 percent of GDP (see entry for 1996 above). Therefore, spending cuts amounted to 0.09 percent of GDP in 1997 (–0.10 + 0.10 + 0.09), tax hikes amounted to 0.41 percent of GDP (0.30 + 0.11), and fiscal consolidation totaled 0.50 percent of GDP (0.09 + 0.41).
France 1999 The partial expiration of a temporary tax hike introduced in 1997 had a budgetary impact of –0.10 percent of GDP in 1999. See entry for 1997 above. France 2000 The full expiration of a temporary tax hike introduced in 1997 had a budgetary impact of –0.20 percent of GDP in 2000. See entry for 1997 above.
H. Germany37
Germany 1982 Fiscal consolidation totaled 1.18 percent of GDP, with tax hikes of 0.56 percent of GDP and spending cuts of 0.62 percent of GDP. Fiscal consolidation in 1982 was motivated by the widespread concern about the size of the deficit, as the 1982 IMF Recent Economic Developments (p. 18) reports: “calls from important groups within the private sector for a reduction of the fiscal deficit through comprehensive measures to slow down the growth of expenditures, including changes in social and other legislation. The strength of these calls suggested to the Government that the absence of decisive and reliable steps toward fiscal consolidation would harm the confidence of, in particular, investors.” The Financial Planning Council, which consists of representatives of the Federal Government, the Länder, and local authorities recommended bringing the deficit in 1982 back to the 1980 level. In response to these concerns and recommendations, the Federal Government adopted a new medium-term fiscal consolidation plan in September 1981 consisting mainly of spending cuts, which was passed by Parliament in December 1981. Fiscal consolidation in 1982 consisted of spending cuts of DM 11.3 billion (0.62 percent of GDP), and tax hikes of DM 10.2 billion (0.56 percent of GDP) of which 0.41 percent of GDP were temporary (1982-1983 only), as the 1982 IMF Recent Economic Developments explains (p. 104). Therefore, following our
37 The sources consulted for Germany are various issues of the German Council of Economic Experts Annual Report, Germany Fiscal Stability Program, Germany Stability Program, IMF Recent Economic Development, IMF Staff Report, and OECD Economic Surveys.
39
convention for recording temporary measures, the budgetary impact of the tax hikes was 0.56 percent in 1982 and –0.41 percent in 1984 (see entry for 1984 below). The spending cuts fell mainly on social programs such as unemployment benefits, payments for retraining the unemployed, and child allowances, while tax hikes affected selected excises and the unemployment insurance rate (p. 27).38
Germany 1983 Fiscal consolidation totaled 0.87 percent of GDP, with spending cuts of 0.57 percent of GDP and tax hikes of 0.30 percent of GDP. Fiscal consolidation continued in 1983, motivated by deficit reduction. Concern about the size of the fiscal deficit remained high given the growing share of interest payments in public-sector spending, as the OECD Economic Surveys 1982-1983 (p. 29) explains. Fiscal consolidation in 1983 totaled DM 16.6 billion (0.87 percent of GDP) with spending cuts worth DM 10.8 billion (0.57 percent of GDP) and tax hikes worth DM 5.8 billion (0.30 percent of GDP), as reported in the 1983 IMF Recent Economic Developments (p. 24).39 The measures on the spending side concentrated on social programs, such as the child allowance and pensions, and on public employee salaries. On the tax side, there were hikes in the VAT rate and in the contribution rates for social security and unemployment insurance (p. 24).
Germany 1984 Fiscal consolidation totaled 0.18 percent of GDP, with spending cuts of 0.59 percent partly offset by the end of temporary tax measures introduced in 1982. Fiscal consolidation continued in 1984, motivated by deficit reduction, as the 1984 IMF Staff Report (p. 6) explains: “It was considered essential to maintain the momentum of fiscal consolidation in 1984” to avoid undermining business confidence. The deficit reduction package implemented in 1984 fell entirely on spending cuts, with measures amounting to DM 11.8 billion (0.59 percent of GDP), as reported in the 1984 IMF Recent Economic Developments (p. 27). More than half of the cuts fell on civil-servant salaries and unemployment benefits (benefits were reduced from 68 percent to 63 percent of net earnings and unemployment relief payments from 58 percent to 56 percent for recipients without children).40 At the same time, the expiration in 1984 of temporary tax hikes introduced in
38 In response to a weakening economy in 1982, some expansionary countercyclical measures were implemented (p. 27). However, as explained above, since these measures were motivated by the cyclical weakness of the economy, we do not subtract their budgetary impact from that of fiscal consolidation in 1982. 39 In addition, a temporary 5 per cent levy on higher incomes was introduced, but this levy was explicitly designed to finance additional social housing construction (p. 23) rather than to reduce the fiscal deficit. As in 1982, the government also implemented countercyclical stimulus to raise employment, which, for reasons explained above, we do not subtract from the budgetary impact of fiscal consolidation.
40 In addition to fiscal consolidation, the government introduced tax cuts in 1984 (p. 28) worth DM 4 billion (0.20 percent of GDP) motivated by countercyclical considerations–supporting the recovery–as the 1984 IMF Staff Report explains (p. 6): “the risk of ‘overconsolidation’ had been considered… Recovery from the recession had not yet materialized, and some feared that an early tightening of fiscal policy could forestall it. Within the restrictive stance of overall fiscal policy, selective measures to stimulate investment were therefore introduced, including increased tax deductability of interest payments for private housing, increased expenditure on public housing, and interest rate subsidies to advance construction projects.” Since these tax cuts were a
(continued…)

40
1982 (see entry for 1982 above) had a budgetary impact of –0.41 percent of GDP in 1984. Therefore, fiscal consolidation totaled 0.18 percent of GDP (0.59–0.41).
Germany 199141 Fiscal consolidation in 1991 amounted to 1.11 percent of GDP, with tax hikes of 1.08 percent of GDP and spending cuts of 0.03 percent of GDP. Fiscal consolidation was motivated by the need to reduce a large budget deficit, as the 1991 IMF Economic Developments and Issues reports (p. 7), “The government announced in the November 1990 Eckwertebeschluss (decision on fiscal benchmarks) that the territorial authorities’ deficit would not be allowed to exceed 5 percent of GNP in the short run and would be brought back to below 3 percent by 1994.” To achieve the targeted deficit reduction, two major packages of tax hikes were announced in January and February 1991. The tax hikes generated savings of DM 32.2 billion in 1991 (p. 25) and DM 41 billion in 1992. Therefore, the change in saving was DM 32.2 billion in 1991 (1.08 percent of GDP) and DM 8.8 billion (41–32.2), or 0.27 percent of GDP, in 1992. Some of the tax hikes were temporary, and their expiration in 1993 had a budgetary impact of –DM 15.1 billion, or –0.46 percent of GDP, in 1993 (see entry for 1993 below). The tax hikes raised both indirect and direct tax rates (p. 25).42 The government also started a round of subsidy cuts in 1991 intended to “help steer fiscal developments toward meeting these medium-term [deficit] targets” (1991 IMF Economic Developments and Issues, p. 101) with the cumulative impact growing from DM 1 billion (0.03 percent of GDP) in 1991 to DM 19.5 billion (or 0.56 percent of GDP) by 1994 (p. 98).
deliberate response to cyclical fluctuations, we do not subtract their budgetary impact from the size of fiscal consolidation in 1984.
41 Notes on 1985-90. This was not a period of policy-induced fiscal consolidation motivated by deficit reduction. In 1985-86, the budget deficit declined, but, in contrast to 1983-84, the decline occurred “without any new legislative measures to reduce spending or increase tax rates” (1986 IMF Recent Economic Developments, p. 18). In 1986, 1988 and 1990, tax cuts occurred, primarily motivated by the government’s decision in December 1984 to cut marginal personal income tax rates for long-run “supply-side” reasons, as the 1987 IMF Recent Economic Developments explains (p. 24): “When the conservative-liberal government took office in 1982, fiscal consolidation and tax reform was high on the economic policy agenda. Tax reform plans were motivated by ‘supply-side’ considerations and the need for lower tax rates was emphasized; but tax reform was initially subordinated to the objective of reducing the government deficit. In December 1984, the government decided upon a tax reduction package of DM 19.5 billion (about 1 percent of GNP) for households to become effective in two stages in 1986 and 1988.” A final third stage of tax cuts occurred in 1990, with the total budgetary impact of the three-year (1986, 1988 and 1990) tax cuts estimated at DM 48 billion (2 percent of GNP) (1989 IMF Staff Report, p. 12). A second motivation for the 1988 tax cut was to stimulate domestic demand as part of Germany’s commitment under the Louvre Accord of February 1987 (1989 IMF Staff Report, p. 12). Finally, although indirect (excise) tax hikes occurred in 1989, these tax hikes were not motivated by deficit reduction; the motivation was to finance additional spending by the European Community (OECD Economic Surveys 1988/1989, p. 50). Overall, during this period, the emphasis of fiscal policy shifted away from fiscal consolidation: “The tax reform package changes the prospective fiscal policy stance in Germany for 1988 and beyond... After the considerable successes in controlling expenditures and reducing deficits in the last few years, the government has now shifted the emphasis of fiscal policy toward the objective of tax reform and reduction” (p. 25).
42 While cuts in defense expenditure had been planned (p. 23), they were not implemented in light of the Middle East conflict.
41
In percent of GDP, the change in saving due to these spending cuts was as follows: 0.03 in 1991, 0.19 in 1992, 0.18 in 1993, and 0.18 in 1994 (see entries for 1992, 1993, and 1994 below). Therefore, fiscal consolidation totaled 1.11 percent of GDP (1.08+0.03) in 1991, with most (1.08 percent of GDP) of the budgetary impact due to tax hikes. Germany 1992 Fiscal consolidation amounted to 0.46 percent of GDP, with 0.27 percent of GDP of tax hikes and 0.19 percent of GDP of spending cuts. The tax hikes put in place in 1991 had a budgetary impact of 0.27 percent of GDP in 1992 (see entry for 1991 above). In addition, the subsidy cuts put in place in 1991 had a budgetary impact of 0.19 percent of GDP in 1992 (see entry for 1991 above). Therefore, fiscal consolidation in 1992 amounted to 0.46 percent of GDP (0.27+0.19). Germany 1993 Fiscal consolidation amounted to 0.11 percent of GDP, with spending cuts of 0.18 percent of GDP partly offset by a net tax cut of 0.07 percent of GDP. Fiscal consolidation was motivated by the need to meet the medium-term deficit-reduction goals agreed in July 1991, as the 1994 IMF Economic Developments and Issues explains (p. 8). On the tax side, there was an increase in the VAT rate from 14 to 15 percent with an estimated budgetary impact of DM 13 billion in 1993, or 0.39 percent of GDP (1991 IMF Economic Developments and Issues, p. 104). However, these savings were more than offset by the expiration of a number of temporary tax hikes put in place in 1991 with a budgetary impact of –0.46 percent of GDP in 1993 (see entry for 1991 above). The combined budgetary impact of these two tax changes was thus –0.07 percent of GDP (0.39–0.46). In addition, spending cuts put in place in 1991 had a budgetary impact of 0.18 percent of GDP (see entry for 1991 above). Total fiscal consolidation in 1993 thus totaled 0.11 percent of GDP, with a spending cut of 0.18 percent of GDP partly offset by a net tax cut of 0.07 percent of GDP. Germany 1994 Fiscal consolidation in 1994 amounted to 0.91 percent of GDP, with 0.83 percent of GDP in spending cuts, and 0.08 percent of GDP in tax hikes. In July 1993, the Cabinet approved a package of new measures, passed into law at the end of the year, intended to limit the federal budget deficit in 1994 to 2¼ percent of GNP (1994 IMF Economic Developments and Selected Background Issues, p. 39). The package was primarily intended to reduce the deficit and was not motivated by the need to restrain domestic demand (the economy was still recovering from the 1993 recession). The overall cumulative budgetary impact of the deficit-reduction package amounted to DM 25.3 billion in 1994 and DM 32.6 billion in 1995 (1993 IMF Staff Report—Supplement I, p. 10). Spending cuts generated most of the cumulative savings: DM 22.5 billion in 1994 and DM 27.4 billion in 1995, while the impact of tax cuts was DM 2.8 billion in 1994 and DM 5.2 billion in 1995. Therefore, the change in saving due to the package was DM 25.3 billion (0.73 percent of GDP) in 1995 and DM 7.3 billion (32.6–25.3), or 0.20 percent of GDP, in 1995 (see entry for 1995 below). The contribution of spending cuts to the change in saving was 0.65 percent of GDP in 1994 and 0.14 percent of GDP in 1995, while that of tax hikes was 0.08 percent of GDP in 1994 and 0.07 percent of GDP in 1995. Most of the spending cuts fell on the areas of social and labor market policy (p. 10), with reductions in replacement ratios for unemployment compensation
42
and related benefits. On the tax side, the measures involved reducing exemptions, broadening the tax base, and combating evasion.43 Finally, the spending cuts put in place in 1991 had a budgetary impact of 0.18 percent of GDP in 1994 (see entry for 1991 above). Therefore, fiscal consolidation in 1994 amounted to 0.91 percent of GDP, with spending cuts of 0.83 (0.65+0.18) and tax hikes of 0.08 percent of GDP. Germany 1995 Fiscal consolidation in 1995 amounted to 1.08 percent of GDP, with 0.84 percent of GDP in spending cuts, and 0.24 percent of GDP in tax hikes. Fiscal consolidation was motivated by the deficit-reduction objective of the Solidarity Pact of 1993, as the 1993 IMF Recent Economic Developments reports (p.15): “Faced with mounting deficits and the prospect of a sharp increase in the public debt, the Government in the summer of 1992 began discussions on a broad ‘solidarity pact’ between the Federal Government, the Lander and local governments, and the social partners. A crucial aspect of this pact was the fiscal consolidation plan announced by the Government in January 1993… An agreement on a ‘solidarity pact’ was reached in March 1993 between the various levels of government and the opposition Social Democrats.” The pact was based mainly on tax hikes with an income tax surcharge of 7.5 percent and an increase in the wealth tax (OECD Economic Surveys 1995, p. 62). The budgetary impact of these tax hikes was estimated at DM 28 billion in 1995 (1993 IMF Recent Economic Developments, p. 26), or 0.77 percent of GDP. There were also spending cuts amounting to DM 3.9 billion (0.11 percent of GDP), with cuts in defense, subsidies to coking coal and agriculture, federal government employment, and pay supplements for civil servants (p. 28). In addition, there was the impact of the program of consolidation that started in 1994 (see entry for 1994), with 0.14 percent of GDP of spending cuts and 0.07 percent of GDP of tax hikes. Therefore, total fiscal consolidation in 1995 amounted to 1.08 percent of GDP, with 0.24 percent of GDP in spending cuts (0.11+0.14, rounding) and 0.84 percent of GDP in tax hikes (0.77+0.07).
Germany 1997 Fiscal consolidation totaled 1.60 percent of GDP, with spending cuts of 1.10 percent of GDP and tax hikes of 0.50 percent of GDP. Fiscal consolidation in 1997 was primarily motivated by deficit reduction and meeting the Maastricht deficit criteria, as the 1997 IMF Staff Report reports (p. 20): “To shore up the public finances, the authorities adopted in late 1996 substantial discretionary fiscal measures as part of the budget for 1997, which were heavily weighted on spending cuts… With these measures, the authorities expected that the general government deficit would decline to 2% percent of GDP in 1997, safely under the Maastricht reference value.” Spending cuts in the 1997 budget amounted to 1.0 percent of GDP (p. 20) and were based on wage restraint and retrenchments, spending limits imposed at the federal and state level, reducing sick pay coverage and restricting spa visits, and tightening eligibility for unemployment benefits. Additional spending cuts (a temporary
43 The government and the opposition parties also agreed on an increase in the fuel tax in January 1994 (1994 IMF Economic Developments, p. 9). However, this tax hike was not motivated by deficit reduction; it was explicitly designed to finance additional spending on restructuring the federal railways. For this reason, we do not record it in our database of fiscal consolidation measures motivated by deficit reduction.
43
spending freeze) were introduced in May, worth 0.10 percent of GDP (p. 22). There were also tax hikes based on higher social security contribution rates, yielding an additional 0.50 percent of GDP (p. 20).44 Therefore, fiscal consolidation totaled 1.60 percent of GDP in 1997, with 1.10 percent of GDP in spending cuts (1.00+0.10), and 0.50 percent of GDP in tax hikes.45
Germany 1998 The expiration of a spending freeze introduced in 1997 had a budgetary impact of –0.10 percent of GDP in 1998. The end of the temporary spending freeze introduced in May 1997 (see entry for 1997 above) had a budgetary impact of –0.10 percent of GDP. On the tax side, there was no net fiscal consolidation as the 1998 IMF Staff Report notes (p. 8), with a rise in VAT in April offset by a fall in the solidarity surcharge.
Germany 1999 Fiscal consolidation totaled 0.30 percent of GDP based on tax hikes. The new government which came into office after October 1998 retained the deficit-reduction objective of its predecessor (OECD Economic Surveys 1998-1999, p. 49). However, little in terms of new fiscal consolidation measures generated savings in 1999. A hike in the rate of VAT by one percentage point in April 1998 had its full year impact in 1999, and this measure, along with “a recovery of the income tax base due to the gradual phasing out of previous allowances” (p. 50-51) had a budgetary impact of 0.30 percent of GDP in 1999 (p. 50).
Germany 2000 Fiscal consolidation amounted to 0.70 percent of GDP, with spending cuts of 0.75 percent of GDP partly offset by tax cuts of 0.05 percent of GDP. Fiscal consolidation was motivated by achieving the deficit reduction specified in the Germany Fiscal Stability Program submitted to the EU Council of Ministers and the European Commission in January 1999. As the 1999 IMF Staff Report – Selected Issues (p. 44) reports, “The June 1999 fiscal package distinguishes itself from earlier consolidation efforts, in that it encompasses tax reductions rather than tax increases, and achieves consolidation through targeted spending 44 Other tax changes occurred in 1997 but were broadly revenue neutral: the wealth tax was abolished, the inheritance and gift taxes were modified, and the real estate transactions tax was increased.
45 Note on 1996. Fiscal consolidation efforts in 1996 were more than offset by tax cuts and spending increases. Regarding the tax cuts, the 1996 IMF Recent Economic Developments (p. 22) reports that “The 1996 Annual Tax Act for the territorial authorities had to accommodate the significant revenue losses resulting from two rulings by the Constitutional Court. The first Court ruling exempted subsistence income from taxation at a cost of DM 14 billion. The second Court ruling eliminated the ‘coal penny’ (Kohlepfennig), an electricity surcharge benefitting coal mining (DM 7 billion).” In addition, the authorities decided to raise child benefits by DM 9 billion. The combined budgetary impact of the tax cuts and spending increase was DM 21 billion (14+7+9), or 0.82 percent of GDP. On the other hand, various tax loopholes were closed and tax incentives streamlined, yielding savings of about DM 2 billion (p. 22). And a freeze on government spending was put in place in March with an estimated budgetary impact of DM 7 billion (p. 23). The combined budgetary impact of these measures was thus DM 9 billion (2+7), or 0.24 percent of GDP, which did not offset the negative budgetary impact of the tax cuts and spending increases mentioned above. Therefore, we do not record 1996 as a year of fiscal consolidation.
44
cuts rather than savings across the board.” In 2000, spending cuts amounted to DM 30.1 billion (p. 45), or 0.75 percent of GDP. Spending cuts fell mainly on social programs (including indexation of pensions to the rate of inflation rather than to net wage growth), the public sector wage bill, and subsidies. At the same time, a tax reform motivated by long-run (supply-side) considerations had an overall budgetary impact of DM –2 billion in 2000 (OECD Economic Surveys 1998-1999, p. 58), or about –0.05 percent of GDP in 2000. The tax reform program, which was implemented over 2000-2002, concentrated on reducing tax rates on personal income, business income, and retained profits. Overall, fiscal consolidation in 2000 amounted to 0.70 percent of GDP (0.75–0.05), with 0.75 percent of GDP in spending cuts, and 0.05 percent of GDP in tax cuts. Germany 200346 Fiscal consolidation totaled 0.74 percent of GDP based on tax hikes. Concerns about the size of the fiscal deficit were widespread in late 2002, as the German Council of Economic Experts47 Annual Report 2002/03 makes clear (p. 30): “Public finance is veering out of control––budgetary consolidation must be resolutely continued. The general government budget deficit of 3.7 percent in 2002 breaches the criteria laid down in the Stability and Growth Pact.” The Annual Report emphasized the importance of reducing the deficit below the 3 percent of GDP limit of the Stability and Growth Pact (p. 32): “The rules of the European Stability and Growth Pact are not ‘stupid.’ It was right to adopt the Stability Pact and it is right to continue to uphold it.” Accordingly, the newly elected government implemented fiscal consolidation in 2003, and the motivation was reducing a large inherited budget deficit. The 2002 OECD Economic Surveys (p. 64) reports that the new government’s consolidation package “aims at reducing the general government deficit to a level below 3 per cent of GDP in 2003 and reaching balance in the medium term. The package largely consists of various measures generating higher revenues in income, business and indirect taxes. Mainly, this comprises reductions in tax allowances, e.g. for the construction of owner-occupied houses or the netting of business losses with profits, and broadening the base for the turnover tax.” The budgetary impact of these measures was estimated at € 16 billion (p. 64), or 0.74 percent of GDP.48 Germany 2004 Fiscal consolidation totaled 0.40 percent of GDP, with spending cuts of 1.10 percent of GDP partly offset by tax cuts of 0.70 percent of GDP. Fiscal consolidation continued in 2004, motivated, as in 2003, by the need to reduce the deficit to the limits specified in the
46 Note on 2001-2002. A tax reform program motivated by long-run (supply-side) considerations involved tax cuts phased in over 2001-2002 (OECD Economic Surveys 1998-1999, p. 58, and Germany’s Fiscal Stability Program of December 2003). For these years, we do not record fiscal consolidation.
47 The German Council of Economic Advisors is the preeminent body of outside experts advising the German government in economic affairs.
48 In 2003, there was also additional spending on reconstruction following the 2002 flood disaster (Germany Stability Program, p. 20). However, as this additional spending was motivated by a response to economic conditions, we do not subtract its budgetary impact from that of fiscal consolidation in 2003.
45
Stability and Growth Pact (see entry for 2003 above). The consolidation measures consisted of spending cuts amounting to 1.10 percent of GDP in 2004 (2004 IMF Staff Report, p. 23), with more than half of the cuts falling on social transfers and subsidies. The spending cuts more than offset the tax cuts associated with the latest stage of the tax reform initiated in 2000––0.70 percent of GDP in 2004––which was motivated by long-run supply-side considerations (p. 23). Germany 200649 Fiscal consolidation totaled 0.50 percent of GDP based on spending cuts. Fiscal consolidation in 2006 was again motivated by deficit reduction, as the Germany Stability Program 2007 makes clear (p. 20): “in the course of the consolidation package implemented by the government in 2006, not only was the excessive deficit reduced, but a decisive step was taken towards the sustainability and long-term recovery of the government finances.” The measures implemented in 2006 consisted of spending cuts, estimated by the 2006 IMF Staff Report (p. 23) at 0.50 percent of GDP.
Germany 2007 Fiscal consolidation totaled 0.90 percent of GDP, with spending cuts of 0.40 percent of GDP and tax hikes of 0.50 percent of GDP. In 2007, fiscal consolidation was, as in 2006, motivated by deficit reduction, as the 2007 Germany Stability Program made clear (p. 22), “This year, Germany will achieve a balanced budget for the first time since 1989. This means that in the course of the consolidation package implemented by the government in 2006, not only was the excessive deficit reduced, but a decisive step was taken towards the sustainability and long-term recovery of the government finances.” The consolidation package for 2007 consisted of a tax hikes and spending cuts (2006 Germany Stability Program, p. 16). On the tax side, a VAT rate hike from 16 to 19 percent was partly offset by a cut in social security contributions, with the net budgetary impact of 0.50 percent of GDP (p. 16). On the spending side, cuts worth 0.40 percent of GDP (p. 16) fell mainly on social transfers, such as the basic allowance for jobseekers.50
49 Note on 2005. Spending cuts occurred in 2005, motivated, as in 2003 and 2004, by the need to reduce the deficit to the limits specified in the Stability and Growth Pact. However, the spending cuts––estimated at 0.10 percent of GDP (2005 IMF Staff Report, p. 27)––were not sufficient to offset the budgetary cost of tax cuts associated with the tax reform. Since the tax reform was motivated by supply-side considerations, we subtract its budgetary cost from the savings due to the spending cuts, and conclude that no fiscal consolidation occurred in 2005. 50 Note on 2008. A corporate income tax reform and a reduction in unemployment contributions occurred, resulting in no net fiscal consolidation (2008 IMF Staff Report, p.24).
46
I. Ireland51
Ireland 1982 Fiscal consolidation totaled 2.80 percent of GDP, with tax hikes of 2.54 percent of GDP and spending cuts of 0.26 percent of GDP. Fiscal consolidation was motivated by a response to the large budget deficit, as the 1983 IMF Recent Economic Developments (p. 7) explains: “the authorities have recently introduced strong measures to arrest and gradually reverse the deterioration in the public finances… The authorities’ objective is to eliminate the current budget deficit by 1987.” A newly-elected government introduced a number of fiscal consolidation measures in the March 1982 Budget, mainly on the revenue side. Revenue measures amounted to Ir£ 416.4 million, of which tax hikes comprised Ir£ 371.4 million (p. 73), or 2.54 percent of GDP. The tax measures consisted primarily of indirect tax hikes (Ir£ 299.1 million) such as higher VAT rates (p. 73). Spending cuts also occurred, with an “embargo on the filling of vacancies in the public service,” estimated to generate savings of Ir£ 25 million (p. 51), or 0.09 percent of GDP, and “the abolition or reduction in the second half of 1982 of food subsidies on butter, margarine,” which generated savings in 1983 of Ir£ 13.2 billion (p. 73), or 0.17 percent of GDP. Fiscal consolidation thus totaled 2.80 percent of GDP, with 2.54 percent of GDP in tax hikes, and 0.26 percent of GDP in spending cuts (0.09+0.17). Ireland 1983 Fiscal consolidation totaled 2.50 percent of GDP, with tax hikes of 2.44 percent of GDP and spending cuts of 0.06 percent of GDP. Fiscal consolidation was motivated by the government’s medium-term objective of eliminating the current budget deficit by 1987 (see entry for 1982 above). The primary objective of the 1983 Budget was to reduce the budget deficit, as the 1983 IMF Recent Economic Developments explains (p. 56): “Within the framework of the long-term goal to redress the imbalance in the public sector finances, the 1983 budget was designed to (1) reduce the current budget deficit to 6¾ per cent of GNP and (2) contain the overall EBR [Exchequer borrowing requirement] to 13 per cent of GNP. The authorities relied principally on tax changes, because of the difficulty of reducing expenditure in the short term.” Tax hikes amounted to Ir£ 395.4 million (2.44 percent of GDP), with most of the hikes (Ir£ 283.4 million) due to higher indirect tax rates––VAT, excises and fuel tax rates (p. 73). On the spending side, the embargo on the filling of vacancies implemented in 1982––“two out of every three vacancies are held open as they arise” (p. 51)––continued in 1983 with additional savings in 1983 of Ir£ 10 million (p. 51), or 0.06 percent of GDP.52 Fiscal consolidation thus amounted to 2.50 percent of GDP, almost all on the tax side. 51 The sources consulted for Ireland are various issues of the Budget, IMF Recent Economic Development, IMF Staff Report, Ireland Stability Program, and OECD Economic Surveys.
52 There were also spending increases in 1983, such as increases in unemployment benefit rates. However, since these spending increases were made in response to rising unemployment, we do not subtract their budgetary cost from the size of fiscal consolidation measures.

47
Ireland 1984 Fiscal consolidation totaled 0.29 percent of GDP based on tax hikes. Fiscal consolidation continued to be motivated by the government’s medium-term deficit-reduction objective, but the pace of consolidation slowed, as the 1984 IMF Recent Economic Developments explains (p. 51): “The budget for 1984 was designed to consolidate the gains made during 1982-83 in correcting the imbalance in public finances, without giving a significant deflationary impulse to the economy… The authorities reiterated their view that progress in reducing the deficit was critical to the attainment of the Government's medium-term fiscal objectives. However, in view of the need to support activity, it was decided to moderate the pace of fiscal adjustment.” Fiscal consolidation relied on revenue measures of Ir£ 66.5 (p. 65), with tax hikes of Ir£ 51.5 million (0.29 percent of GDP), mainly due to higher indirect tax rates, and the remainder due to tax buoyancy. Ireland 1985 Fiscal consolidation totaled 0.12 percent of GDP based on tax hikes. Fiscal consolidation was motivated by medium-term deficit reduction, but the slower pace of consolidation observed since 1984 continued, as the 1985 IMF Recent Economic Developments explains (p. 48): “Fiscal policy for 1985 was set against the background of increasing concern about the impact of continuing deflation on unemployment and the long-term vitality of the economy. With the publication of the National Plan, the Government formally abandoned its earlier objective of eliminating the current budget deficit by 1987. The Government now aims at reducing the current budget deficit from 7 percent of GNP in 1984 to 5 percent of GNP in 1987.” Savings were achieved based on revenue measures worth Ir£ 82 million (p. 64), with tax hikes of Ir£ 24 million (0.12 percent of GDP) and the remainder due to tax buoyancy. Ireland 1986 Fiscal consolidation totaled 0.74 percent of GDP based on tax hikes. Fiscal consolidation was motivated by the need to reduce the budget deficit, as the 1986 IMF Recent Economic Developments explains (p. 24): “The 1986 budget aimed to cut back the current budget deficit and the EBR, as percentages of GNP, but not to the extent implied in the National Plan as that was considered too deflationary; the current budget deficit was to be reduced to 7.4 percent of GNP.” Tax hikes generated savings estimated at Ir£ 154.1 million (1986 IMF Recent Economic Developments, p. 37), or 0.74 percent of GDP, with increases in the rates of indirect taxes such as VAT and excises accounting for most of the savings.53 Ireland 1987 Fiscal consolidation totaled 1.65 percent of GDP, with spending cuts of 1.12 percent of GDP and tax hikes of 0.53 percent of GDP. Fiscal consolidation was motivated by a deficit reduction, as the 1990 IMF Recent Economic Developments explains (p. 21): “since 1987 a very high priority has been assigned to strengthening public finances. The shift was first manifest in the 1987 budget, introduced shortly after a new Government came into office early in that year.” The medium-term budgetary objective, announced as part of the October
53 There was also a decline in capital spending, although, as the OECD Economic Surveys 1987/1988 explains (p. 19), this “did not reflect the cancellation of planned investment projects.”
48
1987 “Programme for National Recovery,” was to reduce the Exchequer Borrowing Requirement to 5-7 percent of GNP by 1990 (p. 21). The need to reduce the budget deficit and government spending was perceived as urgent, as the 1987 IMF Staff Report reports (p. 6): “Officials stressed that the urgency of the budgetary situation and the belief that the tax burden was already at a high level have made it necessary to consider reductions on a broad range of expenditure categories, including health, education, social welfare, public employment, and the public capital program.” In line with these intentions, the 1987 Budget introduced non-interest spending cuts estimated at Ir£ 253 million (OECD Economic Surveys 1987/1988, pp. 22), or 1.12 percent of GDP. The spending cuts fell primarily on a freeze in public-sector wages and strict limits on hiring (p. 21). In addition, the Budget introduced tax measures with a budgetary impact of Ir£ 117 million (p. 22), or 0.53 percent of GDP. The tax measures included reductions in tax relief on mortgage, hospital charges, and the increase of excise duties (p. 21). Therefore, fiscal consolidation totaled 1.65 percent of GDP (1.12+0.53). Ireland 1988 Fiscal consolidation totaled 1.95 percent of GDP based on spending cuts. Fiscal consolidation was motivated by deficit reduction as in 1987, as the 1990 IMF Recent Economic Developments (p. 21) explains: “The 1988 budget aimed at consolidating the progress made in the previous year, when the EBR was reduced by 3 percentage points to nearly 10.0 percent of GNP... The budgeted target for the EBR was 7.8 percent of GNP, a decline of over 2 percentage points.” The fiscal consolidation measures fell on the spending side, with cuts amounting to Ir£ 471 million (1.95 percent of GDP), of which Ir£ 203 million corresponded to cuts in capital spending, as reported by the OECD Economic Surveys 1988/1989 (pp. 17-18). Owing in part to rapid increase in output growth, the 1988 budget deficit outturn was substantially lower than expected, with EBR falling to 3.3 percent of GNP (1990 IMF Recent Economic Developments, p. 21).54 Ireland 2009 Fiscal consolidation totaled 4.74 percent of GDP, with spending measures of 2.39 percent of GDP and tax hikes of 2.35 percent of GDP. Fiscal consolidation was motivated by the need to reduce the budget deficit, as the April 2009 Budget Statement of the Minister for Finance made clear (p. 4): “The problem is our expenditure base is too high and our revenue base is too low. If we fail, refuse or neglect to address this structural problem we will condemn our generation and the next to the folly of excessive borrowing. Already, the share of tax revenues that go to service the national debt has risen from 5% in 2007 to more than 11% this year. As we accumulate more and more public debt, this figure increases. This is dead money that should be used to improve vital public services.” The government also committed to reducing the budget deficit to within the limits of the EU Stability and Growth Pact over the medium term, as the December 2009 Ireland Stability Program submitted by the authorities to the European Commission on 9 December 2009 explains (p.32): “The Irish authorities have made commitments aimed at reducing the general government deficit below
54 Note on 1989. The 1989 Budget introduced a number of tax cuts and spending increases (1990 IMF Recent Economic Developments, pp. 22-24).

49
3 percent of GDP by 2014.” More than half of the fiscal consolidation was based on spending cuts, which were introduced in three rounds. First, spending cuts were introduced in July 2008 with an estimated budgetary impact of € 440 million in 2008 and € 1 billion in 2009 (October 2008 Ireland Stability Program, p. D5).55 The change in saving in 2009 due to these cuts was thus € 560 billion (1000–440), or 0.35 percent of GDP. Second, spending cuts in February 2009 focused on reducing the public-sector wage bill generated additional savings of € 1.8 billion (1.13 percent of GDP) in 2009 (p. 36). Third, the 2009 Supplementary Budget of April 2009 introduced further spending cuts of € 1.46 billion (0.92 percent of GDP), of which €576 fell on capital spending (p. 36). Spending measures thus had an impact of 2.39 percent of GDP in 2009 (0.35+1.13+0.92). On the revenue side, the 2009 Budget of October 2008 introduced tax hikes with a budgetary impact of € 1.95 billion (1.22 percent of GDP) in 2009 (p. 36), a substantial element of which was the introduction of an income levy. In addition, the 2009 Supplementary Budget of April 2009 introduced further tax hikes worth € 1.8 billion in 2009 (p. 36), or 1.13 percent of GDP, with the main measures being an increase in the income levy and changes to social security and health levy arrangements. Tax hikes in 2009 thus amounted to 2.35 percent of GDP (1.22+1.13), and fiscal consolidation totaled 4.74 percent of GDP (2.39+2.35).
J. Italy56
Italy 1991 Fiscal consolidation amounted to 2.77 percent of GDP, with tax hikes worth 1.69 percent of GDP and spending cuts of 1.08 percent of GDP. Fiscal consolidation was motivated by government debt reduction, as the Bank of Italy Annual Report 1990 (p. 69) explains: “In May 1990 the Economic and Financial Planning Document for 1991-93 confirmed the objective of beginning to reduce the ratio of public debt to GDP by 1993.” In September 1990, a deficit reduction target and accompanying fiscal measures for 1991 were fixed in the 1991 Finance Law (p. 69). Additional fiscal consolidation measures were introduced during the course of 1991, and, for 1991 as a whole, “budgetary measures increased tax and social security receipts by 25 trillion lire, [and] reduced expenditure by 16 trillion” (Bank of Italy Annual Report 1991, p. 74).57 Therefore, fiscal consolidation amounted to Lit 41 trillion (2.77 percent of GDP), with 1.69 percent of GDP in tax hikes and 1.08 percent of GDP in spending cuts. However, as reported in the 1992 IMF Recent Economic Developments (p. 21), a number of the tax measures introduced in 1991––Lit 19.4
55 Note on 2008. The spending cuts of € 440 million introduced in July 2008 were offset by the cost of a number of expansionary initiatives included in the initial 2008 Budget, including income tax cuts which took effect from 1 January 2008 (2008 Budget, Section I Taxation Measures, p. 2).
56 The sources consulted for Italy are various issues of the Banca d’Italia Assemblea Generale Ordinaria Dei Partecipanti, Bank of Italy Annual Report, IMF Recent Economic Development, IMF Staff Report, Italy Stability Program, and OECD Economic Surveys.
57 There were also financial accounting transactions amounting to about Lit 4 trillion (p. 69), including sales of government assets, which reduced the central government borrowing requirement. However, for the purposes of our analysis, such operations do not represent tax hikes or spending cuts.

50
trillion––were of a one-off nature, including “the shortening of the delays on the payment of VAT (Lit 5.8 trillion) and customs duties (Lit 2.1 trillion), the prepayment of some direct taxes (acconti on IRPEF, IRPEG, and ILOR for Lit 5.5 trillion), the moving forward to 1991 of the ten-year INVIM (Lit 5 trillion), the slowing down in the reimbursement of VAT (Lit 1 trillion).” The expiration of these one-off measures is recorded as having a budgetary impact of –Lit 19.4 trillion in the following year (see entry for 1992 below). Italy 1992 Fiscal consolidation totaled 3.50 percent of GDP, with spending cuts of 1.90 percent of GDP and tax hikes of 1.60 percent of GDP. Fiscal consolidation was motivated by deficit reduction and the objective of reducing the government debt-to-GDP ratio as the Bank of Italy Annual Report 1991 (p. 76) explains, “In May 1991 the Economic and Financial Planning Document for 1992-94 confirmed the objective of beginning to reduce the ratio of public debt to GDP by 1993.” Two rounds of deficit-driven fiscal consolidation occurred in 1992: the initial 1992 Budget and the July Emergency Budget (1994 OECD Economic Surveys, Table 7, p. 39). The 1992 Budget introduced tax hikes of Lit 21.5 trillion (1.4 percent of GDP), and primary spending cuts worth Lit 20.8 trillion (1.38 percent of GDP) (1992 OECD Economic Surveys, Table 14, p. 44). The July Emergency Budget, introduced by a new government included tax increases worth Lit 21.8 trillion (1.45 percent of GDP) and spending cuts worth Lit 8.2 trillion (0.54 percent of GDP) (1994 OECD Economic Surveys, Table 7, p. 39). However, the expiration of the one-off tax measures introduced in 1991 reduced the amount of effective fiscal consolidation in 1992 by Lit 19.4 trillion (see entry for 1991 above). In sum, tax hikes amounted to Lit 23.9 trillion (21.5+21.8–19.4), or 1.60 percent of GDP, while spending cuts amounted to Lit 29 trillion (1.90 percent of GDP). Therefore, total fiscal consolidation measures in 1992 amounted to Lit 52.9 trillion (21.5+20.8+21.8+8.2–19.4), or 3.50 percent of GDP.
Italy 1993 Fiscal consolidation totaled 4.49 percent of GDP, with spending cuts of 2.49 percent of GDP and tax hikes of 2.00 percent of GDP. Following the lira’s exit from the Exchange Rate Mechanism in September 1992, the authorities announced a new three-year deficit-reduction plan and, as the 1994 OECD Economic Surveys (p. 44) explains, “Through a Delegation Law, the Government has obtained from Parliament special powers to cut primary spending.” The Delegation Law provided “a framework for breaking with the past practice of using one-off measures as a main vehicle of deficit reduction” (p. 44). The first round of spending cuts in 1993 totaled Lit 31 trillion (2.09 percent of GDP), resulting from structural cuts to current spending in four major areas: pension payments, health services, local authority finance, and public employment (pp. 45-46). On the tax side, the first round of measures was estimated to yield Lit 42.5 trillion (2.80 percent of GDP), and consisted of “structural” measures, including a revision of personal income tax brackets, and a new municipal tax on buildings (p. 46). In May, the Government announced a second round of measures worth Lit 12.4 trillion (0.80 percent of GDP), evenly split between revenue measures (primarily indirect taxes) and spending (transfer) cuts (p. 47). Therefore, fiscal consolidation in 1993 totaled 5.69 percent of GDP (2.09+2.80+0.80) of which about two-fifths (2.49 percent of GDP) was on the spending side. However, given the expiration in 1993 of one-off tax measures introduced in previous years worth 1.20 percent of GDP (Banca d’Italia Assemblea Generale Ordinaria Dei Partecipanti 1993, p. 145), the net consolidation
51
in 1993 was 4.49 percent of GDP (5.69–1.20). Overall, spending cuts amounted to 2.49 percent of GDP and revenue measures amounted to 2.00 percent of GDP (2.80+0.40–1.20).
Italy 1994 Fiscal consolidation totaled 1.43 percent of GDP, with spending cuts of 1.70 percent of GDP partly offset by tax reductions of 0.27 percent of GDP. Fiscal consolidation was motivated by the government’s multi-year deficit-reduction program. As the 1994 OECD Economic Surveys notes, the adjustment in 1994 was “much smaller than for 1993” (p. 50). The spending measures totaled Lit 26.3 trillion (1.70 percent of GDP), and consisted primarily of lower transfers, though some public investment cuts also occurred (1995 OECD Economic Surveys, pp. 37-38). Revenue measures totaled Lit 5 trillion (0.30 percent of GDP), and were based primarily on reduced tax expenditure and higher indirect taxes (p. 39). However, as the 1996 OECD Economic Surveys reports, “some large reductions in yields were recorded, as one-off tax receipts (amnesties and a compulsory re-evaluation of firm assets) expired” (p. 40). The Bank of Italy explains that these one-off measures had been introduced in previous years, and estimates the impact of their expiration on 1994 tax revenue at Lit 9 trillion, or 0.57 percent of GDP (Banca d’Italia, Assemblea Generale Ordinaria Dei Partecipanti 1994, p. 151). Therefore, the net budgetary impact of tax measures in 1994 was –0.27 percent of GDP, and total fiscal consolidation amounted to 1.43 percent of GDP.
Italy 1995 Fiscal consolidation totaled 4.20 percent of GDP, with spending cuts of 1.79 percent of GDP and tax hikes of 2.41 percent of GDP. Fiscal consolidation was motivated by the objective of meeting the Maastricht criterion of a deficit of less than 3 percent of GDP by 1998 (1995 IMF Staff Report, p. 1). Two rounds of fiscal consolidation measures occurred in 1995. As reported in the 1996 OECD Economic Surveys (p. 43), the first round of measures totaled 2.93 percent of GDP and consisted of “spending cuts of Lit 24.1 trillion and tax increases of Lit 23.9 trillion” (p. 43), or 1.47 percent of GDP and 1.46 percent of GDP, respectively. Spending measures included cuts to health expenditure, smaller transfers to local authorities, lower pension transfers, and control of the government wage bill, while the tax measures were of a one-off nature and included amnesties for building violations and the removal of tax deductions (p. 44). The new Dini government initiated a second round of fiscal consolidation in February 1995 with tax hikes of Lit 15.6 trillion (0.95 percent of GDP) and non-interest spending cuts of Lit 5.2 trillion, or 0.32 percent of GDP (p. 44). As the 1995 IMF Recent Economic Developments (p. 40) explains, “the bulk of the revenue measures were one-off” in nature, with the one-off share estimated at Lit 11.5 trillion, or 0.70 percent of GDP (p. 40). Therefore, fiscal consolidation in 1995 totaled 4.20 percent of GDP with spending cuts of 1.79 percent of GDP (1.47+0.32) and tax hikes of 2.41 percent of GDP (1.46+0.95). The one-off tax measures in 1995 amounted to 2.16 percent of GDP (1.46 from the first round of measures and 0.70 from the second round) and had a budgetary impact of –2.16 percent of GDP in 1996 (see entry for 1996 below).
Italy 1996 Fiscal consolidation totaled 0.34 percent of GDP, with spending cuts of 1.08 percent of GDP partly offset by tax reductions of 0.74 percent of GDP. As in previous years, fiscal consolidation was motivated by reducing the deficit to meet the Maastricht criteria by 1998.

52
Fiscal consolidation occurred in two rounds. As the Bank of Italy Annual Report 1995 explains (p. 77), the first round of measures were part of the 1996 Budget approved in December 1995 and consisted of spending cuts of Lit 10 trillion (0.52 percent of GDP) and tax measures of Lit 22.5 trillion (1.16 percent of GDP), of which some Lit 8 trillion (0.41 percent of GDP) were of a one-off nature. The expiration of these one-off measures had a budgetary impact of –0.41 percent of GDP in the following year (see entry for 1997 below). In June, a new Government announced additional fiscal consolidation measures worth Lit 16 trillion, primarily on the spending side (1997 OECD Economic Surveys, p. 60). Spending cuts consisted of cuts in transportation, education, defense and health care of Lit 11 trillion (0.57 percent of GDP), while revenue measures of Lit 5 trillion (0.26 percent of GDP) included higher excise duties and levies on lotteries and unleaded gasoline (p. 60). Also, the expiration in 1996 of the 1995 one-off revenue measures worth 2.16 percent of GDP (see entry for 1995) had a budgetary impact of –2.16 percent of GDP. Therefore, the budgetary impact of tax measures in 1996 amounted to –0.74 percent of GDP (1.16+0.26–2.16). Spending cuts totaled 1.08 percent of GDP (0.52+0.57, rounding) and total fiscal consolidation amounted to 0.34 percent of GDP (1.08–0.74).
Italy 1997 Fiscal consolidation totaled 1.82 percent of GDP, with spending cuts of 0.93 percent of GDP and tax hikes of 0.89 percent of GDP. Fiscal consolidation in 1997 was again motivated by the need to reduce the deficit to meet the Maastricht criteria, as the 1997 IMF Staff Report reports (pp. 4-5): “The conduct of macroeconomic policies in 1997 was guided by one clear beacon: ensuring Italy’s presence among the founding members of EMU… Accordingly, the fiscal retrenchment measures incorporated in the 1997 budget were almost doubled from their originally envisaged size” (1997 IMF Staff Report, pp. 4-5). Spending cuts amounted to Lit 18.2 trillion (0.93 percent of GDP) and were “spread out across an unusually wide range of current expenditure items,” (1997 OECD Economic Surveys, p. 63).58 Tax hikes in 1997 amounted to Lit 25.6 trillion, or 1.30 percent of GDP, of which 0.60 percentage points of GDP corresponded to the one-year “Europa tax” (1997 OECD Economic Surveys, pp. 63-65). The expiration of the one-year Europa had a budgetary impact of –0.60 percent of GDP in 1998 (see entry for 1998 below). Also, the expiration in 1997 of temporary tax measures introduced in 1996 (see entry for 1996 above) had a budgetary impact of –0.41 percent of GDP in 1997. Therefore, the budgetary impact of tax measures in 1997 was 0.89 percent of GDP (1.30–0.41) and fiscal consolidation amounted to 1.82 percent of GDP (spending cuts of 0.93 and tax hikes of 0.89). Italy 1998 Fiscal consolidation totaled 0.68 percent of GDP, with spending cuts of 0.67 percent and tax hikes of 0.01 percent of GDP. Fiscal consolidation in 1998 was motivated by deficit reduction as in 1997. The government’s deficit reduction plan targeted a deficit-to-GDP ratio
58 Additional financial adjustments––“reclassification of amortization payment” and “reclassification of interest payment on postal savings from an accrual to a cash basis” (1997 OECD Economic Surveys, p. 65)––implied a reduction in the overall fiscal deficit in 1997, but, for the purposes of our analysis, these adjustments are not recorded as tax hikes or spending cuts in our database.

53
of 1 percent of GDP by 2001 (1998/1999 OECD Economic Surveys, p. 53). The measures consisted of spending cuts worth Lit 13 trillion (0.67 percent of GDP) and tax increases worth Lit 12 trillion, or 0.61 percent of GDP (1999 OECD Economic Surveys, p. 52). Spending cuts concentrated on social programs, transfers to regions, local administrations and public services (p. 52). Tax measures included higher VAT rates, reduced tax and contribution evasion, and higher direct tax rates (p. 52). However, given the expiration in 1998 of the one-year Europa tax of 0.60 percent of GDP (see entry for 1997 above), tax hikes in 1998 amounted to only 0.01 percent of GDP (0.61–0.60). Fiscal consolidation thus totaled 0.68 percent of GDP (0.67+0.01).
Italy 2004 Fiscal consolidation totaled 1.30 percent of GDP, with spending cuts of 0.63 percent of GDP and tax hikes of 0.67 percent of GDP. Fiscal consolidation in 2004 was motivated by reducing the fiscal deficit to below the 3 percent of GDP limit of the Stability and Growth Pact. The government “aimed at improving public finance balances in order to maintain the deficit below the limit of 3 percent” (Italy Stability Program Update November 2004, p. 7). The 2004 Budget, published in 2003, introduced measures amounting to “16 billion Euros (about 0.70 percent of GDP) of which 9 billion (about 0.40 percent of GDP) are in higher revenues and 7 billion (about 0.30 percent of GDP) in lower expenditure” (Italy Stability Program Update November 2003, p. 23). In July 2004, additional measures equal to €7.6 (0.60 percent of GDP) were introduced, of which 0.33 percentage points comprised reductions in expenditure (2004 Bank of Italy Annual Report, p. 119). Therefore, spending cuts in 2004 amounted to 0.63 percent of GDP (0.30+0.33), tax hikes amounted to 0.67 percent of GDP (0.40+0.27), and fiscal consolidation totaled 1.30 percent of GDP (0.63+0.67). Italy 2005 Fiscal consolidation totaled 1.00 percent of GDP, with spending cuts of 0.60 percent of GDP and tax hikes of 0.40 percent of GDP. Fiscal consolidation in 2005 was motivated by the need to “keep the deficit within the limit established by the European budgetary rules” (2005 Bank of Italy Annual Report, p. 102). To achieve the deficit objective, spending cuts of €8.7 billion (0.60 percent of GDP) and tax hikes of €5.2 billion (0.40 percent of GDP) occurred, as the 2005 Bank of Italy Annual Report explains (p. 101).59 Fiscal consolidation thus amounted to 1.00 percent of GDP (0.60+0.40). Italy 2006 Fiscal consolidation amounted to 1.39 percent of GDP with spending cuts of 0.89 percent of GDP, and tax hikes of 0.50 percent of GDP. Fiscal consolidation was motivated by reducing the budgetary deficit to the limits set in the EU budgetary rules, as the 2006 Bank of Italy Annual Report explains (p. 88): “In July 2005 the EU Council established that an excessive deficit existed in Italy and called for the Government to reduce it below the
59 In addition, financial operations, such as the sales of buildings, reduced the budget deficit by an additional 0.60 percent of GDP (p. 101). However, we do not consider these operations as tax hikes or spending cuts for the purpose of the analysis.
54
3 per cent limit by 2007, with a significant adjustment already in 2006.” Fiscal consolidation measures motivated by deficit reduction amounted to €27.9 billion with tax measures of €11 billion and spending cuts of €17 billion (2006 Bank of Italy Annual Report, p. 88, and Italy Stability Program December 2005, p. 28). However, these consolidation measures were partly offset by tax cuts of €3.7 billion motivated by reducing labor costs and enhancing long-run growth (Italy Stability Program December 2005, p. 28). There were also spending increases of €3.9 billion motivated by social priorities of a non-cyclical nature, such as “supporting the income of families rearing children” (p. 31). Therefore, for the purposes of our analysis, fiscal consolidation amounted to €20.4 billion (1.39 percent of GDP), with spending cuts of €13.1 billion (17–3.9), or 0.89 percent of GDP, and tax hikes of €7.3 billion (11–3.7), or 0.50 percent of GDP. Italy 2007 Fiscal consolidation amounted to 1.03 percent of GDP, with tax hikes of 1.32 percent of GDP partly offset by spending increases of 0.29 percent of GDP. Fiscal consolidation was motivated by deficit reduction and the need “to bring the public finance trends – notably current expenditure – back on a balanced and sustainable path” (Italy Stability Program December 2006, p. 24). Fiscal consolidation measures motivated by deficit reduction amounted to €34.7 billion with spending cuts of €9.6 billion and tax policy measures of €25.1 billion (p. 25). However, as in 2006, tax cuts motivated by reducing labor costs and raising long-run productivity growth amounted to €5.5 (p. 27), and spending increases motivated by enhancing public infrastructure (railways) and “improving social fairness” (p. 28) amounted to €14.0 billion. Therefore, for the purposes of our analysis, fiscal consolidation amounted to €24 billion (1.03 percent of GDP), with spending increases of €4.4 billion (14.0–9.6), or 0.29 percent of GDP more than offset by tax hikes of €19.6 billion (25.1–5.5), or 1.32 percent of GDP.
K. Japan60
Japan 1979 Fiscal consolidation in 1979 amounted to 0.115 due to tax hikes. Fiscal consolidation in 1979 was motivated by the need to reduce the budget deficit and put public finances on a sustainable footing, as the 1980 IMF Recent Economic Developments (p. 34) reports: “By late 1978 when the initial budget for FY 1979/80 was prepared,… the authorities feared that the fiscal situation was approaching a critical stage as both the budget deficit and debt service payments were rising to historically high levels… Accordingly, the authorities were determined that the FY 1979/80 policy would initiate the restoration of fiscal discipline.” In June 1979, tax hikes were introduced, mainly on gasoline and aviation fuel, as described in
60 The fiscal year is April-March. Therefore, a tax hike worth ¥1 billion in 1997/98 is allocated as follows: ¥ (3/4) billion in 1997 and ¥(1/4) billion in 1998. However, during FY 1979/80 and in the 1980s, “the revenue period for each fiscal year extends for 12 months beginning June 1” (1981 IMF Recent Economic Developments, p. 41). Therefore, in these years, a tax hike worth ¥1 billion in 1979/80 is allocated as follows: ¥ (7/12) billion in 1979 and ¥(5/12) billion in 1980. The sources consulted for Japan are various issues of the Budget, IMF Recent Economic Development, IMF Staff Report, the Ministry of Finance report “Understanding the Japanese Budget,” and OECD Economic Surveys.
55
the 1980 IMF Recent Economic Developments (p. 37). Their budgetary impact was ¥ 434 billion in FY1979/1980 and ¥ 627 billion in FY1980/1981 (p. 37). The change in saving due to the tax hikes is thus ¥ 434 billion in FY 1979/80 and ¥ 193 billion (627–434) in FY 1980/81. The allocation of the tax hikes across calendar years in billions of yen is as follows: 253 in 1979 (7/12 × 434), 293 in 1980 (5/12 × 434 + 7/12 × 193) and 80 in 1981 (5/12 × 193) In percent of GDP, the allocation of the tax hikes across calendar years is: 0.115 in 1979, 0.123 in 1980, and 0.031 in 1981. Fiscal consolidation in 1979 thus amounted to 0.115 percent of GDP, all on the tax side. Japan 1980 Fiscal consolidation in 1980 amounted to 0.213 based on tax hikes. Fiscal consolidation in 1980 was motivated by deficit reduction, as the “History of Japan’s Public Finance” document accompanying the FY 2004 Budget explains (p.1): “Faced with the serious fiscal condition, Japan had, since the FY1980 budget, maintained the goal of reducing and eliminating the issuance of special deficit-financing bonds as soon as possible.” Similarly, the OECD Economic Surveys 1981-1982 (p. 32) reports that “a re-orientation of fiscal policy was decided upon as from the FY 1980 budget. Given the fear that the large public sector debt may in the future ‘crowd out’ private investment and undermine the flexibility of fiscal policy, a commitment was made to gradually reduce the budget deficit over the medium term. This consideration was reinforced by the prospect of rapidly increasing social welfare expenditure associated with the aging of the population over the coming years. As a concrete intermediate objective it was announced during the preparation of the FY 1981 budget that the authorities were aiming at eliminating the issuing of deficit-covering bonds by FY 1984.” As reported in the 1981 IMF Recent Economic Developments (p. 45), new tax hikes were introduced in June 1980 worth ¥ 351 billion in FY 1980/1981. The taxes were mainly direct in nature. The allocation of these tax measures across calendar years is as follows: ¥ 205 in 1980 (7/12 × 351) (0.09 percent of GDP) and ¥ 146 billion in 1981 (0.06 percent of GDP). In addition, the FY 1979/80 Budget introduced tax hikes of 0.123 percent of GDP in 1980 (see entry for 1979 above). Therefore, total fiscal consolidation in 1980 amounted to 0.213 percent of GDP (0.09+0.123). Japan 1981 Fiscal consolidation totaled 0.434 percent of GDP based on tax hikes. Fiscal consolidation continued in 1981, motivated by deficit reduction, as the 1981 IMF Recent Economic Developments reports (p. 41): “The major objective of the budget for 1981/82 was to move decisively toward restoring ‘fiscal discipline’ and to eliminate the issuance of deficit-financing bonds by 1984/85.” The June 1981 Budget introduced tax hikes, as the 1982 IMF Recent Economic Developments reports: “The 1981/82 budget included the most substantial tax increase in over two decades… The new tax proposals were estimated to provide ¥ 1.4 trillion” (p. 42). The new tax hikes were mainly direct in nature, including a 2 percentage point increase in the corporation tax rate (p. 42). The allocation of these tax hikes across calendar years is as follows: ¥ 0.82 trillion in 1981 (7/12 × 1.4) (0.342 percent of GDP), and ¥ 0.58 trillion in 1982 (0.227 percent of GDP). Also, tax hikes due to the FY 1979/80 and FY 1980/81 Budgets amounted to 0.091 percent of GDP in 1981 (see entries for 1979 and 1980 above). Therefore, tax hikes in 1981 totaled 0.434 percent of GDP (0.091+0.342, rounding).

56
Japan 1982 Fiscal consolidation totaled 0.71 percent of GDP, with spending cuts of 0.40 percent of GDP and tax measures of 0.31 percent of GDP. Fiscal consolidation in 1982 continued to be guided by the deficit-reduction objective of the government (1982 IMF Recent Economic Developments, p. 60). Tax hikes in 1982 due to measures introduced in the FY 1981/82 Budget amounted to 0.227 percent of GDP (see entry for 1981 above). Additional tax hikes introduced in June 1982 amounted to ¥ 0.35 trillion (1983 IMF Recent Economic Developments, p. 63) for FY 1982/1983. The distribution of these additional tax measures across calendar years was as follows: ¥ 0.20 trillion in 1982 (7/12 × 0.35) (0.085 percent of GDP), and 0.15 trillion in 1983 (0.057 percent of GDP). Therefore, tax hikes in 1982 totaled 0.312 percent of GDP (0.227 + 0.085). On the spending side, for FY 1982/1983, “¥ 0.4 trillion was cut in personnel and administrative costs” (p. 63). The distribution of this spending cut across calendar years was: ¥ 0.23 trillion in 1982 (7/12 × 0.4) (0.098 percent of GDP), and ¥ 0.17 trillion in 1983 (0.065 percent of GDP). In addition, “[p]ublic works appropriations were kept unchanged in nominal terms” (1981/1982 OECD Economic Surveys, p. 36) implying a cut of about 0.30 percent of GNP.61 Therefore, overall, spending cuts amounted to 0.39 percent of about GDP in 1982 (0.098+0.30). Total consolidation amounted to 0.71 percent of GDP (0.312+0.398).
Japan 1983 Fiscal consolidation totaled 0.422 percent of GDP, with spending cuts of 0.365 percent of GDP, and tax hikes of 0.057 percent of GDP. On the spending side, cuts in personnel and administrative costs amounted to ¥ 0.167 trillion in 1983 (see entry for 1982 above) (0.065 percent of GDP). In addition, “the value of public works remains frozen at the level envisaged in the FY 1981 budget,” (1982/1983 OECD Economic Surveys, p. 30), implying a cut of about 0.30 percent of GNP in 1983.62 Therefore, spending cuts in 1983 totaled 0.365 percent of GDP. On the revenue side, tax hikes in 1983 amounted to 0.15 trillion (0.057 percent of GNP) due to the FY 1982/83 Budget (see entry for 1982 above). Therefore, fiscal consolidation in 1983 amounted to 0.422 percent of GDP (0.365+0.057).
Japan 1997 Fiscal consolidation totaled 1.425 percent of GDP, with spending cuts of 0.45 percent of GDP and tax hikes of 0.975 percent of GDP. Fiscal consolidation in 1997 was part of a medium-term strategy of motivated by deficit reduction, as the 1997 IMF Staff Report (p. 22) noted: “The authorities believed that these measures represented an essential first step in the process of restoring fiscal health, and noted the widespread public and political support for
61 In 1981, government investment was Y 15,655 billion, and it was almost unchanged––Y 15,687 billion––in 1982 (1984/1985 OECD Economic Surveys, p. 111). As a share of GNP, government investment declined by 0.30 percentage points: it was 6.20 percent of GNP in 1981 and 5.90 percent of GNP in 1982 (based on GNP estimates reported in the 1984/1985 OECD Economic Surveys, p. 105).
62 In 1982, government investment was Y 15,687 billion, and it declined to Y 15,457 billion in 1983 (1984/1985 OECD Economic Surveys, p. 111). As a share of GNP, government investment declined by 0.30 percentage points: it was 5.90 percent of GNP in 1982 and 5.60 percent of GNP in 1983 (based on GNP estimates reported in the 1984/1985 OECD Economic Surveys, p. 105).
57
consolidation.” Similarly, as the Ministry of Finance Japan (2004, p.1) explains: “the Japanese fiscal conditions had become worse than any other major countries. With the prospect of Japan becoming an aged society in the near future, there was a growing awareness of the need for fiscal structural reform.” The multi-year nature of the fiscal consolidation was emphasized in the Fiscal Structural Reform Act passed in November 1997, which set the goal of lowering the general government deficit (excluding social security) to 3 percent of GDP and of eliminating the issuance of deficit financing bonds by FY2003, with interim limits on certain categories of discretionary government spending and on deficit bond financing (1998 IMF Staff Report, p. 13). The budgetary impact of the fiscal consolidation measures was estimated by the 1997 IMF Staff Report (p. 22) as follows. Tax hikes––including an increase in the consumption tax rate from 3 to 5 percent––of 1.30 percent of GDP in FY 1997, and government investment cuts of 0.60 percent of GDP in FY 1997. Thus, total fiscal consolidation amounted to 1.90 percent of GDP in FY 1997, with the allocation across calendar years in percent of GDP as follows: tax hikes of 0.975 percent of GDP in 1997 and 0.325 percent of GDP in 1998; spending cuts of 0.45 percent of GDP in 1997 and 0.15 percent of GDP in 1998. Total fiscal consolidation thus amounted to 1.425 percent of GDP in 1997 (0.975+0.45) and 0.475 percent of GDP in 1998 (0.325+0.15). Japan 1998 Fiscal consolidation in 1998 amounted to 0.475 percent of GDP with tax hikes of 0.325 percent of GDP and spending cuts of 0.15 percent of GDP. Tax hikes and spending cuts introduced in FY 1997 had a budgetary impact in calendar year 1998 of 0.325 percent of GDP and 0.15 percent of GDP, respectively (see entry for 1997 above). Japan 200363 Fiscal consolidation totaled 0.48 percent of GDP based on spending cuts. In January 2002, the authorities announced a new multi-year fiscal consolidation plan, as discussed in the 2003 OECD Economic Survey (p. 15): “The government announced a Reform and Perspectives FY 2002 Revision that targets a primary budget surplus by the early 2010s, while keeping general government expenditures at the FY 2002 level of 38 per cent of GDP. Such a surplus is necessary to stabilize public debt, though at a higher level of around 180 per cent of GDP.” The 2003 Budget reaffirmed the need for fiscal consolidation motivated by deficit reduction (“Measures for Fiscal Consolidation,” p.1)64: “The government set out measures for fiscal consolidation in the vision document called ‘Reform and Perspectives’... Over the four years to FY2006, the goal for the size of government (ratio of general government expenditure to GDP) will be to hold it at or below its present (FY2002) level. Considering that the population of Japan will begin to shrink about 2007, and that between 2010 and 2015 the baby boom generation-which has been the core of the labor
63 Notes on 1999-2002. Fiscal consolidation was suspended in late 1998 and did not resume until 2003. As the FY 2004 Budget explains (“History of Japan’s Public Finance,” p. 1): “in December 1998, Government decided to suspend the effect of the Fiscal Structural Reform Act, in the light of doing its best to recover from the weak economy.”
64 The 2003 Budget “Measures for Fiscal Consolidation” document is available on the Ministry of Finance website: http://www.mof.go.jp/english/budget/brief/2003/2003-15.htm#V-5.

58
force-will move into retirement and become pension beneficiaries, it is desirable that the primary balance will be in surplus in the early 2010s.” In the context of this multi-year deficit-reduction strategy, fiscal consolidation in 2003 focused on reductions in public investment. As the 2005 OECD Economic Surveys notes (p. 82), “Fiscal policy in FY 2003 was unique in that spending was not significantly increased by a supplementary budget… the supplementary budget for FY 2003 added only 0.2 trillion yen of central government outlays, resulting in a 2.1 per cent decline in total expenditures compared to the outcome for FY 2002. Avoiding a supplementary budget also limited spending by local governments, particularly in public investment, contributing to a double-digit decline in public investment in real terms in FY 2003 on a general government basis.” Consequently, total public investment in 2003 is estimated to have been cut by 0.48 percent of GDP (2004 IMF Staff Report, Tables 1 and 3, pp. 30 and 32).65
Japan 2004 Fiscal consolidation totaled 0.638 percent of GDP, with a spending cut of 0.45 percent of GDP and tax hikes worth 0.1875 percent of GDP. Fiscal consolidation continued in 2004 in the context of the existing multi-year program (see entry for 2003 above). On the tax side, the 2005 OECD Economic Surveys reports (p. 83) that, “On the revenue side, major changes include: i) a hike in the pension premium for employees; ii) the partial abolition of the special income tax deduction for spouses; and iii) the end of the elderly income tax deduction and the scaling back of deductions on public pension benefits. The total impact on revenue – 1.2 trillion yen (¼ per cent of GDP) – is rather small.” The allocation of these measures across calendar years was a tax hike of 0.1875 percent of GDP in 2004 and 0.0625 percent of GDP in 2005. On the spending side, the 2005 IMF Staff Report reports a public investment cut of 0.45 percent of GDP.66 Therefore, fiscal consolidation in 2004 amounted to 0.6375 (0.1875+0.45).
Japan 2005 Fiscal consolidation totaled 0.2825 percent of GDP, with spending cuts of 0.22 percent of GDP and tax hikes of 0.0625 percent of GDP. In 2005, fiscal consolidation was motivated by the existing multi-year deficit-reduction program. On the revenue side, tax hikes introduce in FY 2004 had a budgetary impact of 0.0625 percent of GDP in 2005 (see entry for 2004 above). On the spending side, public investment was reduced by about
65 Table 1 shows a cut in real terms of about 10.5 percent in 2003. Based on the 2002 government capital investment/GDP ratio of 4.6 percent (Table 3), this cut corresponds to 0.48 percent of GDP (10.5 percent × 4.6 percent). 66 Table 1 shows a cut in real terms of about 10.8 percent in 2004. Based on the 2003 government capital investment/GDP ratio of 4.2 percent (Table 4), this cut corresponds about 0.5 percent of GDP (10.8 percent ×4.2 percent). The 2004 pension reform was estimated to deliver savings over the medium term, with little or no savings in the short term (2004-05). The 2004 IMF Staff Report (p. 16), suggests that the primary deficit of the pension system (“After 2004 reform”) remains close the pre-reform level (“Prior to 2004 reform”) during 2004-2005.

59
0.22 percent of GDP (2006 IMF Staff Report, pp. 35 and 36).67 At the same time, while there was “a sharp decline in government employment beginning in 2004,” this was partly offset by an increase in public-sector wages in 2005 (2008 OECD Economic Surveys, p. 79), with negligible overall savings. Therefore, fiscal consolidation in 2005 amounted to 0.2825 percent of GDP (0.22+0.0625)
Japan 2006 Fiscal consolidation totaled 0.72 percent of GDP, with spending cuts of 0.27 percent of GDP and tax hikes of 0.45 percent of GDP. Fiscal consolidation in 2006 occurred in the context of a multi-year program motivated by deficit reduction. The 2006 Budget highlighted the burden of government debt with an intuitive example (p. 7 of “Current Japanese Fiscal Conditions and Issues to be Considered”): “If the debt outstanding were stacked in 10,000 yen bills, the height would be 5,420km, which is 1,400 times higher than Mt. Fuji (3,776m) and 600 times higher than Mt. Everest (8,848m)!” It also explained that “In terms of the ratio of the general government fiscal deficit to GDP, Japan’s fiscal conditions are the worst among developed countries as a result of the increase in social security related expenditures accompanying the rapid aging of society and tax cuts aimed at an economic recovery” (p. 8). The medium-term strategy for addressing these issues was described as follows (p. 16): “The government is promoting fiscal structural reforms on both the expenditures and revenues sides and aims to achieve a surplus in the primary balance of the central and local government combined in the early 2010s.” On the revenue side, the OECD Economic Surveys 2006 (p. 83) reports that “The phasing out of the fixed-rate cut in 2006-07 is expected to expand the revenue from personal income and local inhabitant taxes by 3.2 trillion yen (0.6% of GDP).” The calendar-year allocation of the tax hike is as follows: 0.45 percent of GDP in 2006 (¾ × 0.6) and 0.15 percent of GDP in 2007. On the spending side, the 2007 IMF Staff Report indicates a cut in public investment of about 0.27 percent of GDP.68 Therefore, fiscal consolidation in 2006 amounted to 0.72 percent of GDP (0.45+0.27).
Japan 2007 Fiscal consolidation totaled 0.15 percent of GDP based on tax hikes. In late 2006, the government announced a new framework for FY2006-FY 2011 with the medium-term target of a primary surplus by the mid 2010s, motivated by deficit reduction (see entry for 2006). The tax hikes introduced in FY 2006 had a budgetary impact in 2007 of 0.15 percent of GDP (see entry for 2006 above).69
67 Table 1 shows a cut in real terms of 5.9 percent in 2005. Based on the 2004 government capital investment/GDP ratio of 3.7 percent (Table 2), this cut corresponds to 0.22 percent of GDP (5.9 percent × 3.7 percent).
68 Table 1 shows a cut in real terms of 7.4 percent in 2005. Based on the 2005 government capital investment/GDP ratio of 3.7 percent (Table 2), this cut corresponds about 0.27 percent of GDP (7.4 percent × 3.7 percent). 69 Note on 2008-09. Following the onset of the global financial crisis, measures of the medium-term strategy were not fully implemented.
60
L. Netherlands70
Netherlands 1981 Fiscal consolidation totaled 1.75 percent of GDP, with tax hikes of 0.53 percent of GDP and spending cuts of 1.22 percent of GDP. Fiscal consolidation was motivated by deficit reduction––in the preface to the 1981 Budget Memorandum (p. 3), the Minister of Finance explained that the Government was “according high priority to the task of curbing the financing deficit. Compiling the 1981 budget has been an onerous task, and the sacrifices that society is being asked to make are no less so.” The Budget Memorandum also emphasized the problem of the large existing budget deficit (p. 67): “The Government has announced on several occasions that it considers that the actual financing deficit exceeds the structurally acceptable deficit by too large an amount and for too protracted a period.” Accordingly, the 1981 Budget introduced spending cuts of f3.6 billion (0.96 percent of GDP), with f2 billion corresponding to cuts in salaries and social transfers (1980 IMF Recent Economic Developments, p. 36). On the tax side, the Budget raised the VAT rate and raised income tax scales, yielding additional savings of f0.5 billion (p. 37), or 0.13 percent of GDP. In March 1981, additional deficit-reduction measures were taken, with spending cuts of f1 billion (0.27 percent of GDP), and tax increases of 1.5 billion (0.40 percent of GDP), as reported in the 1983 IMF Recent Economic Developments. Therefore, fiscal consolidation in 1981 amounted to 1.75 percent of GDP, with spending cuts of 1.22 percent of GDP (0.96+0.27, rounding) and tax hikes of 0.53 percent of GDP (0.13+0.40).71
Netherlands 1982 Fiscal consolidation totaled 1.71 percent of GDP based on spending cuts. Fiscal consolidation was motivated by deficit reduction, as the Minister of Finance explained in the preface to the 1982 Budget Memorandum (p. 3 and p.7): “There is a general recognition of the need to take a number of measures including reducing the government’s budget deficit and stabilizing the burden of social charges… The need to make a substantial structural reduction in the financing deficit is based on various factors. First, it will help to contain the pressure on interest rates on the money and capital markets which thus makes it a prerequisite for restoring willingness to invest. Second, it is important in budgetary terms in order to apply a break to interest charges which are rising very sharply.” Accordingly, the 1982 Budget introduced spending cuts of f4.5 billion (1.15 percent of GDP), as reported in the 1982 Budget Memorandum (p. 37). In addition, in the Spring Memorandum of June 1982, the Government introduced further spending cuts worth f2.2 billion (0.56 percent of GDP), as reported in the 1983 IMF Recent Economic Developments (p. 33). Total fiscal consolidation thus amounted to 1.71 percent of GDP (1.15+0.56) based on spending cuts.
70 The sources consulted for Netherlands are various issues of the Budget Memorandum, IMF Recent Economic Development, IMF Staff Report, Netherlands Stability Program Update, OECD Economic Surveys, and the Spring Memorandum.
71 There was also a spending increase in response to the weakness in domestic demand (1983 IMF Recent Economic Developments, p. 32). However, since this spending increase was motivated by a response to cyclical weakness, we do not subtract its cost from the budgetary impact of the fiscal consolidation measures.
61
Netherlands 1983 Fiscal consolidation totaled 3.24 percent of GDP, with spending cuts of 2.75 percent of GDP and tax hikes of 0.49 percent of GDP. Fiscal consolidation was motivated by deficit reduction, as the preface to the 1983 Budget Memorandum makes clear (p. 3): “In compiling the 1983 Budget the Government has had to take a large number of far-reaching decisions in order to contain the almost explosive growth of the financing deficit. The measures proposed for 1983 will be felt by many as extremely painful.” The 1983 Budget introduced a package of deficit-reducing measures of f13.2 billion, of which spending cuts amounted to f10 billion and tax hikes amounted to f3.2 billion, as reported in the 1983 IMF Recent Economic Developments (pp. 34-35). However, a new Government subsequently decided not to implement all of the tax hikes, replacing f1.2 billion of them with additional spending cuts (p. 35). Therefore, spending cuts amounted to f11.2 billion (10+1.2), or 2.75 percent of GDP, tax cuts amounted to f2 billion (3.2–1.2), or 0.49 percent of GDP, and fiscal consolidation totaled 3.24 percent of GDP (2.75+0.49). A major component of the spending cuts was a freeze on public-sector salaries and social security benefits (p. 34), while the tax hikes fell on both higher social security contributions and indirect taxes (p. 35).
Netherlands 1984 Fiscal consolidation totaled 1.76 percent of GDP based on spending cuts. As in previous years, fiscal consolidation was motivated by deficit reduction, as the 1985 IMF Recent Economic Developments reports (p. 30): “The aim of the 1984 budget was to reinforce the effort toward budgetary discipline.” Spending cuts amounted to f7,475 million (1.76 percent of GDP), with the bulk falling on social benefits and civil servants’ wages (1984 IMF Recent Economic Developments, p. 30). On the tax side, there was a cut in corporate profit taxes and social security contributions, with the budgetary impact offset by higher direct and indirect taxes (p. 29).
Netherlands 1985 Fiscal consolidation totaled 1.24 percent of GDP based on spending cuts. Fiscal consolidation was motivated by deficit reduction, as the 1985 IMF Recent Economic Developments explains (p. 31): “the 1985 budget, presented in September 1984, reflected the Government’s intention to stay the course with regard to the reduction of the deficit and the size of the public sector.” The 1985 Budget Memorandum emphasized the need to reduce the budget deficit (p. 5): “Perseverance is necessary as both the financing deficit and the burden of social charges remain much too high.” The 1985 Budget introduced spending cuts of f9.3 billion (1985 IMF Recent Economic Developments, p. 34), although some of the cuts were later discarded or delayed (1986 IMF Recent Economic Developments, p. 33). In particular, the cuts discarded or delayed amounted to f3.8 billion (p. 33), with f1.1 billion of cuts to public health spending delayed to 1986 (see entry below). Therefore, spending cuts in 1985 amounted to f5.5 billion (9.3–3.8, rounding), or 1.24 percent of GDP.
Netherlands 1986 Fiscal consolidation totaled 1.74 percent of GDP based on spending cuts. Fiscal consolidation was motivated by deficit reduction, as in previous years, as the foreword to the 1986 Budget Memorandum explains (p. 7): “The policy of restoring discipline to public finances, which led to a turning point in 1984, has been continued in 1985 and will again be pursued in 1986.” Policy-induced spending cuts amounted to f8 billion (1.74 percent of
62
GDP), as reported in the 1986 IMF Recent Economic Developments (p. 34), with more than half of the cuts affecting the public-sector wage bill and social benefits. The social benefit cuts were mainly due to the nonindexation of social security benefits and child allowances, and a reduction in the sickness insurance benefit rate to 70 percent of the last earned income. Netherlands 1987 Fiscal consolidation totaled 1.48 percent of GDP based on tax measures. Fiscal consolidation was motivated by deficit reduction, as the 1988 IMF Recent Economic Developments explains (p. 25): “Following elections in May 1986, the coalition partners of the Dutch Government agreed on a medium-term plan for the period 1987-90, setting specific targets or ceilings for the central government deficit relative to NNI. They also proposed to implement a package of measures over the next four years.” The 1987 Budget proposed spending cuts in 1987 of f5.4 billion and tax hikes of f5.4 billion (1988 IMF Recent Economic Developments p. 26). However, the spending cuts were fully offset by expenditure overruns later in the year, which included “sizably higher expenditures on wages by the Ministry of Education and Sciences, higher housing and WIR subsidies, and EEC transfers” (p. 27). The tax hikes were implemented by “raising VAT tax rates and excises on oil products as well as by eliminating tax reductions for stocks and reducing tax reductions for capital assets” (p. 27). In addition to the tax hikes, improvements in tax administration were estimated to have a one-time budgetary impact of f1.4 billion in 1987 (p. 27), and, due to their one-time nature, –f1.4 billion in 1988 (see below). Fiscal consolidation thus amounted to f6.8 billion in revenue measures (5.4+1.4), or 1.48 percent of GDP. Netherlands 1988 Fiscal consolidation totaled 0.06 percent of GDP, with spending cuts of 0.75 percent of GDP and tax reductions of 0.69 percent of GDP. Fiscal consolidation was motivated by the medium-term deficit reduction plan contained in the 1987 Coalition Agreement (see above). The agreement put in place spending cuts worth f3 billion in 1988, and the 1988 Budget added additional spending cuts of f4 billion, bringing the total cuts for 1988 to f7 billion (1988 IMF Recent Economic Developments, p. 28). The spending cuts fell on the ministries of education and science, housing, and physical planning and the environment (p. 29). However, as in 1988, the spending cuts were partly offset by spending overruns during the year worth f3.4 billion, as the 1989 IMF Recent Economic Developments reports (p. 28), notably on the investment subsidy scheme (WIR). Therefore, the net cut in spending amounted to f3.6 billion (7–3.4), or 0.75 percent of GDP. On the revenue side, the authorities reduced income tax rates based on long-run considerations (1988 Budget Memorandum, pp. 10-11), with a 1988 budgetary impact of f1.9 billion (1988 IMF Recent Economic Developments, p. 28). Because of the long-term motivation, we subtract the budgetary cost of the tax cuts from the size of fiscal consolidation. Also, the impact of the one-off tax measures of 1987 had a budgetary impact of –f1.4 in 1988 (see above), bringing the total budgetary impact of tax measures in 1988 to –f3.3 billion (–1.9–1.4), or –0.69 percent of GDP. Therefore, fiscal consolidation amounted to f0.3 billion (3.6–3.3), or 0.06 percent of GDP,
63
with 0.75 percent of GDP in spending cuts partly offset by tax measures of 0.69 percent of GDP.72 Netherlands 1991 Fiscal consolidation totaled 0.87 percent of GDP based on tax measures. Fiscal consolidation was motivated by the medium-term deficit-reduction objectives of the Coalition Accord of 1989, which targeted a budget deficit of 3.25 percent of GDP in 1994, as the 1991/1992 OECD Economic Surveys reports (p. 41). Measures in 1991 consisted of an advancement of tax payments with a one-time budgetary impact of 1.1 percent of net national income (NNI), or 0.87 percent of GDP, as reported in the 1993 IMF Recent Economic Developments (p. 8). The one-time nature of this tax measure implied a budgetary impact of –0.87 percent of GDP in the following year (see entry for 1992 below).
Netherlands 1992 Fiscal consolidation amounted to 0.74 percent of GDP, with spending cuts of 1.32 percent of GDP partly offset by a tax reduction of 0.58 percent of GDP. Fiscal consolidation continued to be motivated by the deficit-reduction objective of the 1989 Coalition Accord (see above) and by seeking to comply with the 1991 Maastricht Treaty criteria, as explained in the Dutch convergence program accepted by the Economic and Financial Affairs Council of the European Union (EcoFin) in July 1991. The 1991 Mid-term Review introduced spending cuts with a budgetary impact in 1992 of f4.85 billion (0.82 percent of GDP) as reported in the OECD Economic Survey 1992/93 (p. 42). In the summer of 1992, additional spending cuts were introduced with a budgetary impact of 0.50 percent of net national income (NNI), or 0.40 percent of GDP, of which half (0.20 percent of GDP) were of a one-off nature (p. 44 and p. 88). The 1991 Mid-term Review also introduced tax measures generating savings of f1.5 billion in 1992 (p. 42). Additional tax measures had a net budgetary impact in 1992 of f0.2 billion (p. 43) and included a hike in indirect taxes. Thus, spending cuts amounted to 1.22 percent of GDP (0.82+0.40), while tax hikes amounted to f1.7 billion, or 0.29 percent of GDP. However, the expiration in 1992 of the 1991 one-time tax measure had a budgetary impact of –0.87 percent of GDP (see entry for 1991 above). Thus, fiscal consolidation amounted to 0.74 percent of GDP, with spending cuts of 1.32 percent of GDP partly offset by a net tax reduction of 0.58 percent of GDP (0.29–0.87). Netherlands 1993 Fiscal consolidation totaled 0.12 percent of GDP, with spending cuts of 0.28 percent of GDP partly offset by tax measures with a budgetary cost of 0.16 percent of GDP. Fiscal consolidation was again motivated by the deficit-reduction objectives of the 1989 Coalition Accord (see above), and by the aim of meeting the Maastricht criteria. As the 1993 IMF Recent Economic Developments reports (p. 14), “the government in its September Budget Memorandum indicated that deficit reduction efforts would be concentrated on the
72 Notes on 1989 and 1990. Policy measures were put in place in 1989 with a negative net budgetary impact in 1989 and 1990, including income tax cuts motivated by long-run considerations (Oort tax reform) and VAT rate reductions (1989 IMF Recent Economic Developments, p. 22, and 1990 IMF Recent Economic Developments, p. 18).

64
expenditure side.” The 1993 Budget of September 1992 introduced spending cuts of 1.00 percent of NNI, or 0.78 percent of GDP, partly offset by tax cuts of 0.50 percent of NNI, or 0.39 percent of GDP (p. 14). Over the following months, three additional fiscal packages were introduced, with total savings of 0.80 percent of GDP, as reported in the OECD Economic Surveys 1993/94 (p. 38). The savings were due to sales of government property of 0.50 percent of GDP and spending cuts of 0.30 percent of GDP (p. 38). As discussed above, sales of government property are not recorded as a tax hike or spending cut in our database. Additional tax measures introduced in 1992 and 1993 had a net cumulative budgetary impact of f2.8 billion in 1993 of which most––f2.6 billion (0.43 percent of GDP)––occurred in 1993 (OECD Economic Survey 1992/93, p. 43). The tax hikes affected both indirect and direct tax rates. Finally, the one-off spending measures introduced in the summer of 1992 (see entry for 1992 above) had a negative budgetary impact in 1993 of –0.20 percent of GDP. Therefore, fiscal consolidation amounted to 0.12 percent of GDP, with spending cuts of 0.28 percent of GDP (0.78+0.30–0.20) and tax measures with a budgetary impact of –0.16 percent of GDP (–0.39+0.43–0.20).73
Netherlands 2004 Fiscal consolidation totaled 1.70 percent of GDP, with spending cuts of 1.30 percent of GDP and tax hikes of 0.40 percent of GDP. Fiscal consolidation was motivated by deficit reduction and the need to comply with the Maastricht budget deficit ceiling, as the 2004 IMF Staff Report explains (p. 8): “The authorities have taken a series of measures to comply with the 3 percent Maastricht ceiling in the current year.” Fiscal consolidation came in four rounds of packages introduced during 2004, as discussed in the 2004 IMF Staff Report (p. 9). The first three rounds of fiscal consolidation, including the “Strategic Accord,” the “Global Agreement,” and the supplementary measures in the 2004 Budget amounted to 1.3 percent of GDP, with spending cuts of 1.0 percent of GDP and tax hikes of 0.3 percent of GDP (Netherlands Stability Program Update of February 2004, p. 11). Additional measures introduced in the 2004 Spring Budget Memorandum amounted to 0.40 percent of GDP, with 0.30 percent of GDP in spending cuts and 0.10 percent of GDP in tax hikes (Netherlands Stability Program Update of November 2004, p. 14). Thus fiscal consolidation amounted to
73 Notes on 1994-98. In 1994, with slower growth, policy-induced fiscal consolidation was put on hold, as the 1995 IMF Staff Report explains (p. 6): “In view of the economic downturn, the 1994 budget prepared in mid-1993 did not aim at further fiscal consolidation and, in addition, in early 1994 the government announced reductions in taxes and social security premiums equivalent to nearly 1 percentage point of GDP (on an annual basis).” A key fiscal consolidation measure that had been planned––a freeze in government wages––was not implemented, as the 1994 IMF Staff Report explains (p. 4). In addition, there was a boost in public investment, as the OECD Economic Surveys 1993/94 reports (p. 41). The 1995 and 1996 budgets introduced spending cuts, but these were more than offset by tax cuts motivated by long-term considerations, such as shrinking the “collective burden” of taxes and social security premiums, as reported in the OECD Economic Surveys 1995/96 (p. 117) and 1995 IMF Staff Report (p. 1). Additional deficit-reducing measures such as asset sales were implemented, but we do not record these as tax hikes or spending cuts in the database. In addition, supported by faster-than-expected growth, the general government budget deficit declined from 3.7 percent of GDP in 1995 to 2.3 percent of GDP in 1996, well below the Maastricht 3 percent limit. The 1997 IMF Staff Report reports (p. 18) that “In May 1997, the Netherlands was removed from the EU list of countries with ‘excessive deficits’ for the purposes of the Maastricht Treaty.” In 1998, fiscal policy was “expansionary, notwithstanding the relatively advanced stage of the economic cycle” (1998 IMF Staff Report, p. 9).

65
1.70 percent of GDP, with 1.30 percent of GDP in spending cuts (1.0+0.30) and tax hikes of 0.40 percent of GDP (0.30+0.10).
Netherlands 2005 Fiscal consolidation totaled 0.50 percent of GDP, with 0.30 percent of GDP of spending cuts and 0.20 percent of GDP in tax measures. Fiscal consolidation was motivated by reducing the budget deficit to below 3 percent of GDP, as the Netherlands Stability Program of January 2005 explains (p. 3): “The primary aim of the update’s budgetary strategy is to bring the general government deficit below the Treaty reference value of 3% of GDP by 2005.” The 2005 Budget introduced net spending cuts of 0.30 percent of GDP and net tax increases of 0.20 percent of GDP, as the Netherlands Stability Program of January 2005 explains (p. 12). Spending cuts fell on the civil servant wage bill, public health insurance, and subsidies on employing low-paid workers, and involved reducing access to unemployment benefits. Tax hikes included raising the two lowest income tax brackets, higher disability premiums, increases in the premiums for public health insurance, and ending credits for buying personal computers for home use.
M. Portugal74
Portugal 1983 Fiscal consolidation totaled 2.30 percent of GDP, with spending cuts of 0.95 percent of GDP and tax hikes of 1.35 percent of GDP. Fiscal consolidation was motivated by deficit reduction, as the 1983 IMF Staff Report explains (p. 5): “The 1983 budget was shaped by the objective of achieving a substantial reduction in the deficit of the General Government in relation to GDP.” The 1985/1986 OECD Economic Surveys reports that the policy easing following the 1979 oil shock “made it necessary in 1983 to revert to a more restrictive stance, in the context of an economic program again drawn up with IMF support” (p. 19). The 1983/1984 OECD Economic Surveys reports cuts to current spending on a number of items worth 11.7 billion escudos (about 0.63 percent of GDP) (p. 42) in addition to cuts in expenditure on goods and services worth another 6 billion escudos (0.32 percent of GDP). Spending cuts thus totaled 0.95 percent of GDP (0.63+0.32). There were also tax hikes––both direct and indirect––totaling 25 billion escudos (1983/1984 OECD Economic Surveys, p. 44), or 1.35 percent of GDP. Thus, total fiscal consolidation in 1983 amounted to 2.3 percent of GDP (0.63+0.32+1.35).
Portugal 2000 Fiscal consolidation totaled 0.50 percent of GDP based on spending cuts. Fiscal consolidation was motivated by meeting the government’s budget deficit target and was based on an intra-year budget freeze (2001 OECD Economic Surveys, p. 45). The freeze had a budgetary impact estimated at 0.50 per cent of GDP (2001 OECD Economic Surveys, p. 51) and included: “A freeze on 15 per cent of expenditures earmarked for the acquisition of
74 The sources consulted for Portugal are various issues of the Banco de Portugal Annual Report, IMF Recent Economic Development, IMF Staff Report, OECD Economic Surveys, Portugal Stability Program Update, Portuguese Republic Stability and Growth Programme, and Update of the Convergence Programme of Portugal.
66
goods and services, including capital goods. A freeze on 10 percent of current transfers to the non-State parts of the general government. A reserve clause covering 8 per cent of expenditures budgeted for public investment, including military procurement. Restrictions on the hiring of civil servants.”
Portugal 2002 Fiscal consolidation totaled 1.60 percent of GDP, with spending cuts of 0.40 percent of GDP and tax measures of 1.20 percent of GDP. Fiscal consolidation was motivated by deficit reduction, as the 2002 IMF Staff Report explains (p. 14): “the newly elected government implemented sizable measures aimed at reducing the fiscal deficit to 2.8 percent of GDP. The ministry underscored that reducing the deficit to below the SGP’s 3 percent of GDP ceiling was critical for restoring policy credibility.” The June Supplementary Budget introduced deficit-reduction measures with an estimated budgetary impact of 0.60 percent of GDP, as reported by the European Commission’s 2002 Update of the Convergence Program of Portugal (2003-2006) An Assessment (p. 3). In addition, one-off measures introduced in late 2002 had a budgetary impact of 1.50 percent of GDP (Banco de Portugal Annual Report 2002, p. 97). Thus, total deficit-reduction measures amounted to 2.10 percent of GDP (0.60+1.50). However, of this total amount, 0.50 percent of GDP reflected financial transactions (asset sales) not considered as tax or spending measures in our database (p. 97). Thus total fiscal consolidation amounted to 1.60 percent of GDP (0.60+1.50–0.50). On the tax side, there was a one-off tax measure (tax amnesty) with an estimated budgetary impact of 0.90 percent of GDP in 2002 (p. 102). In addition, the standard VAT rate was raised by 2 percentage points from 17 to 19 percent, which yielded about 0.30 percent of GDP in additional VAT tax revenue (p. 87). Tax measures thus yielded a total of 1.20 percent of GDP (0.90+0.30), with the remainder of fiscal consolidation (0.40 percent of GDP) due to spending cuts. Portugal 2003 The end of a one-off tax amnesty had a budgetary impact of –0.75 percent of GDP in 2003. The 2002 one-time tax amnesty yielded tax revenue of 0.15 percent of GDP in 2003 after yielding 0.90 percent of GDP in 2002 (see above), as explained in the Banco de Portugal Annual Report 2004 (p. 102). The change in saving due to the 2002 tax measure in 2003 was thus –0.75 percent of GDP (0.15–0.90). In addition, deficit-reduction measures consisting of one-off financial transactions, such as asset sales and the transfer of pension funds to the general government, occurred in 2003 and amounted to 2.3 percent of GDP (2003 IMF Staff Report, p. 12). However, we do not enter such financial transactions as tax hikes and spending cuts in our database. Net of these financial transactions, fiscal consolidation was limited. In particular, while some wage bill reduction occurred, the net budgetary impact in 2003 was limited: “Public employment was estimated to have declined during 2003, mostly due to regular and early retirement. Given the relatively generous retirement benefits for most of these civil servants, their retirement initially entails no budgetary savings” (2003 IMF Staff Report, p. 12). Portugal 2005 Fiscal consolidation totaled 0.60 percent of GDP with tax hikes of 0.52 percent of GDP and spending cuts of 0.08 percent of GDP. Fiscal consolidation in 2005 was motivated by deficit reduction, as the 2005 IMF Staff Report explains (p. 13): “the authorities had
67
announced a series of measures, mostly on the revenue side, that are intended to reduce the deficit to 6.0 percent of GDP this year.” Tax measures had a budgetary impact of €810 million (0.52 percent of GDP), as reported in the Portuguese Republic Stability and Growth Program 2005-2009 Table 2.4.1 “Direct Impact of the Main Consolidation Measures” (p. 30), with most of the savings coming from a VAT rate hike. There were also spending cuts of €125 million (0.08 percent of GDP), mostly from restructuring of public administration, human resources and public services (p. 30). Portugal 2006 Fiscal consolidation totaled 1.65 percent of GDP, with tax measures of 1.10 percent of GDP and spending cuts of 0.55 percent of GDP. Fiscal consolidation was motivated by deficit reduction, as the Portuguese Republic Stability and Growth Program 2005-2009 explains (p. 1): “The Government views the sustainability of public finances as a pre-requisite for sustained economic growth, which, in turn, is an essential factor in the pursuit of economic development and social cohesion policies. In this vein, budgetary consolidation is, in a particularly focused manner in 2006, at the centre of the immediate objectives of budgetary policy.” Fiscal consolidation measures for the entire multiyear adjustment period were reported in the Portuguese Republic Stability and Growth Program 2005-2009 (p. 30). For 2006, tax measures, including the full-year impact of the 2005 VAT hike, and higher taxes on oil products, tobacco and higher social security contributions were estimated to generate cumulative savings since 2005 of €2,405 million, while the change in saving in 2006 relative to 2005 was €1,595 million (2,405–810), or 1.10 percent of GDP, as reported in Table 2.4.1 “Direct Impact of the Main Consolidation Measures” (p. 30). On the spending side, the cuts initiated in 2005 generated cumulative savings of €915 million in 2006, implying a change in saving relative to 2005 of €790 million (915–125), or 0.55 percent of GDP (p. 30). The cuts fell on public administration and social security benefits, and on curbing social security and health co-payment expenditure (p. 30). Total fiscal consolidation thus amounted to 1.65 percent of GDP (1.10+0.55). Portugal 2007 Fiscal consolidation totaled 1.40 percent of GDP, with tax measures of 0.50 percent of GDP and spending cuts of 0.90 percent of GDP. Fiscal consolidation was motivated by the authorities’ multiyear deficit reduction strategy (see entry for 2006 above). Tax measures (in particular, more efficient tax administration) had an additional budgetary impact of 0.50 in 2007, as reported in the OECD Economic Surveys 2008/9 (p. 46). Spending cuts (restructuring the public administration and curbing social spending) had a budgetary impact of 0.90 percent of GDP (p. 46).
68
N. Spain75
Spain 1983 Fiscal consolidation totaled 1.90 percent of GDP based on tax hikes. Fiscal consolidation was motivated by deficit reduction, as the 1984 IMF Recent Economic Developments explains (p. 35): “The new Government, which came to power in December 1982, recognized that the fiscal imbalance itself constituted a basic impediment to the resumption of sustainable growth. Therefore, the Government aimed to constrain the budget deficit in 1983 to the same level in relation to GDP as in 1982 and to reduce it in following years until it declined to a level equivalent to 3½ percent by 1987. The stabilization of the general government deficit in 1983 was to be achieved mostly through an increase in the tax ratio resulting from an upward adjustment in the rates of indirect taxes and in the schedule of withholdings for personal income tax.” The budgetary impact of hikes to indirect tax rates was estimated at 1.00 percent of GDP, while the impact of higher direct tax hikes (“increase in the schedule of withholdings for personal income tax, a reduction of exemptions, and some success in reducing income tax evasion”) was estimated at 0.90 percent of GDP (p. 35).
Spain 1984 Fiscal consolidation totaled 1.12 percent of GDP, with spending cuts of 0.75 percent of GDP and tax measures of 0.37 percent of GDP. Fiscal consolidation was motivated by deficit reduction, as the 1985 IMF Recent Economic Developments explains (p. 37): “One of the central aims of the Spanish economic policy for 1984 was to continue the process of fiscal adjustment initiated in 1983 and to achieve a considerable contraction in the overall deficit and in the financing needs of the General Government.” The authorities introduced a package of measures in June 1984 intended to restrain the budget deficit, as the 1984 IMF Recent Economic Developments reports (pp. 44-45): “To correct this deteriorating trend the Government approved a package of measures in June 1984 worth about Ptas 300 billion and which they hope will assure the attainment of the original deficit target.” Spending cuts amounted to Ptas 200 billion (0.75 percent of GDP) and tax hikes amounted to Ptas 100 billion (0.37 percent of GDP) based on both direct and indirect tax measures (p. 45).
Spain 1989 Fiscal consolidation totaled 1.22 percent of GDP, with tax measures of 0.98 percent of GDP and spending measures of 0.24 percent of GDP. Fiscal consolidation was motivated by deficit reduction, as the 1989 IMF Recent Economic Developments reports (p. 22): “Consistent with a medium-term strategy to eliminate the overall deficit of the general government by 1992, the 1989 Budget calls for a strengthening in the finances of the state and the Social Security System that would compensate for a slight deterioration in the financial position of the Regional Governments.” Deficit-reduction measures introduced by the 1989 Budget consisted of an increase in VAT and excise rates, worth 0.20 percent of GDP, and an increase in direct (income and property) tax measures worth 0.50 percent of GDP (p. 28). In addition, the authorities announced in mid-May an additional deficit-
75 The sources consulted for Spain are various issues of the IMF Recent Economic Development, IMF Staff Report, and OECD Economic Surveys.

69
reduction package worth Ptas 250 billion (p. 28), or 0.52 percent of GDP. Spending measures amounted to Ptas 115 (0.24 percent of GDP), of which Ptas 75 corresponded to a temporary measure––postponement of spending from 1989 to 1990 (p. 28). This temporary spending cut had a budgetary impact of Ptas –75 when it ended in 1990 (see entry for 1990 below). Tax measures in the mid-May package amounted to Ptas 135 (0.28 percent of GDP) based on a temporary bringing forward of corporate taxes to 1989 (p. 28). This temporary tax hike had a budgetary impact of Ptas –135 when it expired in 1990. Overall, fiscal consolidation in 1989 amounted to 1.22 percent of GDP, with tax measures of 0.98 percent of GDP (0.20+0.50+0.28) and spending measures of 0.24 percent of GDP. Spain 1990 The end of a temporary fiscal consolidation measure introduced in 1989 had a budgetary impact of –0.40 percent of GDP, with –0.25 percent of GDP on the tax side and –0.15 percent of GDP on the spending side. On the tax side, the budgetary impact was Ptas –135 billion (0.25 percent of GDP), while on the spending side, the budgetary impact was Ptas –75 billion (0.15 percent of GDP), as described above (see entry for 1989). Spain 1992 Fiscal consolidation totaled 0.70 percent of GDP, with spending cuts of 0.40 percent of GDP and tax hikes of 0.30 percent of GDP. Fiscal consolidation was motivated by deficit reduction and achieving the Maastricht budget deficit criteria for accession to EMU, as the OECD Economic Surveys 1992/1993 explain (p. 30): “In March 1992 the government presented a Convergence Programme for 1992-96, in order to prepare Spain’s full participation in the next phases of European integration and meet the strict Maastricht criteria.” Fiscal consolidation actions introduced in the 1992 Budget included a hike in VAT and excise duties and social security contributions, with an estimated budgetary impact of 0.60 percent of GDP (p. 43). These savings were, however, fully offset by cuts in personal income taxes as part of the tax reform announced in mid-1991. Spending cuts were put in place in April, including cuts in unemployment insurance coverage and discontinuing certain employment promotion programs, with estimated budgetary savings of 0.30 percent of GDP (p. 43). Finally, in July, additional tax hikes were introduced with a budgetary impact of 0.30 percent of GDP (p. 43), consisting of personal income tax rate increases for all but the lowest income categories and further hikes in VAT rates and excise duties (p. 37), as well as cuts in government-provided sick leave and invalidity benefits generating an additional 0.10 percent of GDP in savings. Overall, fiscal consolidation amounted to 0.70 percent of GDP, with spending cuts of 0.40 percent of GDP (0.30+0.10) and tax hikes of 0.30 percent of GDP.
Spain 1993 Fiscal consolidation totaled 1.10 percent of GDP, with tax hikes of 0.80 percent of GDP and spending cuts of 0.30 percent of GDP. Fiscal consolidation was again motivated by deficit reduction and achieving the Maastricht criteria, as the OECD Economic Surveys 1993 reports (p. 41): “Reiterating its commitment to pursue budget consolidation, the Government presented a restrictive budget for 1993.” The 1993 Budget introduced personal tax measures and hikes in social security contributions with an estimated budgetary impact of 0.30 percent of GDP (p. 43). In addition, the budgetary impact of the tax measures (both direct and

70
indirect) and spending cuts taken in April and July 1992 (see entry for 1992 above) had an additional budgetary impact in 1993 of 0.80 and 0.30 percent of GDP, respectively (p. 43).76
Spain 1994 Fiscal consolidation totaled 1.60 percent of GDP based on spending cuts. Fiscal consolidation was motivated by deficit reduction based on a revised multi-year Convergence Plan released in July which called for a progressive reduction of the deficit to attain the 3 percent Maastricht target by 1997 (1996 IMF Recent Economic Developments, p. 9). The adjustment in 1994 consisted exclusively of spending cuts (p. 11), which amounted to 1.60 percent of GDP (p. 12). “Public investment was slashed” (p. 12) and accounted for 1.40 percentage points of the adjustment. Spain 1995 Fiscal consolidation totaled 0.74 percent of GDP based on spending cuts. Fiscal consolidation was motivated by deficit reduction based on the 1994 Convergence Plan (see above). Fiscal consolidation consisted of spending cuts, with an across-the-board cut in discretionary spending introduced in January worth Ptas 150 billion (OECD Economic Surveys 1995/1996, p. 139), or 0.20 percent of GDP. An additional, Ptas 400 billion (0.54 percent of GDP) of spending on infrastructure investment and military spending was also frozen (p. 139).77
Spain 1996 Fiscal consolidation totaled 1.30 percent of GDP, with spending cuts of 1.10 percent of GDP and tax hikes of 0.20 percent of GDP. Fiscal consolidation was motivated by reducing the deficit to meet the Maastricht criteria based on the Convergence Plan (see above). As the OECD Economic Surveys 1995/1996 explains (p. 31), “the Government’s announced first priority remains the achievement of the convergence programme targets.” The adjustment focused on spending cuts, which amounted to 1.1 percent of GDP, as reported in the 1997/1998 OECD Economic Surveys (p. 47). There was also a hike in excise taxes on tobacco and alcohol with a budgetary impact of 0.20 percent of GDP (p. 156).
Spain 1997 Fiscal consolidation totaled 1.20 percent of GDP, with spending cuts of 1.10 percent of GDP and tax measures of 0.10 percent of GDP. Fiscal consolidation was motivated by reducing the budget deficit to the 3 percent of GDP deficit limit in 1997 to ensure early EMU participation. The 1997 Budget was seen as “the final step to Maastricht” and “[t]he Government viewed 1997 as a historic opportunity for Spanish economic policy” (OECD
76 Fiscal stimulus also was introduced later in 1993 in response to the unexpected downturn in economic activity (1994 IMF Staff Report, p. 4). However, for reasons explained above, the budgetary impact of this countercyclical policy response is not subtracted from the size of fiscal consolidation in our dataset.
77 Spending to alleviate the effects of the drought was introduced in May, consisting of emergency infrastructure investment and tax exemptions for farmers (OECD Economic Surveys 1995/1996, p. 140). However, for reasons discussed above, this additional spending in response to economic developments is not subtracted from the size of fiscal consolidation.

71
Economic Surveys 1998, p. 48). Fiscal consolidation was based mainly on “sharp cuts in spending” (1997 IMF Recent Economic Developments, p. 10). The 1997 Budget introduced a wage freeze in the public sector and hiring restrictions to reduce public employment with an estimated budgetary impact of 0.50 percent of GDP (p. 10). Cuts in purchases of supplies, government travel, maintenance and office rental payments yielded additional estimated savings of 0.20 percent of GDP, while cuts in public investment yielded savings of 0.10 percent of GDP (p. 10). Cuts in unemployment benefits and pensions and health care benefits were estimated to yield 0.30 percent of GDP in savings (p. 10). On the revenue side, a new tax was introduced on insurance policies with an expected budgetary impact of 0.10 percent of GDP (p. 10). Therefore, total fiscal consolidation amounted to 1.20 percent of GDP, with spending measures of 1.10 percent of GDP (0.50+0.20+0.10+0.30) and tax measures of 0.10 percent of GDP.78
O. Sweden79
Sweden 1984 Fiscal consolidation totaled 0.90 percent of GDP, with spending cuts of 0.69 percent of GDP and tax hikes of 0.21 percent of GDP. Fiscal consolidation was motivated primarily by deficit reduction, and measures to curb the budget deficit were approved by parliament in late 1983. The goal of reducing the imbalance in the government accounts was highlighted in The Swedish Budget 1984-85 (p. 30): “As the Government pointed out in the bill on certain economic policy measures last October, one of the principal tasks for economic policy is to restore a more balanced situation in Government finance. Unless we succeed in this, other goals will not be feasible.” The package of deficit curbing measures totaled SKr 7.6 billion (0.90 percent of GDP), as reported in the OECD Economic Surveys 1984/1985 (p. 69). Tax measures were on both the direct and indirect side and amounted to SKr 18.8 billion (0.21 percent of GDP), while spending cuts amounted to SKr 5.8 billion (0.69 percent of GDP).
78 The Maastricht deficit criteria were achieved in 1997 and Spain became a founding member of the euro. In 1998, the budgetary deficit declined primarily due to favorable output growth, as the 1998 IMF Staff Report explains: “in designing the 1998 budget––which targeted a deficit of 2.4 percent of GDP––the authorities had sought to reconcile two main considerations: to meet the medium-term objectives of their convergence program, thereby demonstrating the sustainability of the progress achieved so far, and to satisfy some of the demands for higher social spending that had been postponed. The reconciliation between these objectives had been made possible by favorable cyclical conditions. Indeed, cyclical developments were expected to account for the full improvement of the budgetary position in 1998, which had allowed spending on education, health, and active labor market policies to rise.”
79 Since 1997, the fiscal year coincides with the calendar year. Prior to 1997, the fiscal year was from 1 July to 30 June of the following year. The transition took the form of an 18-month fiscal year between 1 July 1995 and 31 December 1996. Therefore, for years before 1995, measures in “FY t/t+1” are split across the two years as follows: ½ to year t and ½ to year t+1. For example, a tax hike worth SKr 1 billion in FY 1992/93 is allocated as follows: SKr ½ billion to 1992 and SKr ½ billion to 1993. The sources consulted for Sweden are various issues of The Swedish Budget, IMF Recent Economic Developments, and OECD Economic Surveys.

72
Sweden 1993 Fiscal consolidation totaled 1.81 percent of GDP, with 1.39 percent of GDP of spending cuts and 0.42 percent of GDP of tax hikes. Fiscal consolidation was motivated by the need to reduce the large budget deficit, which was “one of the main factors behind increasing international skepticism about the stability of the Swedish economy” (OECD Economic Surveys 1993/94, p. 56). In mid September 1992, the government introduced fiscal consolidation measures with a budgetary impact of SKr 7.6 billion in FY 1992/93 and an additional SKr 14.2 billion in FY 1993/94 (resulting in cumulative savings of SKr 21.8 billion), as reported in the 1993 IMF Recent Economic Developments (p. 31). Spending cuts amounted to SKr 4.2 billion in FY 1992/93 and an additional SKr 7.8 billion in FY 1993/94, while tax hikes (mainly excises on gasoline and tobacco) amounted to SKr 3.4 billion and an additional SKr 6.4 billion in FY 1992/93 and FY 1993/94, respectively (p. 31).80 The savings due to the FY 1992/93 measures are allocated to calendar year 1993 as they came into effect that year. The FY 1993/94 savings are allocated evenly across calendar years 1993 and 1994. Therefore, based on the September package, spending cuts amounted to SKr 8.1 billion in 1993 (4.2 + ½×7.8) and SKr 3.9 billion in 1994 (½×7.8), while tax hikes amounted to SKr 6.6 billion in 1993 (3.4 + ½×6.4) and SKr 3.2 billion in 1994 (½×6.4). In addition, the January 1993 draft Budget introduced further spending cuts of SKr 11.9 billion in FY 1993/94 (p. 30), all of which were accepted by parliament, and which are allocated evenly across calendar years 1993 and 1994 (SKr 6.0 billion, each). Finally, the spending cuts introduced with the January 1992 Budget had a budgetary impact of SKr 7.8 billion in 1993 (1991/1992 OECD Economic Surveys, p. 44). Therefore, in 1993, spending cuts totaled SKr 21.9 billion (8.1+6.0+7.8), or 1.39 percent of GDP, tax hikes amounted to SKr 6.6 billion (0.42 percent of GDP), and fiscal consolidation amounted to 1.81 percent of GDP (1.39+0.42). In 1994, the spending cuts had a budgetary impact of SKr 9.9 billion (3.9+6.0), while the tax hikes had a budgetary impact of SKr 3.2 billion (see below).
Sweden 1994 Fiscal consolidation amounted to 0.78 percent of GDP, with spending cuts of 0.59 percent of GDP and tax hikes of 0.19 percent of GDP. The measures introduced in September 1992 and January 1993 motivated by deficit reduction had a budgetary impact of SKr 13.1 billion, with spending measures of SKr 9.9 billion (0.59 percent of GDP) and tax measures of SKr 3.2 billion, or 0.19 percent of GDP (see entry for 1993 above).
Sweden 1995 Fiscal consolidation totaled 3.50 percent of GDP, with spending cuts of 2.10 percent of GDP and tax hikes of 1.40 percent of GDP. Fiscal consolidation was motivated by the multiyear deficit-reduction plan announced in September 1994 by a new government and published in June 1995 in the form of an European Union Convergence Program that “committed the Swedish government to eliminating the budget deficit by 1998” (1998 OECD Economic Surveys, p. 51). The multiyear program’s fiscal consolidation measures amounted
80 There was also a one-off financial transaction––withdrawing funds in the Working Life Fund––with a budgetary impact of SKr 3.0 billion in 1992/93 (OECD Economic Surveys 1993/94, p. 57). However, this financial transaction is not classified as a tax hike or spending cut in our database.
73
to 8 percent of GDP (1997 OECD Economic Surveys, p. 58) and were almost all specified from the outset. The composition of the adjustment in terms of policy actions was 60 percent on the spending side and 40 percent on the tax side (1995 OECD Economic Surveys, p. 31). The principal spending categories affected were social transfers (lower pensions, lower social security replacement rates, reduced child allowances), while the tax increases were spread across higher social security contributions, wealth tax hikes, capital income tax hikes, and other categories (1995 OECD Economic Surveys, p. 31). The magnitude of the adjustment for each year was as follows (as reported in 1997 OECD Economic Surveys, p. 58): 1995: 3.50 percent of GDP; 1996: 2.00 percent of GDP; 1997: 1.50 percent of GDP; and 1998: 1.00 percent of GDP. Finally, note that the final fiscal outcome was better than anticipated, and a “general government financial … surplus of 1.6 percent of GDP was estimated for 1998” (1998 IMF Staff Report, p. 23). Upon completion of the program, the government announced a “medium-term goal of a general government fiscal surplus of 2 percent of GDP per year over the economic cycle” (1998 IMF Staff Report, p. 23). Sweden 1996 Fiscal consolidation amounted to 2.00 percent of GDP, with spending cuts of 1.20 percent of GDP and tax hikes of 0.80 percent of GDP. See 1995 entry.
Sweden 1997 Fiscal consolidation amounted to 1.50 percent of GDP, with spending cuts of 0.90 percent of GDP and tax hikes of 0.60 percent of GDP. See 1995 entry.
Sweden 1998 Fiscal consolidation amounted to 1.00 percent of GDP, with spending cuts of 0.60 percent of GDP and tax hikes of 0.40 percent of GDP. See 1995 entry.
P. United Kingdom81
United Kingdom 1979 Fiscal consolidation totaled 0.27 percent of GDP, with spending cuts of 0.72 percent of GDP partly offset by tax cuts of 0.45 percent of GDP. Fiscal consolidation was motivated by the need to reduce the size of government and the budget deficit inherited by the administration that took office in May 1979, as the June 1979 Budget Speech explains “I have stressed the urgent need for new policies to reverse the decline of the British economy. These policies start with our conviction that it is people and not Governments who create prosperity. This Budget seeks to reduce the role of Government. Government will spend less, Government will borrow less.”82 Accordingly, the June 1979 Budget targeted a reduction in
81 Since the fiscal year (FY) runs April 1-March 31, measures in “FY t/t+1” are split across the two years as follows: ¾ to year t and ¼ to year t+1. For example, a tax hike worth ₤1 billion in 1994/95 is allocated as follows: ₤¾ billion to 1994 and ₤¼ billion to 1995. The sources consulted for the United Kingdom are various issues of the Budget, Budget Speech, Financial Statement and Budget Report (FSBR) IMF Recent Economic Development, IMF Staff Report, and OECD Economic Surveys.
82 The June 1979 Budget Speech is available at http://www.margaretthatcher.org/document/109497
74
the Public Sector Borrowing Requirement (PSBR) of £1.7 billion, as the 1979 IMF Staff Report explains (p. 8): “The Chancellor also announced a range of measures in the fiscal field which cut the PSBR for 1979/80 from an estimated £10 billion on unchanged policies to £8.3 billion (4 ½ percent of estimated GDP), and indicated that the claims of the public sector on national resources would be reduced further in future years.” On the tax side, the 1979 Budget reduced income tax rates in line with long-run supply-side considerations, with an associated revenue loss of £3.5 billion in FY 1979-80, and partly offset this with hikes in the VAT rate and excise duties amounting to £2.3 billion (1979 IMF Staff Report, p. 9). To achieve the desired reduction in the PSBR of £1.7 billion, the 1979 Budget included sales of state-owned assets of £1 billion, including a further part of the government’s shareholding in British Petroleum, and spending cuts of £1.9 billion (1.7+3.5—2.3—1) (1979 IMF Staff Report, p. 10). Thus, net of the £1 billion in asset sales, deficit-driven fiscal consolidation amounted to £0.7 billion in FY 1979-80, with tax cuts of £1.2 billion, and spending cuts of £1.9 billion. Based on our convention for allocating budgetary effects to calendar years, the budgetary impact of deficit-reduction measures in 1979 was £0.5 billion (0.27 percent of GDP), with tax cuts of £0.9 billion (0.45 percent of GDP) and spending cuts of £1.4 billion (0.72 percent of GDP). The budgetary impact of these measures in 1980 was £0.2 billion, with tax cuts of £0.3 billion and spending cuts of £0.5 (see entry for 1980 below). United Kingdom 1980 Fiscal consolidation totaled 0.08 percent of GDP, with spending cuts of 0.21 percent of GDP, and tax cuts of 0.13 percent of GDP. Fiscal consolidation was motivated by the desire to reduce the size of the government and the budget deficit (see entry for 1979 above). The budgetary impact in 1980 of measures introduced in the June 1979 Budget in 1980 was £0.2 billion (0.08 percent of GDP), with tax cuts of £0.3 billion (0.13 percent of GDP) and spending cuts of £0.5 (0.21 percent of GDP).83 United Kingdom 1981 Fiscal consolidation totaled 1.58 percent of GDP, with spending cuts of 0.16 percent of GDP and tax hikes of 1.43 percent of GDP. Fiscal consolidation was motivated by the need to reduce the budget deficit (PSBR), as the March 1981 Budget Speech makes clear84: “Some people, I know, are tempted to regard the PSBR as something mystical, of interest only to economists. How I wish that they were right. But, alas, that is not true. The size of public borrowing is, as it must be, a critically important constraint, for Governments are no different from individuals… Against that background, the House will understand my anxiety at the
83 Note that while the 1980 Budget introduced further fiscal consolidation measures for FY 1980-81, their implementation was hampered by a number of factors. The OECD Economic Surveys 1981 (p. 34) points to “The roughly stable volume of government expenditure on goods and services instead of the budgeted small decline. In particular, central government and local authority overspending resulted in government consumption in real terms rising by almost 2 percent instead of falling a little as planned; thus adding over ₤1 billion to the PSBR. Higher than forecast increase in average public sector pay… Delays in revenue collection due to civil service strikes.”
84 The March 1981 Budget Speech is available at: http://www.theyworkforyou.com/debates/?id=1981-03-10a.763.1

75
way in which borrowing has actually developed. For 1980-81, the year which is drawing to a close, the PSBR is now forecast to emerge at £13½ billion, or 6 percent of the gross domestic product. That compares with the 1980 Budget forecast of £8½ billion. The lion’s share of the £5 billion excess in 1980-81 was accounted for by higher expenditure. There has also been a net shortfall of tax revenue of about £1 billion, with receipts from indirect taxes and North Sea oil below expectations—only partly offset by higher receipts from the other Inland Revenue taxes. For the year now approaching, 1981-82, our published strategy suggested an illustrative PSBR of some 3 percent of the gross domestic product… But, as the House will understand, if the figure is to be brought down to £ 10½ billion from £14 billion, some harsh decisions are inescapable.” Fiscal consolidation in FY 1981/82 totaled 2.11 percent of GDP, primarily on the revenue side. Tax measures were amounted to ₤3.61 billion (1.9 percent of GDP)85 in 1981/82, and included higher indirect taxes (₤2.4 billion, 1.25 percent of GDP), and higher direct taxes (₤1.2 billion, 0.63 percent of GDP) (FSBR 1981-81, p. 4). Expenditure measures included cuts to public investment of ₤0.4 billion (0.21 percent of GDP) in 1981/82 (1981 OECD Economic Surveys, Table 12, p. 35). Overall, fiscal consolidation measures totaled about 2.11 percent of GDP (1.9+0.21).86 The 1982/1983 OECD Economic Surveys confirms that the consolidation measures described above were executed and that the consolidation in 1981/82 was “the largest in the OECD area” (p.25). The allocation of fiscal consolidation across calendar years follows the convention described above: 1.58 percent of GDP in 1981 and 0.53 percent of GDP in 1982. Tax measures amounted to 1.425 percent of GDP in 1981 and 0.475 percent of GDP in 1982. Spending cuts amounted to: 0.1575 percent of GDP in 1981 and 0.0525 percent of GDP in 1982. United Kingdom 1982 Fiscal consolidation totaled 0.53 percent of GDP, with spending cuts of 0.053 percent of GDP and tax hikes of 0.475 percent of GDP. The consolidation measures were based on the 1981/82 Budget (see entry for 1981 above).
United Kingdom 1994 Fiscal consolidation totaled 0.83 percent of GDP, with spending cuts of 0.15 percent of GDP and tax hikes of 0.68 percent of GDP. The motivation of the fiscal consolidation measures was clearly deficit reduction, as the 1994-95 Budget makes clear: “The central purpose of this Budget is to put the public finances on to a sound basis, so that the economic recovery now under way can be sustained over the medium term. The Budget combines tight public expenditure restraint with measures to raise revenue” (November 193 FSBR 1994-95, p. 5). The medium-term goal defined by the 1994-95 Budget was to achieve budget balance by the end of the 1990s. The reason for delaying consolidation until 1994/95 was, apparently, to avoid disrupting the economic recovery following the recession in the early 1990s. As the
85 Additional receipts from North Sea oil taxes are not included in the estimated impact of revenue measures, as it is not clear to what extent much they reflect international oil price developments vs. changes in the oil tax regime. 86 Note that overall government expenditure increased in 1981/82, but that “this higher level of expenditure is due to the deepening recession and does not reflect a discretionary increase in expenditure” (1981 OECD Economic Surveys, p. 38).

76
1994 OECD Economic Surveys notes, “The measures announced thus had little impact on the PSBR in FY 1993/94 but will have much greater effects in subsequent years” (p. 35). The 1994/95 fiscal consolidation was mainly revenue-based, in line with the plan outlined in the November 1993 Budget. The 1995 OECD Economic Surveys reports that, in 1994/95, unlike the previous fiscal year, the observed fall in the fiscal deficit (PSBR) was “largely due to discretionary policy measures” (p.31). In particular, the 1995 OECD Economic Surveys (p.31) estimates that “Tax and national insurance measures are estimated to have raised revenue by an estimated ₤6.3 billion,” or 0.90 percent of GDP. Tax measures fell mainly on the household sector (income tax, less mortgage tax relief, new tax on insurance premiums, air passenger duty, road fuel duties, increased tobacco duty, see 1994 OECD Economic Surveys, pp. 37-39). Discretionary spending (“Control Total”––government spending less spending on cyclical social security and debt interest payments) was also cut, but by a relatively small amount. The FSBR 1995-96 reports that Control Total spending in 1994-95 was ₤249.6 billion (Table 6A.3, p.133), representing a spending cut of ₤1.3 billion, or 0.2 percent of GDP. Spending measures reflected a wage bill freeze, tighter means-testing for benefits, and savings on defense, housing and transport programs (see 1994 OECD Economic Surveys, p. 37). The allocation of the consolidation in percent of GDP across calendar years is: 0.825 in 1994 and 0.275 in 1995, with tax hikes of 0.675 in 1994 and 0.225 in 1995, and spending cuts of 0.15 in 1994 and 0.05 in 1995.87 United Kingdom 1995 Fiscal consolidation totaled 0.275 percent of GDP, with spending cuts of 0.05 percent of GDP and tax hikes of 0.225 percent of GDP. The consolidation was based on measures
87 Notes on 1983-1993. During this period, while fiscal deficits did fall, the decline was not driven by tax hikes and spending cuts motivated by deficit reduction. During 1983-84, the OECD Economic Survey 1984/85 notes that “Given the faster-than-expected upturn in activity, the failure in 1983/84 to continue the reduction in the PSBR which had been achieved in the two previous years represented a relaxation of fiscal conditions relative to what had been envisaged” (p. 13). During 1984-85, although the fiscal deficit fell as a share of GDP, this was not primarily driven by tax and spending measures. As the OECD Economic Survey 1985/86 notes, plans for fiscal consolidation in 1984-85 were hampered by large slippages associated with “the cost of the miners’ strike, which was estimated to have added ₤2.75 billion to total borrowing” (p. 15) (about 1 percent of GDP). In addition, a number of tax changes were introduced, but, as the OECD Economic Survey 1985 notes, “The overall macroeconomic effect of the Budget is difficult to gauge because of both the large number and the complexity of the tax changes being introduced” (p. 15). Finally, the IMF 1984 Staff Report (p. 9) notes that “asset sales, and oil revenues inflated by the depreciation of sterling in 1984/85, reduced the PSBR,” but does not attribute the decline in the PSBR to tax rate increases or spending cuts. For 1985-86, the OECD Economic Survey 1985/86 reports no significant tax hikes or spending cuts introduced in 1986/87, with public spending in the 1986/87 budget “unchanged from previous plans” (p. 17). There was also a cut in the basic rate of personal income tax by 1 percentage point in 1986 (OECD Economic Survey 1986/87, p. 23). Nevertheless, fiscal outcomes improved unexpectedly in 1986/87, particularly on the revenue side. In particular, “the PSBR for 1986/87 was less than half of that envisaged in the initial budget and about £2.5 billion below that for the year before” (OECD Economic Survey 1986/87, p. 21). The key contributor to this favorable outcome was a surge in corporate taxes, the reasons for which were “not fully understood” (p. 21). Perhaps, the Survey suggested, “several years of rising profits … have led to a situation where a substantial number of companies have crossed from being tax-exhausted to tax paying” (p. 21). The surge in corporate revenues in 1986 also coincided with an increase in stock market activity associated with measures that deregulated financial markets (the “Big Bang”).
77
introduced in the 1994/95 Budget (see entry for 1994 above), which were motivated by deficit reduction.
United Kingdom 1996 Fiscal consolidation totaled 0.30 percent of GDP, based on spending cuts. Fiscal consolidation in 1996 was motivated by deficit reduction, as the November 1995 Budget Speech (28 November 1995) makes clear: “I have no intention of throwing away the gains we have made in recent years in getting public borrowing down. We will keep on track towards balance in the medium term because I do not want the future strength of the recovery put at risk.”88 The 1996-97 Budget explains (November 1995 FSBR, p. 5), “The Budget will ensure that the PSBR continues to decline.” Fiscal consolidation in FY 1995/96 was based on spending cuts (about 0.4 percent of GDP), broadly in line with the plan outlined in the November 1993 Budget. As the 1995 IMF Staff Report (1995 IMF Staff Report, p. 2) says, it consisted of “continuing expenditure restraint.” In terms of size, the 1996-97 Budget announced cuts to discretionary (Control Total) spending of ₤3.2 billion in 1996-97 (November 1995 FSBR, Table 1.6, p.12), that is, spending cuts of about 0.4 percent of GDP. The subsequent (1997-98) Budget confirms that the new (₤260.2 billion) limit to the Control Total was respected (November 1996 FSBR Table 5A.4, p. 123). In terms of composition, the FSBR 1996-97 emphasizes that “government departments’ running costs are being reduced” (p.8). The allocation of the spending cuts in percent of GDP across calendar years is 0.30 percent of GDP to 1996, and 0.10 to 1997.
United Kingdom 1997 Fiscal consolidation totaled 0.69 percent of GDP in 1997, with tax hikes of 0.53 percent of GDP and spending cuts of 0.16 percent of GDP. The July 1997 Budget of the newly elected (New Labour) government introduced a five-year fiscal consolidation plan motivated by reducing a large inherited budget deficit, as the 1997 Budget Speech explains (p. 1): “The Chancellor is first and foremost the guardian of the people's money. But during the 1990s the national debt has doubled. This year alone the taxpayer will pay out 25 billion in interest payments on debt, more than we spend on schools… Based on the fiscal tightening I have announced today, I can now give full details of our five year deficit reduction plan. The deficit reduction plan is aimed at reducing the structural budget deficit. It is made possible by a long term commitment to financial discipline. It takes into account the uncertainties and risks involved in and forecasting the economic cycle. It is underpinned by a comprehensive review of the way Government spends its money; and it matches rigour today with a long term commitment to prudent and sustainable public finances.” Based on this deficit-reduction plan, the July 1997 Budget (p. 13) projected a fiscal surplus by the early 2000s. Accordingly, the July 1997 Budget (July 1997 FSBR, p. 12) introduced tax hikes generating savings of ₤6 billion in FY 1997/98 and ₤6.7 billion in FY 1998/99.89 Partly offsetting these 88 The November 1995 Budget Speech is available on the web at: http://www.theyworkforyou.com/debates/?id=1995-11-28a.1057.2
89 The principal tax measures were: abolition of Advanced Corporation Tax credits; windfall tax on privatized utilities; increase in excises on road fuels and tobacco. These were partly offset by cuts in the standard rate of corporation tax and the rate of VAT on domestic fuel and power.
78
savings was an increase in spending on the Welfare to Work program, costing ₤0.2 billion in FY 1997/98 and ₤1.2 billion in FY 1998/99, which was motivated by reducing long-term unemployment––particularly among young people––rather by a response to cyclical unemployment (p. 31). We therefore subtract the cost of the Welfare to Work program from the total size of fiscal consolidation. The allocation of the change in saving due to these measures across calendar years is reported in Table 2. In addition, the November 1996 Budget introduced a number of fiscal consolidation measures motivated by “the Government’s objective of returning towards balance over the medium term” (November 1996 FSBR, p. 6). In particular, the November 1996 Budget cut spending to yield savings of by ₤1.9 billion in 1997-98, ₤2.5 billion in 1998-99 and ₤2.7 billion in 1999-00. However, it also some (temporary) tax cuts and tax-avoidance controls with an overall impact on revenue of –$0.2 billion in 1997-98, ₤0.6 billion in 1998-99 and ₤2.6 billion in 1999-00 (p. 6). The allocation of the change in saving due to these measures across calendar years is reported in Table 2. Therefore, based on measures introduced in the July 1997 and November 1996 Budgets, fiscal consolidation in 1997 totaled 0.69 percent of GDP, with tax hikes of 0.53 percent of GDP, and spending cuts of 0.16 percent of GDP.
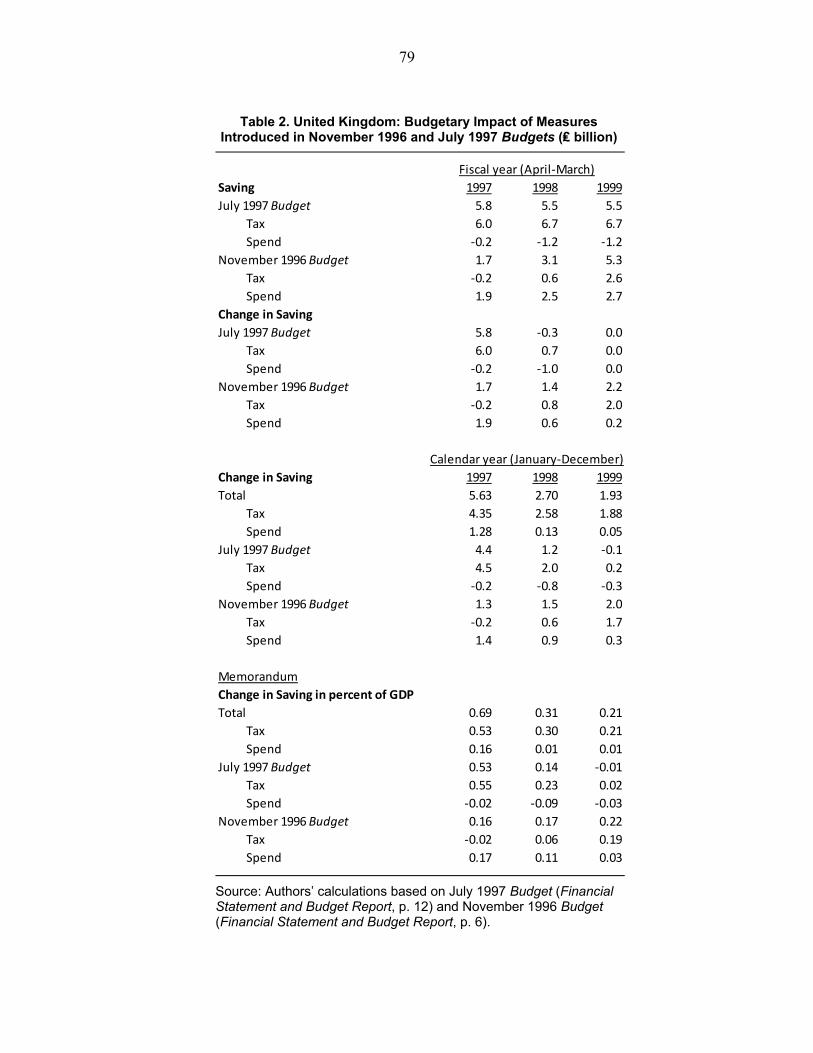
79
Table 2. United Kingdom: Budgetary Impact of Measures
Introduced in November 1996 and July 1997 Budgets (₤ billion)
Source: Authors’ calculations based on July 1997 Budget (Financial Statement and Budget Report, p. 12) and November 1996 Budget (Financial Statement and Budget Report, p. 6).
Saving 1997 1998 1999
July 1997 Budget 5.8 5.5 5.5
Tax 6.0 6.7 6.7
Spend -0.2 -1.2 -1.2
November 1996 Budget 1.7 3.1 5.3
Tax -0.2 0.6 2.6
Spend 1.9 2.5 2.7
Change in Saving
July 1997 Budget 5.8 -0.3 0.0
Tax 6.0 0.7 0.0
Spend -0.2 -1.0 0.0
November 1996 Budget 1.7 1.4 2.2
Tax -0.2 0.8 2.0
Spend 1.9 0.6 0.2
Change in Saving 1997 1998 1999
Total 5.63 2.70 1.93
Tax 4.35 2.58 1.88
Spend 1.28 0.13 0.05
July 1997 Budget 4.4 1.2 -0.1
Tax 4.5 2.0 0.2
Spend -0.2 -0.8 -0.3
November 1996 Budget 1.3 1.5 2.0
Tax -0.2 0.6 1.7
Spend 1.4 0.9 0.3
Memorandum
Change in Saving in percent of GDP
Total 0.69 0.31 0.21
Tax 0.53 0.30 0.21
Spend 0.16 0.01 0.01
July 1997 Budget 0.53 0.14 -0.01
Tax 0.55 0.23 0.02
Spend -0.02 -0.09 -0.03
November 1996 Budget 0.16 0.17 0.22
Tax -0.02 0.06 0.19
Spend 0.17 0.11 0.03
Calendar year (January-December)
Fiscal year (April-March)
80
United Kingdom 1998 Fiscal consolidation totaled 0.31 percent of GDP, based mainly on tax measures. Tax hikes amounted to 0.30 percent of GDP, while spending cuts amounted to 0.01 percent of GDP (see entry for 1997 above and Table 2). United Kingdom 1999 Fiscal consolidation totaled 0.21 percent of GDP, based mainly on tax increases. The 1999 consolidation was based on measures introduced in previous Budgets (see entry for 1997 above and Table 2), with 0.206 percent of GDP in tax increases and 0.005 percent of GDP in spending reductions.
Q. United States90
United States 1978 Fiscal consolidation totaled 0.135 percent of GDP based on a tax hike. The tax increase was motivated by deficit reduction, as discussed by Romer and Romer (2009, p. 57), and its budgetary impact was estimated at $2.9 billion (0.135 percent of GDP) (p. 57). The tax hike was associated with the 1972 Changes to Social Security.
United States 1980 Fiscal consolidation totaled 0.062 percent of GDP based on a tax hike. The tax increase was associated with the Social Security Amendments of 1977, and was motivated by deficit reduction and fiscal sustainability, as reported by Romer and Romer (2009, pp. 62-63): “The motivation for the changes to the Social Security Act enacted in 1977 was concern about the solvency of the Social Security system… projections suggested that the system faced a substantial long-term deficit.” The estimated budgetary impact in 1980 was $1.7 billion (0.062 percent of GDP) (p. 62).
United States 1981 Fiscal consolidation totaled 0.23 percent of GDP based on tax hikes. The tax hike was motivated by deficit reduction, as explained by Romer and Romer (2009, p. 62). The estimated budgetary impact of this tax hike was $17.2 billion (0.56 percent of GDP) (p. 62).91 However, this tax increase was partly offset by a tax cut associated with the Economic Recovery Tax Act of 1981 (ERTA-81). As Romer and Romer (2009, p. 68) explain, the tax cuts associated with ERTA-81 were “largely for ideological or long-term reasons, not to return economic growth to normal. A major tax cut had been a centerpiece of Reagan’s presidential campaign” (p. 68). The budgetary impact of the tax cut in 1981 is estimated at –$8.9 billion (p. 68). Therefore, following our convention for dealing with different fiscal
90 The U.S. government’s fiscal year begins on October 1 of the previous calendar year and ends on September 30 of the year with which it is numbered. The sources consulted for the United States are various Congressional Budget Office (CBO) reports, the Economic Report of the President, IMF Recent Economic Developments, and Romer and Romer (2009).
91 As in 1980, the tax hike was associated with the Social Security Amendments of 1977.
81
actions not associated with short-term economic developments, net fiscal consolidation in 1981 amounted to $8.3 billion (17.2–8.9) or 0.23 percent of GDP.
United States 1985 Fiscal consolidation totaled 0.21 percent of GDP based on tax hikes. As Romer and Romer (2009, p. 72) explain, the tax increase was due to the Social Security Amendments of 1983, which were motivated by deficit reduction: “The motivation for the changes was concern about the soundness of the [Social Security] system. As in 1977, the Social Security trust fund was projected to be exhausted within a few years, and the system faced a large projected long-term deficit.” The tax hike had an estimated budgetary impact of $8.8 billion in 1985 (p. 72), or 0.21 percent of GDP. United States 1986 Fiscal consolidation totaled 0.096 percent of GDP based on tax hikes. As Romer and Romer (2009, p. 72) explain, the tax hike was again due to the Social Security Amendments of 1983 and was motivated by deficit reduction. The estimated budgetary effect of the tax hike was $4.2 billion (Romer and Romer, 2009, p. 72) or 0.096 percent of GDP.
United States 1988 Fiscal consolidation amounted to 0.85 percent of GDP, with a tax hike of 0.39 percent of GDP and a spending cut of 0.46 percent of GDP. In 1988, a tax increase occurred motivated by deficit reduction (Romer and Romer, 2009, p. 72). The estimated budgetary impact of this tax increase was $15.5 billion (Romer and Romer, 2009, p. 72). In addition, a tax hike occurred due to the Omnibus Budget Reconciliation Act of 1987 (OBRA-87) which was motivated by deficit reduction and putting the social security system on a sustainable footing, as discussed by Romer and Romer (2009, pp. 77-79). The tax hike had an estimated budgetary impact of $10.8 billion (p. 77). However, these tax hikes were partly offset by a tax cut associated with the Tax Reform Act of 1986. As Romer and Romer (2009, p. 75) explain, this tax cut was motivated by the need to simplify the tax system, and not in response to short-term economic developments, and the budgetary impact was –$7.2 billion. Therefore, the net tax hike amounted to $19.1 billion (15.5+10.8–7.2) in 1988, or 0.39 percent of GDP. In addition, as Romer and Romer (2009, p. 79) report, the tax hikes of OBRA-87 were part of an agreement between the president and Congress that also included spending cuts: “According to the 1989 Budget, the agreement also called for $47 billion of reductions in spending relative to its projected path over a two-year period (p. 1-6).” The reduction in government spending was thus about $23.5 billion (0.46 percent of GDP) beginning in 1988. Overall, fiscal consolidation in 1988 amounted to 0.85 percent of GDP (0.39+0.46), with tax hikes of 0.39 percent of GDP and a spending cut of 0.46 percent of GDP. United States 1990 Fiscal consolidation totaled 0.33 percent of GDP, with a 0.07 percent of GDP spending cut and a 0.26 percent of GDP tax hike. In 1990, a tax hike occurred that, as Romer and Romer (2009, p. 72) discuss, was motivated by reducing the budgetary deficit and putting the social security system on a financially sustainable footing. The budgetary impact of the tax hike was 0.18 percent of GDP (Romer and Romer, 2009, p. 72). In addition, the Omnibus Budget Reconciliation Act of 1990 (see entry for 1991) had the following impact in 1990: an

82
additional tax hike worth 0.08 percent of GDP and a spending cut of 0.07 percent of GDP. Therefore, total fiscal consolidation in 1990 amounted to 0.33 percent of GDP, with a 0.07 percent of GDP spending cut, and a 0.26 percent of GDP tax hike (0.18+0.08) United States 1991 Fiscal consolidation totaled 0.58 percent of GDP in 1991, with a spending cut of 0.29 percent of GDP and a tax hike of 0.29 percent of GDP. The five-year fiscal consolidation program (1991-1995) laid out in the Omnibus Budget Reconciliation Act of 1990 (OBRA-90) enacted on November 5 1990 was motivated by deficit reduction. As the 1991 Economic Report of the President (p. 26) emphasizes, “The Omnibus Budget Reconciliation Act of 1990 contains the largest and most comprehensive deficit reduction package in U.S. history. It is designed to reduce the Federal deficit by a total of nearly one-half trillion dollars over the next 5 years, relative to what it would otherwise be.” It also explained the economic benefits of deficit reduction (p. 64): “Economic theory and empirical evidence indicate that expectations of deficit reduction in future years, if the deficit reduction commitment is credible, can lower interest rates as financial market participants observe that the government will be lowering its future demand in the credit market.” As the 1991 IMF Recent Economic Developments explains (pp. 17-18), the fiscal consolidation measures were mainly on the spending side: “About one third of the $496 billion in deficit cuts under the Budget Agreement come from the revenue side, with the major measures involving extending, raising, or introducing excise taxes on gasoline, tobacco, alcohol, telephone services and airline travel; raising income tax rates for high income brackets, phasing out certain tax exemptions, and reducing itemized deductions; and raising the cap on earnings subject to the Medicare payroll tax. Slightly more than one half of the deficit cuts come from reductions in primary spending, mainly in the areas of defense and entitlement spending. The remainder comes largely from savings on debt service payments.” The budgetary impact of the act over time was estimated by the CBO (The 1990 Budget Agreement: An Interim Assessment, p. 6). The implied changes in budgetary savings, in percent of GDP, are as follows (see Table 3 below for details): Tax: 0.08 in 1990; 0.29 in 1991; 0.24 in 1992; close to zero in 1993-1995. Spend: 0.07 in 1990; 0.29 in 1991; 0.29 in 1992; 0.21 in 1993; 0.43 in 1994; 0.25 in 1995 Total: 0.15 in 1990; 0.58 in 1991; 0.52 in 1992; 0.20 in 1993; 0.50 in 1994; 0.27 in 1995 Therefore, fiscal consolidation amounted to 0.58 percent of GDP in 1991, split roughly evenly across tax hikes and spending cuts.
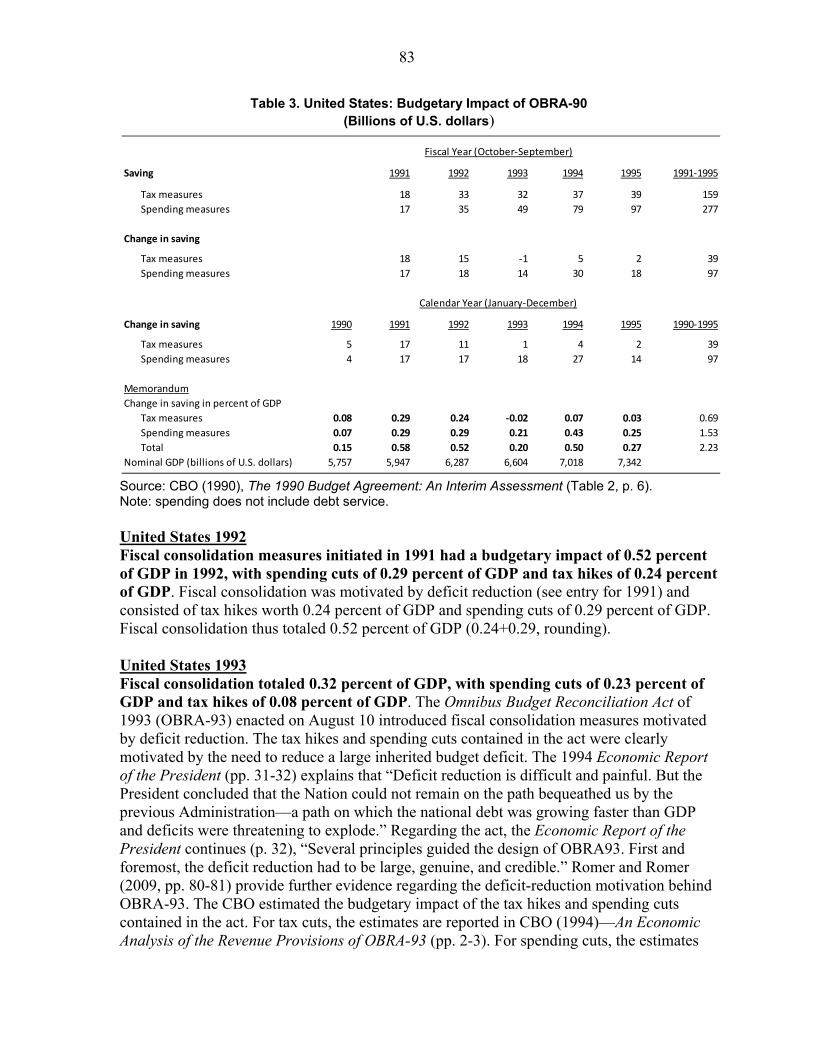
83
Table 3. United States: Budgetary Impact of OBRA-90 (Billions of U.S. dollars)
Source: CBO (1990), The 1990 Budget Agreement: An Interim Assessment (Table 2, p. 6). Note: spending does not include debt service. United States 1992 Fiscal consolidation measures initiated in 1991 had a budgetary impact of 0.52 percent of GDP in 1992, with spending cuts of 0.29 percent of GDP and tax hikes of 0.24 percent of GDP. Fiscal consolidation was motivated by deficit reduction (see entry for 1991) and consisted of tax hikes worth 0.24 percent of GDP and spending cuts of 0.29 percent of GDP. Fiscal consolidation thus totaled 0.52 percent of GDP (0.24+0.29, rounding). United States 1993 Fiscal consolidation totaled 0.32 percent of GDP, with spending cuts of 0.23 percent of GDP and tax hikes of 0.08 percent of GDP. The Omnibus Budget Reconciliation Act of 1993 (OBRA-93) enacted on August 10 introduced fiscal consolidation measures motivated by deficit reduction. The tax hikes and spending cuts contained in the act were clearly motivated by the need to reduce a large inherited budget deficit. The 1994 Economic Report of the President (pp. 31-32) explains that “Deficit reduction is difficult and painful. But the President concluded that the Nation could not remain on the path bequeathed us by the previous Administration––a path on which the national debt was growing faster than GDP and deficits were threatening to explode.” Regarding the act, the Economic Report of the President continues (p. 32), “Several principles guided the design of OBRA93. First and foremost, the deficit reduction had to be large, genuine, and credible.” Romer and Romer (2009, pp. 80-81) provide further evidence regarding the deficit-reduction motivation behind OBRA-93. The CBO estimated the budgetary impact of the tax hikes and spending cuts contained in the act. For tax cuts, the estimates are reported in CBO (1994)––An Economic Analysis of the Revenue Provisions of OBRA-93 (pp. 2-3). For spending cuts, the estimates
Saving 1991 1992 1993 1994 1995 1991-1995
Tax measures 18 33 32 37 39 159
Spending measures 17 35 49 79 97 277
Change in saving
Tax measures 18 15 -1 5 2 39
Spending measures 17 18 14 30 18 97
Change in saving 1990 1991 1992 1993 1994 1995 1990-1995
Tax measures 5 17 11 1 4 2 39
Spending measures 4 17 17 18 27 14 97
Memorandum
Change in saving in percent of GDP
Tax measures 0.08 0.29 0.24 -0.02 0.07 0.03 0.69
Spending measures 0.07 0.29 0.29 0.21 0.43 0.25 1.53
Total 0.15 0.58 0.52 0.20 0.50 0.27 2.23
Nominal GDP (billions of U.S. dollars) 5,757 5,947 6,287 6,604 7,018 7,342
Fiscal Year (October-September)
Calendar Year (January-December)

84
are reported in CBO (1993)––Economic and Budget Outlook, September 1993 (p. 29). The CBO provides estimates of the budgetary impact over time (recorded in Table 4 below). Overall, the act had budgetary effects, in percent of GDP, as follows: Tax: 0.10 in 1993; 0.34 in 1994; 0.17 in 1995; 0.08 in 1996; 0.06 in 1997; –0.02 in
1998 Spend: 0.02 in 1993; 0.07 in 1994; 0.09 in 1995; 0.22 in 1996; 0.24 in 1997; 0.17 in
1998 Total: 0.12 in 1993, 0.40 in 1994, 0.26 in 1995, 0.29 in 1996, 0.30 in 1997; 0.15 in
1998
In addition, due to OBRA-90 (see entry for 1991) additional spending cuts motivated by deficit reduction in 1993 amounted to 0.21 percent of GDP in 1993. Thus, total fiscal consolidation in 1993 amounted to 0.32 percent of GDP (0.12+0.21, rounding), with spending cuts of 0.23 percent of GDP (0.02+0.21), and tax hikes of 0.08 percent of GDP.
Table 4. United States: Budgetary Impact of OBRA-93 (Billions of U.S. dollars)
Sources: CBO (1994), An Economic Analysis of the Revenue Provisions of OBRA-93, “Budget Impact of Major Tax Provisions of OBRA-1993” (Table 1, p. 2) and CBO (1994), Economic and Budget Outlook, “Budget Impact of Spending Reductions Under OBRA-93” (Table 2.2, p. 29). Note: spending does not include debt service. United States 1994 Fiscal consolidation in 1994 amounted to 0.90 percent of GDP, as part of the ongoing multi-year adjustment, with spending cuts of 0.50 percent of GDP and tax measures of 0.40 percent of GDP. Fiscal consolidation in 1994 was due to the measures contained in
Saving 1994 1995 1996 1997 1998 1994-1998
Tax measures 26 42 47 55 52 222
Spending measures 5 9 24 44 64 146
Change in saving
Tax measures 26 15 6 8 -3 52
Spending measures 5 3 16 20 20 64
Change in saving 1993 1994 1995 1996 1997 1998 1993-1998
Tax measures 7 24 13 6 5 -2 52
Spending measures 1 5 6 17 20 15 64
Memorandum
Change in saving in percent of GDP
Tax measures 0.10 0.34 0.17 0.08 0.06 -0.02 0.73
Spending measures 0.02 0.07 0.09 0.22 0.24 0.17 0.80
Total 0.12 0.40 0.26 0.29 0.30 0.15 1.52
Nominal GDP (billions of U.S. dollars) 6,604 7,018 7,342 7,762 8,251 8,695
Fiscal Year (October-September)
Calendar Year (January-December)

85
OBRA-90 and OBRA-93, which were motivated by deficit reduction (see entries for 1991 and 1993 above). Fiscal consolidation in 1994 amounted to 0.90 percent of GDP, with spending cuts of 0.50 percent of GDP (0.07+0.43) and tax hikes of 0.40 percent of GDP (0.34+0.07). United States 1995 Fiscal consolidation in 1995 amounted to 0.53 percent of GDP as part of the ongoing multi-year adjustment with spending cuts of 0.33 percent of GDP and tax hikes of 0.20 percent of GDP. Fiscal consolidation in 1995 was due to the measures contained in OBRA-90 and OBRA-93, which were motivated by deficit reduction (see entries for 1991 and 1993 above). Fiscal consolidation in 1995 amounted to 0.53 percent of GDP, with spending cuts of 0.33 percent of GDP (0.09+0.25, rounding) and tax hikes of 0.20 percent of GDP (0.17+0.03). United States 1996 Fiscal consolidation in 1996 amounted to 0.29 percent of GDP, primarily on the spending side, as part of the ongoing multi-year adjustment. Fiscal consolidation in 1996 was due to the measures contained in OBRA-93, which were motivated by deficit reduction (see entry for 1993 and Table 4). Fiscal consolidation in 1996 amounted to 0.29 percent of GDP with spending cuts of 0.22 percent of GDP and tax hikes of 0.08 percent of GDP. United States 1997 Fiscal consolidation in 1997 amounted to 0.30 percent of GDP, primarily on the spending side, as part of the ongoing multi-year adjustment. Fiscal consolidation in 1997 was due to the measures contained in OBRA-93, which were motivated by deficit reduction (see entry for 1993 and Table 4). There were spending cuts of 0.24 percent of GDP and tax hikes of 0.06 percent of GDP. United States 1998 Fiscal consolidation in 1998 amounted to 0.15 percent of GDP based on spending cuts, as part of the ongoing multi-year adjustment. Fiscal consolidation in 1998 was due to the measures contained in OBRA-93, which were motivated by deficit reduction (see entry for 1993 and Table 4).92
92 Notes on 2000-2009. No fiscal consolidation occurred during 2000-2009. The Balanced Budget Act of 1997 did introduce spending cuts affecting this period, but the associated budgetary savings (estimated by the CBO––Budgetary Implications of the Balanced Budget Act of 1997, December 1997) were offset by the budgetary cost of the Tax Payer Relief Act of 1997 (estimated by the CBO––An Economic Analysis of the Taxpayer Relief Act of 1997, April 2000). Romer and Romer (2009, pp. 82-83) confirm that neither of these two acts were primarily motivated by short term fluctuations. In addition, the Economic Growth and Tax Relief Reconciliation Act of 2001 introduced further tax cuts. Overall, therefore, we conclude that no net fiscal consolidation motivated by deficit reduction occurred during 2000-2009.
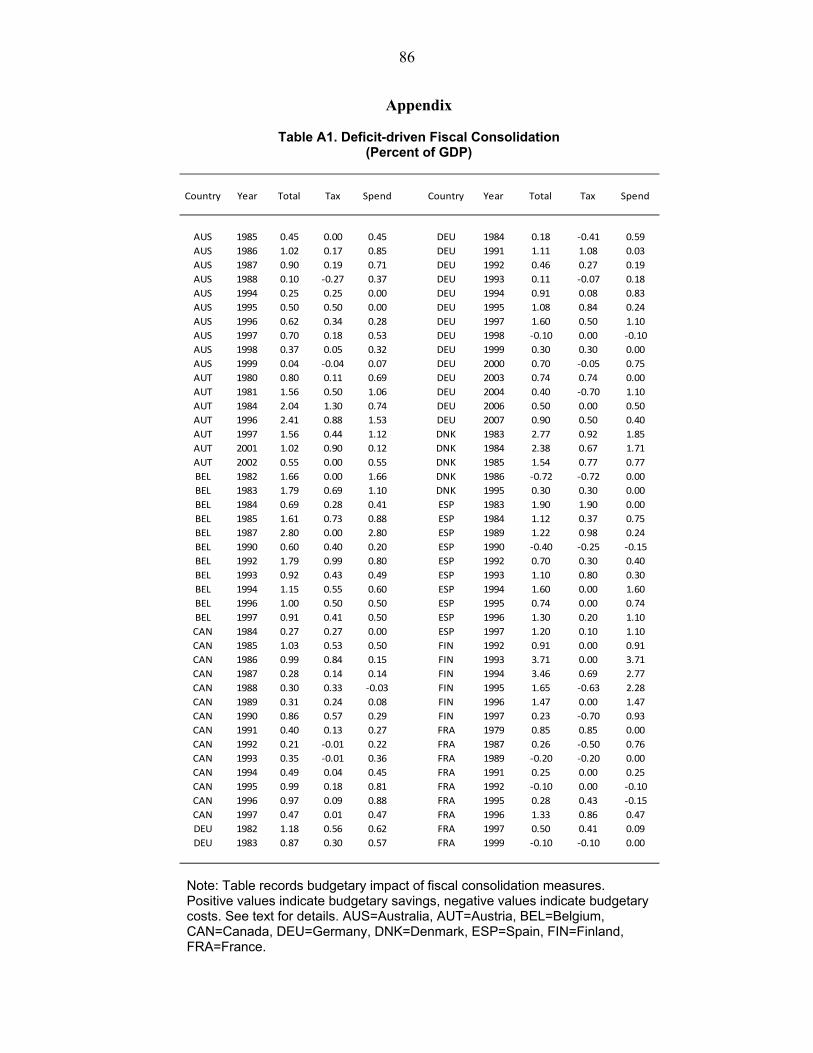
86
Appendix
Table A1. Deficit-driven Fiscal Consolidation (Percent of GDP)
Note: Table records budgetary impact of fiscal consolidation measures. Positive values indicate budgetary savings, negative values indicate budgetary costs. See text for details. AUS=Australia, AUT=Austria, BEL=Belgium, CAN=Canada, DEU=Germany, DNK=Denmark, ESP=Spain, FIN=Finland, FRA=France.
Country Year Total Tax Spend Country Year Total Tax Spend
AUS 1985 0.45 0.00 0.45 DEU 1984 0.18 -0.41 0.59
AUS 1986 1.02 0.17 0.85 DEU 1991 1.11 1.08 0.03
AUS 1987 0.90 0.19 0.71 DEU 1992 0.46 0.27 0.19
AUS 1988 0.10 -0.27 0.37 DEU 1993 0.11 -0.07 0.18
AUS 1994 0.25 0.25 0.00 DEU 1994 0.91 0.08 0.83
AUS 1995 0.50 0.50 0.00 DEU 1995 1.08 0.84 0.24
AUS 1996 0.62 0.34 0.28 DEU 1997 1.60 0.50 1.10
AUS 1997 0.70 0.18 0.53 DEU 1998 -0.10 0.00 -0.10
AUS 1998 0.37 0.05 0.32 DEU 1999 0.30 0.30 0.00
AUS 1999 0.04 -0.04 0.07 DEU 2000 0.70 -0.05 0.75
AUT 1980 0.80 0.11 0.69 DEU 2003 0.74 0.74 0.00
AUT 1981 1.56 0.50 1.06 DEU 2004 0.40 -0.70 1.10
AUT 1984 2.04 1.30 0.74 DEU 2006 0.50 0.00 0.50
AUT 1996 2.41 0.88 1.53 DEU 2007 0.90 0.50 0.40
AUT 1997 1.56 0.44 1.12 DNK 1983 2.77 0.92 1.85
AUT 2001 1.02 0.90 0.12 DNK 1984 2.38 0.67 1.71
AUT 2002 0.55 0.00 0.55 DNK 1985 1.54 0.77 0.77
BEL 1982 1.66 0.00 1.66 DNK 1986 -0.72 -0.72 0.00
BEL 1983 1.79 0.69 1.10 DNK 1995 0.30 0.30 0.00
BEL 1984 0.69 0.28 0.41 ESP 1983 1.90 1.90 0.00
BEL 1985 1.61 0.73 0.88 ESP 1984 1.12 0.37 0.75
BEL 1987 2.80 0.00 2.80 ESP 1989 1.22 0.98 0.24
BEL 1990 0.60 0.40 0.20 ESP 1990 -0.40 -0.25 -0.15
BEL 1992 1.79 0.99 0.80 ESP 1992 0.70 0.30 0.40
BEL 1993 0.92 0.43 0.49 ESP 1993 1.10 0.80 0.30
BEL 1994 1.15 0.55 0.60 ESP 1994 1.60 0.00 1.60
BEL 1996 1.00 0.50 0.50 ESP 1995 0.74 0.00 0.74
BEL 1997 0.91 0.41 0.50 ESP 1996 1.30 0.20 1.10
CAN 1984 0.27 0.27 0.00 ESP 1997 1.20 0.10 1.10
CAN 1985 1.03 0.53 0.50 FIN 1992 0.91 0.00 0.91
CAN 1986 0.99 0.84 0.15 FIN 1993 3.71 0.00 3.71
CAN 1987 0.28 0.14 0.14 FIN 1994 3.46 0.69 2.77
CAN 1988 0.30 0.33 -0.03 FIN 1995 1.65 -0.63 2.28
CAN 1989 0.31 0.24 0.08 FIN 1996 1.47 0.00 1.47
CAN 1990 0.86 0.57 0.29 FIN 1997 0.23 -0.70 0.93
CAN 1991 0.40 0.13 0.27 FRA 1979 0.85 0.85 0.00
CAN 1992 0.21 -0.01 0.22 FRA 1987 0.26 -0.50 0.76
CAN 1993 0.35 -0.01 0.36 FRA 1989 -0.20 -0.20 0.00
CAN 1994 0.49 0.04 0.45 FRA 1991 0.25 0.00 0.25
CAN 1995 0.99 0.18 0.81 FRA 1992 -0.10 0.00 -0.10
CAN 1996 0.97 0.09 0.88 FRA 1995 0.28 0.43 -0.15
CAN 1997 0.47 0.01 0.47 FRA 1996 1.33 0.86 0.47
DEU 1982 1.18 0.56 0.62 FRA 1997 0.50 0.41 0.09
DEU 1983 0.87 0.30 0.57 FRA 1999 -0.10 -0.10 0.00

87
Table A1. Continued. Deficit-driven Fiscal Consolidation (Percent of GDP)
Note: Table records budgetary impact of fiscal consolidation measures. Positive values indicate budgetary savings, negative values indicate budgetary costs. See text for details. FRA=France, GBR=United Kingdom, IRL=Ireland, ITA=Italy, JPN=Japan, NLD=Netherlands, PRT=Portugal, SWE=Sweden, USA=United States.
Country Year Total Tax Spend Country Year Total Tax Spend
FRA 2000 -0.20 -0.20 0.00 NLD 1982 1.71 0.00 1.71
GBR 1979 0.27 -0.45 0.72 NLD 1983 3.24 0.49 2.75
GBR 1980 0.08 -0.13 0.21 NLD 1984 1.76 0.00 1.76
GBR 1981 1.58 1.43 0.16 NLD 1985 1.24 0.00 1.24
GBR 1982 0.53 0.48 0.05 NLD 1986 1.74 0.00 1.74
GBR 1994 0.83 0.68 0.15 NLD 1987 1.48 1.48 0.00
GBR 1995 0.28 0.23 0.05 NLD 1988 0.06 -0.69 0.75
GBR 1996 0.30 0.00 0.30 NLD 1991 0.87 0.87 0.00
GBR 1997 0.69 0.53 0.16 NLD 1992 0.74 -0.58 1.32
GBR 1998 0.31 0.30 0.01 NLD 1993 0.12 -0.16 0.28
GBR 1999 0.21 0.21 0.01 NLD 2004 1.70 0.40 1.30
IRL 1982 2.80 2.54 0.26 NLD 2005 0.50 0.20 0.30
IRL 1983 2.50 2.44 0.06 PRT 1983 2.30 1.35 0.95
IRL 1984 0.29 0.29 0.00 PRT 2000 0.50 0.00 0.50
IRL 1985 0.12 0.12 0.00 PRT 2002 1.60 1.20 0.40
IRL 1986 0.74 0.74 0.00 PRT 2003 -0.75 -0.75 0.00
IRL 1987 1.65 0.53 1.12 PRT 2005 0.60 0.52 0.08
IRL 1988 1.95 0.00 1.95 PRT 2006 1.65 1.10 0.55
IRL 2009 4.74 2.35 2.39 PRT 2007 1.40 0.50 0.90
ITA 1991 2.77 1.69 1.08 SWE 1984 0.90 0.21 0.69
ITA 1992 3.50 1.60 1.90 SWE 1993 1.81 0.42 1.39
ITA 1993 4.49 2.00 2.49 SWE 1994 0.78 0.19 0.59
ITA 1994 1.43 -0.27 1.70 SWE 1995 3.50 1.40 2.10
ITA 1995 4.20 2.41 1.79 SWE 1996 2.00 0.80 1.20
ITA 1996 0.34 -0.74 1.08 SWE 1997 1.50 0.60 0.90
ITA 1997 1.82 0.89 0.93 SWE 1998 1.00 0.40 0.60
ITA 1998 0.68 0.01 0.67 USA 1978 0.14 0.14 0.00
ITA 2004 1.30 0.67 0.63 USA 1980 0.06 0.06 0.00
ITA 2005 1.00 0.40 0.60 USA 1981 0.23 0.23 0.00
ITA 2006 1.39 0.50 0.89 USA 1985 0.21 0.21 0.00
ITA 2007 1.03 1.32 -0.29 USA 1986 0.10 0.10 0.00
JPN 1979 0.12 0.12 0.00 USA 1988 0.85 0.39 0.46
JPN 1980 0.21 0.21 0.00 USA 1990 0.33 0.26 0.07
JPN 1981 0.43 0.43 0.00 USA 1991 0.58 0.29 0.29
JPN 1982 0.71 0.31 0.40 USA 1992 0.52 0.24 0.28
JPN 1983 0.42 0.06 0.37 USA 1993 0.32 0.08 0.23
JPN 1997 1.43 0.98 0.45 USA 1994 0.90 0.40 0.50
JPN 1998 0.48 0.33 0.15 USA 1995 0.53 0.20 0.33
JPN 2003 0.48 0.00 0.48 USA 1996 0.29 0.08 0.22
JPN 2004 0.64 0.19 0.45 USA 1997 0.30 0.06 0.24
JPN 2005 0.28 0.06 0.22 USA 1998 0.15 0.00 0.15
JPN 2006 0.72 0.45 0.27
JPN 2007 0.15 0.15 0.00
NLD 1981 1.75 0.53 1.22

88
REFERENCES
Antenne 2, Journal télévisé de 20 H, March 25, 1983, available on the internet at http://www.ina.fr/fresques/jalons/fiche-media/InaEdu00151/le-tournant-de-la-rigueur-sous-le-gouvernement-mauroy
Australian Government, Budget Speech, various years.
Banco de Portugal, Annual Report, various years.
Bank of Italy, Annual Report, various years.
Banca d’Italia, Banca d’Italia Assemblea Generale Ordinaria Dei Partecipanti, various years.
Canada Department of Finance, Budget Papers, various years.
Canada Department of Finance, Budget Plan, various years.
Canada Department of Finance, Budget Speech, various years.
Canada Department of Finance, The Budget, various years.
Congressional Budget Office, various reports and documents.
European Commission (EC), Stability and Convergence Programs, various years Brussels), http://ec.europa.eu/economy_finance/sgp/convergence/programmes/index_en.htm
Finland Ministry of Finance (2000), Press release, “Government agrees on expenditure guidelines,” March 7, http://www.vm.fi/vm/en/03_press_releases_and_speeches/01_press_releases/2000/6934/name.jsp
German Council of Economic Experts, 2003, Annual Report 2002/03 (Reutlingen).
Guajardo, Jaime, Daniel Leigh, and Andrea Pescatori, “Expansionary Austerity: New International Evidence,” IMF Working Paper (forthcoming).
HM Treasury, Financial Statement and Budget Report, various years.
HM Treasury, Budget Speech, various years, http://www.theyworkforyou.com/debates/?id=1981-03-10a.763.1
International Monetary Fund (IMF), IMF Staff Reports for Article IV consultations, 1978-2009 (Washington).
———, Recent Economic Developments, 1978-2009 (Washington).

89
International Monetary Fund (IMF), 2010, World Economic Outlook, October 2010 (Washington).
Ireland Department of Finance, Budget, various years.
Journal Officiel de la Republique Francaise, various years. Milesi-Ferretti, Gian Maria, 2009, “The Financial Crisis and its International Transmission:
Some Tentative Lessons,” manuscript, International Monetary Fund. Ministry of Finance Japan, Budget, 1978-2009 (Tokyo). Ministry of Finance Japan, 2004, “Understanding the Japanese Budget 2004,”
http://www.mof.go.jp/english/budget/brief/2004/2004c_01.htm
Morris, Richard, and Ludger Schuknecht, 2007, “Structural Balances and Revenue Windfalls: the Role of Asset Prices Revisited,” European Central Bank Working Paper Series No. 737.
National Bank of Belgium, Annual Report, various years.
Netherlands Ministry of Finance, The Netherlands Budget Memorandum, various years.
Organization for Economic Cooperation and Development (OECD), OECD Economic Surveys, various years (Paris).
Ramey, Valerie A., and Matthew D. Shapiro, 1998, “Costly Capital Reallocation and the Effects of Government Spending,” Carnegie-Rochester Conference Series on Public Policy, 48(1): 145-94.
Ramey, Valerie A., 2011, “Identifying Government Spending Shocks: It’s All in the Timing,” The Quarterly Journal of Economics, February 2011, pp. 1-50.
Romer, Christina D., and David H. Romer, 2009, “A Narrative Analysis of Postwar Tax Changes,” (Berkeley: University of California). Available at http://elsa.berkeley.edu/~dromer/papers/nadraft609.pdf.
———, 2010, “The Macroeconomic Effects of Tax Changes: Estimates Based on a New Measure of Fiscal Shocks,” American Economic Review, Vol. 100, No. 3, pp. 763-801.
Sweden Ministry of Economic Affairs and the Ministry of the Budget, The Swedish Budget, various years.
Sweden Ministry of Finance, The Swedish Budget, various years.
The French National Assembly, transcript of session of April 9 1986.
U.S. Office of Management and Budget, Budget of the United States Government, various

90
years.
U.S. Office of the President, Economic Report of the President, various years.
Wolswijk, Guido, 2007, “Short- and Long-Run Tax Elasticities - the Case of the Netherlands,” European Central Bank Working Paper Series No. 763 (Frankfurt: European Central Bank).