Embed Size (px)
Citation preview
IOP PUBLISHING ENVIRONMENTAL RESEARCH LETTERS
Environ. Res. Lett. 7 (2012) 044037 (8pp) doi:10.1088/1748-9326/7/4/044037
A near real-time satellite-based globaldrought climate data record
Amir AghaKouchak and Navid Nakhjiri
University of California Irvine, E4130 Engineering Gateway Irvine, CA 92697, USA
E-mail: [email protected] and [email protected]
Received 22 September 2012Accepted for publication 26 November 2012Published 13 December 2012Online at stacks.iop.org/ERL/7/044037
AbstractReliable drought monitoring requires long-term and continuous precipitation data. Highresolution satellite measurements provide valuable precipitation information on a quasi-globalscale. However, their short lengths of records limit their applications in drought monitoring. Inaddition to this limitation, long-term low resolution satellite-based gauge-adjusted data setssuch as the Global Precipitation Climatology Project (GPCP) one are not available in nearreal-time form for timely drought monitoring. This study bridges the gap between lowresolution long-term satellite gauge-adjusted data and the emerging high resolution satelliteprecipitation data sets to create a long-term climate data record of droughts. To accomplishthis, a Bayesian correction algorithm is used to combine GPCP data with real-time satelliteprecipitation data sets for drought monitoring and analysis. The results showed that thecombined data sets after the Bayesian correction were a significant improvement compared tothe uncorrected data. Furthermore, several recent major droughts such as the 2011 Texas, 2010Amazon and 2010 Horn of Africa droughts were detected in the combined real-time andlong-term satellite observations. This highlights the potential application of satelliteprecipitation data for regional to global drought monitoring. The final product is a real-timedata-driven satellite-based standardized precipitation index that can be used for droughtmonitoring especially over remote and/or ungauged regions.
Keywords: drought, satellite data, precipitation
1. Introduction
Droughts are typically categorized into four major classes:(a) meteorological drought, a deficit in precipitation;(b) hydrological drought, a deficit in streamflow, groundwaterlevel or water storage; (c) agricultural drought, a deficit insoil moisture; and (d) socioeconomic drought, incorporatingwater supply and demand (Anderson et al 2011, Wilhite andGlantz 1985). All four categories of droughts are related toa sustained lack of precipitation and thus, having accurate,long-term, and timely precipitation data is fundamental todrought monitoring and analysis.
Content from this work may be used under the termsof the Creative Commons Attribution-NonCommercial-
ShareAlike 3.0 licence. Any further distribution of this work must maintainattribution to the author(s) and the title of the work, journal citation and DOI.
Several indices have been developed for droughtmonitoring based on indicator variables such as precipitation,soil moisture, runoff and evapotranspiration (Karl 1983,McKee et al 1993, Hao and AghaKouchak 2012, Dai et al2004, Mo 2008, Shukla and Wood 2008, Anderson et al 2011).The precipitation deficit can be expressed with the commonlyused standardized precipitation index (SPI) (McKee et al1993, Hayes et al 1999). The SPI identifies precipitationdeficits at various timescales (e.g., 1-, 3-, 6- and 12-month).The amount of precipitation with respect to climatology in anormalized scale and over a given time period (e.g., 6-month)is represented by this value. The SPI is standardized to anormal distribution having zero mean and a standard deviationof one (Tsakiris and Vangelis 2004). A positive SPI valueindicates an above average precipitation accumulation over aperiod of time (for example, 6-month), whereas a negative
11748-9326/12/044037+08$33.00 c© 2012 IOP Publishing Ltd Printed in the UK

Environ. Res. Lett. 7 (2012) 044037 A AghaKouchak and N Nakhjiri
SPI indicates a dry period with an average precipitationaccumulation below the climatological mean. An SPI valuenear zero refers to precipitation accumulation near theclimatological mean. In other words, a sequence of negative(positive) SPI values indicates that the climate condition has adry (wet) status (McKee et al 1993).
In a recent meeting (WMO 2009), drought expertsmade a consensus agreement to recommend the SPI forthe characterization of meteorological droughts (Hayes et al2011). Following the discussions at (WMO 2009), theNational Meteorological and Hydrological Services (NMHSs)has been encouraged to use the SPI for meteorological droughtanalysis (Hayes et al 2011, WCRP 2010). The true strengthof SPI is that precipitation anomalies can be calculated overflexible timescales in a consistent fashion. Another attractivefeature of the SPI is that drought information can be providedin a timely manner for operational drought-monitoringapplications if precipitation is available in near real-time.
In numerous studies, the SPI were derived usinglong-term rain gauge data (Santos et al 2010, Gonzalez andValdes 2006). However, the spatial distribution of rain gaugesin most parts of the world is not sufficient enough to capturereliable estimates of precipitation and its spatial variabil-ity (Easterling 2012). Additionally, individual rain gauges ofa global observation network often have different lengths ofrecords which can affect the climatology, and thus SPI-baseddrought information. Alternative to rain gauges is satelliteprecipitation data, as they offer near real-time accessibility,better representation of spatial variability of precipitation,and uninterrupted measurement (Sorooshian et al 2011).Several satellite-based algorithms and products have beendeveloped to derive global precipitation estimates (e.g., Trop-ical Rainfall Measuring Mission (TRMM) MultisatellitePrecipitation Analysis (TMPA) (Huffman et al 2007); CPCMorphing Technique (CMORPH) (Joyce et al 2004); andPrecipitation Estimation from Remotely Sensed Informationusing Artificial Neural Networks (PERSIANN) (Sorooshianet al 2000, Hsu et al 1997)).
Recently, satellite precipitation data sets have been usedfor drought monitoring (Sheffield et al 2006, Paridal et al2008, Zhang et al 2008). For example, the experimentalAfrican Drought Monitor provides drought conditions usinga land-surface model trained by remotely sensed precipitationdata (Sheffield et al 2006). (Anderson et al 2008) analyseddroughts based on vegetation response using remotely sensedprecipitation data, and concluded that satellite data canimprove drought monitoring.
One limitation of the near real-time and high resolutionsatellite precipitation data sets for drought monitoring is therelatively short record of data (currently, 10–14 years). Also,the Global Precipitation Climatology Project (GPCP; Huff-man et al 1997, Adler et al 2003) provides satellite-basedgauge-adjusted precipitation data in a global scale. However,the GPCP data set is not available in real-time. In this paper,a Bayesian algorithm is used to combine real-time satellitedata sets with GPCP observations to create a long-term andnear real-time record with consistent climatology for droughtanalysis. Using the final merged product, a global data record
of the SPI is generated for the applicability of droughtmonitoring and analysis. This data set provides a basis forgreater utilization of satellite data for drought monitoring,particularly in describing the spatial extent and dependencesof drought events. It should be noted that this data set isdata-driven (satellite-based observations corrected with gaugedata), and numerical weather/climate models are not usedin its development. Therefore, this data set can be used forvalidation and verification of model outputs.
2. Data resources
In this study, the following remotely sensed precipitationproducts are used for drought analysis:
• The Global Precipitation Climatology Project (GPCP;Adler et al 2003, Huffman et al 2009) obtainedfrom merged analysis of satellite data and rain gaugemeasurements (available since 1979). The rain gauge dataused in GPCP are analysed and assembled by the ClimatePrediction Center (CPC) of the National Oceanic andAtmospheric Administration (NOAA), and by the GlobalPrecipitation Climatology Centre (GPCC) of the DeutscherWetterdienst.• The Precipitation Estimation from Remotely Sensed In-
formation using Artificial Neural Networks (PERSIANN;Sorooshian et al 2000, Hsu et al 1997), which uses a neuralnetwork classification algorithm to derive precipitationestimates based on IR data after near real-time adjustmentusing microwave scans (available since 2000).• The Tropical Rainfall Measuring Mission (TRMM)
Multisatellite Precipitation Analysis (TMPA; Huffmanet al 2007) real-time (hereafter, TRMM-RT). The TRMM-RT algorithm is mainly based on the microwave-basedestimates of precipitation with the gaps filled withInfrared-based precipitation estimates (Huffman et al2007).
3. Methodology
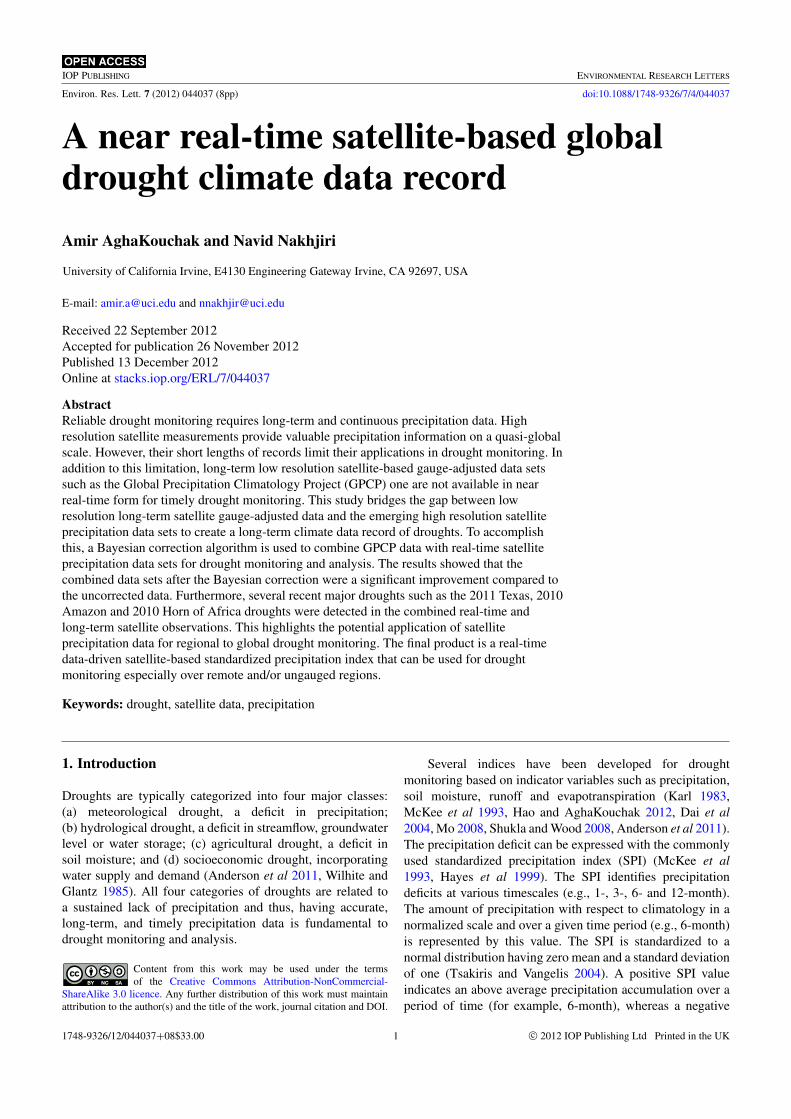
Having long-term precipitation data is fundamental to reliabledrought monitoring. The GPCP, with global coverage andlong-term monthly data, has been widely used in weather andclimate change studies. However, the data is not availablein near real-time due to post-processing needed to combineall satellite and rain gauge data sets. This issue limits theapplication of long-term satellite data to real-time droughtmonitoring. In this study, as schematically shown in figure 1,the long-term GPCP satellite data is merged with real-timesatellite estimates (here, TMPA-RT and PERSIANN) fordrought analysis using a Bayesian-based correction algorithm.In the merged data set, the climatology is driven byGPCP data, whereas the near past data (approximately 9–18months) are based on real-time satellite precipitation data(typically available to public within few hours to days afterobservation).
In a recent study, (Tian et al 2010) introduced a real-timebias adjustment method for correcting satellite data. In this
2
Environ. Res. Lett. 7 (2012) 044037 A AghaKouchak and N Nakhjiri
Figure 1. Merging GPCP and real-time (TMPA-RT andPERSIANN) data for drought analysis.
paper, a similar methodology is adopted for creating aconsistent climatology. Having both GPCP (G) and real-timesatellite data (S) for the overlap period (2000–10), onecan derive the joint probability P(G, S) using the Bayesiantheorem:
P(G|S) =P(G, S)
P(S)(1)
where G and S denote GPCP and real-time satellitedata (here, PERSIANN and TRMM-RT), respectively. Theconditional probability P(G|S) indicates the likelihood ofthe measurement G given the satellite observation S. Formore detail about this methodology, the reader is pointedto Tian et al (2010). The right hand side of the equation (1)can be computed for the overlap period (2000–10). Then,one can derive G for any S by maximizing P(Gi, Sj) usingthe maximum likelihood method. Using this approach, forthe period for which GPCP (here, G) observations are not
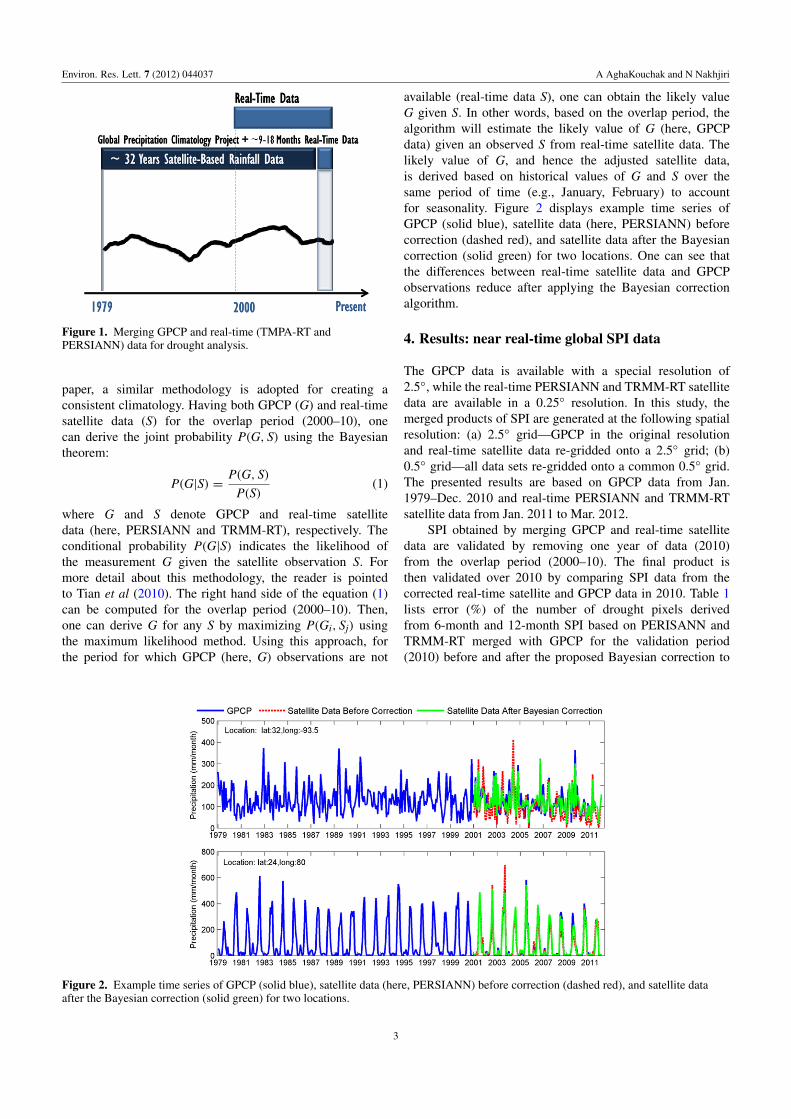
available (real-time data S), one can obtain the likely valueG given S. In other words, based on the overlap period, thealgorithm will estimate the likely value of G (here, GPCPdata) given an observed S from real-time satellite data. Thelikely value of G, and hence the adjusted satellite data,is derived based on historical values of G and S over thesame period of time (e.g., January, February) to accountfor seasonality. Figure 2 displays example time series ofGPCP (solid blue), satellite data (here, PERSIANN) beforecorrection (dashed red), and satellite data after the Bayesiancorrection (solid green) for two locations. One can see thatthe differences between real-time satellite data and GPCPobservations reduce after applying the Bayesian correctionalgorithm.
4. Results: near real-time global SPI data
The GPCP data is available with a special resolution of2.5◦, while the real-time PERSIANN and TRMM-RT satellitedata are available in a 0.25◦ resolution. In this study, themerged products of SPI are generated at the following spatialresolution: (a) 2.5◦ grid—GPCP in the original resolutionand real-time satellite data re-gridded onto a 2.5◦ grid; (b)0.5◦ grid—all data sets re-gridded onto a common 0.5◦ grid.The presented results are based on GPCP data from Jan.1979–Dec. 2010 and real-time PERSIANN and TRMM-RTsatellite data from Jan. 2011 to Mar. 2012.
SPI obtained by merging GPCP and real-time satellitedata are validated by removing one year of data (2010)from the overlap period (2000–10). The final product isthen validated over 2010 by comparing SPI data from thecorrected real-time satellite and GPCP data in 2010. Table 1lists error (%) of the number of drought pixels derivedfrom 6-month and 12-month SPI based on PERISANN andTRMM-RT merged with GPCP for the validation period(2010) before and after the proposed Bayesian correction to
Figure 2. Example time series of GPCP (solid blue), satellite data (here, PERSIANN) before correction (dashed red), and satellite dataafter the Bayesian correction (solid green) for two locations.
3
Environ. Res. Lett. 7 (2012) 044037 A AghaKouchak and N Nakhjiri
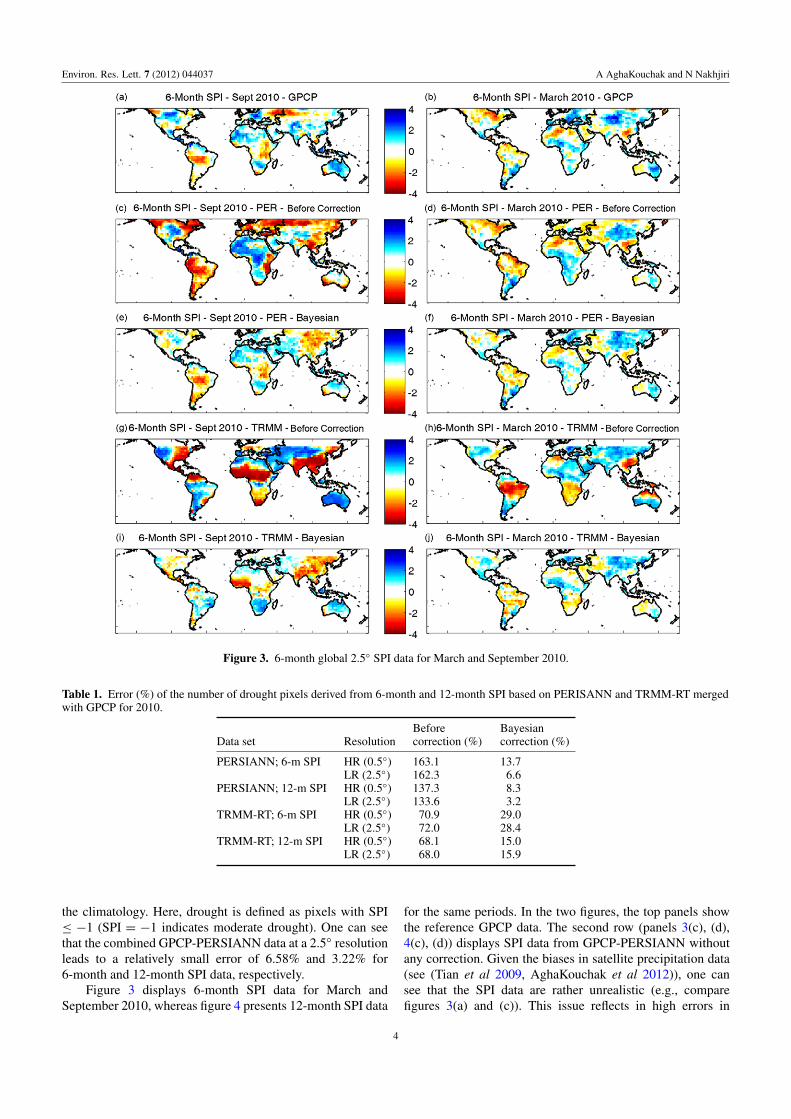
Figure 3. 6-month global 2.5◦ SPI data for March and September 2010.
Table 1. Error (%) of the number of drought pixels derived from 6-month and 12-month SPI based on PERISANN and TRMM-RT mergedwith GPCP for 2010.
Data set ResolutionBeforecorrection (%)
Bayesiancorrection (%)
PERSIANN; 6-m SPI HR (0.5◦) 163.1 13.7LR (2.5◦) 162.3 6.6
PERSIANN; 12-m SPI HR (0.5◦) 137.3 8.3LR (2.5◦) 133.6 3.2
TRMM-RT; 6-m SPI HR (0.5◦) 70.9 29.0LR (2.5◦) 72.0 28.4
TRMM-RT; 12-m SPI HR (0.5◦) 68.1 15.0LR (2.5◦) 68.0 15.9
the climatology. Here, drought is defined as pixels with SPI≤ −1 (SPI = −1 indicates moderate drought). One can seethat the combined GPCP-PERSIANN data at a 2.5◦ resolutionleads to a relatively small error of 6.58% and 3.22% for6-month and 12-month SPI data, respectively.
Figure 3 displays 6-month SPI data for March andSeptember 2010, whereas figure 4 presents 12-month SPI data
for the same periods. In the two figures, the top panels showthe reference GPCP data. The second row (panels 3(c), (d),4(c), (d)) displays SPI data from GPCP-PERSIANN withoutany correction. Given the biases in satellite precipitation data(see (Tian et al 2009, AghaKouchak et al 2012)), one cansee that the SPI data are rather unrealistic (e.g., comparefigures 3(a) and (c)). This issue reflects in high errors in
4

Environ. Res. Lett. 7 (2012) 044037 A AghaKouchak and N Nakhjiri
Figure 4. 12-month global 2.5◦ SPI data for March and September 2010.
the combined GPCP-PERSIANN data before the Bayesiancorrection (see table 1). For example, comparing NorthAmerica in figures 3(a), (c) and (e), one can see that there aremajor discrepancies between reference data (figure 3(a)) anduncorrected GPCP-PERSIANN data (figure 3(c)), especiallyover Canada. Figure 3(c)—before the Bayesian correction—shows a major drought event over northern Canada, and is notconsistent with reference observation (figure 3(a)). After theBayesian correction (figure 3(e)), the drought condition overCanada is more consistent with reference data.
As shown in figures 3(e), (f), 4(e), (f), the Bayesiancorrection leads to drought information more consistentwith the reference data (GPCP). Note that in these figures(similar to table 1), GPCP data from 2010 is eliminatedfrom the correction analysis. Figures 3(g) and (h) show6-month SPI data based on combined GPCP and TRMM-RTbefore the proposed Bayesian correction for Septemberand March 2010, respectively. Figures 3(i) and (j) present6-month SPI data based on combined GPCP and TRMM-RTafter the suggested correction. Figure 4 shows similarexamples for 12-month SPI data before and after correction,
and for both GPCP-PERSIANN and GPCP-TRMM-RT. Avisual comparison and the error values provided in table 1confirms that the Bayesian correction algorithm improvesreal-time drought monitoring by combining long-term lowresolution GPCP data with real-time high resolution satelliteobservations.
While SPI data from corrected real-time satellite data areconsistent with GPCP data, one can see discrepancies overseveral regions. For example, all data sets correctly identifythe 2010 drought of Horn of Africa (see figure 4). Also, the2010 drought of Australia has been captured in all data sets(see figures 3 and 4). However, discrepancies between SPIvalues form reference GPCP and corrected satellite data canbe observed over several regions (e.g., China). Overall, theSPI data derived from the merged GPCP-PERSIANN is ina better agreement with GPCP data for the validation period(2010). For example, the 2010 Amazon drought (Lewis et al2011, Marengo et al 2011) has been correctly identified in themerged GPCP-PERSIANN, while it does not appear in themerged TRMM-RT and GPCP (see figure 3 left panels).
5
Environ. Res. Lett. 7 (2012) 044037 A AghaKouchak and N Nakhjiri
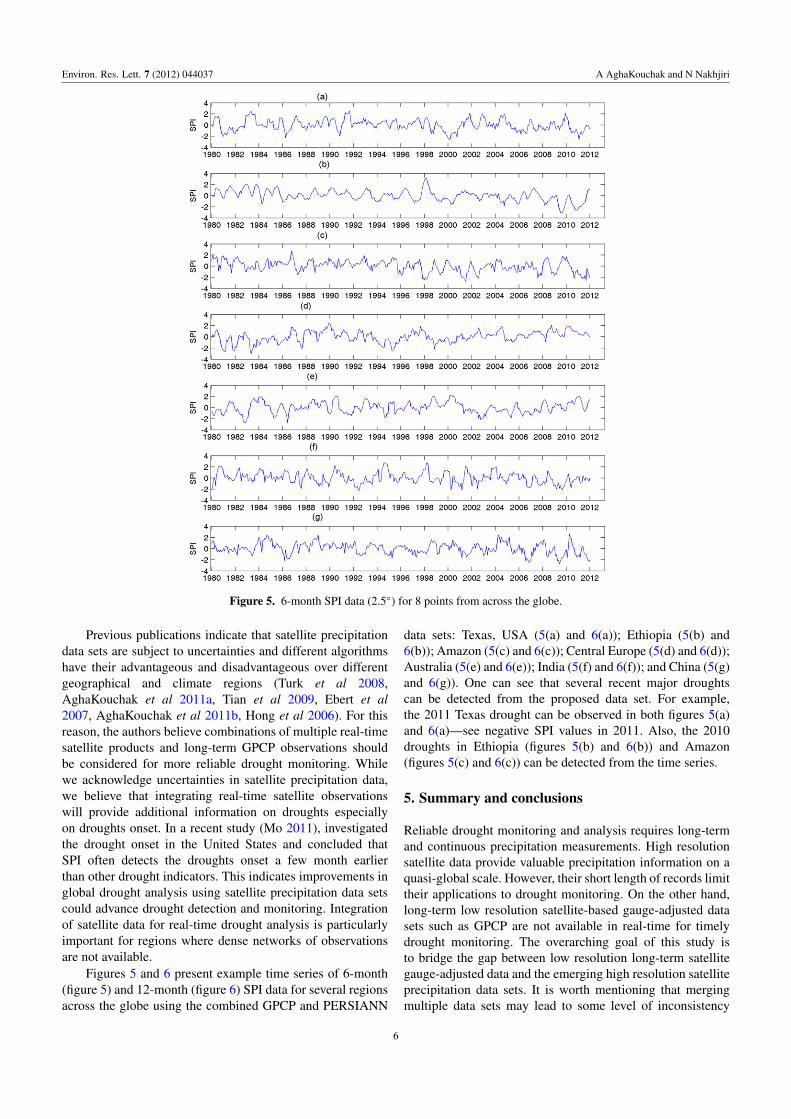
Figure 5. 6-month SPI data (2.5◦) for 8 points from across the globe.
Previous publications indicate that satellite precipitationdata sets are subject to uncertainties and different algorithmshave their advantageous and disadvantageous over differentgeographical and climate regions (Turk et al 2008,AghaKouchak et al 2011a, Tian et al 2009, Ebert et al2007, AghaKouchak et al 2011b, Hong et al 2006). For thisreason, the authors believe combinations of multiple real-timesatellite products and long-term GPCP observations shouldbe considered for more reliable drought monitoring. Whilewe acknowledge uncertainties in satellite precipitation data,we believe that integrating real-time satellite observationswill provide additional information on droughts especiallyon droughts onset. In a recent study (Mo 2011), investigatedthe drought onset in the United States and concluded thatSPI often detects the droughts onset a few month earlierthan other drought indicators. This indicates improvements inglobal drought analysis using satellite precipitation data setscould advance drought detection and monitoring. Integrationof satellite data for real-time drought analysis is particularlyimportant for regions where dense networks of observationsare not available.
Figures 5 and 6 present example time series of 6-month(figure 5) and 12-month (figure 6) SPI data for several regionsacross the globe using the combined GPCP and PERSIANN
data sets: Texas, USA (5(a) and 6(a)); Ethiopia (5(b) and6(b)); Amazon (5(c) and 6(c)); Central Europe (5(d) and 6(d));Australia (5(e) and 6(e)); India (5(f) and 6(f)); and China (5(g)and 6(g)). One can see that several recent major droughtscan be detected from the proposed data set. For example,the 2011 Texas drought can be observed in both figures 5(a)and 6(a)—see negative SPI values in 2011. Also, the 2010droughts in Ethiopia (figures 5(b) and 6(b)) and Amazon(figures 5(c) and 6(c)) can be detected from the time series.
5. Summary and conclusions
Reliable drought monitoring and analysis requires long-termand continuous precipitation measurements. High resolutionsatellite data provide valuable precipitation information on aquasi-global scale. However, their short length of records limittheir applications to drought monitoring. On the other hand,long-term low resolution satellite-based gauge-adjusted datasets such as GPCP are not available in real-time for timelydrought monitoring. The overarching goal of this study isto bridge the gap between low resolution long-term satellitegauge-adjusted data and the emerging high resolution satelliteprecipitation data sets. It is worth mentioning that mergingmultiple data sets may lead to some level of inconsistency
6

Environ. Res. Lett. 7 (2012) 044037 A AghaKouchak and N Nakhjiri
Figure 6. 12-month SPI data (2.5◦) for 8 points from across the globe.
in the climatology, since different data sets may be biasedwith respect to each other and lead to unrealistic changesin the climatology at different periods in the record. Forthis reason, methods/algorithms are necessary to create aconsistent climatology from multiple data sets. This paperintroduces a Bayesian approach for combining long-termGPCP and real-time satellite data (here, PERSIANN andTRMM-RT) to create a long-term climate data record fordrought monitoring and analysis.
The results revealed that the combined data after theBayesian correction improved significantly compared to theuncorrected data (original GPCP and real-time satellite datastitched together—see table 1). Figures 3 and 4 confirmthat the combined GPCP-PERSIANN and GPCP-TRMM-RTexhibited less error during the validation period (2010) afterimplementing the correction. Furthermore, several majordrought such as the 2011 Texas, 2010 Horn of Africa,and 2010 Amazon droughts were detected in the combinedreal-time and long-term satellite observations. This highlightsthe potential application of satellite precipitation data for nearreal-time global drought monitoring.
Currently, real-time satellite observations are availablewithin few hours to days from observation. This provides aunique opportunity to create a real-time climate data record
with monthly or weakly updates as the observations becomesavailable. We predict more efforts in future will be devotedto combining data sets from different sensors or sources tocreate long-term climate records. The authors acknowledgethat satellite data sets have biases and uncertainties thatcould affect drought analysis. Similarly, numerical modelsand even ground observations are subject to different levelsof uncertainty. Given that over many regions of the worldno other source of precipitation information is available,satellite data sets cannot be ignored. The authors argue thatthe presented data set is particularly important for droughtmonitoring over remote and/or ungauged basins.
In recent years, regional and global climate modelshave been extensively used to study droughts and theircauses. The presented observation-driven drought data ismodel-independent and can be used a validation andverification data set. Finally, climate change and its impactson extreme climate events including droughts has been thesubject of numerous studies most of which are based onclimate simulations. The presented satellite-based data setsprovide the opportunity to investigate changes in patterns andseverity of droughts over the past three decades. The entirerecord of data sets, presented in this study, (1979–present) canbe made available to interested researchers upon request.
7

Environ. Res. Lett. 7 (2012) 044037 A AghaKouchak and N Nakhjiri
Acknowledgment
The financial support for the authors of this study is madeavailable from the United States Bureau of Reclamation(USBR) Award No. R11AP81451.
References
Adler R et al 2003 The version-2 global precipitation climatologyproject (GPCP) monthly precipitation analysis (1979–present)J. Hydrometeorol. 4 1147–67
AghaKouchak A, Behrangi A, Sorooshian S, Hsu K andAmitai E 2011a Evaluation of satellite-retrieved extremeprecipitation rates across the central United States J. Geophys.Res. Atmos. 116 D02115
AghaKouchak A, Mehran A, Norouzi H and Behrangi A 2012Systematic and random error components in satelliteprecipitation data sets Geophys. Res. Lett. 39 L09406
AghaKouchak A, Nasrollahi N, Li J, Imam B andSorooshian S 2011b Geometrical characterization ofprecipitation patterns J. Hydrometeorol. 12 274–85
Anderson L, Malhi Y, Aragao L and Saatchi S 2008 Spatial patternsof the canopy stress during 2005 drought in amazonia IGARSS2007: 2007 IEEE Int. Geoscience and Remote Sensing Symp.pp 2294–7
Anderson M C, Hain C, Wardlow B, Pimstein A,Mecikalski J R and Kustas W P 2011 Evaluation of droughtindices based on thermal remote sensing of evapotranspirationover the continental United States J. Clim. 24 2025–44
Dai A, Trenberth K and Qian T 2004 A global dataset of PalmerDrought Severity Index for 1870–2002: relationship with soilmoisture and effects of surface warming J. Hydrometeorol.5 1117–30
Easterling D 2012 Global data sets for analysis of climate extremesExtremes in a Changing Climate: Detection, Analysis andUncertainty ed A AghaKouchak, D Easterling, K Hsu,S Schubert and S Sorooshian (Berlin: Springer) (doi:10.1007/978-94-007-4479-012)
Ebert E, Janowiak J and Kidd C 2007 Comparison of near real timeprecipitation estimates from satellite observations andnumerical models Bull. Am. Meteorol. Soc. 88 47–64
Gonzalez J and Valdes J B 2006 New drought frequency index:definition and comparative performance analysis WaterResources Res. 42 W11421
Hao Z and AghaKouchak A 2012 A multivariate multi-indexdrought modeling framework J. Hydrometeorol. under review
Hayes M, Svoboda M, Wall N and Widhalm M 2011 The Lincolndeclaration on drought indices: universal meteorologicaldrought index recommended Bull. Am. Meteorol. Soc.92 485–8
Hayes M, Svoboda M, Wilhite D and Vanyarkho O 1999Monitoring the 1996 drought using the standardizedprecipitation index Bull. Am. Meteor. Soc. 80 429–38
Hong Y, Hsu K, Moradkhani H and Sorooshian S 2006 Uncertaintyquantification of satellite precipitation estimation and MonteCarlo assessment of the error propagation into hydrologicresponse Water Resources Res. 42 W08421
Hsu K, Gao X, Sorooshian S and Gupta H 1997 Precipitationestimation from remotely sensed information using artificialneural networks J. Appl. Meteorol. 36 1176–90
Huffman G, Adler R, Arkin P, Chang A, Ferraro R, Gruber A,Janowiak J, McNab A, Rudolf B and Schneider U 1997 Theglobal precipitation climatology project (GPCP) combinedprecipitation dataset Bull. Am. Meteorol. Soc. 78 5–20
Huffman G, Adler R, Bolvin D, Gu G, Nelkin E, Bowman K,Stocker E and Wolff D 2007 The TRMM multi-satelliteprecipitation analysis: quasi-global, multiyear,combined-sensor precipitation estimates at fine scaleJ. Hydrometeorol. 8 38–55
Huffman G J, Adler R F, Bolvin D T and Gu G 2009 Improving theglobal precipitation record: GPCP version 2.1 Geophys. Res.Lett. 36 L17808
Joyce R, Janowiak J, Arkin P and Xie P 2004 CMORPH: a methodthat produces global precipitation estimates from passivemicrowave and infrared data at high spatial and temporalresolution J. Hydrometeorol. 5 487–503
Karl T 1983 Some spatial characteristics of drought duration in theUnited States J. Clim. Appl. Meterol. 22 1356–66
Lewis S L, Brando P M, Phillips O L, van der Heijden G M F andNepstad D 2011 The 2010 Amazon drought Science 331 554
Marengo J A, Tomasella J, Alves L M, Soares W R andRodriguez D A 2011 The drought of 2010 in the context ofhistorical droughts in the Amazon region Geophys. Res. Lett.38 L12703
McKee T, Doesken N and Kleist J 1993 The relationship of droughtfrequency and duration to time scales Proc. 8th Conf. ofApplied Climatology (Jan. 1993) (Anaheim, CA: AmericanMeteorological Society) pp 179–84
Mo K 2008 Model based drought indices over the United StatesJ. Hydrometeorol. 9 1212–30
Mo K C 2011 Drought onset and recovery over the United StatesJ. Geophys. Res. Atmos. 116 D20106
Paridal B R, Collado W B, Borah R, Hazarika M K andSarnarakoon L 2008 Detecting drought-prone areas of riceagriculture using a modis-derived soil moisture index GISci.Remote Sens. 45 109–29
Santos J F, Pulido-Calvo I and Portela M M 2010 Spatial andtemporal variability of droughts in Portugal Water ResourcesRes. 46 W03503
Sheffield J, Goteti G and Wood E 2006 Development of a 50-yr,high resolution global dataset of meteorological forcings forland surface modeling J. Clim. 13 3088–111
Shukla S and Wood A 2008 Use of a standardized runoff index forcharacterizing hydrologic drought Geophys. Res. Lett.35 L02405
Sorooshian S et al 2011 Advanced concepts on remote sensing ofprecipitation at multiple scales Bull. Am. Meteorol. Soc.92 1353–7
Sorooshian S, Hsu K, Gao X, Gupta H, Imam B andBraithwaite D 2000 Evolution of the PERSIANN systemsatellite-based estimates of tropical rainfall Bull. Am. Meteorol.Soc. 81 2035–46
Tian Y, Peters-Lidard C D and Eylander J B 2010 Real-time biasreduction for satellite-based precipitation estimatesJ. Hydrometeorol. 11 1275–85
Tian Y, Peters-Lidard C, Eylander J, Joyce R, Huffman G, Adler R,Hsu K, Turk F, Garcia M and Zeng J 2009 Component analysisof errors in satellite-based precipitation estimates J. Geophys.Res. 114 D24101
Tsakiris G and Vangelis H 2004 Towards a drought watch systembased on spatial SPI Water Resources Manag. 18 1–12
Turk F J, Arkin P, Ebert E E and Sapiano M R P 2008 Evaluatinghigh-resolution precipitation products Bull. Am. Meteorol. Soc.89 1911–6
WCRP 2010 A WCRP white paper on drought predictability andprediction in a changing climate: assessing current predictiveknowledge and capabilities, user requirements and researchpriorities Technical Report (Geneva: World Climate ResearchProgramme)
Wilhite D and Glantz M 1985 Understanding the droughtphenomenon: the role of definitions Water Int. 10 111–20
WMO 2009 Inter-Regional Workshop on Indices and Early WarningSystems for Drought (Lincoln, NE, Dec. 2009) (Geneva: WorldMeteorological Organization)
Zhang R, Su H, Tian J, Li Z, Chen S, Zhan J, Deng X, Sun X andWu J 2008 Drought monitoring in northern China based onremote sensing data and land surface modeling IGARSS 2008:2008 IEEE Int. Geoscience and Remote Sensing Symp.vol 3 pp III:860–3
8