Embed Size (px)
Citation preview

MultiCraft
International Journal of Engineering, Science and Technology
Vol. 2, No. 9, 2010, pp. 25-38
INTERNATIONAL
JOURNAL OF
ENGINEERING,
SCIENCE AND
TECHNOLOGY
www.ijest-ng.com
2010 MultiCraft Limited. All rights reserved
A multiple choice decision analysis: an integrated QFD – AHP model for the
assessment of customer needs
F. De Felice
1, A. Petrillo
2*
1Department of Mechanism, Structures and Environment, University of Cassino, Faculty of Engineering, ITALY 2* Department of Mechanism, Structures and Environment, University of Cassino, Faculty of Engineering, ITALY
*Corresponding Author: e-mail: [email protected], Tel +39-0776-2994350, Fax.+39-0776-2994349
Abstract
The aim of this work is to propose a new methodological approach to define customer specifications through the employment
of an integrated Quality Function Deployment (QFD) – Analytic Hierarchy Process (AHP) model. The model, which is loosely
based on QFD, incorporates the AHP approach to delineate and rank the relative importance weight of expressed judgments for
customer needs and functional characteristics. The Analytic Hierarchy Process is very useful for this aim because it is a
mathematically rigorous, proven process for prioritization and decision-making. By reducing complex decisions to a series of
pair-wise comparisons, then synthesizing the results, decision-makers arrive at the best decision with a clear rationale for that
decision. The methodology adopted in this work is directed to evaluate as well as rank the definition of the customer’s needs and
functional characteristics among several alternatives. The approach has been validated in a real case study concerning the filter
in ceramic material production.
Keywords: Quality Function Deployment, Analytic Hierarchy Process, Multi Criteria Decision Analysis. 1. Introduction
The aim of this study is to propose a new methodological approach to state the functional characteristics of a ceramic filter in
order that it might be competitive as regards performance and price. Owing to this aim, the application of the QFD-AHP seemed to
be a very good approach to improve the definition of the customers’ needs during the planning phase. Once established a
consistent and finite set of functions it is essential to define a hierarchy of importance to determine the criticality of each one,
proportional to the function for the customer. We therefore defined an algorithm that, by direct comparison of functions can define
a prioritized list that is objective, scientific and unique. In this, AHP is very useful because it is an algorithm that helps to solve
decision problems such as MCDA - Multiple Choice Decision Analysis (Saaty, 2005). There are many MCDA methods that have
been developed such as ELECTRE, TOPSIS, AHP, etc., but these methods do not consider the interdependence among criteria and
alternatives (Lin et al., 2008). Contrarily to other methods, AHP, given a number n of functions, allows to define the importance
for customers through a direct and objective value of each function and of all the others. This occurs within a matrix of assessment
in which the functions appear on both axes.
We note that the risk usually involved in industrial programmes is not always caused by the possibility of technical unsuccess,
but by the probability of obtaining a result that, although scientifically valid, might not be worthwhile for the customer (De Felice,
Petrillo, 2009). Thus, the new methodological approach allows to pilot effectively all the variables concurring in the process of
generation of the ―value‖ of the product, so as to obtain both the customer’s approval and the control of costs. The QFD – AHP
method is very flexible and allows to analyse any customer’s requirement with impartiality and effectiveness. In particular, it
permits to identify the customer’s actual ―needs‖ and to focus the technical activity on the output much more in demand.
Therefore, it is possible to establish the priority characteristics of the output on an objective basis. As a consequence, the operating
units taking part in the project can firstly identify the technical strategies for the achievement of each output, and afterwards assess
the needs and thus plan the activities. At the end of our study the company set up an instrument permitting it to take part, with its
home and foreign customers, in the development of the products with the consequent reduction in times and costs. The paper is

De Felice et al./ International Journal of Engineering, Science and Technology, Vol. 2, No. 9, 2010, pp. 25-38
26
organized as follows: in section 2, the survey of existing literature about integration on QFD – AHP is analyzed, the process
production of a ceramic filter is described in section 3, QFD and AHP theoretical basis are analyzed in section 4. Finally the model
and the case study are proposed in section 5.
2. Survey of existing literature about integration on QFD - AHP
Due to its wide applicability and ease of use, the Analytic Hierarchy Process (AHP) has been studied extensively for the last 20
years. Recently, it has been observed that focus has been confined to the applications of the integrated AHPs rather than the stand-
alone AHP (Ho, 2008). The five tools that are commonly combined with the AHP include mathematical programming, quality
function deployment (QFD), meta-heuristics, SWOT analysis, and data envelopment analysis (DEA).
In our study we would like to focus attention on QFD-AHP integration. QFD determines product design specifications (hows)
based on customer needs (whats) and competitive analysis (whys), which represent a customer-driven and market-oriented process
for decision-making. It is quite natural to use QFD in this field for purposes such as determining customer needs and development
priorities. Essentially, QFD has been widely applied to the major aspects of decision-making: measurement,
selection/determination, and evaluation. In particular, we analyzed some works during 1998-2009. Major applications concern:
Higher education sectors, Manufacturing sectors, Military sectors, Logistics sectors, Sports sectors with particular attention to:
Education requirement selection, Teaching method selection, Product design selection, Capital budgeting project selection,
Peacekeeping force composition selection, Multi-functional team selection, Facility location selection, Game rule selection, Robot
selection, Rapid tooling process selection, Tourism, Competitive benchmarking (Köksal and Eğitman, Lam and Zhao, 1998;
Partovi, 1999; Chuang, 2001; Hsiao, Kwong and Bai, 2002; Bhattacharya et al., 2005; Hanumaiah et al., 2006; Dan et al. 2007; Lin
et. al., 2008; Li et al., 2009). Recently, also Ho (2008) proposed that the combination of AHP and QFD is one of the most
commonly used techniques to deal with incomplete and imprecise information in customer requirements.
In Table 1 a synthetic report about major applications is shown. Of course analysis is not exhaustive, but it is representative.
Table 1. Synthetic report about major applications on QFD-AHP
Year Author/s Applications
1998 Köksal and Eğitman
Lam and Zhao
Köksal and Eğitman applied the combined AHP–QFD approach to improve the
education quality and to identify appropriate teaching techniques. The
alternative teaching techniques were prioritized based on the AHP weightings
and the relationship between students’ requirements and teaching techniques.
1999 Partovi Applied the combined AHP–QFD approach to aid the project selection. The
author used the AHP to quantify the strength of the relationships between rows
(e.g., customer requirements) and columns (e.g., design specifications), instead
of evaluate the relative importance weightings of decision alternatives.
2001 Chuang Applied the combined AHP–QFD approach to deal with the facility location
problem. The AHP was applied again to determine the relative importance
weightings of alternative locations with respect to each evaluating criterion. A
location with the total highest score was selected.
2002 Hsiao
Kwong and Bai
Used the combined AHP–QFD approach to aid the new product development.
The AHP was used to obtain the relative importance weightings of the criteria.
2005 Bhattacharya et al. Applied the combined AHP–QFD approach to aid the robot selection. The AHP
was adopted to evaluate the relative importance weighting of each robot based
on the technical requirements. The robot with the highest score was selected.
2006 Hanumaiah et al. Presented the combined AHP–QFD approach to deal with the rapid tooling
process selection. The AHP was adopted to determine the relative importance
weightings of the tooling or customer requirements while considering
constraints, such as material, geometric features, die material, and production
quantity.
2007 Das et al. Developed an AHP-QFD framework for designing a tourism product, which
takes care of the touristic needs of tourists.
2008 Lin et al. Evaluated the relative overall importance of customer requirements and design
characteristics.
2009 Li et al. Combining rough set theory, Kano’s model, analytical hierarchy process (AHP),
and scale method, an integrated method is proposed to obtain the final
importance of customer requirements (CRs) in product planning house of
quality (PPHOQ).

De Felice et al./ International Journal of Engineering, Science and Technology, Vol. 2, No. 9, 2010, pp. 25-38
27
Some papers (Partovi, 1999) have applied the ANP combined with the QFD to handle MCDM problems, but they do not entirely
utilize the AHP in their models. Our proposed method completely utilizes all natures of the AHP to make all paired comparisons
based on Saaty’s nine-point scale to evaluate the customer’s needs and functional characteristics among several alternatives.
The use of AHP is favorable because the AHP provides an effectual method to cope with complex MCDM matters. The AHP
has advantages such as: it handles human intuitive judgment by making paired comparisons with a ratio scale. In other words, the
AHP adds benefits in that it can capture priorities using natural language comparisons and converts them into ratio scale numbers.
3. Filters in ceramic material: Process description
The filter market is divided into sections defined by the different functions of the use of the product (the filters, in fact, can be
used: to catalyze, to filter aluminium alloys or treat them from fused to filter metals, to filter air at high temperatures, as insulators
for high temperatures, as heat exchangers, in fire-blockings, in water treatments, etc) and by various types of users (De Felice,
Falcone, 1999). Within such a variegated framework the company has focused on ceramic foam filters, because, compared to the
traditional ones, they allow to obviate some disadvantages, such as:
Encumbrance.
High energy consumption.
Insufficient operating flexibility.
Limited productivity due to the dead times of change of the filter bed.
The filtering system suggested by the company employs a ceramic foam as filtering element with a continuous net of pores. It is a
structure showing the following characteristics:
Resistance to high temperatures.
Low specific weight.
Resistance to chemical attacks and winding flows.
High porosity.
Thanks to these properties, the ceramic foam with open pores can satisfy various types of demands for different uses. Besides, the
structure of the ceramic foam can be ―thin‖ or ―thick‖ according to the number of pores per linear inch.(p.p.i.). The factory
produces ceramic foams varying from a size of 10 pores per inch to 100 p.p.i. and over. The production technique of the ceramic
foam filters is simple. In fact, a polyurethane foam with open pores is used as a base of the filter. The foam is soaked with a watery
alumina pulp. The overplus of alumina is sqeezed so that the foam may result completely covered. With a drying process the water
is eliminated from the foam, which decomposes later, at the stated temperature, leaving a ceramic copy of the original organic
foam. The filter production process consists of:
1. Production of sheets of polyurethane.
2. Wash sponge.
3. Impasto preparation.
4. First dip sponge.
5. Preliminary drying.
6. Second dip sponge.
7. Second drying.
8. Cooking Filter.
9. Packaging.
4. Theoretical Basis: Quality Function Deployment and Analytic Hierarchy process
In this paper, we employ a combined QFD and AHP approach to develop an effective decision-making method to help make
better decisions for planning or evaluation problems (Chin et. al., 2009). Both QFD and AHP are the comprehensive decision-
making method that provides a means of coping with complex MCDM matters. The QFD is an overall concept that provides a
means of translating customer requirements into the appropriate technical requirements for each stage of product development and
production. The QFD methodology can be used for both tangible products and non-tangible services, including manufactured
goods, service industry, software products, IT projects, business process development, government, healthcare, environmental
initiatives, and many other applications. The AHP is a MCDM method used to derive relative priority from individual judgments,
which can deal with all kinds of interactions systematically (Chan et. al, 2002). In this section we will briefly explain the
traditional QFD and AHP framework.
4.1 Quality Function Deployment Approach: In this section we will briefly explain the traditional QFD framework as it is
commonly discussed in the quality management literature. The birth of QFD can be placed around 1972, when Takayanagi
Nishimura and his engineers presented a quality chart for a shipyard in Kobe in Japan. The aim of QFD is to translate the customer
requirements to the product requirement (Juran, 1993). In other words, QFD is a tool for transforming the ―Voice of customer‖ to
De Felice et al./ International Journal of Engineering, Science and Technology, Vol. 2, No. 9, 2010, pp. 25-38
28
product design (Cohen, 1995). As experiment they used a matrix in which customer needs were reported in lines and methods to
satisfy them in columns. The idea was that the matrix must gradually fill on the basis of extensive discussions between Marketing
Manager, Design Manager and Production Manager. This collaboration is the fundamental difference between QFD and previous
methods. Two years later, Professor Yoji Akao founded and directed a Research Committee on QFD (Akao, 2003). He oversaw
the dissemination of QFD as a technique for improving the transition from design to production. We define the Quality Function
Deployment (QFD) tool for the development of products starting from customer needs, resulting in a systematic technical
specifications which are a guide to manufacturing activities. QFD translates customer requirements into appropriate specifications
within the company in each of its functional areas, from research and development to engineering, manufacturing, distribution,
sales and service. The logical process that underlies the development of new products with the QFD can be enclosed in a matrix, to
describe it briefly, we refer to the matrix of quality (one fundamental matrix of QFD) called House of Quality. This matrix has the
appearance of a tiled roof, hence the name ―house of quality‖(Chen, 2009).
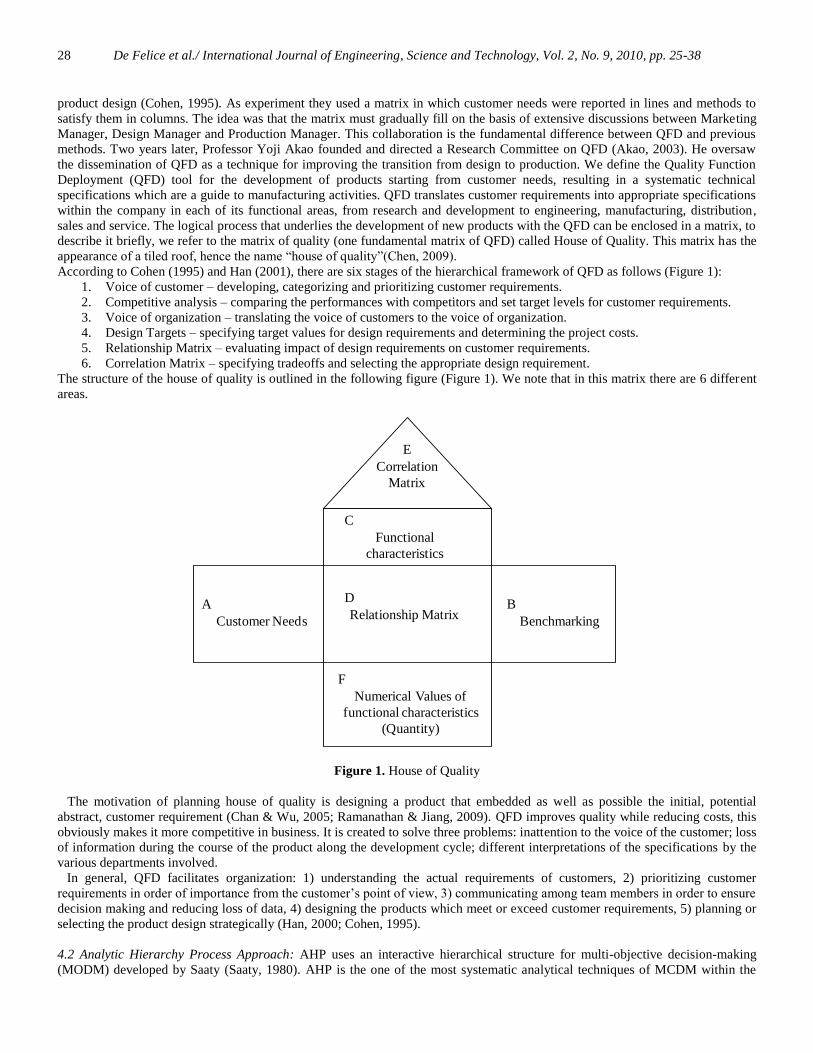
According to Cohen (1995) and Han (2001), there are six stages of the hierarchical framework of QFD as follows (Figure 1):
1. Voice of customer – developing, categorizing and prioritizing customer requirements.
2. Competitive analysis – comparing the performances with competitors and set target levels for customer requirements.
3. Voice of organization – translating the voice of customers to the voice of organization.
4. Design Targets – specifying target values for design requirements and determining the project costs.
5. Relationship Matrix – evaluating impact of design requirements on customer requirements.
6. Correlation Matrix – specifying tradeoffs and selecting the appropriate design requirement.
The structure of the house of quality is outlined in the following figure (Figure 1). We note that in this matrix there are 6 different
areas.
C
Functional
characteristics
B
Benchmarking
D
Relationship MatrixA
Customer Needs
F
Numerical Values of
functional characteristics
(Quantity)
E
Correlation
Matrix
Figure 1. House of Quality
The motivation of planning house of quality is designing a product that embedded as well as possible the initial, potential
abstract, customer requirement (Chan & Wu, 2005; Ramanathan & Jiang, 2009). QFD improves quality while reducing costs, this
obviously makes it more competitive in business. It is created to solve three problems: inattention to the voice of the customer; loss
of information during the course of the product along the development cycle; different interpretations of the specifications by the
various departments involved.
In general, QFD facilitates organization: 1) understanding the actual requirements of customers, 2) prioritizing customer
requirements in order of importance from the customer’s point of view, 3) communicating among team members in order to ensure
decision making and reducing loss of data, 4) designing the products which meet or exceed customer requirements, 5) planning or
selecting the product design strategically (Han, 2000; Cohen, 1995).
4.2 Analytic Hierarchy Process Approach: AHP uses an interactive hierarchical structure for multi-objective decision-making
(MODM) developed by Saaty (Saaty, 1980). AHP is the one of the most systematic analytical techniques of MCDM within the
De Felice et al./ International Journal of Engineering, Science and Technology, Vol. 2, No. 9, 2010, pp. 25-38
29
framework of operational research techniques that facilitates a rigorous definition of priorities and preferences of DMs. The AHP
consists of three main operations, including hierarchy construction, priority analysis and consistency verification.
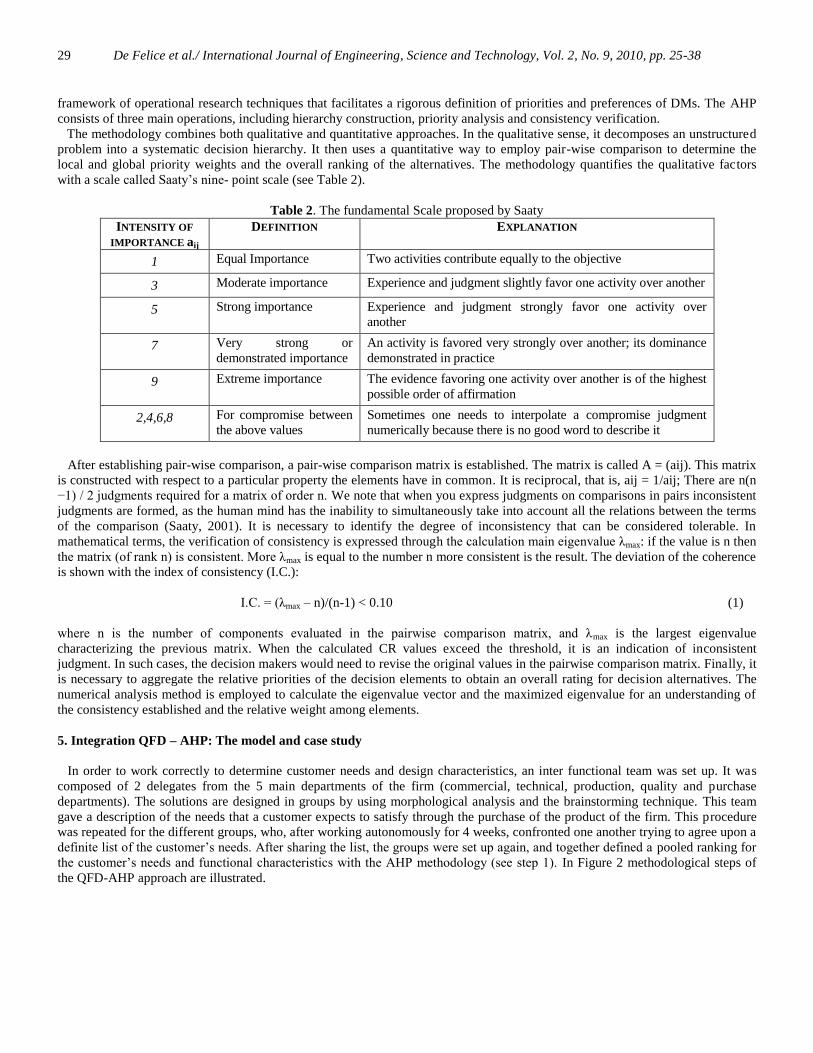
The methodology combines both qualitative and quantitative approaches. In the qualitative sense, it decomposes an unstructured
problem into a systematic decision hierarchy. It then uses a quantitative way to employ pair-wise comparison to determine the
local and global priority weights and the overall ranking of the alternatives. The methodology quantifies the qualitative factors
with a scale called Saaty’s nine- point scale (see Table 2).
Table 2. The fundamental Scale proposed by Saaty
INTENSITY OF
IMPORTANCE aij
DEFINITION EXPLANATION
1 Equal Importance Two activities contribute equally to the objective
3 Moderate importance Experience and judgment slightly favor one activity over another
5 Strong importance Experience and judgment strongly favor one activity over
another
7 Very strong or
demonstrated importance
An activity is favored very strongly over another; its dominance
demonstrated in practice
9 Extreme importance The evidence favoring one activity over another is of the highest
possible order of affirmation
2,4,6,8 For compromise between
the above values
Sometimes one needs to interpolate a compromise judgment
numerically because there is no good word to describe it
After establishing pair-wise comparison, a pair-wise comparison matrix is established. The matrix is called A = (aij). This matrix
is constructed with respect to a particular property the elements have in common. It is reciprocal, that is, aij = 1/aij; There are n(n
−1) / 2 judgments required for a matrix of order n. We note that when you express judgments on comparisons in pairs inconsistent
judgments are formed, as the human mind has the inability to simultaneously take into account all the relations between the terms
of the comparison (Saaty, 2001). It is necessary to identify the degree of inconsistency that can be considered tolerable. In
mathematical terms, the verification of consistency is expressed through the calculation main eigenvalue λmax: if the value is n then
the matrix (of rank n) is consistent. More λmax is equal to the number n more consistent is the result. The deviation of the coherence
is shown with the index of consistency (I.C.):
I.C. = (λmax – n)/(n-1) < 0.10 (1)
where n is the number of components evaluated in the pairwise comparison matrix, and λmax is the largest eigenvalue
characterizing the previous matrix. When the calculated CR values exceed the threshold, it is an indication of inconsistent
judgment. In such cases, the decision makers would need to revise the original values in the pairwise comparison matrix. Finally, it
is necessary to aggregate the relative priorities of the decision elements to obtain an overall rating for decision alternatives. The
numerical analysis method is employed to calculate the eigenvalue vector and the maximized eigenvalue for an understanding of
the consistency established and the relative weight among elements.
5. Integration QFD – AHP: The model and case study
In order to work correctly to determine customer needs and design characteristics, an inter functional team was set up. It was
composed of 2 delegates from the 5 main departments of the firm (commercial, technical, production, quality and purchase
departments). The solutions are designed in groups by using morphological analysis and the brainstorming technique. This team
gave a description of the needs that a customer expects to satisfy through the purchase of the product of the firm. This procedure
was repeated for the different groups, who, after working autonomously for 4 weeks, confronted one another trying to agree upon a
definite list of the customer’s needs. After sharing the list, the groups were set up again, and together defined a pooled ranking for
the customer’s needs and functional characteristics with the AHP methodology (see step 1). In Figure 2 methodological steps of
the QFD-AHP approach are illustrated.

De Felice et al./ International Journal of Engineering, Science and Technology, Vol. 2, No. 9, 2010, pp. 25-38
30
Definition of correlations
Definition of quantity
START
FINISH
Development of House of Quality
Team of Experts Definition
Benchmarking
Prioritize alternative
Definition of a New
QFD Method
STEP 1
STEP 2
QFD-AHP framework
Results
STEP 3
AHP framework
QFD framework
Definition of relations
Definition of functional
characteristics
Definition of customer’s nees
AHP – Pairwaise comparison
matrix
Figure 2. Methodological steps of QFD-AHP approach
Step 1: Prioritize Alternatives. The team of experts defined with the help of the AHP methodology the needs and functional
characteristics that a customer expects to satisfy through the purchase of the product of the firm. Using AHP a sample question
used here would be ―How much more important is Certification than Cost of raw material with respect to the Functional
characteristics?‖ The outcome of this evaluation is a set of weights representing the relationships between elements. The result of
this work is shown in the following Table 3 and Table 4.
Table 3. AHP priority vector for customer’s needs
Customer’s need Identification Code of Customer’s needs AHP Priority vector - weight Order
Filtering power A 0.28 1°
Capacity of regulating the flow B 0.22 3°
Lifetime C 0.23 2°
Dimensional specification of coupling D 0.05 5°
Product certified E 0.12 4°
Competitive price F 0.07 6°
Table 4. AHP priority vector for functional characteristics
Functional features Identification Code of
Customer’s needs
AHP Priority vector -
weight
Order
Filtering degree A 0.08 5°
Thermic resistance B 0.10 4°
Mechanical resistance C 0.21 2°
Dimension D 0.19 3°
Certification E 0.35 1°
Cost of raw materials F 0.04 6°

De Felice et al./ International Journal of Engineering, Science and Technology, Vol. 2, No. 9, 2010, pp. 25-38
31
Step 2: Definition of a new QFD method of aid for the creation of the correlation matrix. Then, through the application of the QFD
a complete and appropriate transfer of the needs which pointed out into measurable functional characteristics was established, so
as to make a table, in which these functional characteristics are compared with the simple needs of the customer. Therefore 3
degrees of correlation are established conventionally by suitable factors: 3= strong; 2= average; 1= weak. If there are no
connections, the corresponding crossings in the matrix are left empty. The correlation factors and the allotment of the priorities to
the requisites allowed to establish a classification of the characteristics according to their importance (Figure 3).
Figure 3. Correlation matrix
The functional characteristics are still a matter for the realization of another table; the correlations between these characteristics
are pointed out by using suitable factors (Figure 4).

De Felice et al./ International Journal of Engineering, Science and Technology, Vol. 2, No. 9, 2010, pp. 25-38
32
FIL
TE
RIN
G D
EG
RE
E
TH
ER
MIC
RE
SIS
TA
NC
E
Mec
ha
ica
l R
esi
sta
nc
e
DIM
EN
SIO
N
CE
RT
IFIC
AT
ION
Co
st o
f R
aw
Mate
ria
l
C1 C2 C3 C4 C5 C6
Figure 4. Correlations between functional characteristics
In order to make the definition of the correlations among the different functional requisites pointed out as objective as possible,
we set up a system to express the correlation table automatically, making the planner intervene only when necessary to establish
the ―sign‖ of the correlations themselves. Before going on with the description of the algorithm, it is necessary to define the terms
―correlation‖ and ―sign‖ of the correlations. Within the QFD, two functional characteristics are said to be correlated if the
variations of the values of one cause changes in the values of the other and viceversa. and, on the contrary, the sign of such
correlations is positive, if to the ―positive‖ variations of one correspond ―positive‖ changes of the other, ―negative‖ if otherwise. In
order to define the relations existing (induced by the requisites) between functional characteristics, it is necessary to take into
consideration the Relationship Matrix R (House of Quality – area D). Here below is Relationship Matrix R (figure 5):
312220
030000
003000
020330
022213
021223
R
Figure 5. Relationship Matrix R
It is also necessary take into consideration all the vectors (Matrix B) taken together in bi column (each combined with a well
defined functional characteristic expressed in the matrix of the relations R). Here below is Matrix B (Figure 6):
B
1 1 1 1 1 0
1 1 1 1 1 0
0 1 1 0 1 0
0 0 0 1 0 0
0 0 0 0 1 0
0 1 1 1 1 1
Figure 6. B Matrix

De Felice et al./ International Journal of Engineering, Science and Technology, Vol. 2, No. 9, 2010, pp. 25-38
33
The elements of the vectors bi (= 1,….,n) have been defined starting from Relationship Matrix R in the following manner
(Equation 2):
i,j if rij= “3” or “2” or “1”, then bij = 1 (2)
Thus, from R matrix, we then pass to a B binary matrix, whose bi columns are afterwards standardized in order to make their
interpretation easier, so as to obtain a new set of vi vectors (=1,…,n) which define a new N matrix (Figure 7):
N
1
2
1
2
1
2
1
2
1
50
1
2
1
2
1
2
1
2
1
50
01
2
1
20
1
50
0 0 01
20 0
0 0 0 01
50
01
2
1
2
1
2
1
51
Figure 7. N Matrix
To represent the effects of the dependence between the i-nth and the j-nth characteristics, we introduce the note qij (Equation 3):
qij= vi vj= cos (vi, vj) ij= 1,…,n (3)
Effecting the calculation of qij for all the vector couples of N matrix, it is possible to determine the matrix of the dependences of
the Q characteristics: Q= N NT (Q is a symmetrical matrix with qij=qji; i=j=1,…, n). The Q matrix expresses the degree of
dependence induced between functional characteristics with reference to how they influence the customer’s requisites. It is
interesting to note that the determination of the Q matrix also permits to underline the presence of columns and /or lines without
relations respectively with other lines and/or columns of the same matrix, marked by the appearance of some ―zeros‖ along the
principal diagonal of the matrix. For the ―filling up‖ of the roof of the ―house of quality‖, the information contained in Q is
compared with a K predefined threshold (with 0 < k < 1); ij if qij > k the existence of a potential correlation between the j-nth
and i-nth characteristics is accepted, otherwise it is considered inexistent. The Q matrix obtained is the following (Figure 8):
Figure 8. Q Matrix
As the table confirms, the Q matrix is really symmetrical. In the table the values of q ij > k are also pointed out, since, in this
particular case, a threshold value of K= 0.7 has been fixed. After establishing and pointing out the couples of characteristics whose
degree of dependence induced is superior to the K threshold, it is necessary to estimate the real consistency of the dependence and
transfer it into a correlation, defining its positive or negative ―sign‖. So, in this particular case, all the dependences are transferred
into a correlation, except the couple C1,C3 which is rejected since it does not possess the necessary requisites. Finally, semantic
correlations must be added to all dependences, defined on the base of quality reasoning. The whole of the correlations identified
defines the roof of the house of quality (Figure 9).
C1 C2 C3 C4 C5 C6
C1 1 0,71 0,71 0,71 0,63 0
C2 0,71 1 1 0,75 0,89 0,5
Q= C3 0,71 1 1 0,75 0,89 0,5
C4 0,71 0,75 0,75 1 0,67 0,5
C5 0,63 0,89 0,89 0,67 1 0,45
C6 0 0,5 0,5 0,5 0,45 1

De Felice et al./ International Journal of Engineering, Science and Technology, Vol. 2, No. 9, 2010, pp. 25-38
34
Figure 9. Identification of the roof of the house
Step 3: Benchmarking and Results. Benchmarking started by appraising the ranges of the functional specifications (Table 5).
Table 5. Ranges of the functional specifications
FU
NC
TIO
NA
L C
HA
RA
CT
ER
IST
ICS
FIL
TE
RIN
G D
EG
RE
E
TH
ER
MIC
RE
SIS
TA
NC
E
ME
CH
AN
ICA
L R
ES
IST
AN
CE
DIM
EN
SIO
N
UNITS p.p.i. °C n°utilizations mm
width length height
10-20 730-750 1 10-33 10-25 2-3
20-30 750-760 2 33-50 25-33 3-12
30-80 760-780 50-66 33-50 12-15
80-90 780-800 66-70 50-66 15-20
90-100 800-1000 70-75 66-70 20-22
100-150 1000-1050 75-80 70-75 22-23
1050-1100 80-81 75-80
1100-1150 81-90 80-81
1150-1200 90-99 81-90
1200-1250 99-100 90-99
1250-1300 99-100
1300-1320 100-114
1320-1360 114-200
1360-1380
1380-1400
1400-1440
1440-1460
1460-1500
RA
NG
E o
f F
UN
CT
ION
AL
SP
EC
IFIC
AT
ION
S

De Felice et al./ International Journal of Engineering, Science and Technology, Vol. 2, No. 9, 2010, pp. 25-38
35
In order to verify the quality of the specifications of the project, a scheme was made which lets allot its value to every project
under examination. The project characteristics defined for the Project A (our company) and for Project B (a firm leader in the field
of filters) are reported in Table 6.
Table 6. Project evaluation table (C.F. = Functional Characteristics – R.S.F. = Ranges of functional specifications)
weight C.F. R.S.F. A B
A B A B
117 C1 10-20 1 1 83 33 100 70
20-30 1 1
30-80 1
80-90 1
90-100 1
100-150
168 C2 730-750 1 1 100 100 100 100
750-760 1 1
760-780 1 1
780-800 1 1
800-1000 1 1
1000-1050 1 1
1050-1100 1 1
1100-1150 1 1
1150-1200 1 1
1200-1250 1 1
1250-1300 1 1
1300-1320 1 1
1320-1360 1 1
1360-1380 1 1
1380-1400 1 1
1400-1440 1 1
1440-1460 1 1
1460-1500 1 1
186 C3 1 100 100 100 100
2 1 1
Cast Iron
% FOUNDRIES SATISFIEDput the value 1 where appropriate
TABLE OF VALUATION OF PROJECT
Bronze-Brass-Copper-Aluminium
It is important to note that the range of functional specifications and the percentage of customers satisfied per section have been
supplied by external sampling including firms that are leaders in the field concerning our work and allow to represent all the
situations of the Cast Iron Foundries and of Bronze-Brass-Copper-Aluminium Foundries. After defining the value customer for
both projects and knowing the relative sale prices, it is possible to estimate their cost per point for the customer. From the
comparison of costs it is evident that Project B is better than Project A (Table 7).
Table 7. Comparative overall results
A B
1400 1300
806,61 853,71
895 874,9
1,74 1,52
1,56 1,49
Cast iron foundries
Bronze-Brass-Copper-Aluminium foundries
Cast iron foundries
Bronze-Brass-Copper-Aluminium foundries
COMPARATIVE OVERALL RESULTS
Sale price
VALUE A CUSTOMER
(expressed in points)
COST PER POINT FOR THE CUSTOMER
(€)

De Felice et al./ International Journal of Engineering, Science and Technology, Vol. 2, No. 9, 2010, pp. 25-38
36
After these results, an improvement was started for Project A. The improvement was made possible by varying the ranges of
specifications connected with the C5 and C4 characteristics which are at the top in the relative hierarchical scale (Table 8).
Table 8. New comparative overall results
A B A*
1400 1300 1400
806,61 853,71 941,11
895 874,9 927
1,74 1,52 1,49
1,56 1,49 1,51
Cast iron foundries
Bronze-Brass-Copper-Aluminium foundries
COMPARATIVE OVERALL RESULTS
Sale price
VALUE A CUSTOMER
(expressed in points)
COST PER POINT FOR THE CUSTOMER
(€)
Cast iron foundries
Bronze-Brass-Copper-Aluminium foundries
The actions set out allowed an increase of the value/customer of Project A and therefore a reduction in the cost per point for the
customer. The method proposed permits to simplify the activities of analysis of the information contained in the QFD tables;
however, it does not take into consideration the opportunity of inserting more functional characteristics; if these are exhaustive of
the problem or if some of these are redundant. Only the planner can give these matters an appropriate answer. Therefore, the
method suggested can be used in an interactive manner. Finally, it is interesting to observe how the scheme of valuation of the
dependence between functional characteristics can be reproposed for the valuation of possible correlations with the customer’s
requirements. Further development could be oriented in developing a benchmarking analysis to define the market share of product.
6. Conclusions
Complex or important decisions should not be based solely on instinct. Whether prioritizing customer needs in QFD, making
budget decisions involving a variety of tangible and intangible strategic goals, managing conflicting stakeholders, or selecting
from among dozens or hundreds of alternative initiatives to be pursued, the Analytic Hierarchy Process (AHP) can help managers
and developers combine all this information and make informed decisions.
The new methodological approach allows to:
Align their decisions with their organizational objectives.
Implement a structured, repeatable and justifiable decision making approach.
Leverage organizational expertise.
Improve top-down and bottom-up communication.
Prioritize customer needs.
In the light of the results of the analysis of the business case proposed, it comes out that the QFD-AHP visualizes, in the most
impartial way, the customers’ requests, putting them into quality measurable characteristics and judging their rationality,
productivity and adequacy to the market. Besides, the QFD points out the most critical characteristics deriving from the customer’s
real needs and from the position of the firm as to competition, simplifying the determination of the sections of improvement on
which it is possible to intervene in order to fill the existing gaps.
In this work, some methods were realized which allowed to simplify the phase of analysis of the data contained in the ―house of
quality‖, and, therefore, brought about a reduction in the times of development of the project. Particularly, through the
methodology employed for the valuation of the matrix of correlation, a procedure was set up, which, owing to the experimental
verification, fulfilled, has allowed to:
Make the filling of the table of correlations among the functional characteristics of the product easier.
Verify automatically the presence of functional characteristics and/or customer’s needs not connected with other needs
and/or functional characteristics.
Determine the minimal whole of functional characteristics which are connected with all the customer’s requisites.
Besides, from the analysis of the results obtained, it came out that it:
Allows to have at our disposal a shared definition of the products of the factory expressed in functional terms (profile of
the product).

De Felice et al./ International Journal of Engineering, Science and Technology, Vol. 2, No. 9, 2010, pp. 25-38
37
Allows to work in teams efficiently and without waste of time.
Keeps the functional and technical characteristics separate, without any risk of binding the progress of the project.
Allows to define in time all the functional specifications.
Represents the base for comparing different alternatives of the project as to the value perceived by the market.
Represents the base for a comparison with competition: it is possible to effect a direct comparison, or, also, to have
elements in order to establish the sale price of the new product, so as to assure a sufficient competitive advantage.
The proposed model does not eliminate subjectivity completely—however, subjectivity elimination is not an attainable or desirable
goal. The advantage of the proposed analytic model is that it adds quantitative precision to an otherwise ad hoc decision-making
process.
Further development could be oriented in analyzing more complex case studies and in introducing the risk, cost and opportunity
control in AHP hierarchy.
References
Akao, Y., Mazur, G.H., 2003. The leading edge in QFD: Past, present, and future. International Journal of Quality and
ReliabilityManagement, Vol. 20, No. 1, pp. 20–35.
Bhattacharya, A., Sarkar, B., Mukherjee, S.K., 2005. Integrating AHP with QFD for robot selection under requirement perspective.
International Journal of Production Research, Vol. 43, No. 17, pp. 3671–3685.
Chan, L.K., Wu, M.L., 2002. Quality function deployment: A literature review. European Journal of Operational Research,
Vol.143, No.3, pp. 463-497.
Chan, L. K., & Wu, M. L. 2005. A systematic approach to quality function deployment with a full illustrative example. Omega,
Vol. 33, No. 1, pp. 119–139.
Chen, C. C., 2009. Integration of quality function deployment and process management in the semiconductor industry.
International Journal of Production Research, Vol. 47, No. 5, pp. 1469–1484.
Chin, K. S., Wang, Y. M., Yang, J. B., & Poon, K. K. G., 2009. An evidential reasoning based approach for quality function
deployment under uncertainty. Expert Systems with Application, Vol. 36, No. 3P1, pp. 5684–5694.
Chuang, P.T., 2001. Combining the analytic hierarchy process and quality function deployment for a location decision from a
requirement perspective. International Journal of Advanced Manufacturing Technology, Vol. 18, No. 11, pp. 842–849.
Cohen, L., 1995. Quality function deployment: how to make QFD work for you. Addison-Wesley Publishing Company. United
States of America
Cor P.M. Govers, 2001. QFD not just a tool but a way of quality management. International Journal Production Economics, Vol.
69, pp. 151-159.
Das, D., Mukherjee, K., 2007. Development of an AHP-QFD framework for designing a tourism product. International Journal of
Services and Operations Management, Vol. 4, No. 3, pp. 321 – 344.
De Felice, F., Falcone D., 1999. Definition of the specifications of a filter in ceramic material by the employment of the Quality
Function Deployment. ECEC’99 European Concurrent Engineering Conference 1999 – SCS, Erlangen- Norimberga (Germany).
De Felice, F., Petrillo, A., 2009. Proposal of a new model for the optimization of the organizational process in industrial company
through the application of the Analytic Network Process. 6th International Conference on Modelling & Applied Simulation,
Porto de la Cruz (Tenerife).
Han S.B., Chen S.K., Ebrahimpour M., Sodhi M.S., 2001. A conceptual QFD planning model. International Journal of Quality &
Reliability Management, Vol. 18, No. 8, pp. 796 – 812.
Juran, J.M., 1993. Quality planning and analysis: from product development through use. 3th ed. McGraw-Hill, Inc. United States
of America
Hanumaiah, N., Ravi, B., Mukherjee, N.P., 2006. Rapid hard tooling process selection using QFD-AHP methodology. Journal of
Manufacturing Technology Management, Vol. 17, No. 3, pp. 332–350.
Ho, W., 2008. Integrated analytic hierarchy process and its applications – A literature review. European Journal of Operational
Research, Vol. 186, pp. 211–228.
Hsiao, S.W., 2002. Concurrent design method for developing a new product. International Journal of Industrial Ergonomics, Vol.
29, No. 1, pp. 41–55.
Köksal, G., Eğitman, A., 1998. Planning and design of industrial engineering education quality. Computers and Industrial.
Engineering, Vol. 35, No. 3–4, pp. 639–642.
Kwong, C.K., Bai, H., 2002. A fuzzy AHP approach to the determination of importance weights of customer requirements in
quality function deployment. Journal of Intelligent Manufacturing, Vol. 13, No. 5, pp. 367–377.
Lam, K., Zhao, X., 1998. An application of quality function deployment to improve the quality of teaching. International Journal
of Quality and Reliability Management, Vol. 15, No. 4, pp. 389– 413.
Li, Y., Tang, J., Luo, X., Xu, J., 2009. An integrated method of rough set, Kano’s model and AHP for rating customer
requirements’ final importance. Expert Systems with Applications, Vol. 36, pp. 7045–7053.

De Felice et al./ International Journal of Engineering, Science and Technology, Vol. 2, No. 9, 2010, pp. 25-38
38
Lin, M.C., Wang C.C., Chen, M.S., & C. Chang, A., 2008. Using AHP and TOPSIS approaches in customer-driven product design
process. Computers in Industry, Vol. 59, No. 1, pp. 17-31.
Partovi, F.Y., 1999. A quality function deployment approach to strategic capital budgeting. The Engineering Economist, Vol. 44,
No. 3, pp. 239–260.
Ramanathan, R., & Jiang, Y. F., 2009. Incorporating cost and environmental factors in quality function deployment using data
envelopment analysis. Omega, Vol. 37, No. 3, pp. 711–723.
Saaty, T.L., 1980. The Analytic Hierarchy Process. McGraw–Hill, New York NY.
Saaty, T.L., 2001. Decision making with independence and feedback: The Analytic Network Process, Pittsburgh, RWS
Publications.
Saaty, T.L., 2005. Theory and Applications of the Analytic network Process: decision making with benefits, opportunities, costs,
and risks. Pittsburg, PA: RWS Publications.
Biographical notes F. De Felice, Professor at the Faculty of Engineering of the University of Cassino, board member of several international organizations and responsible for
scientific research and training in industrial plants. Holder of the course planning and management of industrial plants. The scientific activity developed through
studies and researches on problems concerning industrial plant engineering. Such activity ranges over all fields from improvement of quality in productive processes to the simulation of industrial plants, from support multicriteria techniques to decisions (Analytic Hierarchy Process, Analytic Network Process), to
RAMS Analysis and Human Reliability Analysis. The main courses, both curricular and specialistic for territorial businesses in which he is involved are: Safety of
Industrial Plants, Industrial Production Management, Industrial Simulation, Human Reliability Analysis. General Secretary of the Analytic Hierarchy Process – AHP Academy - International Association for the promotion of multi-criteria decision making methods.
A. Petrillo is a degree in Mechanical Engineering, now PhD at the Faculty of Engineering of University of Cassino where she conducts research activities on
Multi-criteria decision analysis (MCDA), Industrial Plant and Quality Engineering at the Department of Mechanism, Structures and Environment of University of
Cassino.
Received August 2010
Accepted December 2010
Final acceptance in revised form December 2010