Embed Size (px)
Citation preview
lable at ScienceDirect
Renewable Energy 37 (2012) 180e191
Contents lists avai
Renewable Energy
journal homepage: www.elsevier .com/locate/renene
A multiobjective approach for reactive power planning in networks with windpower generation
Monica Alonso*, Hortensia Amaris, Carlos Alvarez-OrtegaUniversity Carlos III of Madrid, Electrical Engineering Department, 28911 Leganes, Madrid, Spain
a r t i c l e i n f o
Article history:Received 22 October 2010Accepted 11 June 2011Available online 16 July 2011
Keywords:Wind farmsGenetic algorithmReactive powerDFIGFACTS devices
* Corresponding author. Tel.: þ34 91 624 83 33; faE-mail addresses: [email protected] (M. A
(H. Amaris), [email protected] (C. Alvarez-Orteg
0960-1481/$ e see front matter � 2011 Elsevier Ltd.doi:10.1016/j.renene.2011.06.021
a b s t r a c t
The increase in wind energy penetration is creating a wide range of technical problems in powernetworks. Reactive Power Planning is one of these crucial issues which entails all the necessary planningactions to improve the voltage profile as well as the voltage stability in power networks. On the whole,the ultimate aim in reactive power planning could be addressed as the resolution of an optimizationproblem, in which multiobjective optimization techniques emerge as good alternatives to fulfil severalgoals simultaneously.
Among all these techniques above mentioned, genetic algorithms stand out because of their speed ofcalculation and simplicity. An existing 140-bus power system is used to validate the performance andeffectiveness of the proposed method where several wind farms and FACTS units are optimally located.
� 2011 Elsevier Ltd. All rights reserved.
1. Introduction
Nowadays, there are several EU Directives pursuing the publicgoal of sustainable electricity in European member states andpromoting the further development of electricity production fromrenewable energy sources by means of safe and reliable systemoperations. Among all, wind energy has proved to be one of themost competitive and efficient renewable energy sources and, asa result, its application is indeed continuously increasing. The factthat a huge amount of wind energy is collapsing power networkshas forced Independent System Operators (ISO) to use new oper-ating strategies which, however, are not currently available. One ofthe most critical issues of the challenging situation above defined isthe Reactive Power Management, which entails the requestedoperation as well as all the planning actions to be implemented inorder to improve both, the voltage profile and the voltage stabilityin power networks [1].
Reactive Power Management involves the definition of both, thereactive power planning of var sources and the reactive powerdispatch of the already installed reactive sources. Traditionally,Reactive Power Planning has been formulated as an optimizationproblem where the determination of the instantaneous “optimal”steady state of an electric power system is solved by an Optimal
x: þ34 91 624 94 30.lonso), [email protected]).
All rights reserved.
Power Flow algorithm (OPF) [2]. In general, the optimizationproblem is defined as a single objective function expressed asa mathematical function based on some criteria. In many cases, themain objective is the minimization of the fuel cost function and/orsystem losses. Nevertheless, not only the cost optimization shouldbe aimed at this formulation, since a power planning designer ordecision maker needs to arrive to a determination handling con-trasting and, in some situations, conflicting design objectives.
At this point, the use of a multiobjective optimization algorithmstands out as the only suitableway to design and to optimally locatereactive power injection units in power networks and, at the sametime, to consider a wide range of objectives functions such as:improving the voltage stability, reducing active power losses orminimizing the cost of shunt reactive power sources.
Compared with single objective optimization techniques, themultiobjective ones offer advantages because they are able toproduce a solution containing different trade-offs among differentindividual objectives and this enables the ISO to select the best finalsolution.
When performing Reactive Power Management studies inpower networks with wind energy penetration, it should be takeninto account that variable speed wind turbines are connected tothe grid by electronic power converters and therefore they arecapable to offer great reactive power flexibility in the interface tothe grid.
In spite of this, power system operators are not presentlymaking full use of the available reactive capability offered by wind
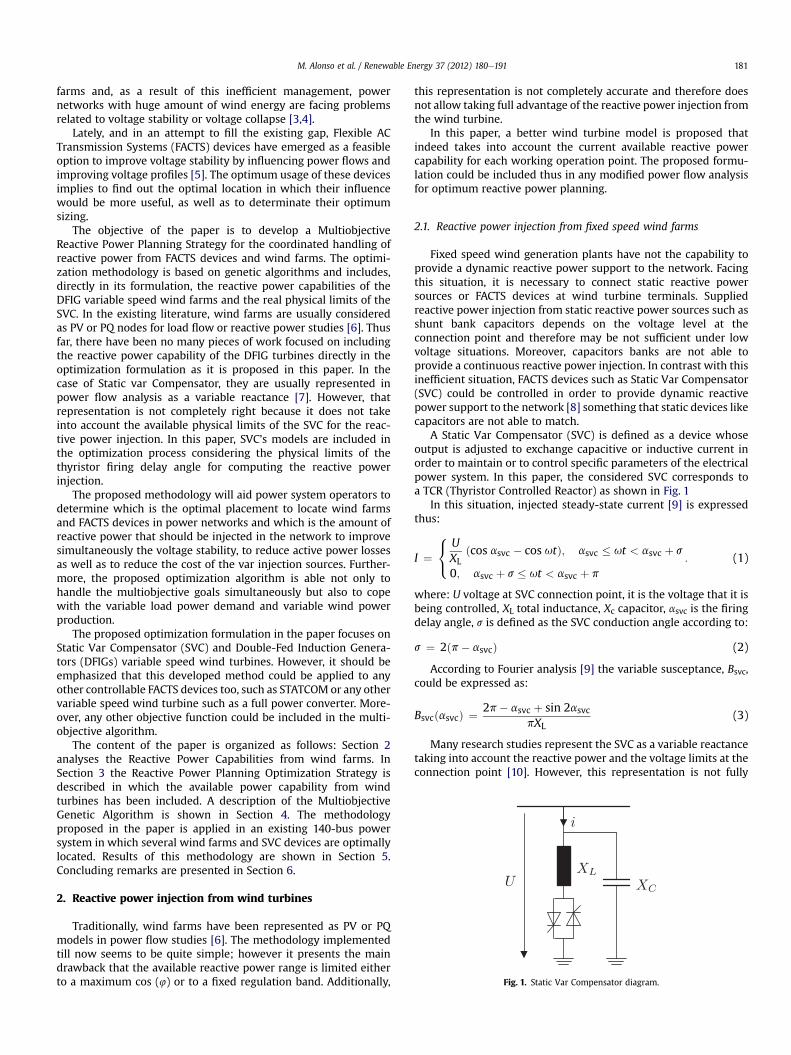
Fig. 1. Static Var Compensator diagram.
M. Alonso et al. / Renewable Energy 37 (2012) 180e191 181
farms and, as a result of this inefficient management, powernetworks with huge amount of wind energy are facing problemsrelated to voltage stability or voltage collapse [3,4].
Lately, and in an attempt to fill the existing gap, Flexible ACTransmission Systems (FACTS) devices have emerged as a feasibleoption to improve voltage stability by influencing power flows andimproving voltage profiles [5]. The optimum usage of these devicesimplies to find out the optimal location in which their influencewould be more useful, as well as to determinate their optimumsizing.
The objective of the paper is to develop a MultiobjectiveReactive Power Planning Strategy for the coordinated handling ofreactive power from FACTS devices and wind farms. The optimi-zation methodology is based on genetic algorithms and includes,directly in its formulation, the reactive power capabilities of theDFIG variable speed wind farms and the real physical limits of theSVC. In the existing literature, wind farms are usually consideredas PV or PQ nodes for load flow or reactive power studies [6]. Thusfar, there have been no many pieces of work focused on includingthe reactive power capability of the DFIG turbines directly in theoptimization formulation as it is proposed in this paper. In thecase of Static var Compensator, they are usually represented inpower flow analysis as a variable reactance [7]. However, thatrepresentation is not completely right because it does not takeinto account the available physical limits of the SVC for the reac-tive power injection. In this paper, SVC’s models are included inthe optimization process considering the physical limits of thethyristor firing delay angle for computing the reactive powerinjection.
The proposed methodology will aid power system operators todetermine which is the optimal placement to locate wind farmsand FACTS devices in power networks and which is the amount ofreactive power that should be injected in the network to improvesimultaneously the voltage stability, to reduce active power lossesas well as to reduce the cost of the var injection sources. Further-more, the proposed optimization algorithm is able not only tohandle the multiobjective goals simultaneously but also to copewith the variable load power demand and variable wind powerproduction.
The proposed optimization formulation in the paper focuses onStatic Var Compensator (SVC) and Double-Fed Induction Genera-tors (DFIGs) variable speed wind turbines. However, it should beemphasized that this developed method could be applied to anyother controllable FACTS devices too, such as STATCOM or any othervariable speed wind turbine such as a full power converter. More-over, any other objective function could be included in the multi-objective algorithm.
The content of the paper is organized as follows: Section 2analyses the Reactive Power Capabilities from wind farms. InSection 3 the Reactive Power Planning Optimization Strategy isdescribed in which the available power capability from windturbines has been included. A description of the MultiobjectiveGenetic Algorithm is shown in Section 4. The methodologyproposed in the paper is applied in an existing 140-bus powersystem in which several wind farms and SVC devices are optimallylocated. Results of this methodology are shown in Section 5.Concluding remarks are presented in Section 6.
2. Reactive power injection from wind turbines
Traditionally, wind farms have been represented as PV or PQmodels in power flow studies [6]. The methodology implementedtill now seems to be quite simple; however it presents the maindrawback that the available reactive power range is limited eitherto a maximum cos (4) or to a fixed regulation band. Additionally,
this representation is not completely accurate and therefore doesnot allow taking full advantage of the reactive power injection fromthe wind turbine.
In this paper, a better wind turbine model is proposed thatindeed takes into account the current available reactive powercapability for each working operation point. The proposed formu-lation could be included thus in any modified power flow analysisfor optimum reactive power planning.
2.1. Reactive power injection from fixed speed wind farms
Fixed speed wind generation plants have not the capability toprovide a dynamic reactive power support to the network. Facingthis situation, it is necessary to connect static reactive powersources or FACTS devices at wind turbine terminals. Suppliedreactive power injection from static reactive power sources such asshunt bank capacitors depends on the voltage level at theconnection point and therefore may be not sufficient under lowvoltage situations. Moreover, capacitors banks are not able toprovide a continuous reactive power injection. In contrast with thisinefficient situation, FACTS devices such as Static Var Compensator(SVC) could be controlled in order to provide dynamic reactivepower support to the network [8] something that static devices likecapacitors are not able to match.
A Static Var Compensator (SVC) is defined as a device whoseoutput is adjusted to exchange capacitive or inductive current inorder to maintain or to control specific parameters of the electricalpower system. In this paper, the considered SVC corresponds toa TCR (Thyristor Controlled Reactor) as shown in Fig. 1
In this situation, injected steady-state current [9] is expressedthus:
I ¼8<:
UXL
ðcos asvc � cos utÞ; asvc � ut < asvc þ s
0; asvc þ s � ut < asvc þ p
: (1)
where: U voltage at SVC connection point, it is the voltage that it isbeing controlled, XL total inductance, Xc capacitor, asvc is the firingdelay angle, s is defined as the SVC conduction angle according to:
s ¼ 2ðp� asvcÞ (2)
According to Fourier analysis [9] the variable susceptance, Bsvc,could be expressed as:
BsvcðasvcÞ ¼ 2p� asvc þ sin 2asvcpXL
(3)
Many research studies represent the SVC as a variable reactancetaking into account the reactive power and the voltage limits at theconnection point [10]. However, this representation is not fully

M. Alonso et al. / Renewable Energy 37 (2012) 180e191182
right because SVC limits are really defined by the maximumphysical limits of the firing delay angle. Under low voltage situa-tions, if Q limits were to be considered instead of the physical firingangle limits, the necessary Q would be unreachable due to theexisting physical ceilings of the asvc angle.
In Ref. [11] asvc angle is a state variable whose value is updatedin each iteration and the reactive power is computed according toit. This approach is the one followed in this paper and the reactivepower injected by the SVC has to be understood as:
QsvcðasvcÞ ¼ U2
Xc� U2BsvcðasvcÞ (4)
In this paper it is assumed that if dealing with fixed speed windfarms, the reactive power support will come from the SVC con-nected at wind farm terminals. Consequently, both reactive powerinjection and physical limits from the SVC will be included in theoptimization algorithm to represent the reactive power available atfixed speed wind power terminals.
2.2. Reactive power injection from variable speed wind farms
One of the most applied variable speed wind turbines are theDFIG (Double-fed Induction Generator) in which the stator of thewound induction machine is directly connected to the grid and therotor is connected via slip rings to a two back-to-back converters asshown in Fig. 2. In order to determine the reactive power capabil-ities of the DFIG it is necessary to obtain the steady-state mathe-matical model of the wound induction machine and to consider thereactive power capabilities from both, the machine and from thegrid side converter.
Considering a symmetrical three-phase system, the steady-statestator and rotor equations could be written following the complexphasor notation [12]:
US ¼ ðRS þ ju1LSÞ IS þ ju1L0IR (5)
URs
¼�RRsþ ju1LR
�IR þ ju1L0IS (6)
Introducing the stator and rotor leakage factors, the stator androtor self inductances would be defined as:
LS ¼ ð1þ sSÞL0 (7)
LR ¼ ð1þ sRÞL0 (8)
And thus the mathematical model becomes:
Fig. 2. DFIG wind turbine.
US ¼ ðRS þ ju1sSL0Þ IS þ ju1L0ðIS þ IRÞ (9)
URs
¼�RRsþ ju1sRL0
�IR þ ju1L0ðIS þ IRÞ (10)
And it is graphically represented in Fig. 3. Neglecting stator androtor resistances results in:
US ¼ ju1sSL0IS þ ju1L0ðIS þ IRÞ (11)
URs
¼ ju1sRL0IR þ ju1L0ðIS þ IRÞ (12)
Defining the stator magnetizing current ImS as an extendedmagnetizing current phasor responsible for the stator fluxincluding stator leakage [12]:
ImS ¼ ð1þ sSÞIS þ IR (13)
Phasor frames arewidely used in Field Oriented Control in orderto simplify the equations. Using the ImS phasor as the deq refer-ence, as shown in Fig. 4, the stator voltage equation (11) may bewritten in the form:
Us ¼ ju1L0ImS (14)
It should be noted that ImS is equal to its module ImS:
ImS ¼ jImSj ¼ ImS (15)
Hence, the stator voltage phasor is purely imaginary and alignedwith the q-axis
Us ¼ ju1L0ImS (16)
2.2.1. Active power delivery to the gridActive power delivered by the DFIG stator could be deduced
from the real component of the apparent power at stator terminals.
PS ¼ �RenUSI
*S
o(17)
And thus by substituting US by [16] and IS by its deq compo-nents: IS ¼ ISd þ jISq, the stator active power results in:
PS ¼ �u1L0ImSISq ¼ �USISq (18)
Similarly, active power delivered by the rotor may be obtainedfrom the real component of the apparent power at rotor terminals:
PR ¼ �RenURI
*R
o(19)
And thus by substituting UR by (12) and IR by (13), the expres-sion for the active power delivered by the rotor becomes:
PR ¼ su1L0ImSISq ¼ sUSISq (20)
Fig. 3. Steady-state equivalent circuit of DFIG.
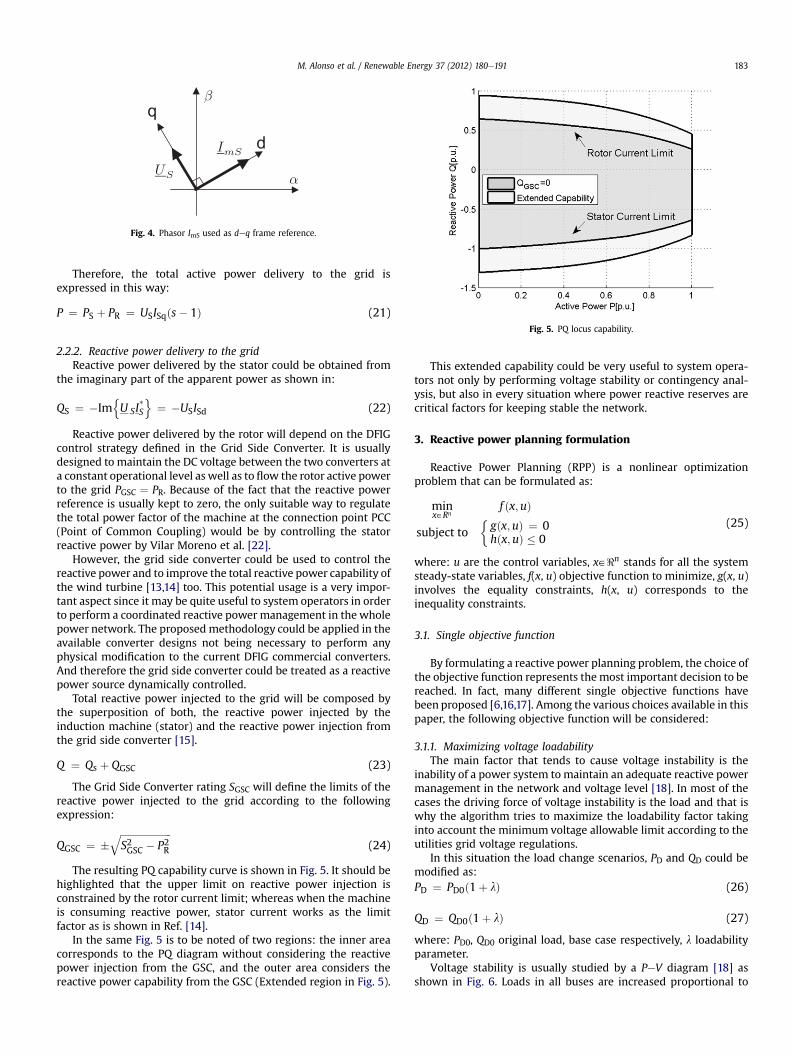
Fig. 5. PQ locus capability.
Fig. 4. Phasor ImS used as deq frame reference.
M. Alonso et al. / Renewable Energy 37 (2012) 180e191 183
Therefore, the total active power delivery to the grid isexpressed in this way:
P ¼ PS þ PR ¼ USISqðs� 1Þ (21)
2.2.2. Reactive power delivery to the gridReactive power delivered by the stator could be obtained from
the imaginary part of the apparent power as shown in:
QS ¼ �ImnU SI
*S
o¼ �USISd (22)
Reactive power delivered by the rotor will depend on the DFIGcontrol strategy defined in the Grid Side Converter. It is usuallydesigned to maintain the DC voltage between the two converters ata constant operational level as well as to flow the rotor active powerto the grid PGSC ¼ PR. Because of the fact that the reactive powerreference is usually kept to zero, the only suitable way to regulatethe total power factor of the machine at the connection point PCC(Point of Common Coupling) would be by controlling the statorreactive power by Vilar Moreno et al. [22].
However, the grid side converter could be used to control thereactive power and to improve the total reactive power capability ofthe wind turbine [13,14] too. This potential usage is a very impor-tant aspect since it may be quite useful to system operators in orderto perform a coordinated reactive power management in the wholepower network. The proposed methodology could be applied in theavailable converter designs not being necessary to perform anyphysical modification to the current DFIG commercial converters.And therefore the grid side converter could be treated as a reactivepower source dynamically controlled.
Total reactive power injected to the grid will be composed bythe superposition of both, the reactive power injected by theinduction machine (stator) and the reactive power injection fromthe grid side converter [15].
Q ¼ Qs þ QGSC (23)
The Grid Side Converter rating SGSC will define the limits of thereactive power injected to the grid according to the followingexpression:
QGSC ¼ �ffiffiffiffiffiffiffiffiffiffiffiffiffiffiffiffiffiffiffiffiffiS2GSC � P2R
q(24)
The resulting PQ capability curve is shown in Fig. 5. It should behighlighted that the upper limit on reactive power injection isconstrained by the rotor current limit; whereas when the machineis consuming reactive power, stator current works as the limitfactor as is shown in Ref. [14].
In the same Fig. 5 is to be noted of two regions: the inner areacorresponds to the PQ diagram without considering the reactivepower injection from the GSC, and the outer area considers thereactive power capability from the GSC (Extended region in Fig. 5).
This extended capability could be very useful to system opera-tors not only by performing voltage stability or contingency anal-ysis, but also in every situation where power reactive reserves arecritical factors for keeping stable the network.
3. Reactive power planning formulation
Reactive Power Planning (RPP) is a nonlinear optimizationproblem that can be formulated as:
minx˛Rn
f ðx;uÞ
subject to�gðx;uÞ ¼ 0hðx;uÞ � 0
(25)
where: u are the control variables, x˛<n stands for all the systemsteady-state variables, f(x, u) objective function to minimize, g(x, u)involves the equality constraints, h(x, u) corresponds to theinequality constraints.
3.1. Single objective function
By formulating a reactive power planning problem, the choice ofthe objective function represents the most important decision to bereached. In fact, many different single objective functions havebeen proposed [6,16,17]. Among the various choices available in thispaper, the following objective function will be considered:
3.1.1. Maximizing voltage loadabilityThe main factor that tends to cause voltage instability is the
inability of a power system tomaintain an adequate reactive powermanagement in the network and voltage level [18]. In most of thecases the driving force of voltage instability is the load and that iswhy the algorithm tries to maximize the loadability factor takinginto account the minimum voltage allowable limit according to theutilities grid voltage regulations.
In this situation the load change scenarios, PD and QD could bemodified as:PD ¼ PD0ð1þ lÞ (26)
QD ¼ QD0ð1þ lÞ (27)
where: PD0, QD0 original load, base case respectively, l loadabilityparameter.
Voltage stability is usually studied by a PeV diagram [18] asshown in Fig. 6. Loads in all buses are increased proportional to
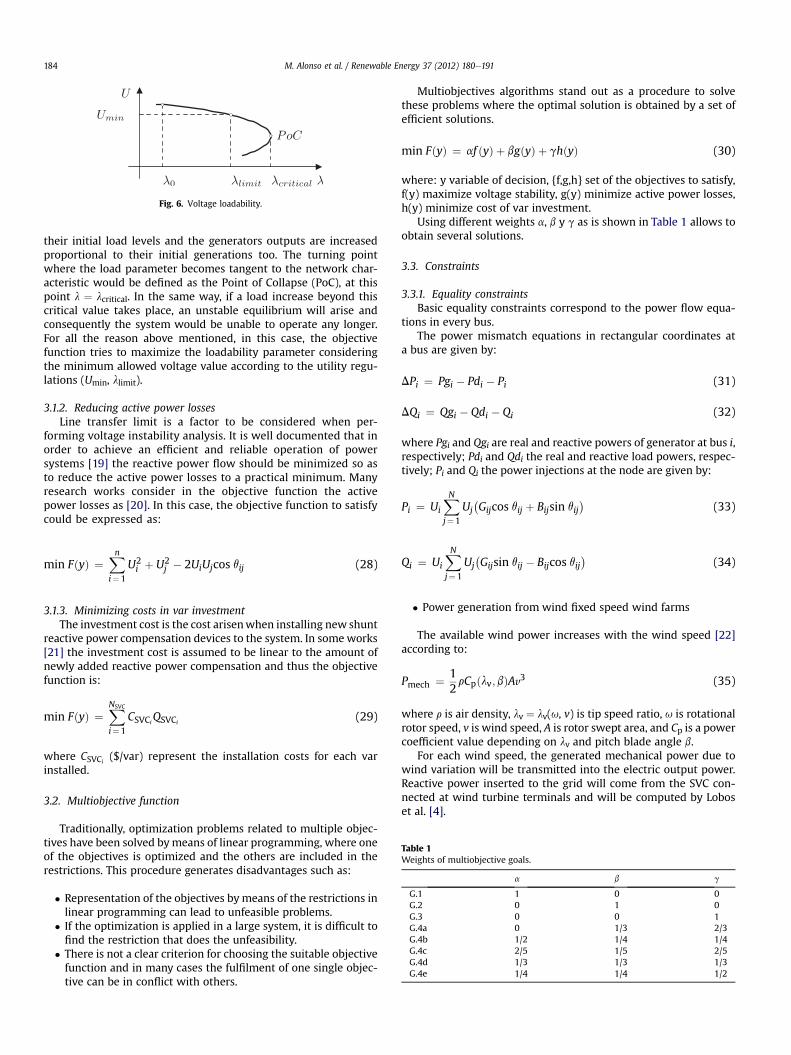
Fig. 6. Voltage loadability.
Table 1Weights of multiobjective goals.
a b g
G.1 1 0 0G.2 0 1 0G.3 0 0 1G.4a 0 1/3 2/3G.4b 1/2 1/4 1/4G.4c 2/5 1/5 2/5G.4d 1/3 1/3 1/3G.4e 1/4 1/4 1/2
M. Alonso et al. / Renewable Energy 37 (2012) 180e191184
their initial load levels and the generators outputs are increasedproportional to their initial generations too. The turning pointwhere the load parameter becomes tangent to the network char-acteristic would be defined as the Point of Collapse (PoC), at thispoint l ¼ lcritical. In the same way, if a load increase beyond thiscritical value takes place, an unstable equilibrium will arise andconsequently the system would be unable to operate any longer.For all the reason above mentioned, in this case, the objectivefunction tries to maximize the loadability parameter consideringthe minimum allowed voltage value according to the utility regu-lations (Umin, llimit).
3.1.2. Reducing active power lossesLine transfer limit is a factor to be considered when per-
forming voltage instability analysis. It is well documented that inorder to achieve an efficient and reliable operation of powersystems [19] the reactive power flow should be minimized so asto reduce the active power losses to a practical minimum. Manyresearch works consider in the objective function the activepower losses as [20]. In this case, the objective function to satisfycould be expressed as:
min FðyÞ ¼Xni¼1
U2i þ U2
j � 2UiUjcos qij (28)
3.1.3. Minimizing costs in var investmentThe investment cost is the cost arisenwhen installing new shunt
reactive power compensation devices to the system. In someworks[21] the investment cost is assumed to be linear to the amount ofnewly added reactive power compensation and thus the objectivefunction is:
min FðyÞ ¼XNSVC
i¼1
CSVCiQSVCi
(29)
where CSVCi($/var) represent the installation costs for each var
installed.
3.2. Multiobjective function
Traditionally, optimization problems related to multiple objec-tives have been solved bymeans of linear programming, where oneof the objectives is optimized and the others are included in therestrictions. This procedure generates disadvantages such as:
� Representation of the objectives bymeans of the restrictions inlinear programming can lead to unfeasible problems.
� If the optimization is applied in a large system, it is difficult tofind the restriction that does the unfeasibility.
� There is not a clear criterion for choosing the suitable objectivefunction and in many cases the fulfilment of one single objec-tive can be in conflict with others.
Multiobjectives algorithms stand out as a procedure to solvethese problems where the optimal solution is obtained by a set ofefficient solutions.
min FðyÞ ¼ af ðyÞ þ bgðyÞ þ ghðyÞ (30)
where: y variable of decision, {f,g,h} set of the objectives to satisfy,f(y) maximize voltage stability, g(y) minimize active power losses,h(y) minimize cost of var investment.
Using different weights a, b y g as is shown in Table 1 allows toobtain several solutions.
3.3. Constraints
3.3.1. Equality constraintsBasic equality constraints correspond to the power flow equa-
tions in every bus.The power mismatch equations in rectangular coordinates at
a bus are given by:
DPi ¼ Pgi � Pdi � Pi (31)
DQi ¼ Qgi � Qdi � Qi (32)
where Pgi and Qgi are real and reactive powers of generator at bus i,respectively; Pdi and Qdi the real and reactive load powers, respec-tively; Pi and Qi the power injections at the node are given by:
Pi ¼ Ui
XNj¼1
Uj�Gijcos qij þ Bijsin qij
�(33)
Qi ¼ Ui
XNj¼1
Uj�Gijsin qij � Bijcos qij
�(34)
� Power generation from wind fixed speed wind farms
The available wind power increases with the wind speed [22]according to:
Pmech ¼ 12rCpðlv; bÞAv3 (35)
where r is air density, lv ¼ lv(u, v) is tip speed ratio, u is rotationalrotor speed, v is wind speed, A is rotor swept area, and Cp is a powercoefficient value depending on lv and pitch blade angle b.
For each wind speed, the generated mechanical power due towind variation will be transmitted into the electric output power.Reactive power inserted to the grid will come from the SVC con-nected at wind turbine terminals and will be computed by Loboset al. [4].
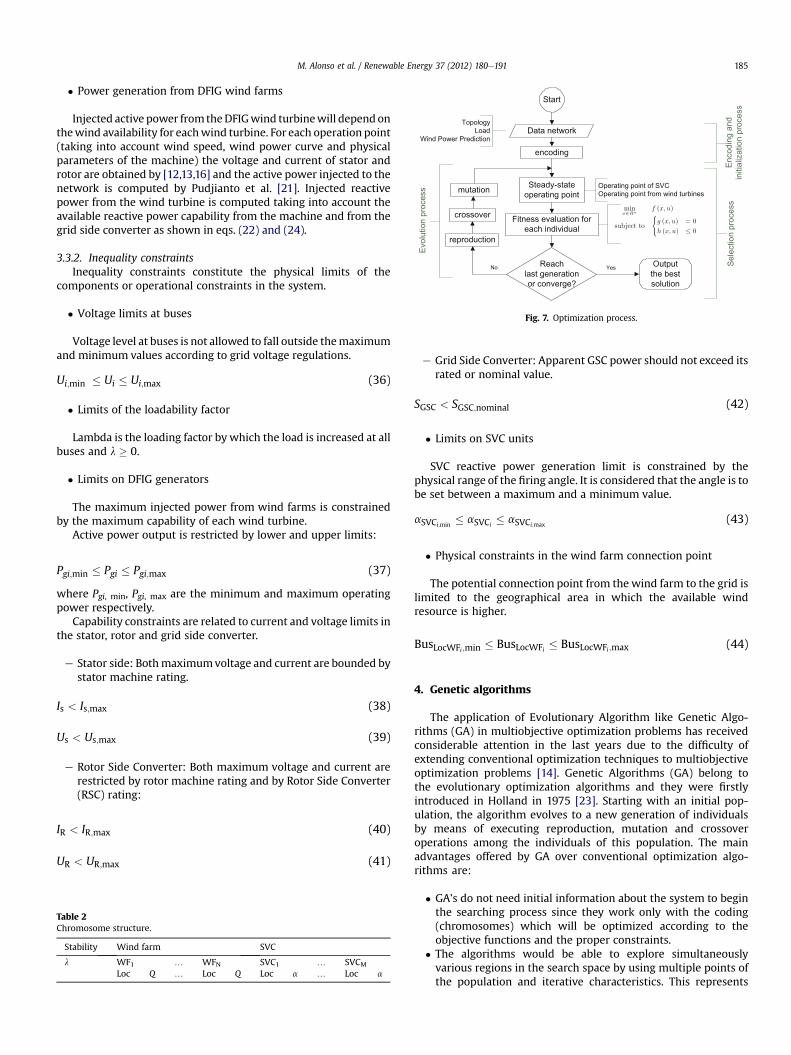
Fig. 7. Optimization process.
M. Alonso et al. / Renewable Energy 37 (2012) 180e191 185
� Power generation from DFIG wind farms
Injected active power from theDFIGwind turbinewill dependonthewind availability for eachwind turbine. For each operation point(taking into account wind speed, wind power curve and physicalparameters of the machine) the voltage and current of stator androtor are obtained by [12,13,16] and the active power injected to thenetwork is computed by Pudjianto et al. [21]. Injected reactivepower from the wind turbine is computed taking into account theavailable reactive power capability from the machine and from thegrid side converter as shown in eqs. (22) and (24).
3.3.2. Inequality constraintsInequality constraints constitute the physical limits of the
components or operational constraints in the system.
� Voltage limits at buses
Voltage level at buses is not allowed to fall outside themaximumand minimum values according to grid voltage regulations.
Ui;min � Ui � Ui;max (36)
� Limits of the loadability factor
Lambda is the loading factor by which the load is increased at allbuses and l � 0.
� Limits on DFIG generators
The maximum injected power from wind farms is constrainedby the maximum capability of each wind turbine.
Active power output is restricted by lower and upper limits:
Pgi;min � Pgi � Pgi;max (37)
where Pgi, min, Pgi, max are the minimum and maximum operatingpower respectively.
Capability constraints are related to current and voltage limits inthe stator, rotor and grid side converter.
e Stator side: Bothmaximumvoltage and current are bounded bystator machine rating.
Is < Is;max (38)
Us < Us;max (39)
e Rotor Side Converter: Both maximum voltage and current arerestricted by rotor machine rating and by Rotor Side Converter(RSC) rating:
IR < IR;max (40)
UR < UR;max (41)
Table 2Chromosome structure.
Stability Wind farm SVC
l WF1 . WFN SVC1 . SVCM
Loc Q . Loc Q Loc a . Loc a
e Grid Side Converter: Apparent GSC power should not exceed itsrated or nominal value.
SGSC < SGSC;nominal (42)
� Limits on SVC units
SVC reactive power generation limit is constrained by thephysical range of the firing angle. It is considered that the angle is tobe set between a maximum and a minimum value.
aSVCi;min� aSVCi
� aSVCi;max(43)
� Physical constraints in the wind farm connection point
The potential connection point from the wind farm to the grid islimited to the geographical area in which the available windresource is higher.
BusLocWFi;min � BusLocWFi � BusLocWFi;max (44)
4. Genetic algorithms
The application of Evolutionary Algorithm like Genetic Algo-rithms (GA) in multiobjective optimization problems has receivedconsiderable attention in the last years due to the difficulty ofextending conventional optimization techniques to multiobjectiveoptimization problems [14]. Genetic Algorithms (GA) belong tothe evolutionary optimization algorithms and they were firstlyintroduced in Holland in 1975 [23]. Starting with an initial pop-ulation, the algorithm evolves to a new generation of individualsby means of executing reproduction, mutation and crossoveroperations among the individuals of this population. The mainadvantages offered by GA over conventional optimization algo-rithms are:
� GA’s do not need initial information about the system to beginthe searching process since they work only with the coding(chromosomes) which will be optimized according to theobjective functions and the proper constraints.
� The algorithms would be able to explore simultaneouslyvarious regions in the search space by using multiple points ofthe population and iterative characteristics. This represents
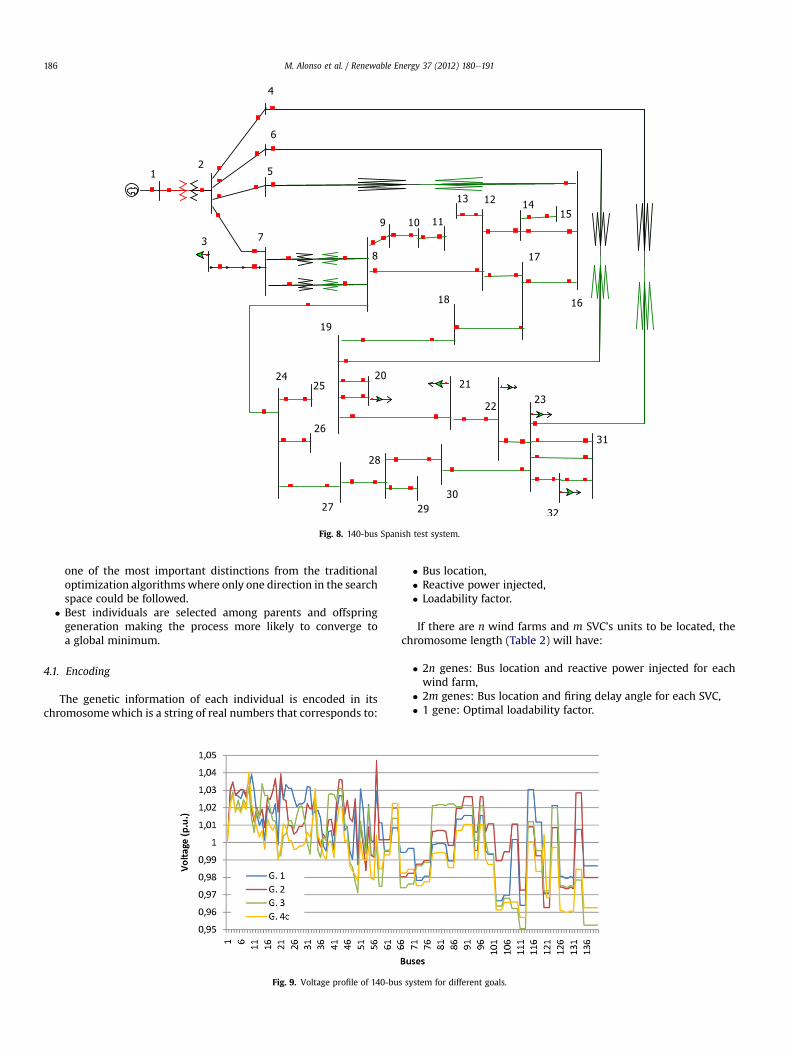
Fig. 8. 140-bus Spanish test system.
M. Alonso et al. / Renewable Energy 37 (2012) 180e191186
one of the most important distinctions from the traditionaloptimization algorithmswhere only one direction in the searchspace could be followed.
� Best individuals are selected among parents and offspringgeneration making the process more likely to converge toa global minimum.
4.1. Encoding
The genetic information of each individual is encoded in itschromosome which is a string of real numbers that corresponds to:
Fig. 9. Voltage profile of 140-bu
� Bus location,� Reactive power injected,� Loadability factor.
If there are n wind farms and m SVC’s units to be located, thechromosome length (Table 2) will have:
� 2n genes: Bus location and reactive power injected for eachwind farm,
� 2m genes: Bus location and firing delay angle for each SVC,� 1 gene: Optimal loadability factor.
s system for different goals.

Table 3Load distribution in the 140-bus system.
Voltage level [kV] Power load [% Ptotal load]
132 2045 2215 190.380 39
M. Alonso et al. / Renewable Energy 37 (2012) 180e191 187
Active power injected by each farm is not included in thechromosome since it is assumed that active power fromwind farmis merely a piece of information previously known according to thewind power production forecasts.
4.2. Evaluation
The Fitness Function (FF) assigns a goodness value at eachindividual of the population and it is employed to drive theevolution process. Each chromosome is assigned a fitness valuewhich determines not only the individual adaptation capacity tothe environment but also its estimated survival probability in thefollowing generation. In this study the Fitness Function is assignedto be the loadability parameter l.
4.3. Selection
The individuals that score the largest fitness values are selectedas possible parents because of the fact that they have higher like-lihood of survival. So that, the larger the chromosome’s fitness, thehigher the survival probability in the next generation. Therefore,a roulette wheel selection is used to distinguish which are the bestindividuals (parents) to be reproduced.
4.4. Crossover
The method employs a one-point crossover operation. Thus,after arbitrarily selecting the two chromosome parents the methodcan arbitrarily choose one crossover point for creating newoffspring chromosomes.
4.5. Mutation
The ultimate aim pursued by the mutation operator is tointroduce variety in the population. So that, this operator selectsarbitrarily individuals from the population and alters some of itscharacteristics. In this case the mutation operation is achieved witha small probability after crossover and it creates new individualswhose information was not included in previous generations yet.
The complete optimization process is shown in Fig. 7.
Table 4Results of the GA for each goal.
DFIG1 DFIG2 Fixed s
PC1 Q1 (Mvar) PC2 Q2 (Mvar) PC3
G.1 10 �0.75 32 3.08 21G.2 9 0.249 32 1.642 21G.3 9 0 29 2 14G.4a 9 2 30 3 21G.4b 9 2 31 2 22G.4c 9 2 32 3 22G.4d 9 0 32 2 22G.4e 9 0 31 3 21
5. Case study
In the next section the proposed RPP methodology is appliedupon an existing power system. The system is made up of 140nodes with five voltage levels ranging from 380 kV, 132 kV, 45 kV,15 kV to the lowest voltage at 380 V. The structure of the 45 kVnetwork is a ring as it could be seen in Fig. 9 where 15 kV and 380 Vgrids have been removed to clarify the description. Although mostloads are connected at low voltage level, there are indeed somelocated at medium voltage level and even a few of them at highvoltage level as is shown in Table 3. Additional data information canbe found at Ref. [24].
Bus #2 has been chosen as the slack bus because of itsconnection to the rest of the Spanish network through the 380 kVnetwork. According to Spanish national legislation, every utility isobliged tomaintain the voltage supply within an admissible marginof 5% around nominal voltage supply.
5.1. Selection of the best objective function
The target is to allocate three wind farms in three areas with thehigher wind resource availability (Fig. 8).
� Area 1 (DFIG1): In this region the wind resource availability ishigh and it allows the installation of a 10 MW DFIG variablespeed wind farm. The potential connection points to thenetwork are limited to buses 8-9-10-11, [24].
� Area 2 (DFIG2): This area has a very high wind availabilityresource and therefore it is planned to install a 10 MW DFIGvariable speed wind farm. The possible connection points tothe power network are restricted to bus numbers 23-24-25-26-27-28-29-30-31 or 32, [24].
� Area 3: It is planned to install afixed speedwind farm, of 10MW,in the zone confined between power network buses 12-13-14-15-16-17-18-19-21-21-22, [24]. In order to offer reactive powercapability it would be necessary to add an SVC at thewind farmpower station, with a maximum rating of 10 Mvar, [24].
In order to offer an additional reactive support to the network,two additional SVC’s are to be installed spread throughout thewhole network and the maximum rating of each SVC will be10 Mvar. Both, location points and reactive power injection will beoptimally obtained by the RPP optimization strategy which hasbeen largely explained in previous sections and shown in Fig. 7.Table 4 shows the results of the GA for each RPP strategy.
If the single objective function G.1 is considered as the onlygoal to fulfil, the GA will locate the variable speed wind farmDFIG1 (area 1) in bus number 10 consuming reactive power;DFIG2 is located at bus #32 and the reactive power injected is3.08 Mvar. The fixed speed wind farm is located at bus 21 andthe SVC connected at the substation would have a rating of
peed WF SVC1 SVC2
Q3 (Mvar) PC4 Q4 (Mvar) PC5 Q5 (Mvar)
8 24 7 32 107 19 7 57 52 22 8 41 14 22 1 23 36 49 3 102 13 21 2 120 14 24 1 32 57 33 1 31 2
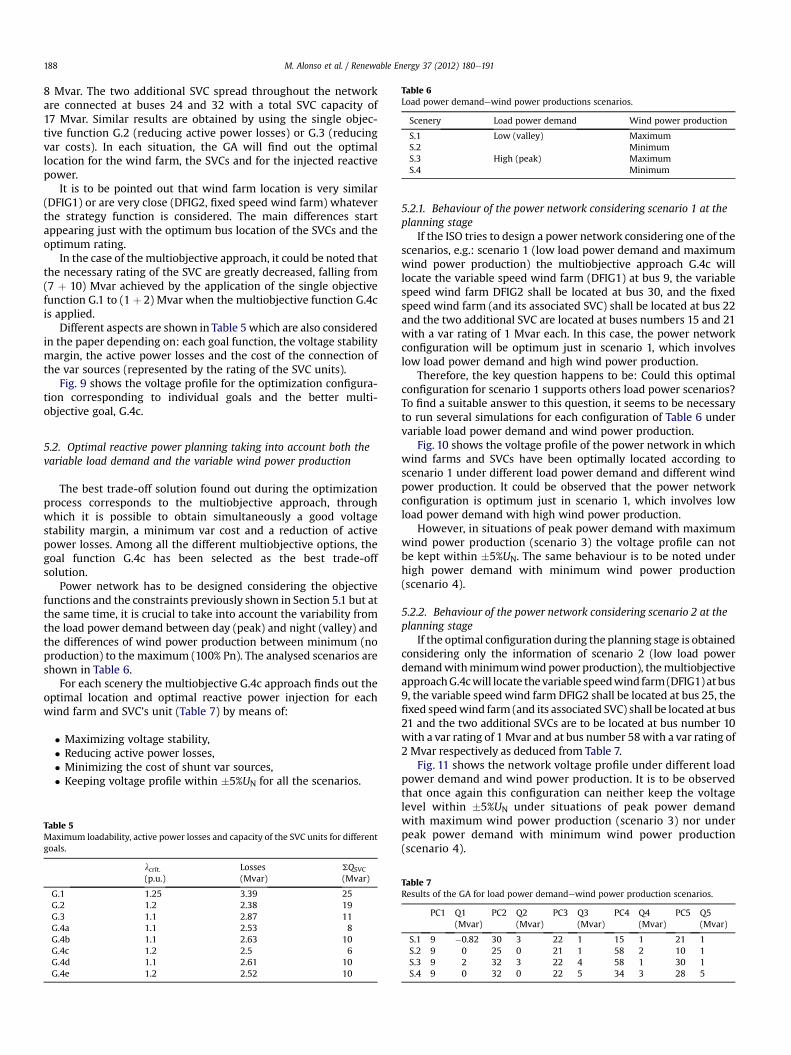
Table 6Load power demandewind power productions scenarios.
Scenery Load power demand Wind power production
S.1 Low (valley) MaximumS.2 MinimumS.3 High (peak) MaximumS.4 Minimum
M. Alonso et al. / Renewable Energy 37 (2012) 180e191188
8 Mvar. The two additional SVC spread throughout the networkare connected at buses 24 and 32 with a total SVC capacity of17 Mvar. Similar results are obtained by using the single objec-tive function G.2 (reducing active power losses) or G.3 (reducingvar costs). In each situation, the GA will find out the optimallocation for the wind farm, the SVCs and for the injected reactivepower.
It is to be pointed out that wind farm location is very similar(DFIG1) or are very close (DFIG2, fixed speed wind farm) whateverthe strategy function is considered. The main differences startappearing just with the optimum bus location of the SVCs and theoptimum rating.
In the case of the multiobjective approach, it could be noted thatthe necessary rating of the SVC are greatly decreased, falling from(7 þ 10) Mvar achieved by the application of the single objectivefunction G.1 to (1 þ 2) Mvar when the multiobjective function G.4cis applied.
Different aspects are shown in Table 5 which are also consideredin the paper depending on: each goal function, the voltage stabilitymargin, the active power losses and the cost of the connection ofthe var sources (represented by the rating of the SVC units).
Fig. 9 shows the voltage profile for the optimization configura-tion corresponding to individual goals and the better multi-objective goal, G.4c.
5.2. Optimal reactive power planning taking into account both thevariable load demand and the variable wind power production
The best trade-off solution found out during the optimizationprocess corresponds to the multiobjective approach, throughwhich it is possible to obtain simultaneously a good voltagestability margin, a minimum var cost and a reduction of activepower losses. Among all the different multiobjective options, thegoal function G.4c has been selected as the best trade-offsolution.
Power network has to be designed considering the objectivefunctions and the constraints previously shown in Section 5.1 but atthe same time, it is crucial to take into account the variability fromthe load power demand between day (peak) and night (valley) andthe differences of wind power production between minimum (noproduction) to the maximum (100% Pn). The analysed scenarios areshown in Table 6.
For each scenery the multiobjective G.4c approach finds out theoptimal location and optimal reactive power injection for eachwind farm and SVC’s unit (Table 7) by means of:
� Maximizing voltage stability,� Reducing active power losses,� Minimizing the cost of shunt var sources,� Keeping voltage profile within �5%UN for all the scenarios.
Table 5Maximum loadability, active power losses and capacity of the SVC units for differentgoals.
lcrít.(p.u.)
Losses(Mvar)
SQSVC
(Mvar)
G.1 1.25 3.39 25G.2 1.2 2.38 19G.3 1.1 2.87 11G.4a 1.1 2.53 8G.4b 1.1 2.63 10G.4c 1.2 2.5 6G.4d 1.1 2.61 10G.4e 1.2 2.52 10
5.2.1. Behaviour of the power network considering scenario 1 at theplanning stage
If the ISO tries to design a power network considering one of thescenarios, e.g.: scenario 1 (low load power demand and maximumwind power production) the multiobjective approach G.4c willlocate the variable speed wind farm (DFIG1) at bus 9, the variablespeed wind farm DFIG2 shall be located at bus 30, and the fixedspeed wind farm (and its associated SVC) shall be located at bus 22and the two additional SVC are located at buses numbers 15 and 21with a var rating of 1 Mvar each. In this case, the power networkconfiguration will be optimum just in scenario 1, which involveslow load power demand and high wind power production.
Therefore, the key question happens to be: Could this optimalconfiguration for scenario 1 supports others load power scenarios?To find a suitable answer to this question, it seems to be necessaryto run several simulations for each configuration of Table 6 undervariable load power demand and wind power production.
Fig. 10 shows the voltage profile of the power network in whichwind farms and SVCs have been optimally located according toscenario 1 under different load power demand and different windpower production. It could be observed that the power networkconfiguration is optimum just in scenario 1, which involves lowload power demand with high wind power production.
However, in situations of peak power demand with maximumwind power production (scenario 3) the voltage profile can notbe kept within �5%UN. The same behaviour is to be noted underhigh power demand with minimum wind power production(scenario 4).
5.2.2. Behaviour of the power network considering scenario 2 at theplanning stage
If the optimal configuration during the planning stage is obtainedconsidering only the information of scenario 2 (low load powerdemandwithminimumwind power production), themultiobjectiveapproachG.4cwill locate thevariable speedwind farm(DFIG1)at bus9, the variable speed wind farm DFIG2 shall be located at bus 25, thefixed speedwind farm (and its associated SVC) shall be located at bus21 and the two additional SVCs are to be located at bus number 10with a var rating of 1 Mvar and at bus number 58with a var rating of2 Mvar respectively as deduced from Table 7.
Fig. 11 shows the network voltage profile under different loadpower demand and wind power production. It is to be observedthat once again this configuration can neither keep the voltagelevel within �5%UN under situations of peak power demandwith maximum wind power production (scenario 3) nor underpeak power demand with minimum wind power production(scenario 4).
Table 7Results of the GA for load power demandewind power production scenarios.
PC1 Q1(Mvar)
PC2 Q2(Mvar)
PC3 Q3(Mvar)
PC4 Q4(Mvar)
PC5 Q5(Mvar)
S.1 9 �0.82 30 3 22 1 15 1 21 1S.2 9 0 25 0 21 1 58 2 10 1S.3 9 2 32 3 22 4 58 1 30 1S.4 9 0 32 0 22 5 34 3 28 5
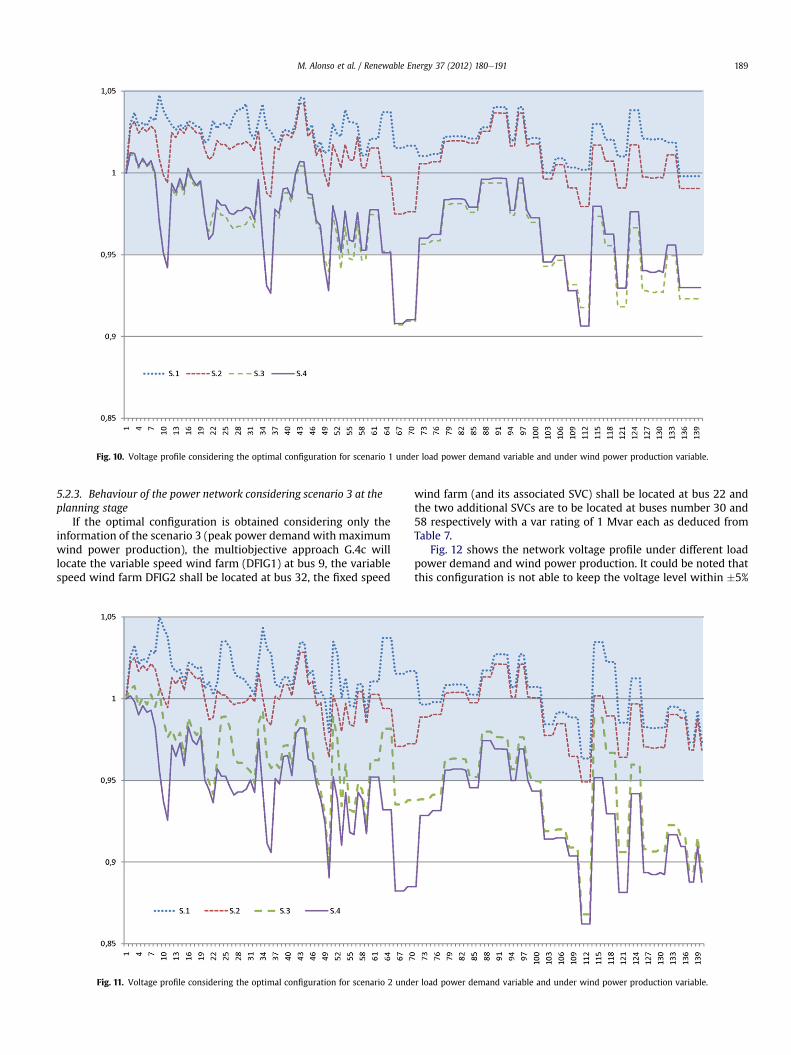
Fig. 10. Voltage profile considering the optimal configuration for scenario 1 under load power demand variable and under wind power production variable.
M. Alonso et al. / Renewable Energy 37 (2012) 180e191 189
5.2.3. Behaviour of the power network considering scenario 3 at theplanning stage
If the optimal configuration is obtained considering only theinformation of the scenario 3 (peak power demand with maximumwind power production), the multiobjective approach G.4c willlocate the variable speed wind farm (DFIG1) at bus 9, the variablespeed wind farm DFIG2 shall be located at bus 32, the fixed speed
Fig. 11. Voltage profile considering the optimal configuration for scenario 2 unde
wind farm (and its associated SVC) shall be located at bus 22 andthe two additional SVCs are to be located at buses number 30 and58 respectively with a var rating of 1 Mvar each as deduced fromTable 7.
Fig. 12 shows the network voltage profile under different loadpower demand and wind power production. It could be noted thatthis configuration is not able to keep the voltage level within �5%
r load power demand variable and under wind power production variable.
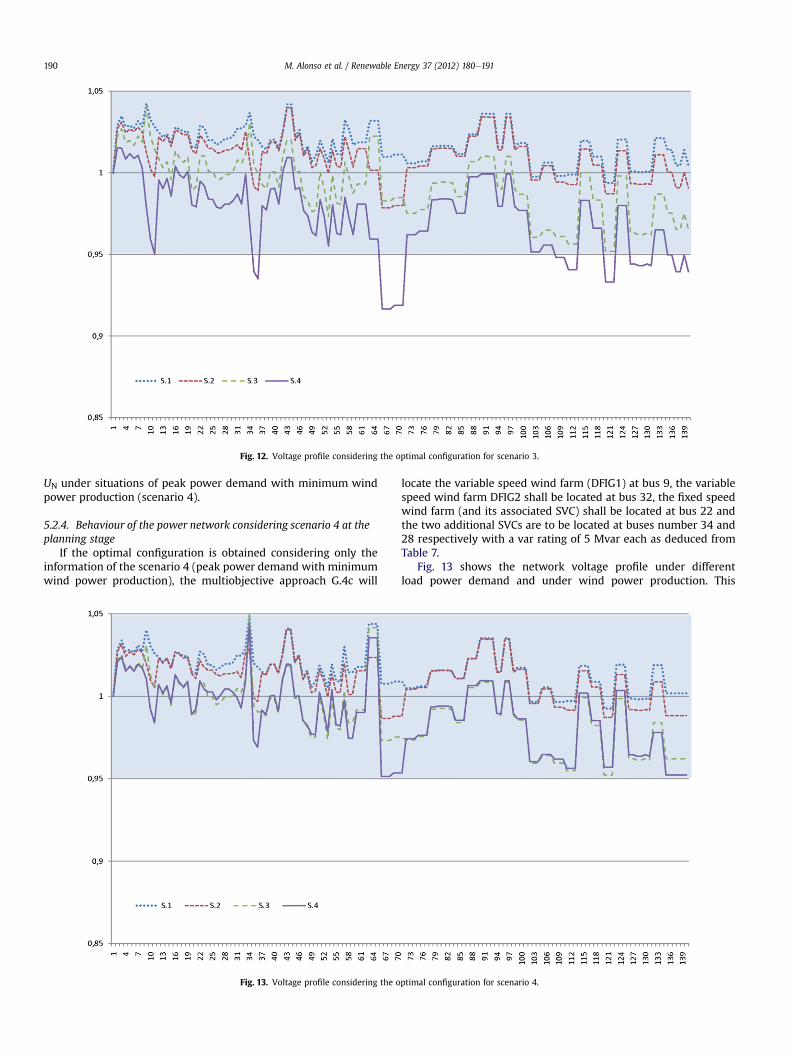
Fig. 12. Voltage profile considering the optimal configuration for scenario 3.
M. Alonso et al. / Renewable Energy 37 (2012) 180e191190
UN under situations of peak power demand with minimum windpower production (scenario 4).
5.2.4. Behaviour of the power network considering scenario 4 at theplanning stage
If the optimal configuration is obtained considering only theinformation of the scenario 4 (peak power demand with minimumwind power production), the multiobjective approach G.4c will
Fig. 13. Voltage profile considering the o
locate the variable speed wind farm (DFIG1) at bus 9, the variablespeed wind farm DFIG2 shall be located at bus 32, the fixed speedwind farm (and its associated SVC) shall be located at bus 22 andthe two additional SVCs are to be located at buses number 34 and28 respectively with a var rating of 5 Mvar each as deduced fromTable 7.
Fig. 13 shows the network voltage profile under differentload power demand and under wind power production. This
ptimal configuration for scenario 4.

M. Alonso et al. / Renewable Energy 37 (2012) 180e191 191
configuration is the only one that keeps voltage profile within �5%UN, for every scenarios. The other ones do not allow maintainingthe voltage profile according to the standard voltage regulation.
6. Conclusions
A Genetic Algorithm capable to handle multiobjective optimi-zation problems has been developed. The proposed strategy findsout the optimal location and optimal reactive power injection fromwind farms and SVC’ sources in order to improve the voltagestability, to reduce active power losses and to minimize the cost ofthe shunt connected Var sources simultaneously. Solving multi-objective problems offers the advantage of reaching all the objec-tives as close as possible to the optimum one. Earlier it was usuallyimpossible to reach an optimal solution when considering all theobjectives simultaneously.
Several solutions were obtained depending on the priorityfactors and weights selection considered in the multiobjectiveapproach. The proposed optimization algorithm includes directlyin its formulation the DFIG physical limits to compute theoptimum reactive power that should be injected by the variablespeed wind turbines. Furthermore, a proper model of the SVC isused in the reactive power formulation, where the maximumphysical limits of the firing delay angle is included in the opti-mization algorithm. The algorithm was validated in an existing140-node power network where different wind farm and SVC’sunits are optimally located. The proposed multiobjective meth-odology is able to find out a set of optimal solutions where theeconomic optimization is not the only variable to be considered inthe decision-making process. This first step clearly demonstratesthe capability of the proposed methodology to handle goalfunctions simultaneously and, in some situations, in a contradic-tory way. In the second step, the same procedure is now appliedto handle not only the multiobjective goals but also to considerthe variable load power demand and variable wind powerproduction in different scenarios.
These two cases represent great challenges due to thecomplexity brought about by the large number of decision variablesand constraints to be handled. The proposed methodology opensseveral possibilities to operate and to design power networks withwind generation. This formulation could be very useful to systemsoperators in the planning operation or any other situations wherereactive power reserve would be needed.
Acknowledgement
This work has been partially supported by the SpanishMinister of Science and Innovation under contract ENE2009-13883-CO2-01.
Nomenclature
I, U complex phasors for current and voltageI, U RMS-values
SymbolsIS, IR stator and rotor current phasorImS magnetizing current representing stator fluxISd, ISq direct and quadrature components of stator currentLS, LR stator and rotor inductancesL0 mutual inductancel loadability parameterN number of busesRS, RR stator and rotor resistances
sS, sR stator and rotor leakage factorPmech mechanical powerPn nominal power wind turbinePS, PR stator and rotor active power DFIGPgi, Qgi active and reactive power injection from generators
connected at bus ithPdi, Qdi active and reactive power consumed by loads connected
at bus ithQS, QR stator and rotor reactive power DFIGQsvc reactive power injected by SVC unit connected at bus ithSGSC Grid Side Converter Apparent powers slip velocityu rotor angular speedu1 synchronous angular speed
References
[1] Raoufi H, Kalantar M. Reactive power rescheduling with generator ranking forvoltage stability improvement. Energy Conversion and Management;2009:1129e35.
[2] Dommel H, Tinney W. Optimal power flow solutions. IEEE Transactions onPower Apparatus and Systems; 1968:1866e76.
[3] Borbely A, Kreider J. Distributed generation: the power paradigm for the newmillennium. CRC Press; 2001. pp. 1e50.
[4] Lobos T, Rezmer J, Janij P, Amaris H, AlonsoM, Alvarez C. Application of waveletsand prony method for disturbance detection in fixed speed wind farms. Inter-national Journal of Electrical Power & Energy Systems; 2009:429e36.
[5] Lahacani N, Aouzellag D, Mendil B. Contribution to the improvement ofvoltage profile in electrical network with wind generator using SVC device.Renewable Energy; 2010:243e8.
[6] Hedayati H, Nabaviniaki SA, Akbarimajd A. A method for placement of DGunits in distribution networks. IEEE Transactions on Power Delivery;2008:1620e8.
[7] Gerbex S, Cherkaoui R, Germond A. Optimal location of multi-type FACTSdevices in a power system by means of genetic algorithms. IEEE Transactionson Power Systems; 2001:537e44.
[8] Shenghu Li JWZ, Ding Ming. Voltage control capability of SVC with VARdispatch and slope setting. Electric Power Systems Research; 2009:818e25.
[9] Miller TJE. Reactive power control in electric systems. Wiley-Interscience;1982. pp. 185e223.
[10] Chang C, Huang J. Optimal multiobjective SVC planning for voltage stabilityenhancement. IEE Proceedings Generation, Transmission, and Distribution;1998:203e9.
[11] Ambriz-Perez H, Acha E, Fuerte-Esquivel CR. Advanced SVC models forNewton-Raphson load flow and Newton optimal power flow studies. IEEETransactions on Power Delivery; 2000:129e36.
[12] Leonhard W. Control of electrical drives. Electric Energy Systems and Engi-neering Series; 1990:163e214.
[13] Ullah N, Thiringer T. Improving voltage stability by utilizing reactive powerinjection capability of variable speed wind turbines. International Journal ofPower and Energy Systems; 2008:289e97.
[14] Singh B, Singh SN. Reactive capability limitations of doubly-fed inductiongenerators. Electric Power Components and Systems; 2009:427e40.
[15] Amaris H, Alonso M. Coordinated reactive power management in powernetworks with wind turbines and facts devices. Energy Conversion andManagement 2011;52(7):2575e86.
[16] Hugang X, Haozhong C, Haiyu L. Optimal reactive power flow incorporatingstatic voltage stability based on multi-objective adaptive immune algorithm.Energy Conversion and Management; 2008:1175e81.
[17] Lee K, Bai X. Park optimization method for reactive power planning by usinga modified simple genetic algorithm. IEEE Transactions on Power Systems;1995:1843e50.
[18] Ajjarapu V. Computational techniques for voltage stability assessment andcontrol. Springer; 2006. pp. 1e15.
[19] Kundur P. Power system stability and control. McGraw-Hill, Inc.; 1994. pp.959e1024.
[20] Dai C, Chen W, Zhu Y, Zhang X. Seeker optimization algorithm for optimalreactive power dispatch. IEEE Transactions on Power Systems; 2009:1218e31.
[21] Pudjianto D, Ahmed S, Strbac G. Allocation of VAR support using LP and NLPbased optimal power flows. IEE Proceedings Generation, Transmission, andDistribution; 2002:377e83.
[22] Vilar Moreno C, Amaris Duarte H, . Usaola Garcia J. Propagation of flicker inelectric power networks due to wind energy conversions systems. IEEETransactions on Energy Conversion; 2002:267e72.
[23] Holland J. Adaptation in natural and artificial systems: an Introductory anal-ysis with applications to biology, control, and artificial intelligence. Univ. ofMichigan Press; 1975.
[24] Alonso M. Gestión óptima de potencia reactiva en sistemas eléctricoscon generación eólica, Ph.D. thesis, University Carlos III of Madrid(2010).