Embed Size (px)
Citation preview

ARTICLE IN PRESS
Pattern Recognition 43 (2010) 1094–1105
Contents lists available at ScienceDirect
Pattern Recognition
0031-32
doi:10.1
� Corr
E-m
lai@mai
journal homepage: www.elsevier.de/locate/pr
A multimodal biometric test bed for quality-dependent, cost-sensitive andclient-specific score-level fusion algorithms
Norman Poh a,�, Thirimachos Bourlai b, Josef Kittler a
a CVSSP, FEPS, University of Surrey, Guildford, Surrey, GU2 7XH, UKb Biometric Center, West Virginia University, Morgantown, WV 26506-6109, USA
a r t i c l e i n f o
Article history:
Received 11 October 2008
Received in revised form
3 September 2009
Accepted 8 September 2009
Keywords:
Multimodal biometric authentication
Benchmark
Database
Fusion
03/$ - see front matter & 2009 Elsevier Ltd. A
016/j.patcog.2009.09.011
esponding author. Tel.: +441483 686042; fax
ail addresses: [email protected] (N. Poh), t.
l.wvu.edu (T. Bourlai), [email protected] (
a b s t r a c t
This paper presents a test bed, called the Biosecure DS2 score-and-quality database, for evaluating,
comparing and benchmarking score-level fusion algorithms for multimodal biometric authentication. It
is designed to benchmark quality-dependent, client-specific, cost-sensitive fusion algorithms. A quality-
dependent fusion algorithm is one which attempts to devise a fusion strategy that is dependent on the
biometric sample quality. A client-specific fusion algorithm, on the other hand, exploits the specific
score characteristics of each enrolled user in order to customize the fusion strategy. Finally, a cost-
sensitive fusion algorithm attempts to select a subset of biometric modalities/systems (at a specified
cost) in order to obtain the maximal generalization performance. To the best of our knowledge, the
BioSecure DS2 data set is the first one designed to benchmark the above three aspects of fusion
algorithms. This paper contains some baseline experimental results for evaluating the above three types
of fusion scenarios.
& 2009 Elsevier Ltd. All rights reserved.
1. Introduction
1.1. Motivations
In order to improve confidence in verifying the identity ofindividuals seeking access to physical or virtual locations bothgovernment and commercial organizations are implementingmore secure personal identification (ID) systems. Deploying awell-designed, highly secure and accurate personal identificationsystem has always been a central goal in security business. Thisobjective has posed a significant challenge that can be respondedto by the use of multimodal biometric systems [1–3] which offersenhanced security and performance.
Research in multimodal biometrics has entailed an enormouseffort on data collection, e.g., XM2VTS [4], VidTIMIT [5], BANCA[6], BIOMET [7], FRGC [8] and the recent M3 corpus [9]. Althoughthe existence of these databases should enable one to develop andbenchmark multimodal as well as multi-expert (utilizing thesame biometric data but different matching software) fusionalgorithms, they are a necessary prerequisite but not sufficient.For instance, it is not straight forward to compare two fusionalgorithms in the case where each algorithm relies on its own setof baseline systems. This is because an observed improvement
ll rights reserved.
: +441483 686031.
[email protected], ThBour
J. Kittler).
due to a particular fusion algorithm may be due to the superiorperformance of its baseline systems rather than the merits of thefusion process. This shows the importance of having common
baseline systems when benchmarking score-level fusion algo-rithms.
1.2. Score-level fusion and signal quality
The fusion paradigm we are interested in is where multi-biometrics is treated as a two-stage problem where in the firststage we train the baseline systems. The scores produced by thebaseline systems are then used as input to a fusion classifier. Thisparadigm, also known as the score-level fusion, is the mainstreamresearch pursued in the literature on multibiometrics, e.g., [1–3].Another fusion paradigm treats these two stages as a singleprocess by jointly training a single model. This paradigm is morecomplex because it involves combining information at the rawsignal or feature levels. This often results in a learning problem inthe spaces of increased dimensionality. This approach is appro-priate when the data types are compatible. When the data typesare incompatible, e.g., when combining fingerprint minutiae(containing location information) with speech features of varyinglength, it is not obvious how to introduce a single matchingfunction or distance measure in the resulting joint feature space.For this reason, the first fusion paradigm, i.e., score-level fusion, isconsidered a more practical solution to the multibiometricinformation fusion problem.

ARTICLE IN PRESS
N. Poh et al. / Pattern Recognition 43 (2010) 1094–1105 1095
An obvious disadvantage of score-level fusion is that, by usingonly scores, a lot of precious non-class discriminatory informationis lost, for instance, the quality of raw biometric signal. Here aretwo examples: a person’s face can change drastically with illness,diet, or age, as well as with the application of cosmetics, a changein hair color or style, or a sun tan; and a person’s voice can differsignificantly with congestion caused by a cold. This information isnon-class discriminatory, because it is not useful for distinguish-ing different individuals.
A recent trend in multimodal biometric fusion is to directlymeasure the signal quality using a set of criteria known toinfluence the system performance. These criteria are known asquality measures. Quality measures capture changes in signalsthat could directly impact on the system performance and can beused to weigh the participating classifiers in fusion appropriately.However, tapping the quality information—which is non-classdiscriminatory in nature—in order to improve the classificationperformance is not a trivial problem.
1.3. Three types of fusion problems
In this study, we propose to evaluate fusion algorithms in threescenarios, namely, (i) quality-dependent fusion, (ii) client-specificfusion and (iii) cost-sensitive fusion. A quality-dependent fusionalgorithm is one which attempts to devise a fusion strategy that isdependent on the biometric sample quality. The premise is thatone should put more emphasis on the base classifier whose signalis of a better quality or deemed more reliable when computing thefinal score. A client-specific fusion algorithm further exploits thespecific score characteristics of each enrolled user in order tocustomize the fusion strategy. Finally, a cost-sensitive fusionalgorithm attempts to select a subset of biometric modalities/systems (at a specified cost) in order to obtain the maximalgeneralization performance. We refer to ‘‘cost’’ as the price paidfor acquiring and processing more information, e.g., requestingmore samples from the same device or using more biometricdevices (which often entails longer processing time).
As a variation of the problem of cost-sensitive fusion, one canalso evaluate the capability of a fusion algorithm in dealing withmissing modalities. This happens when one or more baselinesystems are not operational due to failure to acquire or failure tomatch a biometric sample. Effectively, in this evaluation, one teststhe robustness of a fusion algorithm with respect to missingscores (due to missing modalities).
To achieve our objective of evaluating the three mentionedfusion scenarios, we constructed a database with scores as well asquality measures obtained from the BioSecure DS2 database [10].The following set of biometrics is used for the purpose ofbenchmarking: fingerprint, still face images and iris.
1.4. Contributions
This paper proposes a benchmark database for investigating amulti-expert biometric system in the following scenarios:
�
To benchmark the performance of quality-based fusion algo-rithms, under changing conditions. The particular change ofconditions considered here arises in cross-device matching(where template and query samples are acquired using twodifferent devices). � To benchmark client-specific fusion algorithms (where a fusionstrategy is tailored to each enrolled user).
� To evaluate cost-sensitive evaluation of multimodal biometricsystem.
To date, there simply exists no test bed for the above purposes.Without a benchmark data set, it is virtually impossible tomeasure real progress in multimodal biometric fusion. Theavailability of such database is one step towards achieving thisobjective. To our best knowledge, this is also the first multimodalbiometric score-and-quality database released in the publicdomain. A similar work in this direction is [11] but qualitymeasures are not available. The database described in this papercan be downloaded from: ‘‘http://face.ee.surrey.ac.uk/qfusion’’.
The paper is organized as follows: Section 2 describes thescore-and-quality database. Section 3 provides experimentalprotocols for the evaluation. Section 4 provides an initialexperimental analysis. The baseline fusion experiments arereported in Section 5. This is followed by conclusions in Section 6.
2. The BioSecure DS2 data set and reference systems
2.1. The biosecure database
The Biosecure database was collected with the aim to integratemulti-disciplinary research efforts in biometric-based identityauthentication. Application examples are a building access systemusing a desktop-based or a mobile-based platform, as well asapplications over the Internet such as tele-working and Web orremote-banking services. As far as the data collection isconcerned, three scenarios have been identified, each simulatingthe use of biometrics in remote-access authentication via theInternet (termed the ‘‘Internet’’ scenario), physical access control(the ‘‘desktop’’ scenario), and authentication via mobile devices(the ‘‘mobile’’ scenario). While the desktop scenario is used here,the proposed two evaluation schemes can equally be applied tothe remaining two data sets.
The desktop scenario data set contains the following biometricmodalities: signature, face, audio–video (PINs, digits, phrases),still face, iris, hand and fingerprint. However, only still face, irisand fingerprint are used for the evaluation schemes proposedhere. This data set is collected from six European sites (only fourare being used at the writing of this report). Although the dataacquisition process is supervised, the level of supervision isextremely different from site to site. This database contains twosessions of data separated by about one month interval. In eachsession, two biometric samples are acquired per modality perdevice, hence resulting in four samples per modality per deviceover the two sessions. There are several devices for the samebiometric modality. The forgery data collected simulate PIN-replyattacks and imitation of dynamic signature (with several minutesof practice and with the knowledge of the signature dynamics).Two genders are equally represented among the volunteers,whose ages have the following distribution: 2
3 in the range 18–40 of age and 1
3 above 40.Table 1 presents the 17 streams of data available. A stream of
data is composed of a biometric modality acquired by a biometricdevice in a particular configuration. For example, a left indexfingerprint acquired using an optical fingerprint sensor as onestream of data. Using the notation presented in Table 1, thisstream of data is referred to as ‘‘fo5’’. The 17 streams of data are:fa1, fnf1, fwf1, ir1, ir2, fo1, fo2, fo3, fo4, fo5, fo6, ft1, ft2, ft3, ft4, ft5and ft6.
Each stream of data was collected in two sessions, separated byabout one month interval. In each session, two biometric sampleswere acquired for each data stream. Therefore, for each person,four biometric samples are available per stream of data.
While there are 17 streams, we need only three referencesystems, corresponding to the three chosen biometric modalities,i.e., face, fingerprint and iris. We also need three pieces of software

ARTICLE IN PRESS
Table 1The data streams for each biometric modality captured using a given device.
Label Template ID fng Modality Sensor Remarks
fa 1 Still face Web cam Frontal face images (low resolution)
fnf 1 Still face CANON Frontal face images without flash (high resolution)
fwf 1 Still face CANON Frontal face images with flash (high resolution)
ir 1–2 Iris image LG 1 is left eye; 2 is right eye
fo 1–6 Fingerprint Optical 1/4 is right/left thumb; 2/5 is right/left index; 3/6 is right/left middle finger
ft 1–6 Fingerprint Thermal 1/4 is right/left thumb; 2/5 is right/left index; 3/6 is right/left middle finger
For example, fo2 means the data stream of the right index fingerprint. The web cam model is Phillips SPC 900. The model of CANON digital camera is EOS 30D. The iris
capturing device is LG3000. The thermal sensor acquires fingerprint as one sweeps a finger over it. The optical sensor acquires a fingerprint impression by direct contact (no
movement required). This table results in 17 streams of scores. The actual data collected under the desktop scenario contains also audio-visual web cam (hence talking
faces), signature and hand images but these data streams are not used for evaluation. For each data stream, two sessions of data acquisition were conducted. In each session,
two biometric samples were collected.
Table 2Reference systems and quality measures associated to each to biometric modality
captured by a given sensor.
Modality Reference systems Quality measures
Still face Omniperception Affinity SDK
face detector; LDA-based face
verifier
Face detection reliability,
brightness, contrast, focus, bits
per pixel, spatial resolution
(between eyes), illumination,
degree of uniform background,
background brightness,
reflection, glasses, rotation in
plane, rotation in depth and
degree of frontal face (from
Omniperception Affinity SDK)
Fingerprint NIST Fingerprint system Texture richness [12] (based on
local gradient)
Iris A variant of Libor Masek’s iris
system
Texture richness [13], difference
between iris and pupil diameters
and proportion of iris used for
matching
N. Poh et al. / Pattern Recognition 43 (2010) 1094–11051096
to extract their respective quality measures directly from theacquired images. Table 2 lists the reference systems of the threebiometric modalities as well as their respective quality measures.
Among the 14 quality measures, six are face-related qualitymeasures (hence relying on a face detector), i.e., face detectionreliability, spatial resolution between eyes, presence of glasses,rotation in plane, rotation in depth and degree of frontal face. Theremaining eight measures are general purpose image qualitymeasures as defined by the MPEG standards. These qualitymeasures were obtained using Omniperception’s proprietaryAffinity SDK.
There is only a fingerprint quality measure and it is based onthe implementation found in [12]. It is an average of local imagepatches of fingerprint gradient. When too much pressure isapplied during fingerprint acquisition, the resulting fingerprintimage usually has low contrast. Consequently, a minutia-basedfingerprint matcher, such as the NIST fingerprint system used inour experiments, is likely to under perform with this type ofimage.
Three iris quality measures are used. The first one, i.e., texturerichness measure, is obtained by a weighted sum of themagnitudes of Mexican hat Wavelet coefficients as implementedin [13]. The other two quality measures are functions of estimatediris and pupil circles. The first one is the difference between irisdiameter and pupil diameter. If this difference is small, the irisarea to be matched will be small, hence implying that the matchscores may not be reliable. The second measure is the proportionof iris used for matching which is one minus the proportion of amask with respect to the entire iris area. A mask is needed toprevent matching on areas containing eyelashes and specular
lights, for instance. Unfortunately, due to bad iris segmentation,and possibly suboptimal threshold to distinguish eyelashes fromiris, our iris baseline system is far from the performance claimedby Daugman’s implementation [14].
3. The evaluation protocols
The current release of the desktop scenario contains dataacquired from 333 persons. For each person, four samples per datastream are available. The first sample of the first session is used tobuild a biometric template. The second sample of the first sessionis used as a query to generate a genuine user match score ofsession 1 whereas the two samples of the second session are usedin a similar way to generate two genuine user match scores. Atemplate is the data sample used to represent the claimed identitywhereas a query is the sample with which the template iscompared. The impostor scores are produced by comparing allfour samples originating from another population of personsexcluding the reference users.
It is important to distinguish two data sets, i.e., the develop-
ment and the evaluation sets. The development set is used foralgorithm development, e.g., finding the optimal parameters of analgorithm, including setting the global decision threshold. Animportant distinction between the two is that the population ofusers in these two data sets are disjoint. This ensures that theperformance assessment is unbiased. There are 51 genuine usersin the development set and 156 in the evaluation set. These twosets of users constitute the 207 users available in the database.The remaining 126 subjects (i.e., 333 - 207) are considered as anexternal population of users who serve as zero-effort impostors.The next two paragraphs explain the development and evaluationimpostor score sets.
The development impostor score set contains 103� 4 samples,i.e., 103 persons and each contributes four samples. In relationshipto the template of a reference subject, all the four samples of theremaining half of the 207 subjects are considered impostors in thedevelopment set in Session 1. The other half of 207 subjects areused as impostors in Session 2. This ensures that the impostorsused in Sessions 1 and 2 are not the same. Such a characteristic isimportant for algorithm development.
Note that the evaluation impostor score set contains 126subjects, set apart as zero-effort impostors. In this way, a fusionalgorithm will not make use of impostors seen during its trainingstage; hence, avoiding systematic and optimistic bias of perfor-mance.
Table 3 summarizes the explanation of the genuine user andimpostor score sets of the development and evaluation data sets.The exact number of accesses differs from that listed in this tablebecause of missing observation as a result of the failure of thesegmentation process or other stages of biometric authentication.

ARTICLE IN PRESS
Table 3The experimental protocol for the BioSecure DS2 database.
Data sets No. of match scores per person
Dev. set (51 persons) Eva. set (156 persons)
S1
Gen 1 1
Imp 103� 4 126� 4
S2
Gen 2 2
Imp 103� 4 126� 4
� � � are persons� samples. This number should be multiplied by the number of
persons in the above set to obtain the total number of accesses for the genuine or
the impostor classes.
S1=S2¼ Sessions 1 and 2.
N. Poh et al. / Pattern Recognition 43 (2010) 1094–1105 1097
The experimental protocol involves minimal manual intervention.In the event of any failure, a default score of ‘‘�999’’ is outputted.Similarly, a failure to extract quality measures will result in avector containing a series of ‘‘�999’’ .
Although the desktop scenario involves supervised dataacquisition, the level of supervision differs from one collectionsite to another. As a result, there may be site-dependent bias interms of performance.
In the following sub-sections, we shall explain the twoevaluation schemes.
3.1. Cost-sensitive evaluation
The cost-sensitive evaluation was designed with two goals:
(1)
to assess the robustness of a fusion algorithm when somematch scores and/or quality measures are not present; this istypically due to failure to acquire and/or failure to match.(2)
to test how well a fusion algorithm can perform with minimalcomputation and hardware cost.Note that a ‘‘cost’’ can also be associated with the time to acquire/process a biometric sample. Hence, longer time implies highercost, and vice versa.
Assigning a cost to a channel of data is a very subjective issue.In this study, we adopt the following rules of thumb:
�
If a device is used at least once, a fusion algorithm will becharged a unit cost, although we are aware that in reality,different devices may have different cost. This choice is clearlydevice and task dependent. � The subsequent use of the same device will be charged 0.3 of aunit in view of the fact that the same hardware is being reused.
� A device is considered used if a fusion algorithm acquires asample for subsequent processing, i.e., to extract qualitymeasures and/or to obtain a match score. This is regardlessof whether the resulting match score will actually contributeto the final combined score.
Through the cost-sensitive evaluation, the design of a fusionalgorithm becomes more challenging because the task now is tomaximize the recognition performance while minimizing the costassociated to the device usage. In this respect, there exists twostrategies to solve this problem, which can be termed as a fixed
parallel and a sequential approach. A fixed parallel solution pre-selects a set of channels and use them for all access requests. Asequential solution, on the other hand, may use different channelsfor different access requests. The sequence of systems used isdetermined dynamically.
For the cost-sensitive evaluation, the following streams of dataare used: ffa1; ft1� 6; ir1g, hence a total of eight expert outputsare considered. These subset of streams are chosen so that thefusion of all the systems will not give empirically observed zeroerror rate; otherwise, fusion algorithms cannot be compared. Thetotal combination of eight expert outputs in this case is28� 1¼ 255. This is the result of choosing one out of 8 expert
outputs to combine, two out of 8, etc, up to 8 out of 8, leading to255 combinations. Note that it is not possible to choose none outof the 8 experts (hence explaining the minus one in 28
� 1).
3.2. Cross-device quality-dependent evaluation
The goal of this evaluation experiment is to assess the ability ofa fusion algorithm to select more reliable channels of data, givenquality measures derived from biometric data. The task is mademore challenging with cross-device matching, i.e., a matching canoccur between a biometric template acquired using one deviceand a query biometric data acquired using another device. In ourcase, the template data is always acquired using a high qualitydevice (giving better verification performance) and the query datamay be acquired using a high or a low quality device. Note thatcross device matching occurs only in the latter case. The channelsof data considered are face and the three right fingerprints,denoted as fnf, fo1, fo2 and fo3. In case of cross device matching,these channels are denoted as xfa, xft1, xft2 and xft3. Thedevelopment set consisting of scores and quality measurescorresponding to all eight channels were distributed to theparticipants. The (sequestered) evaluation set, on the other hand,contains only four channels of data as a result of mixing fnf/xfa(face taken with a digital camera/webcam) and fofng=xftfng for allnAf1;2;3g (optical/thermal fingerprint sensor for three fingers;see description in Table 1). These four channels of data can be anyof the following combinations:
(a)
[fnf, fo1, fo2, fo3]—no device mismatch (b) [fnf, xft1, xft2, xft3]—device mismatch for the fingerprintsensor
(c) [xfa, fo1, fo2, fo3]—device mismatch for the face sensor (d) [xfa, xft1, xft2, xft3]—device mismatch for both the face andfingerprint sensors
In our experiment setting, the identity of the acquisition device isassumed to be unknown. This is a realistic scenario because as abiometric technology is deployed, it may be replaced by a newerdevice. Furthermore, its configuration may change, resulting in itsacquired query biometric data being significantly different fromthe previously stored template data. This fusion problem ischallenging because each of the four combinations shown aboverequire a different fusion strategy in order to achieve the optimalresult.
3.3. Simulation of failure-to-acquire and failure-to-match scenarios
For each of the above mentioned two evaluation schemes, wealso introduce a variation of the problem in order to simulatefailure-to-acquire and failure-to-match scenarios. The motivationis to evaluate the robustness of a multimodal biometric systemwith respect to both types of failures. In principal, a multimodalsystem contains redundant subsystems, each of which produces ahypothesis regarding the authenticity of an identity claim.However, to our knowledge, such redundancy has never beenformally evaluated.
In order to simulate the failures, one can assume that they aredevice- and subject-dependent; device- and subject-independent;
ARTICLE IN PRESS
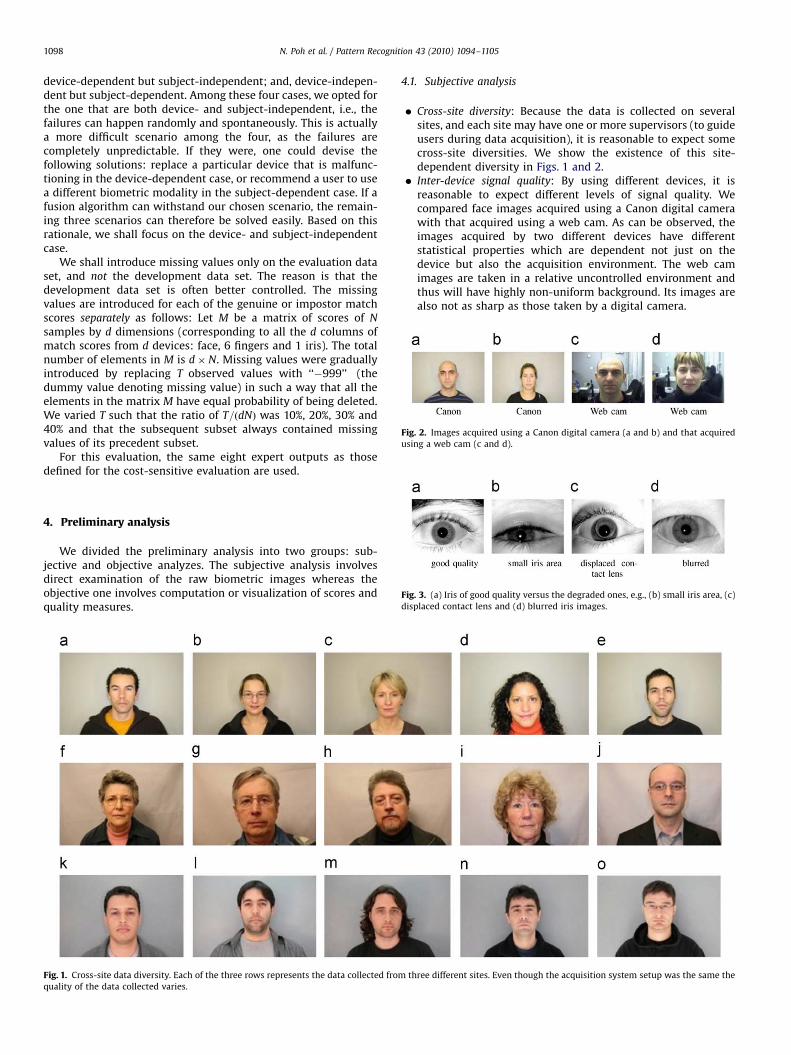
Fig. 2. Images acquired using a Canon digital camera (a and b) and that acquired
using a web cam (c and d).
N. Poh et al. / Pattern Recognition 43 (2010) 1094–11051098
device-dependent but subject-independent; and, device-indepen-dent but subject-dependent. Among these four cases, we opted forthe one that are both device- and subject-independent, i.e., thefailures can happen randomly and spontaneously. This is actuallya more difficult scenario among the four, as the failures arecompletely unpredictable. If they were, one could devise thefollowing solutions: replace a particular device that is malfunc-tioning in the device-dependent case, or recommend a user to usea different biometric modality in the subject-dependent case. If afusion algorithm can withstand our chosen scenario, the remain-ing three scenarios can therefore be solved easily. Based on thisrationale, we shall focus on the device- and subject-independentcase.
We shall introduce missing values only on the evaluation dataset, and not the development data set. The reason is that thedevelopment data set is often better controlled. The missingvalues are introduced for each of the genuine or impostor matchscores separately as follows: Let M be a matrix of scores of N
samples by d dimensions (corresponding to all the d columns ofmatch scores from d devices: face, 6 fingers and 1 iris). The totalnumber of elements in M is d� N. Missing values were graduallyintroduced by replacing T observed values with ‘‘�999’’ (thedummy value denoting missing value) in such a way that all theelements in the matrix M have equal probability of being deleted.We varied T such that the ratio of T=ðdNÞ was 10%, 20%, 30% and40% and that the subsequent subset always contained missingvalues of its precedent subset.
For this evaluation, the same eight expert outputs as thosedefined for the cost-sensitive evaluation are used.
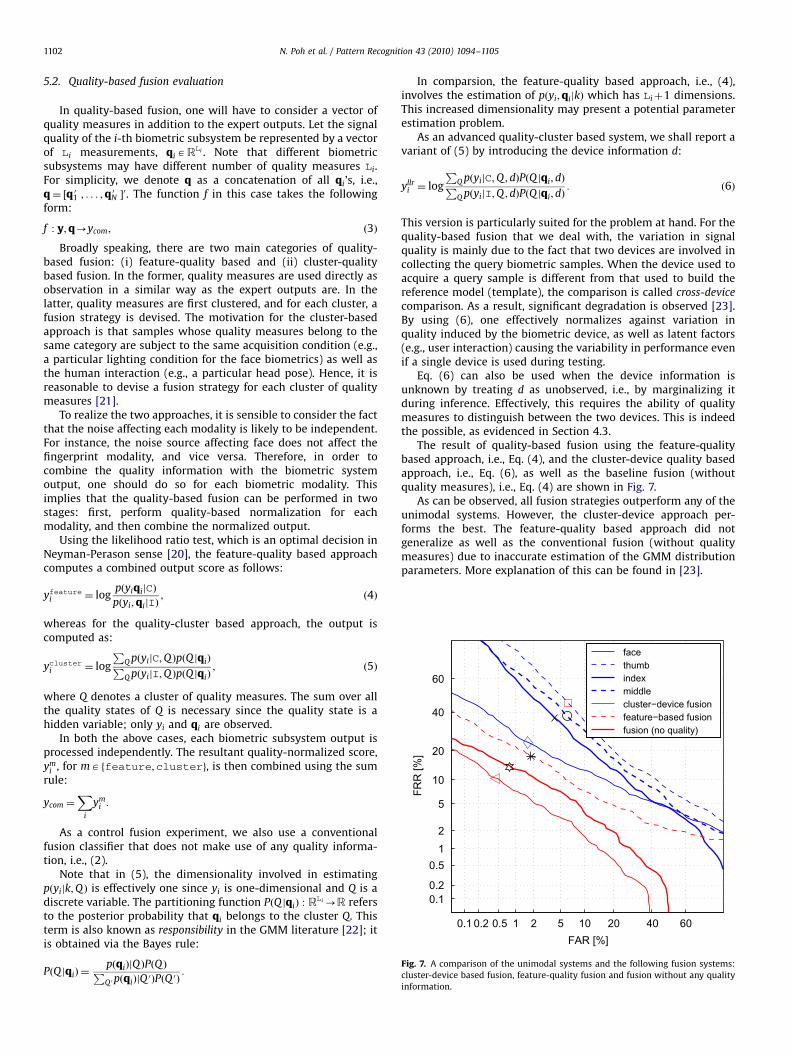
Fig. 3. (a) Iris of good quality versus the degraded ones, e.g., (b) small iris area, (c)
displaced contact lens and (d) blurred iris images.
4. Preliminary analysis
We divided the preliminary analysis into two groups: sub-jective and objective analyzes. The subjective analysis involvesdirect examination of the raw biometric images whereas theobjective one involves computation or visualization of scores andquality measures.
Fig. 1. Cross-site data diversity. Each of the three rows represents the data collected fro
quality of the data collected varies.
4.1. Subjective analysis
�
m th
Cross-site diversity: Because the data is collected on severalsites, and each site may have one or more supervisors (to guideusers during data acquisition), it is reasonable to expect somecross-site diversities. We show the existence of this site-dependent diversity in Figs. 1 and 2.
� Inter-device signal quality: By using different devices, it isreasonable to expect different levels of signal quality. Wecompared face images acquired using a Canon digital camerawith that acquired using a web cam. As can be observed, theimages acquired by two different devices have differentstatistical properties which are dependent not just on thedevice but also the acquisition environment. The web camimages are taken in a relative uncontrolled environment andthus will have highly non-uniform background. Its images arealso not as sharp as those taken by a digital camera.
ree different sites. Even though the acquisition system setup was the same the

ARTICLE IN PRESS
N. Poh et al. / Pattern Recognition 43 (2010) 1094–1105 1099
�
Intra-device signal quality: By examining several images takenby a single device, it is possible also to observe variations insignal quality that may potentially affect the resulting match-ing performance. We did so for the iris images and they areshown in Fig. 3. The various degrading factors that can beobserved here are small iris area, displaced contact lens andblurred iris images (due to miss-adjusted focus or movement).These degrading factors occur quite naturally even in acontrolled environment. This highlights the challenging taskof dealing with varying intra-device signal quality.4.2. Performance on session mismatch and device mismatch
In this section, we test for a bias between the same-sessionversus different-session performance. Very often, data in a singlesession exhibit low intra-device signal quality variation but assoon as data is collected in different sessions (i.e., different visitsseparated by several days, weeks or months), high intra-devicesignal quality variation may be observed. This will affect theresulting system performance. We compared the performance ofthe Session 1 data versus that of Session 2 on the development set(with 51 users). Recall that the template of each user isconstructed from data in Session 1. Hence, the performancecalculated on Session 1 represents an intra-session performancewhereas that of Session 2 represents an inter-session performance.We did so for all the 24 streams of data (see Fig. 4). The first 17streams of data involve matching using the same device. Theremaining 7 streams involve matching templates and query
fa1 fnf1 fo1 fo2 fo3 fo4 fo5 fo6 ft1 ft2 ft3 ft40
5
10
15
20
25
30
35
EE
R (%
)
deveva
Fig. 4. Performance of Session 1 (blue; left bar) vs. Session 2 (red; right bar) in terms of
the same device. The remaining 7 streams involve matching templates and query imag
whereas that of Session 2 as ‘‘eva’’. (For interpretation of the references to color in this
images acquired from different devices. ‘‘xfa1’’ means thedevice-mismatched version of ‘‘fa1’’, i.e., the templates areacquired using ‘‘fnf1’’ (the Canon digital camera) and the queriesare acquired using ‘‘fa1’’ (a web cam). Similarly, for the fingerprintdata streams, ‘‘xftfng’’ refers to the templates acquired using‘‘fofng’’ (optical device) but the queries are acquired using ‘‘ftfng’’(thermal device by sweeping a fingerprint over it), for nA ½1;2;3�denoting the following three right fingers: thumb, index andmiddle fingers, respectively. An important observation is that theintra-session performance is almost always better than the inter-session performance. This shows that the intra-sessionperformance is likely to be biased and should not be used forperformance evaluation.
The experiments here also allow us to compare the cross-device
matching scenario, i.e., ‘‘fa1’’ versus ‘‘xfa1’’ (‘‘x’’ for cross devicematching) and ‘‘ftfng’’ versus ‘‘xftfng’’ for nA ½1;2;3�, eachcorresponding to a right hand finger mentioned previously. Ineach of the experiments of ‘‘fa1’’ versus ‘‘xfa1’’ and ‘‘ftfng’’ versus‘‘xftfng’’ for all n, the query images are taken with the same devicebut the templates used are acquired using a different device. Forthe face experiment, the template images are acquired using adigital camera (hence giving images of higher quality) whereasthe query images are acquired using a web cam (of lower quality).Similarly, for the fingerprint experiments, the template images areacquired using an optical scanner (giving better performance)whereas the query images are acquired using a thermal sensor(giving slightly worse performance). As can be observed, theperformance under cross-device matching is always worse thanthat with the common device, even if the reference models/templates used may be of a higher quality.
ft5 ft6 fwf1 ir1 ir2 xfa1 xft1 xft2 xft3 xft4 xft5 xft6
EER for the 24 streams of data. The first 17 streams of data involve matching using
es acquired by different devices. The performance of Session 1 is labeled as ‘‘dev’’
figure legend, the reader is referred to the web version of this article.)

ARTICLE IN PRESS
0 10 20 30 40 50
Face Detection ReliabilityBrightness
ContrastFocus
Bit per pixelSpatial resolution
IlluminationUniform Background
Background BrightnessReflection
GlassesRotation in PlaneRotation in Depth
Frontalness
HTER (%)
Qua
lity
mea
sure
s
5.6 5.8 6 6.2 6.4 6.60
10
20
30
40
50
60
70
80
90
100
bits per pixel
unifo
rm b
ackg
roun
d
reference devicealternative device
face thumb index middle all fingers0
5
10
15
20
25
data stream
HTE
R (%
)
Fig. 5. The performance in terms of HTER (with threshold chosen to minimize EER on the development set) of each of the 14 face quality measures in discriminating high/
low quality face images, measured on the development set. These detectors are: face detection reliability, brightness, contrast, focus, bits per pixel, spatial resolution
between eyes, illumination, degree of uniform background, degree of background brightness, reflection, presence of glasses, rotation in plane, rotation in depth and degree
of frontal face images. (a) Face device classification given individual quality measures. (b) Scatter plot of bits per pixel vs. uniform background. (c) Device classification for
all streams of data.
N. Poh et al. / Pattern Recognition 43 (2010) 1094–11051100
4.3. Analysis of quality measures
In order to verify that quality measures of our database areuseful, we propose to evaluate their utility in distinguishing theacquisition device. For example, if one knows the device or caninfer the device given the observed quality measures, one canconstruct a device-specific fusion algorithm. We constructed aBayes classifier to solve this problem by estimating the posteriorof a device d given a vector of quality measures q, i.e.,
PðdjqÞ ¼pðqjdÞPðdÞPd0pðqjd
0ÞPðd0Þ;
where PðdÞ is the prior probability of a device, pðqjdÞ is the densityof q given d and the denominator is a normalizing term to ensurethat the sum of PðdjqÞ over all possible d’s equals to one. We use d0
as a variable that loops through all possible devices and d todenote a particular device whose posterior is being evaluated.For this experiment, we used the quality measures of thedevelopment set and measured the performance of PðdjqÞ on anevaluation set. We did so for each of the 14 face quality measuresin order to distinguish between images taken with a digitalcamera from those taken with a web cam. The results areshown in Fig. 5(a). As can be observed, uniform background isthe most discriminative quality measure and this is followed bybits per pixel. This is perfectly reasonable considering that theweb cam images are taken in a more cluttered backgroundwhereas the digital camera images are taken in conditionsconforming to passport standard with plain background. As aresult the images taken with a digital camera have lower averagenumber of bits per pixel (over the entire image). We show ascatter plot of these two quality measures for each device inFig. 5(b). A classifier trained on this device classification problem(with the degree of uniform background and bits per pixel asfeatures) gives an EER (assuming equal prior) of 0.5%. This result isshown in the first bar of Fig. 5(c). The remaining four bars are EERof the fingerprint images. Among them, the first three are theperformance of PðdjqÞ where the devices can be either thermal oroptical and the quality measure q is texture richness [12]. Theperformance of PðdjqÞ for each of the three fingers are in the rangeof 18–23%. If we had three fingerprint samples from these threerespective fingers for each access and we assumed that the same
acquisition device was used, we could take the product of pðdjqÞ
for each image, i.e.,Q3
i ¼ 1 PðdjqiÞ since each measurement isindependent. This results in the last error bar of Fig. 5(c) (denotedby ‘‘all fingers’’), giving about 17% of EER. Obviously, moreindependent observations improve the estimate of PðdjqÞ. Ourmain message here is that automatically derived quality measures
can be potentially used to distinguish devices. Note that inour experiments, the quality measures were not designedspecifically to distinguish the devices for this database. Whilenot all quality measures appear to be useful on their own(as illustrated in Fig. 5(a)), given some development data, anarray of quality measures used jointly would certainly benecessary to distinguish a multitude of possible devices in theframework of pðdjqÞ.
5. Baseline fusion results
5.1. Cost-sensitive fusion evaluation
Let yiAR be the output of the i-th biometric subsystem and letthere be N biometric subsystem outputs, i.e., iAf1; . . . ;Ng. Forsimplicity, we denote y¼ ½yi; . . . ; yN�
0, where the symbol‘‘0’’ is thematrix transpose operator. The most commonly used fusionclassifier in the literature takes the following form:
f : y-ycom; ð1Þ
where ycomAR is a combined score. We shall refer to this classifieras score-level classifier.
The function f can be a generative or a discriminative classifier.In the former case, class-dependent densities are first estimatedand decisions are taken using the Bayes rule or the Dempster-Shafer theory. In the latter, the decision boundary is directlyestimated. A common characteristic of both types of classifiers isthat the dependency among observations (scores or qualitymeasures) is considered.
There exists also another approach that we will refer to as thetransformation-based approach [15] which constructs a fusionclassifier in two stages. In the first stage, the match scores of eachbiometric subsystem are independently transformed into acomparable range, e.g., in the range ½0;1�. In the second stage,the resulting normalized scores of all biometric subsystems arecombined using a fixed rule such as sum or product [16].
As a baseline score-level fusion system, we used a GMM-basedBayesian classifier, i.e., a generative classifier constructed via theBayes rules, using the Gaussian Mixture Model (GMM) as adensity estimator. The output of this fusion classifier can bewritten as:
ycom ¼ logpðyjCÞ
pðyjIÞ: ð2Þ
where pðyjkÞ, for both classes kAfC;Ig (client or impostor), isestimated using a GMM. Its associated decision threshold

ARTICLE IN PRESS
1 1.5 2 2.5 3 3.5 4 4.50
2
4
6
8
10
12
14
16
18
cost
EE
R (%
)
1 1.5 2 2.5 3 3.5 4 4.50
1
2
3
4
5
6
7
8
9
10
average cost per access
EE
R, H
TER
(%)
cross−valid. EER (dev)apriori HTER (eva)aposteriori HTER (eva)aposteriori EER (eva)
Fig. 6. (a) Optimization of UNIS GMM-bayes fusion classifier by a two-fold cross validation on the development set. (b) Rank-one performance vs average access cost. This
GMM-bayes system was provided by the organizer.
N. Poh et al. / Pattern Recognition 43 (2010) 1094–1105 1101
is optimal when
D¼ � logPðCÞ
PðIÞ:
The GMM-based Bayesian fusion classifier was trained on theentire score feature space (a total of eight dimensions). It was thentested on all the 28
� 1¼ 255 combinations of the score featurespace (as described in Section 3.1) by means of Gaussianmarginalization [17,18]. Missing values were handled in the sameway. For instance, if features 1, 2, and 4 are chosen, and 4 ismissing, then the GMM-bayes fusion classifier will calculate thefinal combined score using only features 1 and 2; the remainingfeatures, i.e., f3;4� 8g, are thus marginalized or integrated out.
In order to estimate the fusion performance using only thedevelopment set (recalling that the evaluation scores weresequestered), we employed a two-fold cross-validation. Theresultant performance, measured in terms of averaged EER of thetwo folds, across all 255 combinations, is shown in Fig. 6(a). Plottedin this figure are the median (red), the upper and lower quantiles(cyan and green lines resp.), and, the upper and lower range (inpurple and blue lines) of performance in HTER for a given cost. Notethat there is only one possible way to obtain a cost of 2.5, i.e., bycombining all 6 fingers, hence explaining the convergence ofperformance to a single point. Among these curve, the lowest one(in blue) is the most important one because the goal here is find afusion candidate that has the lowest error at a given cost.
The performance versus cost curves presented in Fig. 6(b) arecalled ‘‘rank-one’’ cost-performance curve. This means that only theperformance of the best fusion candidate (using the GMM-Bayesclassifier) is reported. In a rank-two curve, one would choose theminimum of the top two performing candidates to plot the curve,etc. Three of the four curves were computed on the evaluation setand only one on the development set. The latter is plotted here (inblue) in order to show the actual performance optimized on thedevelopment set via the two-fold cross validation. The reportederror is the average EER of the two folds. The EER measure (ratherthan HTER) is more suitable in this context so that the performanceis independent of the choice of the decision threshold. Theremaining three curves are explained below:
(1)
a priori HTER: This rank-one curve (plotted in red) shows theachievable generalization performance if one were to use thefusion system candidates minimizing a given cost, based onthe development set, via cross-validation.
(2)
a posteriori HTER: This rank-one curve (plotted in green)shows the actual performance in terms of HTER of the fusionsystem candidate on the evaluation set. The assumption hereis that the evaluation set is available but the optimal decisionthreshold is unknown.(3)
a posteriori EER: Finally, this rank-one curve (plotted in black)is similar to the previous one, reporting the performance ofthe fusion system candidates optimizing a given cost on theevaluation set, except that it also assumes that the optimalthreshold is known. This curve is hence reported in EER.When optimizing a fusion classifier without any knowledge of theevaluation set (in the sequestered scenario), the best performanceone can obtain is the first (a priori) curve.
The second and third (rank-one) curves are not achievable;they are shown here in order to show the oracle cases, where theevaluation set is available for the second curve; and on top of that,the optimal decision threshold is known for the third curve. Ascan be observed, by injecting more information, the error actuallydecreases from the first to the second curve; and, from the secondto the third curve.
These curves show that the actual achievable fusion perfor-mance is dependent on two factors: the fusion candidate and the(correct) decision threshold. Choosing the correct candidate givenonly the development set requires a criterion yielding a solutionthat can generalize well across populations. In [19], the authorsdemonstrated that such a criterion can be effectively realizedusing parametric error bounds such as the Chernoff andBhattacharyya bounds [20], rather than computing the EER ofthe fusion performance empirically, as commonly practised. Errorbounds, however, do assume that the underlying scores arenormally distributed and therefore, pre-processing is recom-mended to ensure the conformity of the data to this assumption.In practice, it was observed in [19] that even if the underlyingmultivariate distribution is not strictly Gaussian (as measured bythe standard Gaussianity tests), the estimated bound is still better(in terms of rank-one performance-cost curve) than the empiricalestimates of error (via cross-validation on the development set)for fusion candidate selection.
ARTICLE IN PRESS
0.1 0.2 0.5 1 2 5 10 20 40 60
0.10.2
0.512
5
10
20
40
60
FAR [%]
FRR
[%]
facethumbindexmiddlecluster−device fusionfeature−based fusionfusion (no quality)
Fig. 7. A comparison of the unimodal systems and the following fusion systems:
cluster-device based fusion, feature-quality fusion and fusion without any quality
information.
N. Poh et al. / Pattern Recognition 43 (2010) 1094–11051102
5.2. Quality-based fusion evaluation
In quality-based fusion, one will have to consider a vector ofquality measures in addition to the expert outputs. Let the signalquality of the i-th biometric subsystem be represented by a vectorof Li measurements, qiARLi . Note that different biometricsubsystems may have different number of quality measures Li.For simplicity, we denote q as a concatenation of all qi’s, i.e.,q¼ ½q1
0 ; . . . ;qN0 �0. The function f in this case takes the following
form:
f : y;q-ycom; ð3Þ
Broadly speaking, there are two main categories of quality-based fusion: (i) feature-quality based and (ii) cluster-qualitybased fusion. In the former, quality measures are used directly asobservation in a similar way as the expert outputs are. In thelatter, quality measures are first clustered, and for each cluster, afusion strategy is devised. The motivation for the cluster-basedapproach is that samples whose quality measures belong to thesame category are subject to the same acquisition condition (e.g.,a particular lighting condition for the face biometrics) as well asthe human interaction (e.g., a particular head pose). Hence, it isreasonable to devise a fusion strategy for each cluster of qualitymeasures [21].
To realize the two approaches, it is sensible to consider the factthat the noise affecting each modality is likely to be independent.For instance, the noise source affecting face does not affect thefingerprint modality, and vice versa. Therefore, in order tocombine the quality information with the biometric systemoutput, one should do so for each biometric modality. Thisimplies that the quality-based fusion can be performed in twostages: first, perform quality-based normalization for eachmodality, and then combine the normalized output.
Using the likelihood ratio test, which is an optimal decision inNeyman-Perason sense [20], the feature-quality based approachcomputes a combined output score as follows:
yfeaturei ¼ logpðyiqijCÞ
pðyi;qijIÞ; ð4Þ
whereas for the quality-cluster based approach, the output iscomputed as:
yclusteri ¼ log
PQ pðyijC;Q ÞpðQ jqiÞPQ pðyijI;Q ÞpðQ jqiÞ
; ð5Þ
where Q denotes a cluster of quality measures. The sum over allthe quality states of Q is necessary since the quality state is ahidden variable; only yi and qi are observed.
In both the above cases, each biometric subsystem output isprocessed independently. The resultant quality-normalized score,ym
i , for mAffeature;clusterg, is then combined using the sumrule:
ycom ¼X
i
ymi :
As a control fusion experiment, we also use a conventionalfusion classifier that does not make use of any quality informa-tion, i.e., (2).
Note that in (5), the dimensionality involved in estimatingpðyijk;Q Þ is effectively one since yi is one-dimensional and Q is adiscrete variable. The partitioning function PðQ jqiÞ : R
Li-R refersto the posterior probability that qi belongs to the cluster Q. Thisterm is also known as responsibility in the GMM literature [22]; itis obtained via the Bayes rule:
PðQ jqiÞ ¼pðqiÞjQ ÞPðQ ÞPQ 0pðqiÞjQ
0ÞPðQ 0Þ:
In comparsion, the feature-quality based approach, i.e., (4),involves the estimation of pðyi;qijkÞ which has Liþ1 dimensions.This increased dimensionality may present a potential parameterestimation problem.
As an advanced quality-cluster based system, we shall report avariant of (5) by introducing the device information d:
yllri ¼ log
PQ pðyijC;Q ; dÞPðQ jqi; dÞPQ pðyijI;Q ; dÞPðQ jqi; dÞ
: ð6Þ
This version is particularly suited for the problem at hand. For thequality-based fusion that we deal with, the variation in signalquality is mainly due to the fact that two devices are involved incollecting the query biometric samples. When the device used toacquire a query sample is different from that used to build thereference model (template), the comparison is called cross-device
comparison. As a result, significant degradation is observed [23].By using (6), one effectively normalizes against variation inquality induced by the biometric device, as well as latent factors(e.g., user interaction) causing the variability in performance evenif a single device is used during testing.
Eq. (6) can also be used when the device information isunknown by treating d as unobserved, i.e., by marginalizing itduring inference. Effectively, this requires the ability of qualitymeasures to distinguish between the two devices. This is indeedthe possible, as evidenced in Section 4.3.
The result of quality-based fusion using the feature-qualitybased approach, i.e., Eq. (4), and the cluster-device quality basedapproach, i.e., Eq. (6), as well as the baseline fusion (withoutquality measures), i.e., Eq. (4) are shown in Fig. 7.
As can be observed, all fusion strategies outperform any of theunimodal systems. However, the cluster-device approach per-forms the best. The feature-quality based approach did notgeneralize as well as the conventional fusion (without qualitymeasures) due to inaccurate estimation of the GMM distributionparameters. More explanation of this can be found in [23].

ARTICLE IN PRESS
0 2 4 6 8 10 12 14 160
2
4
6
8
10
12
14
16
EER of user−independent fusion (%)
EE
R o
f use
r−sp
ecifi
c fu
sion
(%)
123
Fig. 8. Client-specific versus client-independent fusion. Shown in the legends are
the number of systems to combine. The legend with ‘‘1’’ reports the system
performance before and after normalization (no fusion was involved).
N. Poh et al. / Pattern Recognition 43 (2010) 1094–1105 1103
5.3. Client-specific fusion evaluation
Let jAf1; . . . ; Jg be a claimed identity and there are J enrolleesin the database. A client-specific fusion strategy takes a claimedidentity, j, as well as the biometric subsystem outputs y in order toproduce a final combined output.
f : y; j-ycom: ð7Þ
By exploiting the specific characteristic of each enrollee, theresultant fusion classifier differs slightly in parameters from oneuser to another. This fusion problem is not entirely new, and hasbeen examined in [24–30]. The main difficulty in designing aclient-specific classifier is the scarcity of the genuine user scoresfor each enrollee. In our data set, there is only a genuine score(obtained from the second sample of session one). A seconddifficulty is that this sample was collected in session one, i.e., thesame session as the sample which was used to build a referencemodel/template (recalling that two samples are collected in eachsession). As a results, due to the lack of cross-session variability,the resultant genuine scores are biased, i.e, resulting in higherperformance than it should be under different sessions. Theperformance with and without cross-session variability hasalready been shown in Fig. 4.
As a baseline client-specific fusion approach, we shall use themethod proposed in [30]. The idea is to apply a client-specificscore normalization procedure to each biometric subsystemoutput independently and then only designing a fusion classifierto combine the normalized score outputs. This two steps can beformally described in two steps, i.e., the following client-specificscore normalization
Cj : yi-ynormi;j ; foriAf1; . . . ;Ng
followed by the following fusion:
f : ynorm1;j ; . . . ; ynorm
N;j -ycom:
According to [30], there are three families of client-specific scorenormalization procedures producing very distinctive effects,namely, the Z-, F- and EER-norm. Among them, the F-norm wasempirically shown to be the most effective in exploiting thegenuine score information. The reason is that it relies only on thefirst order of moment (and not the second order), hence providingsome robustness to the paucity of the genuine scores. The F-normis defined as:
CjðyÞ ¼y� mIj
gmCj þð1� gÞmC � mIj
;
where mC is the client-independent genuine mean score, mIj is theclient-specific impostor mean score, and mCj is the client-specificgenuine mean score. The parameter g [0,1] weighs the contribu-tion between the client-specific genuine mean score and theclient-independent one. The F-norm has the following effect:the resultant impostor match scores have zero mean whereas thegenuine match score has an expected value of one.
It should be noted that the among the parameters of the F-norm, mCj is the one which cannot be estimated reliably. In ourexperiment setup, in essence, the parameter is estimated from asingle score. Moreover, the sample from which this score wasobtained was collected from the same session as the enrollmentsample. Hence, the resultant score is biased as it does not containinter-session variability (hence leading to optimistically betterperformance on the dev set compared to the eva set, as depicted inFig. 4). As a means to guard against the small sample size (leadingto the estimation problem of mCj ) as well as the systematic biasedof the estimated parameter, in [30], it was recommended thatg¼ 0:5 is used. Following this recommendation, we applied the F-norm to each of the eight expert outputs in the cost-based
evaluation experimental protocol, and then combined the resul-tant normalized scores using logistic regression [31]. For thefusion experiments, we exhaustively combined two and three outof the possible eight expert outputs. Fig. 8 compares the fusionresults of the client-specific fusion classifier as described herewith a client-independent one realized using logistic regression(without applying any client-specific score normalizationprocedure before fusion). Also shown in the figure is theperformance of each of the eight systems before and afternormalization (shown with the legend ‘‘1’’). As can be observed,consistent with the literature, the client-specific fusion classifier,in the majority of the cases, outperforms the client-independentfusion classifier.
6. Conclusions
While score-level fusion has always been treated as a staticproblem, in particular, of the form
Piwiyi, where wi is the weight
associated with the i-th system output yi, by using qualitymeasures, one can realize a fusion rule of the form
PiwiðqÞyi,
where wiðqÞ is dependent on the signal quality, as characterized bythe vector of quality measures, q. This is an example of a quality-dependent fusion algorithm.
Despite the importance of research in quality-dependentfusion, to the best of our knowledge, there existed no publiclyavailable database to benchmark the algorithms. The BioSecureDS2 database (with the desktop scenario) is the first benchmarkdatabase designed for this purpose. We summarize here themultibiometric system fusion scenarios that can be investigatedby the proposed database:
�
Quality-dependent evaluation: This evaluation scheme allowsmatching with query images obtained from several sensorswhich may be different from the one used to build a biometrictemplate/model. A matching algorithm often under-performsin the presence of a device mismatch between a template and aquery image. In this situation, quality measures are madeavailable so that the designer of a fusion algorithm can develop
ARTICLE IN PRESS
N. Poh et al. / Pattern Recognition 43 (2010) 1094–11051104
a fusion algorithm that adapts itself according to the quality ofthe raw biometric signal as captured by the quality measures.For the face biometrics, as many as 14 quality measures aremade available for this purpose.
� Cost-sensitive evaluation: The evaluation is posed as anoptimization problem where the objective is to minimize acost-sensitive criterion while maximizing the overall systemperformance. Cost in this sense refers to the price paid foracquiring and processing more information, e.g., requestingmore samples from the same device or using more biometricdevices (which entails longer processing time), and as aresult of making wrong false acceptance and false rejectiondecisions.
� Missing observation: Scores and quality measures may not beavailable. Observations are missing because a biometric systemfails to process or match a query sample with a template.
� User-specific/person-dependent strategy: The score/quality dataset is designed to test fusion algorithms that can adaptthemselves according to the claimed identity label.
At present, this database contains 333 subjects and is still growing(it is expected to contain in excess of 500 users).
Our analysis based on this database reveals the followings:
�
Biased intra-session performance: The performance measuredon data with intra-session data (where template and queryimages are taken in a single session or visit) is likely to beoptimistically biased as opposed to performance on inter-session data (collected in two or more sessions or visits). � Degraded performance with device mismatch: When the tem-plate and query images are taken with different devices, in ascenario referred to as a device mismatch, the resultingperformance will be worse than what would be obtainedwhen matching with the same device.
� The discriminatory power of quality measures to distinguishacquisition devices: The automatically derived quality measuresfrom the raw biometric data can be used to suggest theidentity of the acquisition device.
Our on-going work extends the possibility of using the inferreddevice identity to realize a device-specific score normalizationprocedure as well as using such information at the fusion level.
Acknowledgments
This work was supported partially by the advanced researcherfellowship PA0022_121477 of the Swiss National Science Founda-tion, by the EU-funded Mobio project (www.mobioproject.org)Grant IST-214324 and by the BioSecure project (www.biosecure.info).
References
[1] A. Ross, K. Nandakumar, A.K. Jain, Handbook of Multibiometrics, Springer,New York, 2006.
[2] C. Sanderson, Automatic person verification using speech and face informa-tion, Ph.D. thesis, Griffith University, Queensland, Australia, 2002.
[3] K. Nandakumar, Integration of multiple cues in biometric systems, M.S. thesis,Michigan State University, 2005.
[4] J. Luttin, Evaluation protocol for the XM2FDB database (Lausanne Protocol),Communication 98-05, IDIAP, Martigny, Switzerland, 1998.
[5] C. Sanderson, The VidTIMIT Database, Communication 06, IDIAP, 2002.[6] E. Bailly-Bailli�ere, S. Bengio, F. Bimbot, M. Hamouz, J. Kittler, J. Marithoz,
J. Matas, K. Messer, V. Popovici, F. Por�ee, B. Ruiz, J.-P. Thiran, The BANCAdatabase and evaluation protocol, 4th International Conference Audio- and
Video-Based Biometric Person Authentication, AVBPA 2003, Lecture Notes inComputer Science, vol. 2688, Springer, Berlin, 2003.
[7] S. Garcia-Salicetti, C. Beumier, G. Chollet, B. Dorizzi, J. Leroux les Jardins,J. Lunter, Y. Ni, D. Petrovska-Delacrtaz, BIOMET: a multimodal personauthentication database including face, voice, fingerprint, hand and signaturemodalities, in: 4th International Conference on Audio- and Video-BasedBiometric Person Authentication (AVBPA 2003), Lecture Notes in ComputerScience, vol. 2688, Guildford, 2003, pp. 845–853.
[8] P.J. Phillips, P.J. Flynn, T. Scruggs, K.W. Bowyer, J. Chang, K. Hoffman,J. Marques, J. Min, W. Worek, Overview of the face recognition grandchallenge, in: IEEE Computer Society Conference on Computer Vision andPattern Recognition, 2005, pp. 947–954.
[9] H. Meng, P.C. Ching1, T. Lee1, M.W. Mak, B. Mak, Y.S. Moon, X. Tang M.-H. Siu,H.P.S. Hui, A. Lee, W-K. Lo, B. Ma, E.K.T. Sioe, The multi-biometric, multi-device and multilingual (m3) corpus, in: Workshop on Multimodal UserAuthentication (MMUA 2003), Toulouse, 2006.
[10] J. Ortega-Garcia, J. Fierrez, F. Alonso-Fernandez, J. Galbally, M.R. Freire,J. Gonzalez-Rodriguez, C. Garcia-Mateo, J.-L. Alba-Castro, E. Gonzalez-Agulla,E. Otero-Muras, S. Garcia-Salicetti, L. Allano, B. Ly-Van, B. Dorizzi, J. Kittler,T. Bourlai, N. Poh, F. Deravi, R. Ng, M. Fairhust, J. Hennebert, A. Humm,M. Tistarelli, L. Brodo, J. Richiardi, A. Drygajlo, H. Ganster, F. Sukno,S.-K. Pavani, A. Frangi, L. Akarun, A. Savran, The multi-scenario multi-environment biosecure multimodal database (bmdb), IEEE Transactions onPattern Analysis and Machine, 2009, accepted for publication.
[11] N. Poh, S. Bengio, Database, protocol and tools for evaluating score-levelfusion algorithms in biometric authentication, Pattern Recognition 39 (2)(2005) 223–233.
[12] Y. Chen, S.C. Dass, A.K. Jain, Fingerprint quality indices for predictingauthentication performance, in: 5th International Conference Audio- andVideo-Based Biometric Person Authentication (AVBPA 2005), Lecture Notes inComputer Science, vol. 3546, New York, 2005, pp. 160–170.
[13] Y. Chen, S. Dass, A. Jain, Localized iris image quality using 2-d wavelets, in:Proceedings of the International Conference on Biometrics (ICB), Hong Kong,2006, pp. 373–381.
[14] J. Daugman, How Iris Recognition Works, Kluwer Publishers, Dordrecht, 1999(Chapter 6).
[15] A. Jain, K. Nandakumar, A. Ross, Score normalisation in multimodal biometricsystems, Pattern Recognition 38 (12) (2005) 2270–2285.
[16] J. Kittler, M. Hatef, R.P.W. Duin, J. Matas, On combining classifiers, IEEETransactions on Pattern Analysis and Machine Intelligence 20 (3) (1998)226–239.
[17] C.M. Bishop, Pattern Recognition and Machine Learning, Springer, Berlin,2007.
[18] A.C. Morris, M.P. Cooke, P.D. Green, Some solutions to the missing featuresproblem in data classification with application to noise robust automaticspeech recognition, in: IEEE International Conference on Acoustics, Speech,and Signal Processing (ICASSP), Seattle, 1998, pp. 737–740.
[19] N. Poh, J. Kittler, On using error bounds to optimize cost-sensitive multimodalbiometric authentication, in: Proceedings of the 19th International Con-ference on Pattern Recognition (ICPR), 2008.
[20] R.O. Duda, P.E. Hart, D.G. Stork, Pattern Classification and Scene Analysis,Wiley, New York, 2001.
[21] N. Poh, G. Heusch, J. Kittler, On combination of face authentication experts bya mixture of quality dependent fusion classifiers, in: Multiple ClassifiersSystem (MCS), Lecture Notes in Computer Science, vol. 4472, Prague, 2007,pp. 344–356.
[22] C. Bishop, Neural Networks for Pattern Recognition, Oxford University Press,Oxford, 1999.
[23] N. Poh, T. Bourlai, J. Kittler, Quality-based score normalisation with devicequalitative information for multimodal biometric fusion, IEEE Transactionson Systems, Man, and Cybernatics (part B), 2009, accepted for publication.
[24] A. Jain, A. Ross, Learning user-specific parameters in multibiometric system,in: Proceedings of the International Conference of Image Processing (ICIP2002), New York, 2002, pp. 57–70.
[25] R. Snelick, U. Uludag, A. Mink, M. Indovina, A. Jain, Large scale evaluation ofmultimodal biometric authentication using state-of-the-art systems, IEEETransactions on Pattern Analysis and Machine Intelligence 27 (3) (2005)450–455.
[26] J. Fierrez-Aguilar, D. Garcia-Romero, J. Ortega-Garcia, J. Gonzalez-Rodriguez,Exploiting general knowledge in user-dependent fusion strategies for multi-modal biometric verification, in: IEEE International Conference Acoustics,Speech, and Signal Processing (ICASSP), Montreal, 2004, vol. 5, pp. 617–620.
[27] J. Fierrez-Aguilar, D. Garcia-Romero, J. Ortega-Garcia, J. Gonzalez-Rodriguez,Bayesian adaptation for user-dependent multimodal biometric authentica-tion, Pattern Recognition 38 (2005) 1317–1319.
[28] A. Kumar, D. Zhang, Integrating palmprint with face for user authentication,in: Workshop on Multimodal User Authentication (MMUA 2003), SantaBarbara, 2003, pp. 107–112.
[29] K.-A. Toh, X. Jiang, W.-Y. Yau, Exploiting global and local decision formultimodal biometrics verification, IEEE Transactions on Signal Processing 52(10) (2004) 3059–3072.
[30] N. Poh, J. Kittler, Incorporating variation of model-specific score distributionin speaker verification systems, IEEE Transactions on Audio, Speech andLanguage Processing 16 (3) (2008) 594–606.
[31] T. Hastie, R. Tibshirani, J. Friedman, The Elements of Statistical Learning,Springer, Berlin, 2001.

ARTICLE IN PRESS
N. Poh et al. / Pattern Recognition 43 (2010) 1094–1105 1105
About the Author—NORMAN POH received a Ph.D. (2006) in Computer Science from the Swiss Federal Institute of technology in Lausanne (EPFL), Switzerland. He thenworked with Prof. Josef Kittler as a post-doctoral researcher at CVSSP, University of Surrey (UniS). Currently, he is a research fellow as well as one of the work packageleaders in the EU-funded Mobile biometry project. His areas of expertise are multiple classifier systems, pattern recognition and biometrics. He published in excess of 50peer-reviewed scientific papers in these areas and is the main author of three best paper awards: International Conference on Audio-visual Biometric PersonAuthentication—AVBPA 2005, International Conference on Biometrics—ICB 2009, and Pattern Recognition Journal 2006, as well as a recipient of two personal (post-doctoral level) research fellowships (2006 and 2008–2009, respectively) from the Swiss National Science Foundations.
About the Author—THIRIMACHOS BOURLAI received an Engineering Diploma (M.Eng. equivalent) from the Aristotle University of Thessaloniki, Greece (1999). He receiveda M.Sc. in Medical Imaging with Distinction from the University of Surrey, UK (2002). There he was awarded a full scholarship to continue his studies as a doctoratecandidate. Under the directions of Prof. Josef Kittler he completed his Ph.D. in the field of face recognition and smart cards (2006) and his post-doctrate in multi-modalbiometrics (August 2007). Then he worked as a post-doctoral researcher in a joint project between the University of Houston and the Methodist Hospital (Department ofSurgery) in the fields of thermal imaging and computational physiology. Since February 2009 he works with Prof. Arun Ross as a Visiting Research Assistant Professor at thebiometrics center of West Virginia University. His areas of expertise are image processing, pattern recognition and biometrics.
About the Author—JOSEF KITTLER heads the Centre for Vision, Speech and Signal Processing at the Faculty of Engineering and Physical Sciences, University of Surrey. Hereceived his B.A., Ph.D. and D.Sc. degrees from the University of Cambridge in 1971, 1974 and 1991 respectively. He teaches and conducts research in the subject area ofmachine intelligence, with a focus on biometrics, video and image database retrieval, automatic inspection, medical data analysis, and cognitive vision.
He published a Prentice Hall textbook on Pattern Recognition: A Statistical Approach and several edited volumes, as well as more than 500 scientific papers, including inexcess of 150 journal papers. He serves on the Editorial Board of several scientific journals in Pattern Recognition and Computer Vision. He became Series Editor of SpringerLecture Notes on Computer Science in 2004. He served as President of the International Association for Pattern Recognition 1994–1996. He was elected Fellow of the RoyalAcademy of Engineering in 2000. In 2006 he was awarded the KS Fu Prize from the International Association in 2006, for outstanding contributions to pattern recognition.He received Honorary Doctorate from the Czech Technical University in Prague in 2007 and the IET Faraday Medal in 2008.