Embed Size (px)
Citation preview
1
A Multilevel Modeling Approach to the Analysis of Self-
Employment Survival
(first draft)
Begoña Cueto Vanesa Rodríguez Patricia Suárez Department of Applied Economics Department of Sociology Department of Economics 985104996 985105046 985103729 [email protected] [email protected] [email protected]
University of Oviedo. Avda. del Cristo, s/n
33006- Oviedo (Spain)
Abstract
Entrepreneurship is being fostered as a type of employment to avoid unemployment,
especially during this time of economic crisis. The aim of this paper is to analyze the
characteristics of new entrants into self-employment as well as the survival of their businesses
two years after the start-up. We can observe the effects of the economic downturn through
the increase in both the number of inflows and outflows from self-employment. Entries into
self-employment show a growing trend, which could be connected to the lack of salaried
employment. At the same time, self-employment survival is lower, resulting in an increase in
the number of outflows from the RETA. Based on different waves of the MCVL, we can
compute the duration of self-employment spells. The survival rate after one year was 70%
before the crisis, whereas it has dropped to 60% now, reflecting the negative impact of the
crisis. Using multilevel models, we have found that the main determinants of survival two
years after the star-up are related to the previous labour market trajectory of the individual.
Keywords: self-employment, unemployment, multilevel models, duration JEL codes: J21
2
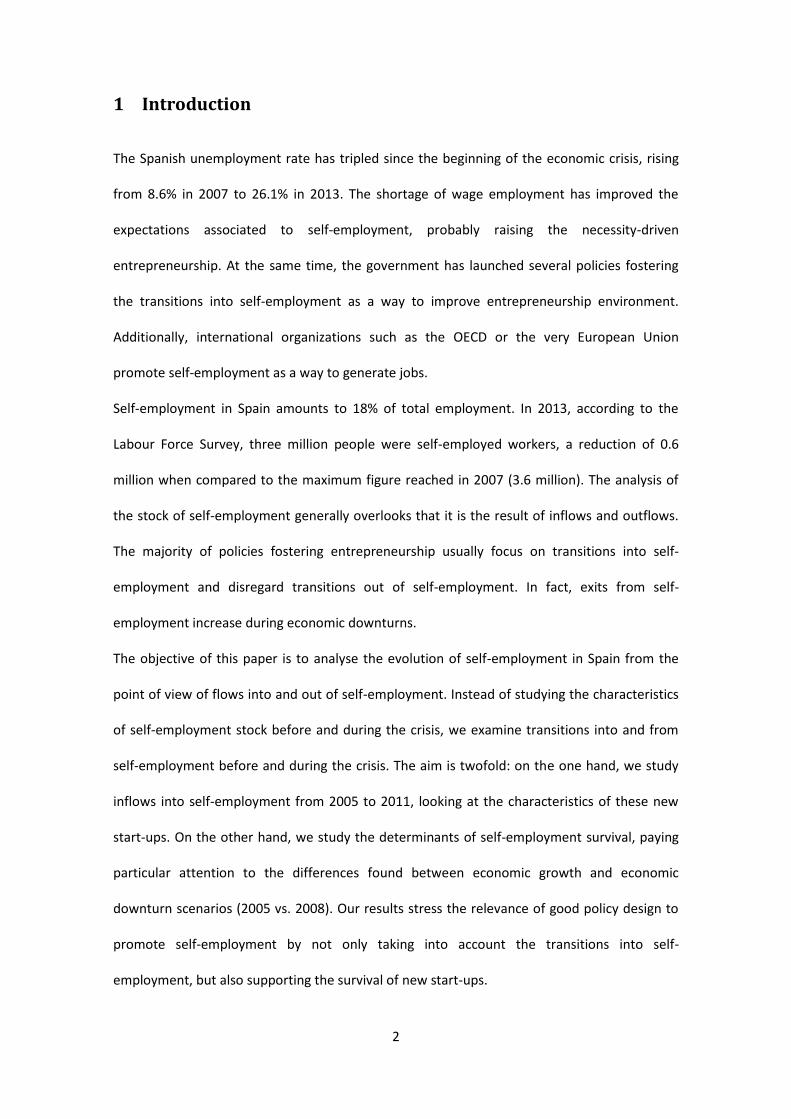
1 Introduction
The Spanish unemployment rate has tripled since the beginning of the economic crisis, rising
from 8.6% in 2007 to 26.1% in 2013. The shortage of wage employment has improved the
expectations associated to self-employment, probably raising the necessity-driven
entrepreneurship. At the same time, the government has launched several policies fostering
the transitions into self-employment as a way to improve entrepreneurship environment.
Additionally, international organizations such as the OECD or the very European Union
promote self-employment as a way to generate jobs.
Self-employment in Spain amounts to 18% of total employment. In 2013, according to the
Labour Force Survey, three million people were self-employed workers, a reduction of 0.6
million when compared to the maximum figure reached in 2007 (3.6 million). The analysis of
the stock of self-employment generally overlooks that it is the result of inflows and outflows.
The majority of policies fostering entrepreneurship usually focus on transitions into self-
employment and disregard transitions out of self-employment. In fact, exits from self-
employment increase during economic downturns.
The objective of this paper is to analyse the evolution of self-employment in Spain from the
point of view of flows into and out of self-employment. Instead of studying the characteristics
of self-employment stock before and during the crisis, we examine transitions into and from
self-employment before and during the crisis. The aim is twofold: on the one hand, we study
inflows into self-employment from 2005 to 2011, looking at the characteristics of these new
start-ups. On the other hand, we study the determinants of self-employment survival, paying
particular attention to the differences found between economic growth and economic
downturn scenarios (2005 vs. 2008). Our results stress the relevance of good policy design to
promote self-employment by not only taking into account the transitions into self-
employment, but also supporting the survival of new start-ups.
3
2 Motivation for entrepreneurship
Policies promoting self-employment are one of the most commonly used measures to combat
unemployment. Increasing the number of businesses may not only directly help reduce
unemployment figures but indirectly as well, through the creation of additional jobs in the new
start-ups. This type of policies often includes programs to encourage the entry into self-
employment, whilst those aimed at other stages of the business cycle are slightly uncommon.
However, it must be taken into account that the survival of new businesses does not come
easy, with high closing risk rates during the early stages. For example, German data in Fritsch
et al. (2006) show that around 50% of new businesses do not survive more than five years.
The survival of self-employment is affected by many factors. In an analysis of self-employment
survival in several European countries between 1994 and 2001, Millán et al. (2012 ) synthetize
the results of an extensive literature , noting the influence of aspects related to personal
characteristics (sex , age, country of origin , educational level, self-employment in the family,
wealth), work history (prior experiences both in paid and self-employment, previous
unemployment spells) , characteristics of the business (industry, company size) and the
economic, social and political environment (unemployment rate , GDP growth , regulation,
policy support). Overall, the empirical evidence is only conclusive in a few of these aspects,
since in most cases both positive and negative effects are found for the different variables.
A key distinction in the analysis of self-employment is the reason to undertake this activity.
This reason may vary from one individual to another: the aspiration to be their own boss, the
desire to develop a business idea, to continue a family business or the lack of salaried
employment, among others. A key distinction in the literature is between the "push" and
"pull" factors, leading to necessity or opportunity self-employment, respectively.
4
Amit and Muller (1994) refer to "push" entrepreneurs as those who lost their job, probably
due to poor performance, and decide to move to self-employment. Instead, "pull"
entrepreneurs are persons who perceive self-employment as a challenge that may provide
potential rewards (both of a monetary and non-monetary nature). The central hypothesis of
these authors, backed by empirical evidence, is that the latter are more likely to succeed
probably as a result of having more business skills. This allows them to conclude that knowing
the motivation to undertake self-employment, in addition to the specific characteristics of
entrepreneurs, may increase the chance of selecting those most likely to succeed.
On the "Global Entrepreneurship Monitor" (GEM) report, Reynolds et al. (2001) coined the
concepts of Opportunity- based entrepreneurial activity and Necessity -based entrepreneurial
activity so as to distinguish between those who decide to start a new activity after identifying a
business opportunities, from people who, often in times of economic crisis, decide to become
self-employed due to the lack of waged job opportunities1. Thus, the former would imply a
greater contingent element than the latter. The latest GEM report, referred to 2012, indicates
that necessity self-employment is greater in economies with higher levels of economic
development.
Hessels et al. (2008) identified three main reasons to be an entrepreneur: autonomy, higher
level of income and necessity. Using GEM data, they conclude that entrepreneurship support
policy makers should discourage necessity self-employment as they are unlikely to contribute
to innovation and job growth, contrary to what happens to those who choose self-
employment for their greater autonomy levels or the possibility of greater income.
Several studies have examined the relationship between the reasons to enter self-employment
and those of survival, although the evidence is not conclusive in this respect (Block and
Sandner, 2009; Giacomin, 2011; Furdas and Kohn, 2011). For instance, Block and Sandner
(2009) using data from the German Socio-Economic Panel (GSOEP) for the period 1990-2003,
1 The incentive to be self-employed due to unemployment is also called “refuge effect” (Thurik et al.,
2008).
5
show that, after controlling for the effect of education, there are no differences between the
survival of necessity and opportunity self-employed workers. These authors conclude that the
key to explain that there are no such differences lies in the training received regarding the
professional field under which the activity is performed. Also with data from Germany, but this
time for unemployed individuals benefitting from self-employment support programs,
Caliendo and Kriticos (2009, 2010) conclude that "pull" entrepreneurs are more likely to
survive than their "push" counterparts. As for the Spanish case, the analyses have not explicitly
taken into account the reasons for entry into self-employment. Muñoz-Bullón and Cueto
(2010) analysed the survival of self-employed workers who had previously been in waged
employment, finding that previous spells of unemployment negatively contribute to survival,
especially if they are long-term unemployed. This result matches that by Carrasco (1999).
Ultimately, the reason for the transition into self-employment appears to be key in the success
of the business. Therefore, the aim of this article is to study the self-employment of people
who started their own business in the period 2005-2011. Along these years, we find a period of
economic growth that ends abruptly, going from all-time low to all-time high unemployment
rates in just five years. On the one hand, the characteristics of those who start self-
employment spells during this period will be explored, by analysing whether there are
significant differences among them, and, on the other hand, the survival rates to determine
whether the factors behind are the same throughout the above mentioned period of time or if,
conversely, they differ as the economic cycle worsens. The reason for the transition into self-
employment will be considered in both cases, by using different variables to differentiate
between opportunity and necessity entrepreneurs.

6
3 Stock evolution and self-employment flows
The analysis of flows of workers to and from the RETA (Self-employed Special Scheme, in
Spanish Régimen Especial de Trabajadores Autónomos) is not easy as a consequence of several
methodological changes undergone by data of workers signed on with the Social Security. In
fact, the integration into the RETA in January 2008 of self-employed workers who previously
were under the REA (Agricultural Special Scheme, in Spanish Régimen Especial Agrícola)
prevents us from studying the effects of the crisis on labour flows using the RETA, unless we
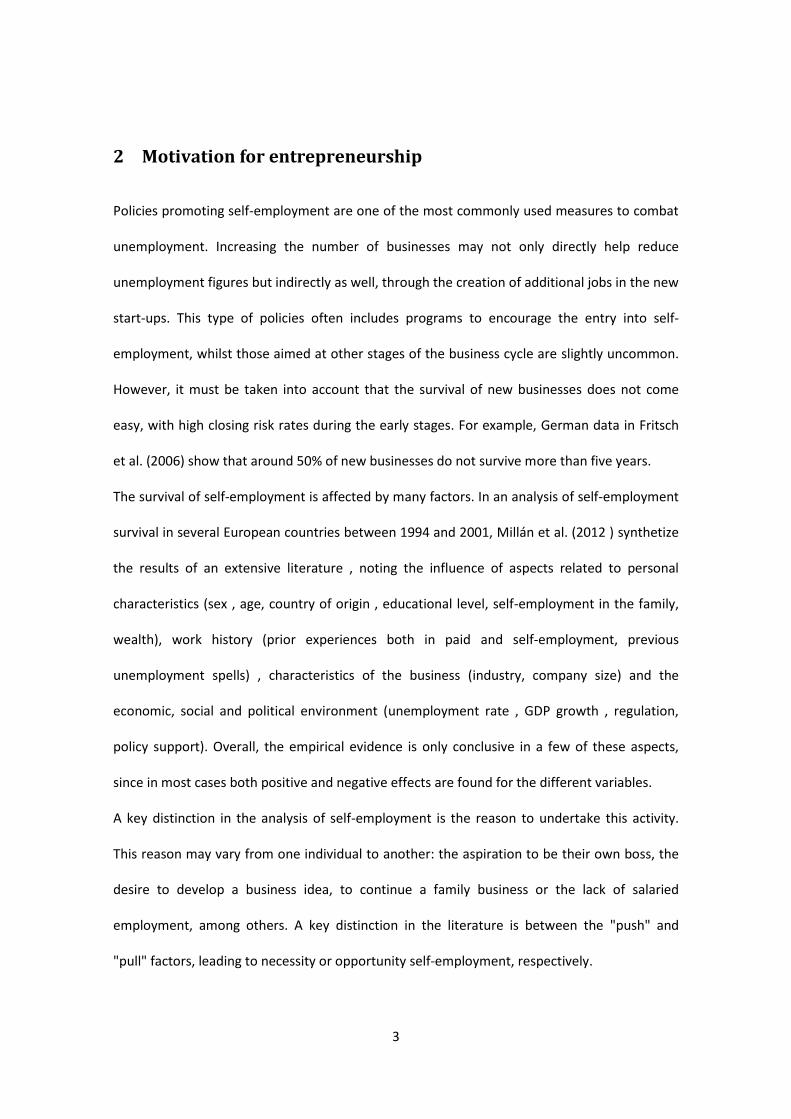
use microdata. Due to this, we do not know whether the rupture in the growing trend of
registrations onto the Social Security system and the stability of discharges occurs in 2008 or in
2009 (Figure 1). In any case, it can be observed that the gap between inflows and outflows
caused by an increase in the number of affiliations to the RETA breaks, so that in 2009 there is
a net reduction and, between 2010 and 2013, the number of inflows and outflows is practically
the same, albeit with a higher level of outflows than that recorded prior to 2008.
Consequently, in 2013 the number of self-employed workers returns to 2006 levels, although it
must not be forgotten that it now includes self-employed workers who previously were under
the REA, as we have already mentioned. That is, the effect of the crisis materializes in a lower
probability of employment survival, resulting in an increase in the number of outflows from
the RETA. Moreover, entries into self-employment show a growing trend, which could be
connected to the existence of a "refugee" effect or “necessity" self-employment in response to
the lack of salaried employment.
7
Figure 1. Affiliates, inflows and outflows from the RETA
(1) The increase in workers from January 2008 is due to the integration of self-employed workers who were under
the Agricultural Special Scheme into the Self-Employed Special Scheme, according to the provisions of Law 18/2007
of 4 July.
Source: Bulletin of Labour Statistics. MEYSS (in Spanish, MInisterio de Empleo y Seguridad Social).
3.1 Inflows in the RETA with the MCVL
To achieve the goal outlined in the introduction, data drawn from the available waves of the
the Muestra Continua de Vidas Laborales (MCVL) —i.e., Continuous Sample of Working Lives-
will be used, choosing all self-employment spells initiated in the indicated period and excluding
the agricultural sector. The objective is to analyse whether there are any changes with regard
to the profile of the person that transits into self-employment during the years of economic
expansion (2005-2007) when compared to the years of economic crisis (2008-2011) and,
secondly, to study the duration of these spells of employment.
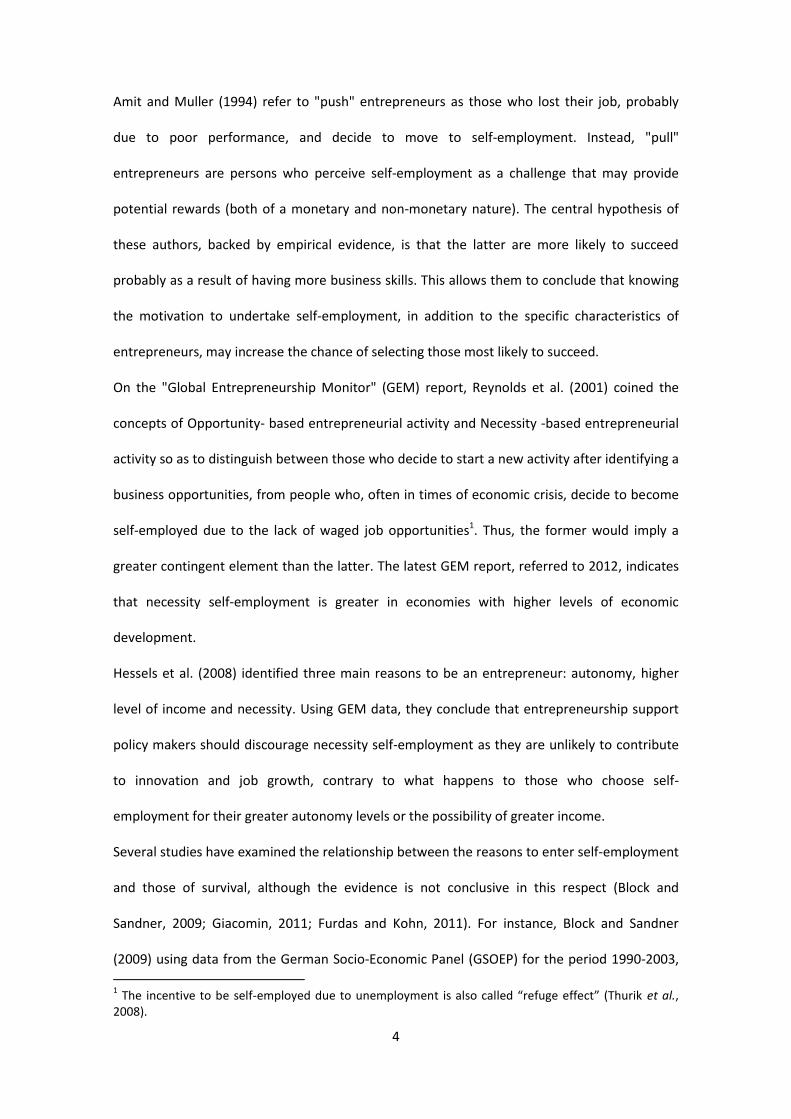
Figure 2 shows the evolution of the number of entries into self-employment during the period
2005-2011. The availability of microdata from the MCVL allows us to analyse these data in a
uniform manner once that the agricultural sector has been excluded no other scheme has ever
2.700
2.800
2.900
3.000
3.100
3.200
3.300
3.400
3.500
0
100.000
200.000
300.000
400.000
500.000
600.000
700.000
800.000
2005 2006 2007 2008 2009 2010 2011 2012 2013*
Inflows
Outflows
RETA

8
been included (Special Agricultural Scheme or Special Sea Scheme). The decrease in the
number of entries into self-employment occurs in 2008 and it is primarily a male effect
(17.9%), since the reduction in the case of women is 7.4%. From 2010, the number of entries
increases again, showing a similar trend for both men and women. This may be due to both an
increase of necessity self-employment and the impact of the numerous incentives to
entrepreneurship launched, especially targeting specific groups such as young individuals and
women.
Figure 2. Inflows into the RETA, by sex (excluding the agricultural sector, weighted data)
Source: own elaboration from 2005-2011 MCVL.
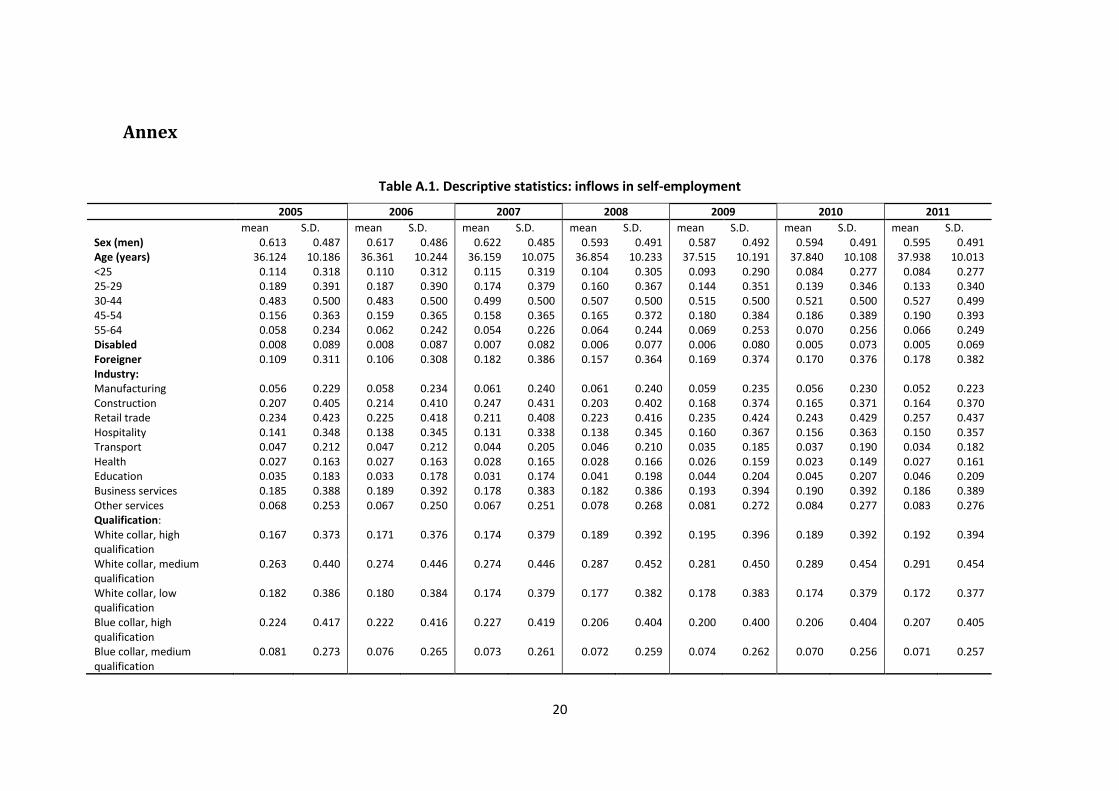
Regarding the characteristics of those who initiated an episode of self-employment in each of
the years considered, the percentage of women slightly increases and the average age of new
self-employed workers. One of the most significant changes is that of the percentage of self-
employed workers who were born outside Spain, which almost doubles in the years
considered, since their number increases from 10.9% in 2005 to 17.8% in 2011.
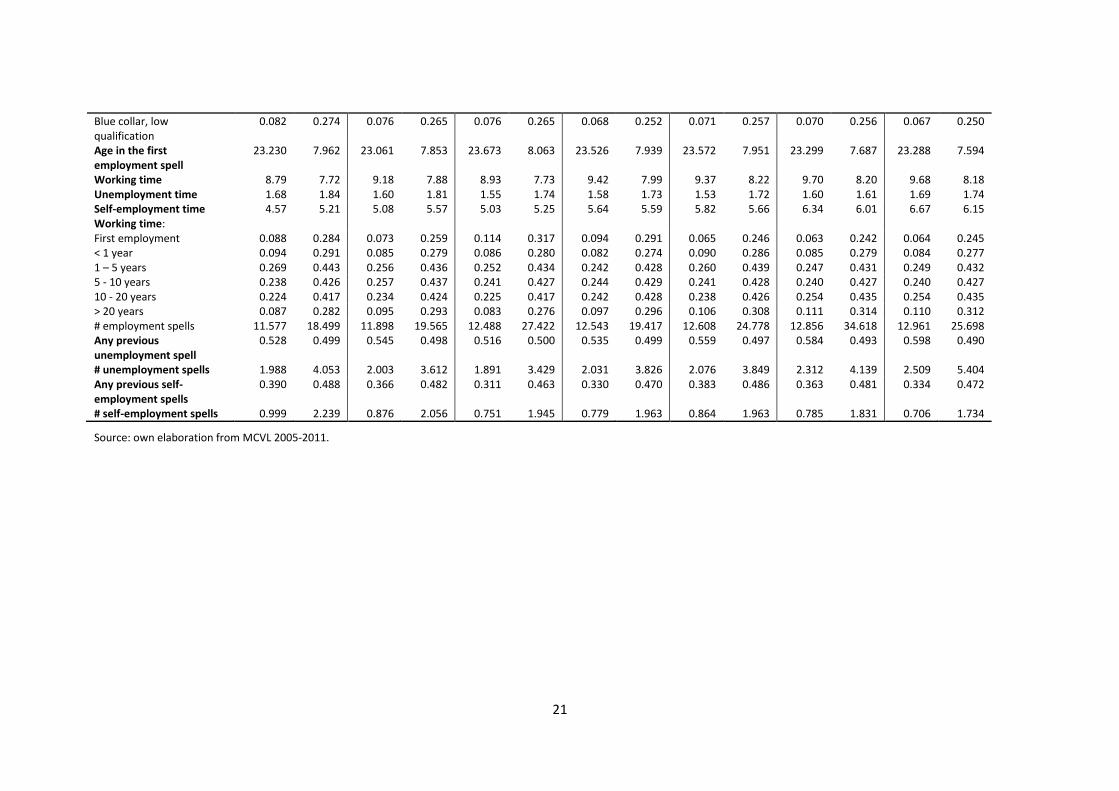
In general, these are individuals with a wide experience in the labour market (having worked
for 9 years on average), much of which consists in other episodes of self-employment,
although the share of this group reduces over time, from 39% in 2005 to 33.4% in 2011.
0
50.000
100.000
150.000
200.000
250.000
300.000
350.000
2005 2006 2007 2008 2009 2010 2011
Women
Men

9
Moreover, around half of them have experienced an episode of unemployment, and this ratio
also increases along the years considered (from 52.8% in 2005 to 59.8% in 2011).
As previously stated, differentiating between opportunity and necessity entrepreneurship can
be relevant in order to estimate the survival and growth potential of new firms. However, it is
difficult to identify which features contribute to distinguish between either type of self-
employment. In several surveys, there are specific questions about the motivation for entering
self-employment. For instance, Caliento and Kritikos (2009) define opportunity entrepreneurs
as those people willing to be their own boss or find a business opportunity, while necessity
entrepreneurs are those entering self-employment from unemployment or following a
recommendation from the public employment service.
The Global Entrepreneurship Monitor uses the Total Entrepreneurial Activity (TEA) as a key
indicator. It measures the percentage of adults in an economy who are nascent and new
entrepreneurs. Questions about the reason entering self-employment allow the
characterization of new business as opportunity or necessity. GEM defines necessity-driven
entrepreneurs as those who are pushed into starting businesses because they have no other
work options. Opportunity-motivated entrepreneurs are those entering self-employment to
pursue an opportunity2.
If there is no information about the reasons for entering self-employment, distinguishing
between opportunity and necessity entrepreneurship is more difficult. Block and Sandner
(2009) and Block and Wagner (2010) use data from the German Socio-Economic Panel (GSOEP)
and classify new self-employed workers according to the reason for ending their previous
employment spell (in the last two years). Those voluntarily leaving the job are defined as
opportunity entrepreneurs, while those workers who were laid off or left the firm because it
went bankrupt are necessity entrepreneurs.
2 The 2012 GEM Report estimates opportunity entrepreneurship in 72.3% (84.2% in 2006).
10
The MCVL does not contain information related to the motivation for entering self-
employment. However, we have data about the previous trajectory of new self-employed
workers. This data allow us to distinguish entrepreneurs according to their labour market
status immediately before they become self-employed. Therefore we can identify new self-
employed workers transiting from wage employment, unemployment or non-participation in
the labour market.
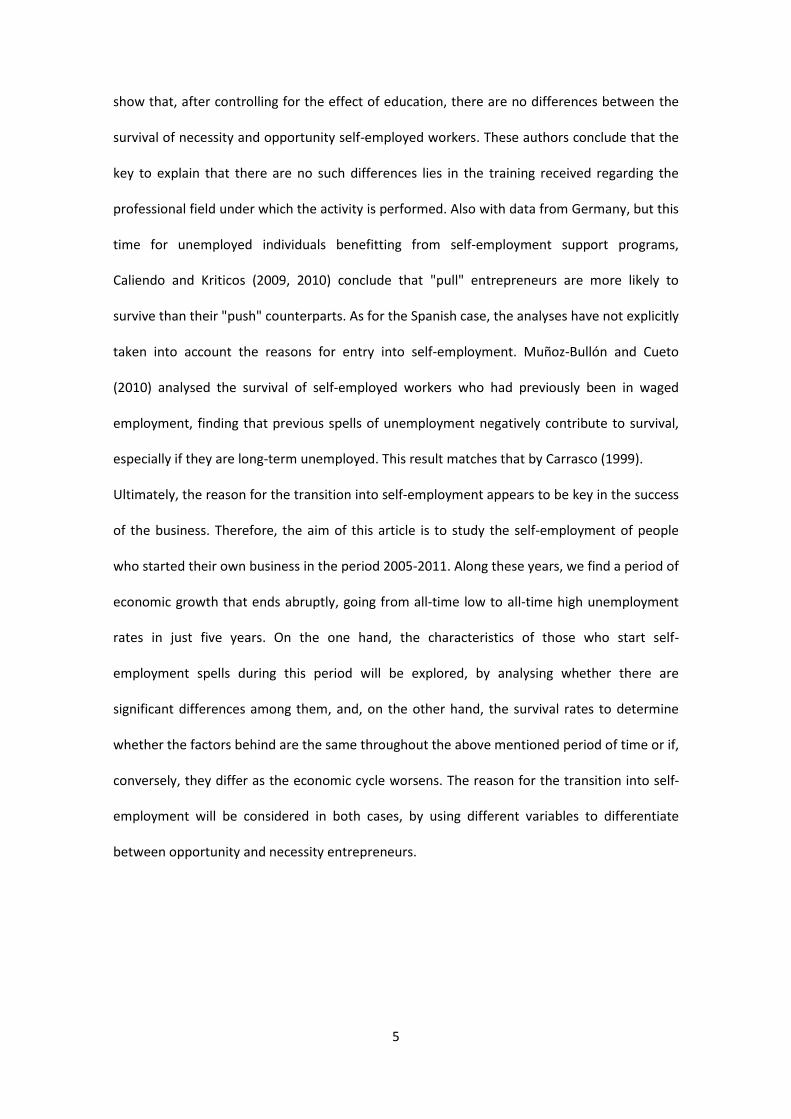
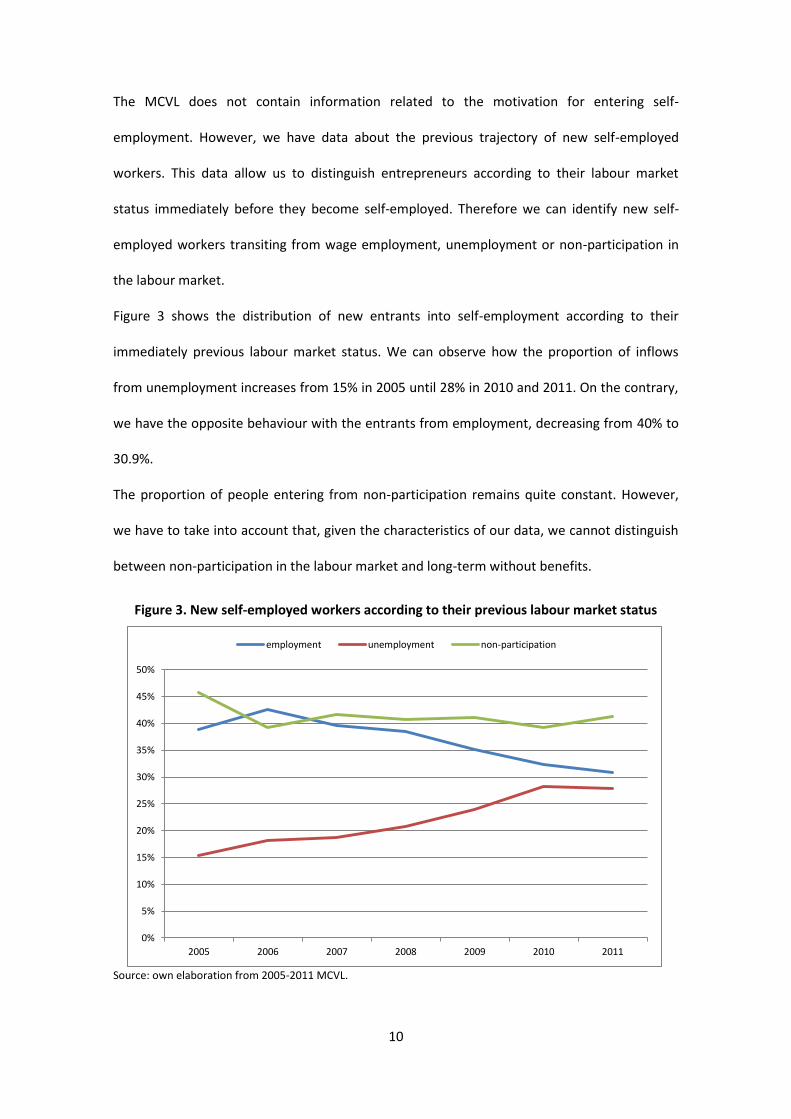
Figure 3 shows the distribution of new entrants into self-employment according to their
immediately previous labour market status. We can observe how the proportion of inflows
from unemployment increases from 15% in 2005 until 28% in 2010 and 2011. On the contrary,
we have the opposite behaviour with the entrants from employment, decreasing from 40% to
30.9%.
The proportion of people entering from non-participation remains quite constant. However,
we have to take into account that, given the characteristics of our data, we cannot distinguish
between non-participation in the labour market and long-term without benefits.
Figure 3. New self-employed workers according to their previous labour market status
Source: own elaboration from 2005-2011 MCVL.
0%
5%
10%
15%
20%
25%
30%
35%
40%
45%
50%
2005 2006 2007 2008 2009 2010 2011
employment unemployment non-participation
11
4 Survival in self-employment
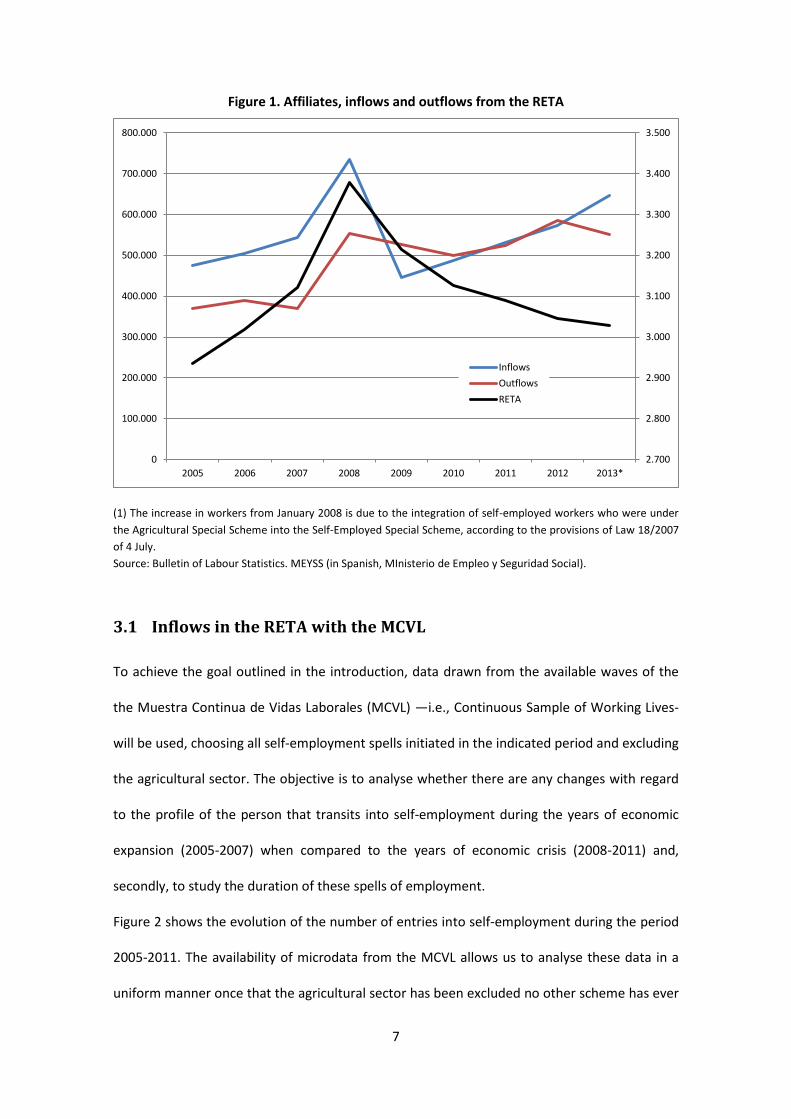
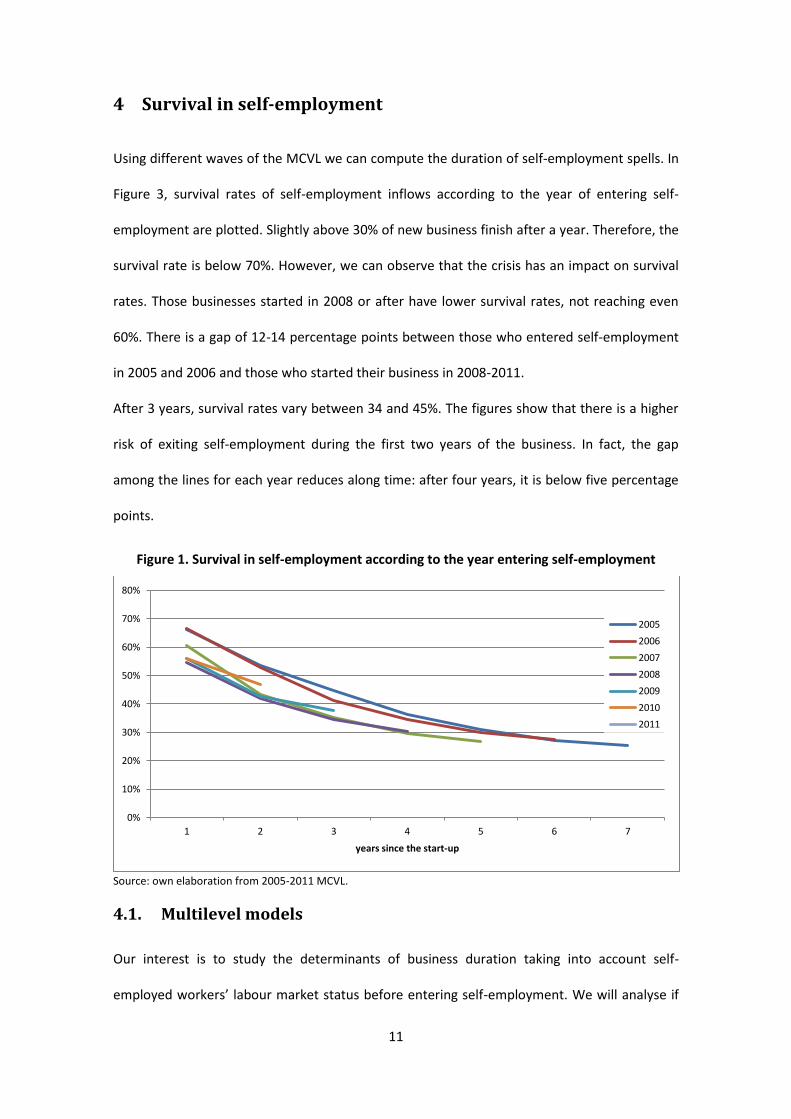
Using different waves of the MCVL we can compute the duration of self-employment spells. In
Figure 3, survival rates of self-employment inflows according to the year of entering self-
employment are plotted. Slightly above 30% of new business finish after a year. Therefore, the
survival rate is below 70%. However, we can observe that the crisis has an impact on survival
rates. Those businesses started in 2008 or after have lower survival rates, not reaching even
60%. There is a gap of 12-14 percentage points between those who entered self-employment
in 2005 and 2006 and those who started their business in 2008-2011.
After 3 years, survival rates vary between 34 and 45%. The figures show that there is a higher
risk of exiting self-employment during the first two years of the business. In fact, the gap
among the lines for each year reduces along time: after four years, it is below five percentage
points.
Figure 1. Survival in self-employment according to the year entering self-employment
Source: own elaboration from 2005-2011 MCVL.
4.1. Multilevel models
Our interest is to study the determinants of business duration taking into account self-
employed workers’ labour market status before entering self-employment. We will analyse if
0%
10%
20%
30%
40%
50%
60%
70%
80%
1 2 3 4 5 6 7
years since the start-up
2005
2006
2007
2008
2009
2010
2011
12
the probability of the business still running after two years is different for workers entering
self-employment from unemployment and those from a different employment spell.
Considering the current economic downturn, we will compare years 2005 and 2008. If we
follow the trajectory of business starting in 2005 and 2008 in the following two years, the
economic situation does not change for them: those starting in 2005 remain in a growth
environment until 2007, while those starting in 2008 will still be in an economic crisis setting.
We apply multilevel analysis in order to assess the importance of regional labour market
conditions for explaining the observed variation in survival rates. Multilevel modelling is
appropriate when data are hierarchically structured, that is, when it consists of units grouped
at different levels of a hierarchy. We estimate the probability of a self-employed worker to
continue running his/her business after two years using a logistic multilevel model. The
dependent variable has a binary outcome equals 1 if the individual is still self-employed and 0
otherwise.
Our independent variables include socioeconomic characteristics (sex, age, qualification,
disability and nationality), the previous labour market trajectory (working time, unemployment
experience and self-employment experience) and business characteristics (industry).
We consider two levels, namely the individual level and the regional labour market level,
where the individuals are nested.
4.2. Determinants of self-employment survival
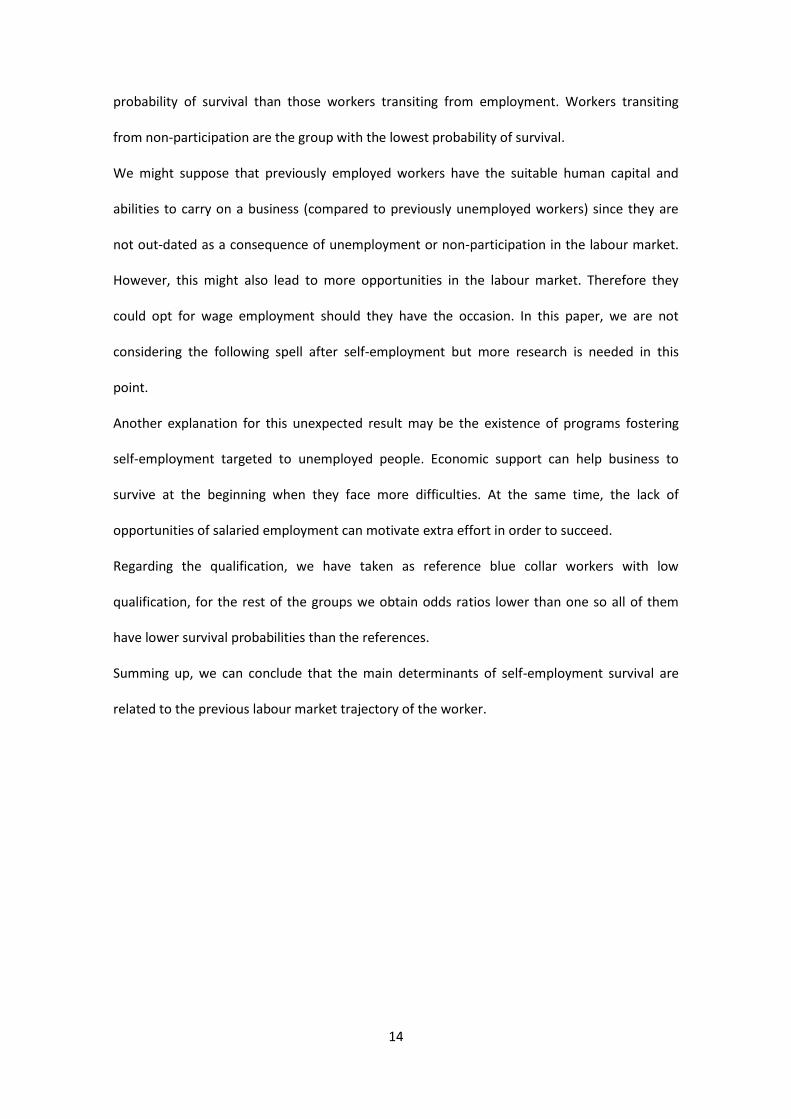
Table 2 display the results of our estimations in terms of coefficients and odds ratios. Before
explaining the effect of the previous labour market situation and the differences between both
years, we would like to present some other results. For instance, start-ups by Spanish
individuals have a greater probability of survival than the immigrants’ ones, being the effect
much higher in 2008 than in 2005. Workers with disability have less probability of survival than
workers without disability, although the effect is non-significant.
13
The industry of the business also has a significant effect on survival. Taking as a reference
manufacturing, construction businesses have the lowest probability of survival, being the
effect much in 2008 than in 2005. This is an expected result given the effect of the crisis on this
sector. In fact, all the industries have odds ratios lower than manufacturing (transport is non-
significant).
With respect to age, we find a positive relationship with survival rates. In other words, the
probability of survival increases with age. Taking people below 25 years of age as a reference,
all the odds ratios are greater than one, having the highest values in the central age groups
(between 30 and 44 years of age). On the contrary, working time before entering self-
employment also shows a positive relationship. Taking as reference those people with more
than twenty years of experience, all the odd ratios are lower than one and the magnitude is
especially low if the self-employment spell is the first employment experience for the
individual. The negative effect diminishes if the self-employed worker had labour experience
of at least one year and there is a positive relationship between previous experience and
survival. These results support the need for a deeper analysis of self-employment among
young people and a critical evaluation of policies fostering entrepreneurship among young
people.
Labour trajectory in terms of previous unemployment and self-employment spells also plays a
significant role. Individuals without unemployment experience (in terms of unemployment
benefits spells) have a higher probability of survival than workers with at least one previous
unemployment spell while previous experience in self-employment has a negative effect on
survival. However, we should be careful when explaining this result, given that in the case of
self-employed workers the recurrence in this form of employment is quite common.
The labour market situation prior to entering self-employment has an unexpected result. The
odds ratio shows that workers entering self-employment from unemployment have a higher
14
probability of survival than those workers transiting from employment. Workers transiting
from non-participation are the group with the lowest probability of survival.
We might suppose that previously employed workers have the suitable human capital and
abilities to carry on a business (compared to previously unemployed workers) since they are
not out-dated as a consequence of unemployment or non-participation in the labour market.
However, this might also lead to more opportunities in the labour market. Therefore they
could opt for wage employment should they have the occasion. In this paper, we are not
considering the following spell after self-employment but more research is needed in this
point.
Another explanation for this unexpected result may be the existence of programs fostering
self-employment targeted to unemployed people. Economic support can help business to
survive at the beginning when they face more difficulties. At the same time, the lack of
opportunities of salaried employment can motivate extra effort in order to succeed.
Regarding the qualification, we have taken as reference blue collar workers with low
qualification, for the rest of the groups we obtain odds ratios lower than one so all of them
have lower survival probabilities than the references.
Summing up, we can conclude that the main determinants of self-employment survival are
related to the previous labour market trajectory of the worker.
15
Table 2. Determinants of business survival
2005 2008
O.R. S.E.
coef. S.E.
O.R. S.E.
coef. S.E.
Previous labour market situation (ref: employment) Unemployment 1.597 0.089 *** 0.468 0.056 *** 1.341 0.077 *** 0.293 0.057 *** Non-participation 1.088 0.046 ** 0.084 0.042 ** 0.710 0.032 *** -0.342 0.045 *** sex (men) 0.983 0.040
-0.018 0.040
1.065 0.045
0.063 0.042
Age (ref: < 25) 25-29 1.149 0.079 ** 0.139 0.069 ** 1.238 0.100 *** 0.214 0.081 ***
30-44 1.270 0.085 *** 0.239 0.067 *** 1.369 0.105 *** 0.314 0.077 *** 45-54 1.161 0.094 * 0.150 0.081 * 1.248 0.111 ** 0.222 0.089 ** 55-64 0.994 0.103
-0.006 0.104
1.142 0.125
0.133 0.110
Non-disabled 1.115 0.135
0.109 0.121
0.858 0.115
-0.153 0.135 Spanish 1.634 0.108 *** 0.491 0.066 *** 2.359 0.165 *** 0.858 0.070 ***
Industry (ref: manufacturing) Construction 0.668 0.056 *** -0.403 0.083 *** 0.408 0.035 *** -0.896 0.086 *** Retail trade 0.855 0.070 * -0.156 0.082 * 0.812 0.067 ** -0.208 0.082 ** Hospitality 0.484 0.042 ** -0.725 0.086 *** 0.628 0.055 *** -0.466 0.087 *** Transport 1.160 0.126
0.148 0.109
0.957 0.104
-0.043 0.109
Health 0.959 0.126
-0.042 0.132
0.970 0.129
-0.030 0.133 Education 0.311 0.039 *** -1.168 0.124 *** 0.358 0.044 *** -1.027 0.124 ***
Business services 0.751 0.064 *** -0.287 0.086 *** 0.673 0.058 *** -0.396 0.087 *** Other services 0.668 0.066 *** -0.404 0.099 *** 0.639 0.063 *** -0.448 0.099
Qualification (ref: Blue collar, low qualification)
White collar, high qualification 0.724 0.058 *** -0.322 0.080 *** 0.720 0.064 *** -0.328 0.089 *** White collar, medium qualification 0.772 0.055 *** -0.259 0.072 *** 0.680 0.055 *** -0.385 0.081 *** White collar, low qualification 0.793 0.058 *** -0.232 0.073 *** 0.687 0.057 *** -0.376 0.084 *** Blue collar, high qualification 0.774 0.056 *** -0.257 0.073 *** 0.753 0.063 *** -0.283 0.083 *** Blue collar, medium qualification 0.813 0.068 ** -0.207 0.084 ** 0.831 0.081 * -0.185 0.097 * working time (ref: >20)
first employment 0.079 0.028 *** -2.542 0.356 *** 0.107 0.041 *** -2.239 0.387 *** < 1 year 0.424 0.042 *** -0.858 0.098 *** 0.403 0.043 *** -0.910 0.107 *** 1-5 years 0.520 0.040 *** -0.653 0.077 *** 0.472 0.039 *** -0.750 0.082 *** 5-10 years 0.667 0.050 *** -0.405 0.074 *** 0.647 0.049 *** -0.435 0.075 *** 10-20 years 0.782 0.056 *** -0.246 0.071 *** 0.780 0.055 *** -0.248 0.071 *** No previous unemployment spell 1.087 0.047 * 0.084 0.043 * 1.219 0.056 *** 0.198 0.046 *** No previous self-employment spell 1.746 0.069 *** 0.557 0.039 *** 1.430 0.063 *** 0.358 0.044 ***
Log likelihood Level 2 (province) Var(1) Sample:
-9096.241 0.022 (0.008) 17,706
-8265.980 0.045 (0.013) 16,557
16
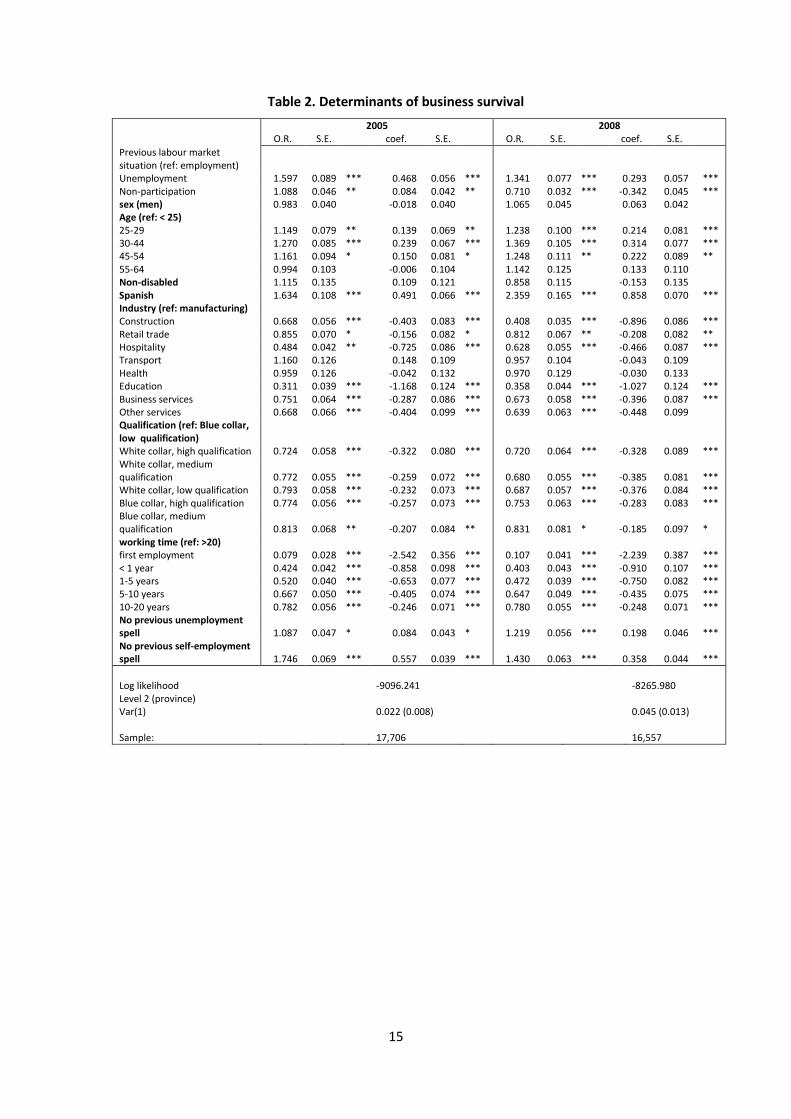
In the following map we have plotted the random effects for each year. The variability of these
effects is higher in 2008 than in 2005. In fact, in 2005 it does not seem to be any spatial
pattern while in 2008 there are several clusters of provinces. The highest effects correspond to
Extremadura and provinces in the North of the country.
The differences between both years suggest that the location can play a major role during
recessions than during economic growth. The well-known division between North and South in
terms of (un)employment appears in our results for 2008. Although unemployment figures are
extremely high in the whole country, in the case of the South of Spain, they are above 30%
showing a gap with respect to the North. Our results are in line with many other papers
concluding more difficult conditions in the labour market in provinces located in the South of
the country.
Map 1. Random effects
2005 2008
Discussion and conclusions
During the last years, entrepreneurship and self-employment have become a recurrent term in
the design of employment policies. In the Spanish context, many programs and initiatives try
to foster self-employment among unemployed people in general and young unemployed in
particular.
17
In the current context of economic downturn, self-employment can play a role. However, the
potential consequences of these results in terms of policies fostering self-employment are
extremely relevant. According to Shane (2009), the support of any kind of self-employment or
entrepreneurship is not a “good policy” because not all the businesses share the same survival
probability or potential growth. Selecting the best is required if we want to increase
employment and economic growth.
According to our results, survival rate of new entrants into self-employment is around 70% and
this rate decreases during economic downturns. Previous labour market experience seems to
have an important impact on the probability of survival, as well as age. Based on these results,
the design of policies fostering entrepreneurship should consider the need of different policies
targeted to different groups of workers. As Congregado et al. (2010) state “the new schemes
of incentives approved by the Spanish Government for encouraging unemployed people to
become own-account workers can only aspire, in the best case scenario, to reduce
unemployment directly but not to create new employment.”
However, this analysis is not finished since we should take into account what is the following
spell for workers who finish the self-employment spell. Probably, this is the main limitation of
our analysis and further investigation is needed on this issue.
18
References
Amit, R. and Muller, E. (1995): “‘Push’ and ‘pull’ entrepreneurhip”, Journal of Small Business
and Entrepreneurship, vol. 12(4), pp. 64-80.
Block, J. and Sandner, P. (2009): “Necessity and opportunity entrepreneurs and their duration
in self-employment: evidence from German micro data.” Journal of Industrial
Competition Trade, vol. 9, pp. 117-137.
Caliendo, M. and Kritikos, A.S. (2009): ""I Want to, But I Also Need to": Start-Ups Resulting
from Opportunity and Necessity," IZA Discussion Papers 4661, Institute for the Study
of Labor (IZA).
Caliendo, M. and Kritikos, A.S.(2010): “Start-ups by the unemployed: Characteristics, survival
and direct employment effects”, Small Business Economics, vol. 35 (1) , pp. 71-92.
Carrasco, R. (1999): “Transitions to and from self-employment in Spain: an empirical analysis”.
Oxford Bulletin of Economics and Statistics, vol. 61(3), pp. 315-341.
Congregado, E., Golpe, A.A. and Carmona, M. (2010): “Is it a good policy to promote self-
employment for job creation? Evidence from Spain”. Journal of Policy Modeling,
Volumen 32(6), pp. 828-842.
Fritsch, M., Brixy, U. and Falck, O. (2006): “The effect of industry, region and time on new
business survival – multi-dimensional analysis”, Review of Industrial Organization,
vol. 28, pp. 285-306.
Furdas, M. and Kohn, K. (2011): “Why is start-up survival lower among necessity
entrepreneurs? A decomposition approach.”
http://www.iza.org/conference_files/EntreRes2011/kohn_k2086.pdf
Giacomin, O., Janssen, F., Guyot, J.L. and Lohest, O. (2011): “Opportunity and/or necessity
entrepreneurship? The impact of the socio-economic characteristics of
entrepreneurs,” MPRA Paper 29506, University Library of Munich, Germany.
Hessels, J., van Gelderen, M. and Thurik, R. (2008): “Entrepreneurial aspirations, motivations,
and their drivers”. Small Business Economics, vol. 31, pp. 323-339.
Millán, J.M., Congregado, E. and Román, C. (2012): “Determinants of self-employment survival
in Europe”, Small Business Economics, Volume 38, Issue 2, pp. 231-258.
Muñoz-Bullón, F. and Cueto, B. (2011): “The sustainability of start-up firms among formerly
wage-employed workers”, International Small Business Journal, vol. 29 (1) , pp. 78-
102.
Reynolds, P.D., Camp, S.M., Bygrave, W.D., Autio, E. and Hay, M. (2001): Global
Entrepreneurship Monitor. 2001 Summary Report. London: London Business School
and Babson College

19
Shane, S. (2009): “Why encouraging more people to become entrepreneurs is bad public
policy”. Small Business Economics, vol. 33, pp. 141–149.
Thurik, A.R., Carree, M.A., van Stel, A. and Audretsch, D.B. (2008): “Does self-employment
reduce unemployment?” Journal of Business Venturing, vol. 23, pp. 673-686.
20
Annex
Table A.1. Descriptive statistics: inflows in self-employment
2005 2006 2007 2008 2009 2010 2011
mean S.D. mean S.D. mean S.D. mean S.D. mean S.D. mean S.D. mean S.D. Sex (men) 0.613 0.487 0.617 0.486 0.622 0.485 0.593 0.491 0.587 0.492 0.594 0.491 0.595 0.491 Age (years) 36.124 10.186 36.361 10.244 36.159 10.075 36.854 10.233 37.515 10.191 37.840 10.108 37.938 10.013 <25 0.114 0.318 0.110 0.312 0.115 0.319 0.104 0.305 0.093 0.290 0.084 0.277 0.084 0.277 25-29 0.189 0.391 0.187 0.390 0.174 0.379 0.160 0.367 0.144 0.351 0.139 0.346 0.133 0.340 30-44 0.483 0.500 0.483 0.500 0.499 0.500 0.507 0.500 0.515 0.500 0.521 0.500 0.527 0.499 45-54 0.156 0.363 0.159 0.365 0.158 0.365 0.165 0.372 0.180 0.384 0.186 0.389 0.190 0.393 55-64 0.058 0.234 0.062 0.242 0.054 0.226 0.064 0.244 0.069 0.253 0.070 0.256 0.066 0.249 Disabled 0.008 0.089 0.008 0.087 0.007 0.082 0.006 0.077 0.006 0.080 0.005 0.073 0.005 0.069 Foreigner 0.109 0.311 0.106 0.308 0.182 0.386 0.157 0.364 0.169 0.374 0.170 0.376 0.178 0.382 Industry: Manufacturing 0.056 0.229 0.058 0.234 0.061 0.240 0.061 0.240 0.059 0.235 0.056 0.230 0.052 0.223 Construction 0.207 0.405 0.214 0.410 0.247 0.431 0.203 0.402 0.168 0.374 0.165 0.371 0.164 0.370 Retail trade 0.234 0.423 0.225 0.418 0.211 0.408 0.223 0.416 0.235 0.424 0.243 0.429 0.257 0.437 Hospitality 0.141 0.348 0.138 0.345 0.131 0.338 0.138 0.345 0.160 0.367 0.156 0.363 0.150 0.357 Transport 0.047 0.212 0.047 0.212 0.044 0.205 0.046 0.210 0.035 0.185 0.037 0.190 0.034 0.182 Health 0.027 0.163 0.027 0.163 0.028 0.165 0.028 0.166 0.026 0.159 0.023 0.149 0.027 0.161 Education 0.035 0.183 0.033 0.178 0.031 0.174 0.041 0.198 0.044 0.204 0.045 0.207 0.046 0.209 Business services 0.185 0.388 0.189 0.392 0.178 0.383 0.182 0.386 0.193 0.394 0.190 0.392 0.186 0.389 Other services 0.068 0.253 0.067 0.250 0.067 0.251 0.078 0.268 0.081 0.272 0.084 0.277 0.083 0.276 Qualification: White collar, high qualification
0.167 0.373 0.171 0.376 0.174 0.379 0.189 0.392 0.195 0.396 0.189 0.392 0.192 0.394
White collar, medium qualification
0.263 0.440 0.274 0.446 0.274 0.446 0.287 0.452 0.281 0.450 0.289 0.454 0.291 0.454
White collar, low qualification
0.182 0.386 0.180 0.384 0.174 0.379 0.177 0.382 0.178 0.383 0.174 0.379 0.172 0.377
Blue collar, high qualification
0.224 0.417 0.222 0.416 0.227 0.419 0.206 0.404 0.200 0.400 0.206 0.404 0.207 0.405
Blue collar, medium qualification
0.081 0.273 0.076 0.265 0.073 0.261 0.072 0.259 0.074 0.262 0.070 0.256 0.071 0.257
21
Blue collar, low qualification
0.082 0.274 0.076 0.265 0.076 0.265 0.068 0.252 0.071 0.257 0.070 0.256 0.067 0.250
Age in the first employment spell
23.230 7.962 23.061 7.853 23.673 8.063 23.526 7.939 23.572 7.951 23.299 7.687 23.288 7.594
Working time 8.79 7.72 9.18 7.88 8.93 7.73 9.42 7.99 9.37 8.22 9.70 8.20 9.68 8.18 Unemployment time 1.68 1.84 1.60 1.81 1.55 1.74 1.58 1.73 1.53 1.72 1.60 1.61 1.69 1.74 Self-employment time 4.57 5.21 5.08 5.57 5.03 5.25 5.64 5.59 5.82 5.66 6.34 6.01 6.67 6.15 Working time: First employment 0.088 0.284 0.073 0.259 0.114 0.317 0.094 0.291 0.065 0.246 0.063 0.242 0.064 0.245 < 1 year 0.094 0.291 0.085 0.279 0.086 0.280 0.082 0.274 0.090 0.286 0.085 0.279 0.084 0.277 1 – 5 years 0.269 0.443 0.256 0.436 0.252 0.434 0.242 0.428 0.260 0.439 0.247 0.431 0.249 0.432 5 - 10 years 0.238 0.426 0.257 0.437 0.241 0.427 0.244 0.429 0.241 0.428 0.240 0.427 0.240 0.427 10 - 20 years 0.224 0.417 0.234 0.424 0.225 0.417 0.242 0.428 0.238 0.426 0.254 0.435 0.254 0.435 > 20 years 0.087 0.282 0.095 0.293 0.083 0.276 0.097 0.296 0.106 0.308 0.111 0.314 0.110 0.312 # employment spells 11.577 18.499 11.898 19.565 12.488 27.422 12.543 19.417 12.608 24.778 12.856 34.618 12.961 25.698 Any previous unemployment spell
0.528 0.499 0.545 0.498 0.516 0.500 0.535 0.499 0.559 0.497 0.584 0.493 0.598 0.490
# unemployment spells 1.988 4.053 2.003 3.612 1.891 3.429 2.031 3.826 2.076 3.849 2.312 4.139 2.509 5.404 Any previous self-employment spells
0.390 0.488 0.366 0.482 0.311 0.463 0.330 0.470 0.383 0.486 0.363 0.481 0.334 0.472
# self-employment spells 0.999 2.239 0.876 2.056 0.751 1.945 0.779 1.963 0.864 1.963 0.785 1.831 0.706 1.734
Source: own elaboration from MCVL 2005-2011.