Embed Size (px)
Citation preview
1
WAT E R S SO LU T IO NS
Omics Research Platform
with TransOmics™ Informatics
ACQUITY UPLC® System
SYNAPT ® G2-S HDMS
K E Y W O R D S
Lipids, lipidome, metabolomics,
lipidomics, ion mobility spectrometry,
Hydrophilic interaction chromatography
(HILIC), HDMS Compare, T-Wave™
Technology
A P P L I C AT IO N B E N E F I T S
Combining HILIC-UPLC® liquid phase separation
with gas phase ion mobility mass spectrometry
to achieve a multi-dimensional characterization
of lipids in complex mixtures enhances profiling
of lipids in biological samples.
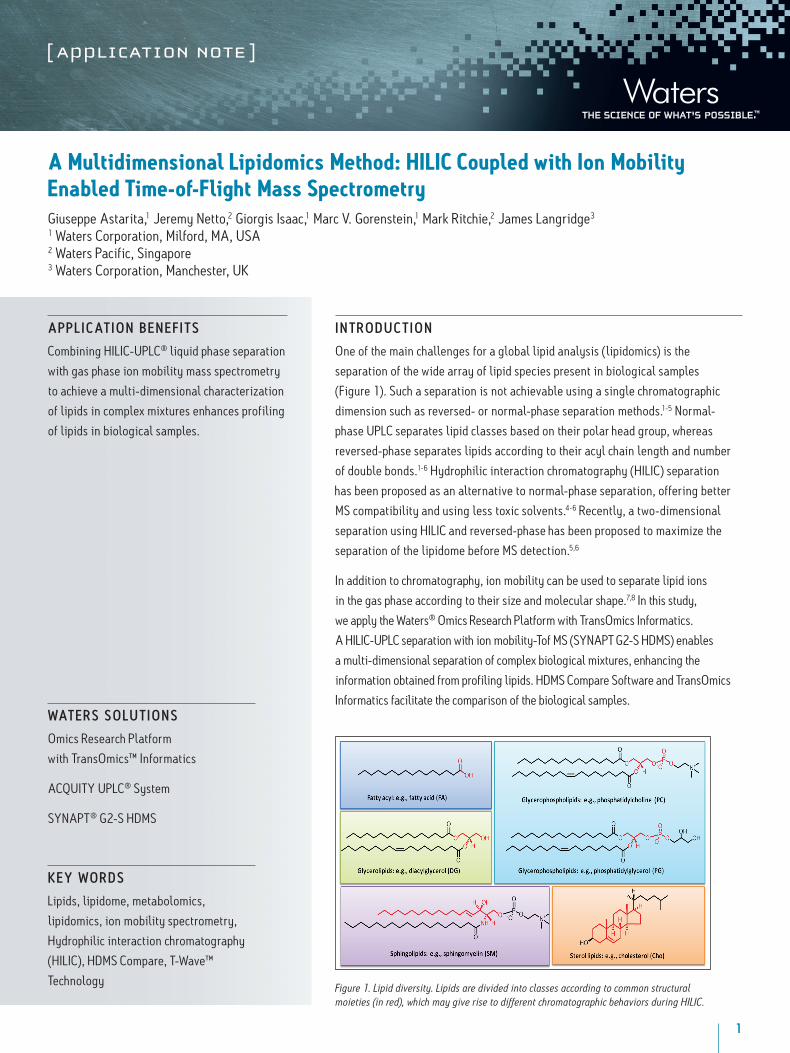
IN T RO DU C T IO N
One of the main challenges for a global lipid analysis (lipidomics) is the
separation of the wide array of lipid species present in biological samples
(Figure 1). Such a separation is not achievable using a single chromatographic
dimension such as reversed- or normal-phase separation methods.1-5 Normal-
phase UPLC separates lipid classes based on their polar head group, whereas
reversed-phase separates lipids according to their acyl chain length and number
of double bonds.1-6 Hydrophilic interaction chromatography (HILIC) separation
has been proposed as an alternative to normal-phase separation, offering better
MS compatibility and using less toxic solvents.4-6 Recently, a two-dimensional
separation using HILIC and reversed-phase has been proposed to maximize the
separation of the lipidome before MS detection.5,6
In addition to chromatography, ion mobility can be used to separate lipid ions
in the gas phase according to their size and molecular shape.7,8 In this study,
we apply the Waters® Omics Research Platform with TransOmics Informatics.
A HILIC-UPLC separation with ion mobility-Tof MS (SYNAPT G2-S HDMS) enables
a multi-dimensional separation of complex biological mixtures, enhancing the
information obtained from profiling lipids. HDMS Compare Software and TransOmics
Informatics facilitate the comparison of the biological samples.
A Multidimensional Lipidomics Method: HILIC Coupled with Ion Mobility Enabled Time-of-Flight Mass SpectrometryGiuseppe Astarita,1 Jeremy Netto,2 Giorgis Isaac,1 Marc V. Gorenstein,1 Mark Ritchie,2 James Langridge3
1 Waters Corporation, Milford, MA, USA2 Waters Pacific, Singapore3 Waters Corporation, Manchester, UK
Figure 1. Lipid diversity. Lipids are divided into classes according to common structural moieties (in red), which may give rise to different chromatographic behaviors during HILIC.
2A Multidimensional Lipidomics Method: HILIC Coupled with Ion Mobility Enabled Time-of-Flight Mass Spectrometry
R E SU LT S A N D D IS C U S S IO N
To separate lipids, we used hydrophilic interaction chromatography (HILIC) with
an ACQUITY UPLC BEH HILIC 2.1 x 100 mm, 1.7 µm Column, and a reversed-
phase solvent system (organic/aqueous) characterized by high organic mobile
phase (>80% acetonitrile). This UPLC method was highly compatible with ESI,
and separated lipids by classes, according to their polar properties (Figure 3
and Table 1).
In addition to HILIC chromatography, the ion mobility capability of the SYNAPT
G2-S HDMS Mass Spectrometer (Figures 2A-C and 3) was used to further
discriminate lipid classes into their constituent components, based upon the
different size and shape, that is, the ions collision cross section (Ω).7,8 Lipid ions
with different degrees of unsaturation and acyl length migrate with characteristic
mobility times, due to their unique shape in the gas phase as they migrate through
the ion mobility cell, which is filled with nitrogen gas at relatively high pressure
(Figures 3 and 5). Ion mobility separations occur in the millisecond timeframe,
making it ideal for situating between LC and MS, where LC separations upstream
typically work in the second timeframe and Tof MS downstream works in the
nanosecond timeframe (Figures 2A and 3). The addition of ion mobility to
the LC/MS provides enhanced peak capacity and improved signal-to-noise
ratio (Figure 3).
To gain more structural information, we analyzed lipids employing LC/MSE,
which uses an alternating low and elevated collision energy in separate scans
to acquire both precursor and product ion information in a single analytical
run (Figures 2B and 4A). Ion mobility separation coupled with LC/MSE (HDMSE)
improves the specificity for coeluting lipids by fragmenting ions after IMS
separation (Figures 2C and 4B). Due to the complexity of the lipidome, the
addition of ion mobility drift time as an orthogonal measurement to retention
times provides complementary information regarding the lipid species, adding
further specificity to lipid identification and data interpretation (Figure 4B).
Using this novel technological approach, multidimensional molecular maps of
lipids present in various animal tissues were generated. In these maps, each lipid
is characterized by a combination of molecular coordinates including retention
time, drift time, exact mass, fragment ions, and intensity (Figure 5). Such
features highlighted the capacity of ion mobility to separate isobaric lipid species
(i.e., species with the same mass). The molecular landscape visualized using
multidimensional molecular maps also allows the detection of lipid species that
E X P E R IM E N TA L
Sample description
Lipid standards and total lipid extracts from bovine
brain, heart, and liver were purchased from Avanti
Polar Lipids. Non-natural lipids were spiked in the
biological extracts and used as internal standards
(Table 2).
UPLC conditions
System: ACQUITY UPLC
Column: ACQUITY UPLC BEH HILIC
2.1 x 100 mm
Column temp.: 30 °C
Mobile phase A: 10 mM ammonium acetate
(pH 8.0) in 95% ACN
Mobile phase B: 10 mM ammonium acetate
(pH 8.0)
in 50% ACN
Gradient: Time/min %A %B
0.00 99.9 0.1
10.00 80.0 20.0
13.00 20.0 80.0
13.01 99.9 0.1
16.00 99.9 0.1
Flow rate: 0.5 mL/min
Injection volume: 5 µL
MS conditions
MS analyses were performed on a SYNAPT G2-S
HDMS (Figure 2) with a conventional ESI source
in LC/HDMSE mode. Capillary voltages were
optimized separately for positive (2.8 kV) and
negative (1.9 kV) ion modes. Data were collected
in two channels all of the time; low collision
energy (6.0 V) for the molecular ions and high
collision energy (20 to 35 V) for product ions.
IMS gas: nitrogen; IMS T-Wave velocity: 900 m/s;
IMS T-Wave height: 40 V.
Data acquisition and processing
TransOmics Informatics and HDMS
Compare Software

3A Multidimensional Lipidomics Method: HILIC Coupled with Ion Mobility Enabled Time-of-Flight Mass Spectrometry
B C
A
Figure 2. Ion mobility separation and fragmentation. A) Schematic of the SYNAPT G2-S HDMS System. B) MS E can be extremely useful by itself, however when we consider a complex mixture of metabolites present in biological samples, they often co-elute. By fragmenting them, we only obtain a mixture of fragments which derive from various co-eluting precursors in this example. C) Ions can be separated in the ion mobility cell and subsequently fragmented in the transfer collision cell. The product ions generated in the collision cell have the same mobility drift time as their parent ions. Using this acquisition condition namely high-definition MSE (HDMSE), product ions can be aligned with their parent ions on the basis of mobility drift time as well as chromatographic retention time using the Waters® proprietary Apex4D algorithm.
Lipid class ES polarity RT window
FA Neg 0-1
Cer Pos 0-2
HexCer Neg 0-2
ST Neg 0-2
DiHexCer Neg 2-4
PG Neg 1-3
PE Neg/Pos 5-7
PI Neg 3-5
PS Neg 4-6
PC Pos 5-7
LPE Neg/Pos 6-8
SM Pos 7-9
LPC Pos 8-10
Abbreviations: FA, fatty acids; Cer, ceramides;
HeXCer, HexosylCeramides; ST, sulfatides;
DiHexCer, DihexosylCeramides;
PG, phosphatidylglycerols;
PE, phosphatidylethanolamines;
PI, phosphatidylinositols;
PS, phosphatidylserines; PC, phosphatidylcholines;
LPE, lysophosphatidylethanolamines;
SM, sphingomyelins; LPC, lysophosphatidylcholines.
Table 1. Lipid classes are separated by retention time (RT) windows in HILIC conditions.

4A Multidimensional Lipidomics Method: HILIC Coupled with Ion Mobility Enabled Time-of-Flight Mass Spectrometry
Lipid class Internal standard Abbreviation Vendor Catalog #
Sphigolipids
Ceramides N-Lauroyl-D-erythro-sphingosine Cer(d18:1/12:0) Avanti Polar Lipids
860512P
Sphingomyelin N-(dodecanoyl)-sphing-4-enine-1-phosphocholine SM (d18:1/12:0) Avanti Polar Lipids
860583P
Glycerophospholipids
Phosphatidylethanolamines 1,2- Dimyristoyl-sn-glycero-3-phosphoethanolamine PE (14:0-14:0) Avanti Polar Lipids
850745
Avanti Polar Lipids
Phosphatidylcholines 1,2- Dimyristoyl-sn-glycero-3-phosphocholine PC (14:0/14:0) Avanti Polar Lipids
850345
Avanti Polar Lipids
Phosphatidylserine 1,2- Dimyristoyl-sn-glycero-3-phosphoserine PS (14:0/14:0) Avanti Polar Lipids
840033
Avanti Polar Lipids
Phosphatidylglycerol 1,2- Dimyristoyl-sn-glycero-3-phosphoglycerol PG (14:0/14:0) Avanti Polar Lipids
840445
Avanti Polar Lipids
Phosphatidylinositol 1,2-DiHexanoyl-sn-glycero-3-phospho- (1’-myo-inositol)
16:0 PI Avanti Polar Lipids
850141
Avanti Polar Lipids
Lysophosphatidylcholine 1-Heptadecenoyl-2-hydroxy-sn-glycero-3-phosphocholine
LPC (17:1) Avanti Polar Lipids
LM-1601
Fatty acyl
Fatty acids 10-heptadecenoic acid FA (17:1) Nu-Chek Prep U-42-A
Table 2. List of lipids used as internal standards for selected lipid classes.
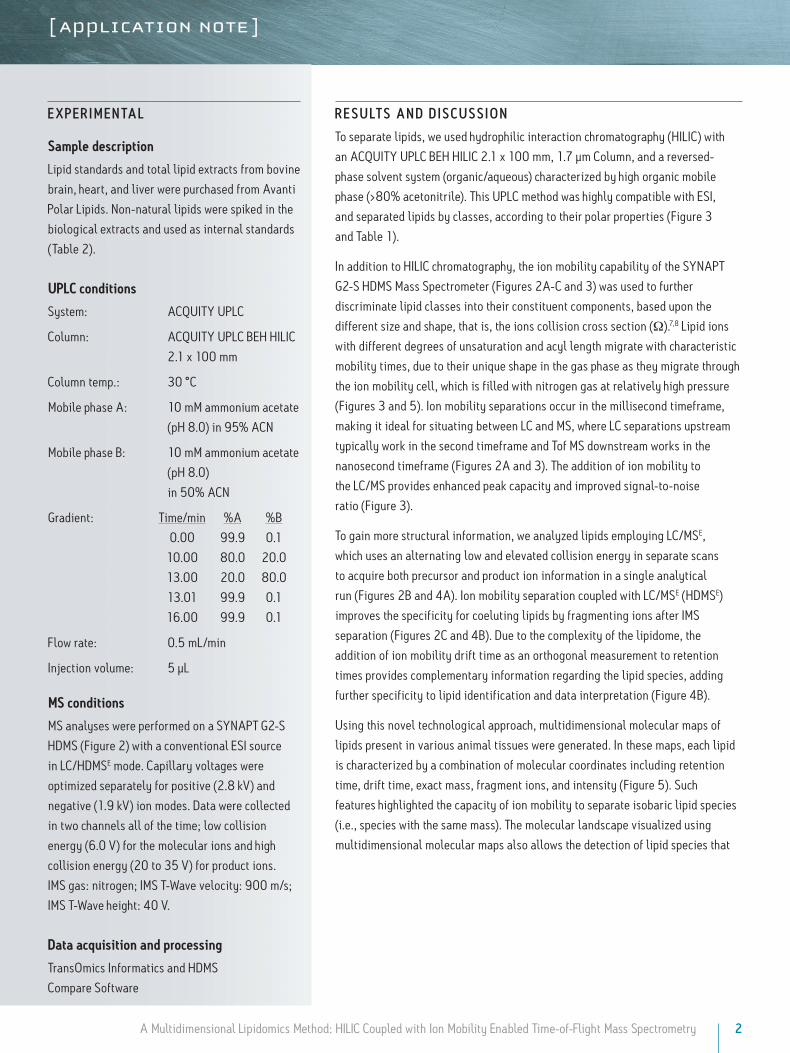
The comparison of molecular maps is facilitated by the use of HDMS Compare and TransOmics (Figures 6
and 7). HDMS Compare Software was used for a rapid comparison of different drift versus m/z plots at selected
windows of retention times (Table 1). T he drift time and spectral information associated with the components
responsible for the differentiation can be extracted from the dataset and further analyzed (Figure 6). T he use
of TransOmics Informatics allows feature detection, alignment, and comparions across multiple samples using
multivariate statistical approaches (PCA, dendrogram analysis) and database searching of discriminating features
for the identification of the lipids alternating between samples. TransOmics uses ion mobility information to
separate co-eluting isobaric lipids in the drift time dimension, increasing the specificity of identification and
quantification (Figure 7). Lipid quantification was performed using appropriate internal standards for each lipid
class (Table 2).

5A Multidimensional Lipidomics Method: HILIC Coupled with Ion Mobility Enabled Time-of-Flight Mass Spectrometry
Drift time
m/z
Ion mobility separation
Dri� �me
Dri� �me
product ion characteristic of ceramide class
Cer d18:1/18:0
MSE : ION MOBILITY OFF
HDMSE : ION MOBILITY ON
Low collision energy
High collision energy
A B
Figure 3. 2D separation by HILIC-ion mobility. Representative analysis of lipid standards using a combination of HILIC separation and ion mobility (IM) separation (inserts) in positive ion mode. HILIC-IM analysis provides an additional degree of separation beyond chromatography, which is ideal for the analysis of complex lipid mixtures extracted from biological samples. After HILIC separation, ion mobility further separates ceramide species according to their molecular shapes. The molecular landscape visualized using an unbiased 3D representation (drift time, m/z, intensity) of a selected interval of retention time (0.5 to 1.5 minutes) allows the detection of many isobaric ceramide species. Such an approach highlights the power of ion mobility for the discovery of many low abundance molecular species that could otherwise be undetected.
Figure 4. Structural characterization of lipid classes. Lipid classes generate characteristic fragments (product ions) upon collision-induced dissociation (CID). In positive ionization mode, ceramides are usually detected as dehydrated molecular ions using low collision energy; however, high collision energy generates all ceramide species with a common characteristic product ion. A) Waters instruments enable alternating low and high collision energy (MSE), allowing to acquire precursor and product ion information in a single chromatographic run. The presence of co-eluting lipids, however, makes the interpretation of the high collision energy spectra difficult. B) By applying ion mobility separation, co-eluting lipids are separated based on their molecular size and shape before fragmentation in the transfer cell. This mode of acquisition (HDMSE) results in cleaner fragmentation spectra and a more confident identification of lipid classes.

6A Multidimensional Lipidomics Method: HILIC Coupled with Ion Mobility Enabled Time-of-Flight Mass Spectrometry
Drift
tim
e
Retention time (min)
Intensity scale
Drift time
m/z
Ion mobility separation
Brain lipidome
PCs Cer PE
Figure 5. Mapping the brain lipidome using HILIC-ion mobility. Representative HILIC-ion mobility Tof analysis of total lipid extract from bovine brain. Lipids are separated by both retention time and mobility time (drift time). A multi-dimensional molecular map could be generated using unique coordinates such as retention times, mobility times, accurate masses, and intensities.
Figure 6. HDMS Compare Software for the comparison of lipid extracted from brain and heart tissues. HDMS Compare Software was used to overlay tissue-specific molecular maps. Key areas of significant differences between two samples were clearly visualized and identified with two different colors. Retention times, drift time, and mass information can be used for database searches and further identification of such molecular differences.
Heart lipidome
Brain lipidome
Brain lipidome Data Map Heart lipidome Data Map
Fusion MapDrift time Drift time
Drift time
m/z m/z
m/z
7A Multidimensional Lipidomics Method: HILIC Coupled with Ion Mobility Enabled Time-of-Flight Mass Spectrometry
Cer(d18:1/16:0)
Figure 7. TransOmics for the comparison of lipid extracted from heart and liver tissues. TransOmics uses ion mobility information to separate co-eluting isobaric lipids in the drift time dimension, increasing the specificity of identification and quantification.

Waters Corporation34 Maple Street Milford, MA 01757 U.S.A. T: 1 508 478 2000 F: 1 508 872 1990 www.waters.com
Waters, ACQUITY UPLC, HDMS, and SYNAPT are registered trademarks of Waters Corporation. TransOmics, T-Wave, and T he Science of What’s Possible are trademarks of Waters Corporation. All other trademarks are the property of their respective owners.
©2013 Waters Corporation. Produced in the U.S.A.May 2013 720004704EN AG-PDF
CO N C LU S IO NS
The combination of liquid chromatography, ion mobility, and
oa-Tof mass spectrometry is a multidimensional separation
strategy capable of analyzing complex biological mixtures to
a depth not previously possible, enhancing the detail obtained
from lipidomic profiling.
■ HILIC separates lipid classes according to their polarity,
providing stable retention time coordinates.
■ Ion mobility separates lipids according to their difference
in size and molecular shapes, providing Ω values (drift
time coordinates).
■ LC/MSE coupled with ion mobility separation (HDMSE) allows the
simultaneous collection of exact mass precursor and fragment
ion information, providing structural information and improving
the experimental specificity.
■ HILIC coupled with LC/HDMSE generates molecular maps
with unique coordinates, including retention times, drift
times, accurate precursor and fragment ion masses, as well
as intensities.
■ HDMS Compare and TransOmics provide informatics solutions
to compare large numbers of molecular maps in a scalable
fashion using multi-variate statistical approaches, adding
further specificity and confidence to lipid identification and
biological interpretation.
could otherwise go unnoticed (Figures 3 and 5).
1. Rainville PD, Stumpf CL, Shockcor JP, Plumb RS, Nicholson JK. Novel Application of Reversed-Phase UPLC-oaTOF-MS for Lipid Analysis in Complex Biological Mixtures: A New Tool for Lipidomics. J Proteome Res. 2007 Feb; 6(2):552-8.
2. Lísa M, Cífková E, Holčapek M. Lipidomic profiling of biological tissues using off-line two-dimensional high-performance liquid chromatography-mass spectrometry. J Chromatogr A. 2011 Aug 5; 1218(31):5146-56. Epub 2011 May 30.
3. Isaac G, McDonald S, Astarita G. Lipid Separation: UPLC System for the Separation of Complex Biological Total Lipid Extracts. Waters Application Note 720004107en. 2011 Sept.
4. Netto J, Wong S, Ritchie M, Torta F, Narayanaswamy P. A Definitive Lipidomics Workflow for Human Plasma Utilizing Off-line Enrichment and Class Specific Separation of Phospholipids. Waters Application Note 720004521en. 2012 Dec.
5. Nie H, Liu R, Yang Y, Bai Y, Guan Y, Qian D, Wang T, Liu H. Lipid profiling of rat peritoneal surface layers by online normal- and reversed-phase 2D LC QToF-MS. J Lipid Res. 2010 Sep; 51(9):2833-44.
6. Netto JD, Wong S, Ritchie M. High Resolution Separation of Phospholipids Using a Novel Orthogonal Two-Dimensional UPLC/QTof MS System Configuration. Waters Application Note 720004546en. 2013 Jan.
7. Shvartsburg AA, Isaac G, Leveque N, Smith RD, Metz TO. Separation and classification of lipids using differential ion mobility spectrometry. J Am Soc Mass Spectrom. 2011 Jul;22(7):1146-55. Epub 2011 Apr 12. Erratum in: J Am Soc Mass Spectrom. 2011 Jul; 22(7):1156.
8. Kliman M, May JC, McLean JA. Lipid analysis and lipidomics by structurally selective ion mobility-mass spectrometry. Biochim Biophys Acta. 2011 Nov; 1811(11):935-45.
![BACTERIAL HEMAGGLUTINATION AND HEMOLYSIS · 1956] BACTERIALHEMAGGLUTINATIONANDHEMOLYSIS 167 Bacteria, too, cause agglutination of erythro- ofbacterial hemagglutination. (3) Specifichemag-](https://img.dokumen.tips/doc/110x75/5e099b8a8848c3026b1ffb45/bacterial-hemagglutination-and-hemolysis-1956-bacterialhemagglutinationandhemolysis.jpg)


![Ethyl Lauroyl Arginate as a Food Additive in Sausages...i 24 April 2012 [8-12] Call for submissions – Proposal P1020 Ethyl Lauroyl Arginate as a Food Additive in Sausages FSANZ has](https://img.dokumen.tips/doc/110x75/5e3e717552cacc4e7e118f34/ethyl-lauroyl-arginate-as-a-food-additive-in-i-24-april-2012-8-12-call-for.jpg)


![erythro-9-[3-(2-Hydroxynonyl)]adenine is an effective ... · Proc. Nati. Acad. Sci. USA Vol. 81, pp. 6044-6048, October 1984 Cell Biology erythro-9-[3-(2-Hydroxynonyl)]adenine is](https://img.dokumen.tips/doc/110x75/5fe8819e0782f552a8436193/erythro-9-3-2-hydroxynonyladenine-is-an-effective-proc-nati-acad-sci.jpg)