Embed Size (px)
Citation preview

A More Realistic View of Mid/Side Stereophony
by
Trevor Owen de Clercq
Submitted in partial fulfillment of the requirements for the Master of Music in Music Technology
(Tonmeister Honors Sequence) in the Department of Music and Performing Arts Professions
in the Graduate School of Education New York University
Advisors: Kenneth J. Peacock, Robert J. Rowe
May 1st, 2000

Abstract: Two microphone stereo configurations serve as the basis of technique for anyone involved with tonmeister recording. Of these configurations, coincident pairs have been highly favored due to phase coherence and basic phychoacoustic principles. Moreover, the M/S system proves to be a superior coincident technique because of its flexibility, compatibility, and image stability. While theoretical, mathematically correct polar patterns for M/S configurations are easily derived, these calculations are only accurate (if at all) at a given frequency. Real world recordings with M/S, especially those using unmatched pairs as is quite common, will rapidly diverge from these textbook patterns as a function of the actual response of microphones themselves. With the advent of modern high-power computer systems, however, the derived stereo polar response can be described reasonably accurately, based on the actual polar response of the component microphones.

TdC–1
0. Introduction
The process of recording is as much a science as it is an art. The
following pages will attempt to extend somewhat the quality of knowledge in a
very specific area of the science of recording. Such knowledge, however, can
never completely inform the practicing sound engineer as to how to exactly create
the best recording possible since such a large portion of recording is and will
always be involved with personal tastes and aesthetics. The values of tonmeister
recording, if any school of recording can claim such a purpose, endeavors to
capture the most pure and true reproduction of the original sound field. With
today’s technology, such a process is literally impossible, but very close
approximations can be achieved with sufficient training, experience, and luck.
The goal of exactly recreating the original sound source leans perhaps the most
heavily on science of any recording aesthetic. It is with the specific purpose of
advancing the skill of the tonmeister, therefore, that this investigation into the
more scientific and realistic nature of Mid/Side recording has been undertaken.

TdC–2
1. Stereo History
The history of stereo recording traces back to the International Exhibition
of Electricity in Paris, France on August 11th, 1881. One of the most popular
attractions in this exhibition involved an array of microphones situated around the
base of the stage at the Paris Opera. These microphones, developed by Clement
Ader, transmitted the sounds of soloists, a chorus, and musical instruments to a
similar and equivalent array of telephone receivers 3 kilometers away at the
Palace of Industry. Visitors rapidly resolved themselves into eager queues to
experience this new acoustic effect. A listener could place two adjacent telephone
receivers, one on each ear, to hear a sound that had (according to Scientific
American) “a special character of relief and localization” which a single receiver
could not produce [1].
To be correct, however, this demonstration at the Paris Opera cannot truly
be called stereo reproduction. Instead, such a listening experience falls under the
category of binaural transmission. By having the signals from the microphones
conveyed independently and separately to the ears of the listener, Ader’s set up
was strictly a recreation of the sound pressure levels in the area of the ear as
would have occurred naturally. Thus, in typical binaural recording, two
microphones are spaced the same distance as between the ears and later
reproduced over headphones.

TdC–3
Stereo reproduction, as differentiated from binaural reproduction, involves
each ear hearing both channels or loudspeakers. The crosstalk between separate
stereo channels in the acoustic environment during playback is a natural part of
the medium. Any recording technique meant for stereo transmission must take
this mutual interference into account, particularly as it relates to microphone
placement. Unlike listening with headphones, any sound that leaves one
loudspeaker, be it left or right, is destined for both ears of the listener. The
combination of the loudspeakers’ signals in the listening environment before
reaching the listener allows the possibility of providing an accurate image for
various listening positions. A person moving within and outside of the listening
area, therefore, can and should be consistently presented with a stable stereo
image.
The term stereo itself derives from the Greek term “stereos” meaning hard,
firm, or solid. Webster’s New World Dictionary defines stereo as “three-
dimensional”. The aim of stereo, therefore, can be seen as to provide the illusion
of a solid, three-dimensional image in the mind of the listener. A stereo sound
picture should give the impression that behind the loudspeakers exists a recreated
captured acoustic environment and related events. Unfortunately, within the
confines of a two channel system, stereo cannot purport to place an entire
symphony orchestra and concert hall in the living room, surrounding and
enveloping the listener as would occur naturally. What stereo can do, however, is

TdC–4
to provide an imaginary peephole (to use a visual analogy) into the original
recording venue. Listening to stereo, one cannot ignore the acoustics of the
listening environment, but one can hopefully hear into the space beyond the
loudspeakers.
Not until about half a century after Clement Ader’s 1881 binaural
demonstration did technology and research develop as to enable experimentation
in stereo recording. Up until this point, even basic mono recordings were plagued
with distortion and a poor frequency response resulting mostly from limitations of
the recording medium, thereby focusing most engineering efforts on improving
monophonic reproduction instead of exploring stereo [2]. With revolutionary
developments of fidelity came the challenge to better understand stereophony.
Two main companies during this era rose to tackle this challenge: Bell
Laboratories in the United States and E.M.I. in Great Britain. Despite the similar
goals of these teams, each followed a separate and almost opposite path to
realizing the capabilities of a stereo listening system.
The researchers at Bell Laboratories began not with the idea of creating a
two channel system but with the hope of recreating the acoustic wavefront on a
macroscopic scale through recording technology. The Bell scientists envisioned a
“curtain of microphones” in front of the sound source, each microphone
correlating to a corresponding loudspeaker in a “curtain of loudspeakers” in the
listening environment [3]. Had the receivers at the Palace of Industry in Paris

TdC–5
been loudspeakers instead of telephones, such a scheme may have had its first
application in 1881! Unfortunately, the rate of information and necessary
equipment for large scale wavefront reconstruction exceeded the technical
possibilities of the day. This limitation, compounded with the basic impracticality
of consumer use, forced Bell Labs to endeavor implementing their wavefront
reconstruction scheme into a simplified two or three channel system. The
difference between an infinite amount of channels, however, and two or three is
quite large (somewhere around infinity itself!), a fact that led Bell scientists to
experiment unsuccessfully with every possible combination of microphones
folding into two channels. Included in their testing was the configuration, often
highly praised by stereo recording purists, of a spaced pair with a center bridging
microphone. This configuration, however, seems more of a modification to the
binaural recording technique than a truly stereo method.
The scientists at E.M.I., as opposed to those at Bell, took the limitation of
two channels for granted and thus developed a reproduction scheme around such
boundaries. Instead of attempting to recreate the entire acoustic wavefront, these
researchers invoked psychoacoustic criteria to imply an accurate virtual image on
a microscopic scale. The work conducted at E.M.I. is best preserved through the
writings of one its researchers and one the founding fathers of stereo recording,
Alan D. Blumlein. The patents of Blumlein, especially the classic “Specification
394,325” accepted in 1933, still inform and challenge theorists and recording

TdC–6
techniques to this day. Blumlein’s basic approach to stereo relied on the
realization that simple level differences at the loudspeakers would translate into
both level and phase differences at the ears, thus better approximating the way
sound is heard naturally (more on this topic later). To create only level
differences at the loudspeakers, Blumlein had to capture only level differences at
the microphones. A coincident pair of directional microphones, with no time
delay between either channel, can best provide such information. For this reason,
the stereo configuration that today bears Blumlein’s name is a coincident pair of
pure pressure gradient figure-8 microphones, the patterns of which are highly
directional. Interestingly enough, the only microphones available to Blumlein in
his early experiments were pressure receptor omnidirectional microphones. To
derive an intensity based stereo program at the loudspeakers, he was forced to
convert phase differences at the microphones to amplitude differences at the
loudspeakers. The result was his invention of an ingenious device which would
matrix (much like mid/side stereo) and re-equalize the outputs of two closely
spaced pressure microphones to produce only level differences between the two
channels upon playback [4]. The contemporary unavailability of such a
networking device both proves the modern acceptance of phase distortion in
stereo recording and hints at an opportunity for possible entrepreneurship.

TdC–7
2. Psychoacoustics
To understand the reasons for Alan Blumlein’s choice of intensity based
stereo recording, the relevant aspects of psychoacoustics must be discussed. The
sub-category of psychoacoustics called localization is specifically of interest, for
it concerns the ability of the ear to determine the direction of an incoming sound
source. When considering stereo sound, this topic of localization can be
simplified to encompass only two dimensional information (left versus right).
The ear uses mainly two techniques for determining directional information in a
horizontal plane: differences in level and differences in time of arrival/phase
between the two eardrums. When listening to complex waveforms, both methods
help in localization. With respect to frequency, however, the application of one of
these two techniques usually excludes the other. (N.B. The following paragraphs
on localization are informed by the excellent text on psychoacoustics by J. Blauert
[5]).
In the low frequency range up to about 800 Hz, the human brain depends
mostly on phase information for localization purposes. This figure of 800 Hz
coincides to a wavelength of approximately 1.25 feet. Not coincidentally, this
length of 1.25 feet corresponds to about twice the greatest length between a pair
of human eardrums. In other words, for frequencies below 800 Hz, the phase of
the impending sound at the nearer ear always leads the phase of the sound at the
farther ear by less than 180 degrees. Such a close phase relationship between the

TdC–8
sounds heard at both eardrums creates an unambiguous method for localization.
The phase difference is linear with respect to frequency, thus also aiding with the
ear’s attempts at discerning the spectrum of an incoming sound.
For frequencies above 1.6 kHz (the high frequency area), phase
relationships between the eardrums become meaningless. Since the period of
such frequencies is less than the amount of time sound takes to travel between the
ears, phase relationships between sounds at the ears will be misleading, shifting
through a full 360 degrees for every octave. In this range, therefore, the brain
must depend on level and time differences between the ears for localization
purposes. This method relies somewhat on the diffraction and absorption
qualities of the head itself. Off center high frequencies will hit the nearer eardrum
with no loss in level, but upon encountering the head as an acoustic obstacle, can
fall several decibels before reaching the following eardrum. In certain
combinations of direction and frequency, this attenuation can exceed 20 decibels!
As of yet unmentioned has been the frequency range from 800 Hz to 1.6
kHz, the middle area for localization. Perhaps middle area is the wrong term;
gray area may be more appropriate. In this region, level differences between the
ears are not very effective since the wavelengths are very long in comparison to
the size of the head. Also, phase differences are misleading because they now
exceed 180 degrees between the ears; the closer ear, therefore, now lags in phase
behind the further ear. The brain must thus use a combination of these two

TdC–9
methods (phase and level) to localize sound. In practice, however, the localizing
ability within this frequency range is basically not good.
The discussion of localization so far has focused on frequency ranges and
thus relates to periodic sine wave sources. Such information, however, only
allows for an estimation of the ear’s true abilities of perception for aperiodic
signals like music, speech, or any other real world sounds. The sustained portion
of sound from musical instruments can be characterized as sinusoidal, and much
of the ear’s methods for localizing such portions of sound are as previously
described. The attack portion of sound from instruments, especially percussion
instruments, however, is most often impulse based. For such quick transients,
pure time of arrival differences between the ears are used to localize the source.
In other words, direction is determined solely by whichever ear first hears the
impulse.

TdC–10
3. Coincident Techniques versus Spaced Pairs
With an understanding of the basic psychoacoustic factors determining
natural human auditory perception, a more informed analysis of basic stereo
recording configurations can be made. Because of the ear’s use of time/phase and
level differences to localize sound, various microphone techniques have been
developed to employ one or both of these localization methods. These
microphone techniques can divided into two main categories: spaced pairs and
coincident pairs.
The spaced pair configuration, commonly known as an A/B pair, uses two
parallel microphones separated by a certain distance and pointing towards the
sound source. Using a small distance between the microphones (around 10
inches), as is common in most A/B configurations, produces insignificant level
differences between the microphones but a constant time delay (dependant on the
microphone spacing) for sources located along the sound stage. The spaced pair
set up, therefore, can be viewed as a technique employing solely time/phase
information to create the stereo image.
As opposed to spaced pairs, a coincident microphone configuration
employs only level differences between the channels to convey the stereo image.
Coincident techniques, such as X/Y, use two directional microphones (except in
the more complicated case of M/S to be discussed later) where the two capsules
are as close to each other as physically possible, each offset by some given angle

TdC–11
in an opposite direction from the zero degree line of the sound source. Because
the capsules of the microphones are in such close proximity, only a negligible
amount of time delay exists between the two channels. All stereo information
results from differences in level produced due to the directional nature of the
microphones and the angle by which they are offset from center.
Many other types of stereo configurations exist, including the popular near
coincident techniques such as ORTF, NOS, Faulkner, OSS, etc. These techniques
combine elements from both the spaced pair and coincident methods, as the
capsules are often closer together than traditional spaced pairs and also usually
directional or angled off center. As such a combination, near coincident stereo
techniques can be seen as merely a compromise between the perceived benefits of
true time and level based stereophony. Further discussion of near coincident
configurations, therefore, will be omitted in order to focus on the pure distinction
of coincident versus spaced stereo pairs.
What may be perhaps a common misconception among recording
engineers is that the methods by which the two basic stereo configurations
(spaced pair and coincident pair) capture stereo information (time and level
respectively) do not translate into the same methods for reproducing stereo when
played over loudspeakers. In other words, as stated before with regards to
Blumlein, pure level or pure time differences at the microphones do not coincide
with pure level or pure time differences at the ears during playback. To

TdC–12
investigate the basic ramifications of such a discrepancy is a fairly straight
forward matter.
Level differences at the microphones and thus at the loudspeakers can
easily create changes in image location within the stereo listening field. The
panning knob on any mixing console is a perfect example of the simplicity of
such a technique. To visualize how level changes at the loudspeakers for low
frequencies can imply phase differences at the ears, please view Figure 3A below:
In this figure, imagine a low frequency sound has been shifted to the leftmost
speaker through a 10 decibel level difference (the interaural time delay between
the ears has been rounded up to 1 ms for convenience). As is easily seen, each ear
receives two copies of the sound. At time=0, the left ear receives the louder
sound. One millisecond later (at time=+1 ms), the right ear receives the louder
signal at no reduction in intensity (due to the close proximity of the ears and lack
+10 dB t=0 ms
+10 dB t=+1 ms
0 dB t=+1 ms
0 dB t=0 ms

TdC–13
of shadowing effects by the head). The only difference between the sounds heard
at each ear is that of time, or in this case phase for a low frequency sound. A
difference in phase, as may be remembered from the discussion of
psychoacoustics, is exactly the method by which our ears localize low frequencies
naturally.
To consider how level changes at the loudspeakers for high frequencies
mirror natural hearing, merely substitute a level of +5 dB in the upper left box and
a level of –5 dB in the upper right box for Figure 3A. This generalized level
difference accounts for attenuation by diffraction around the head and through
losses in path length differences. Of the louder signals at both points in time, the
left ear receives the earlier signal. Also, the earlier signal at the left ear is
somewhat louder than the later signal at the right ear. Remember for high
frequencies that phase considerations are no longer valid, localization being
dependant on time/level differences between the ears. Once again, the method by
which the left ear localizes sound when listening to playback of level induced
stereo reflects the method of natural hearing and localization.
Time based stereophony, on the other hand, presents a different scenario
to the ears upon playback. Consider the example where a pair of microphones are
spaced equal to the distance between the ears (the most common spaced pair
method). In this example, the time delay between the ears will be again rounded

TdC–14
up to 1 ms for simplicity’s sake. The situation of a sound source panned to the
left speaker is illustrated below in Figure 3B:
As is immediately obvious, the ears are confronted with sounds occurring at three
specific points in time (t=0 ms, t=+1 ms, and t=+2 ms). With low frequency
information, phase will favor the left ear between zero and one millisecond, but
will favor the right ear between one and two milliseconds. For high frequency
information (adjusting the upper left and right boxes to –5 dB each), the ears
receive just as confusing a time image as with low frequency sounds; moreover, a
signal of equal intensity is received by both ears at different times, canceling the
ears ability to localize through head absorption for these high frequencies. The
result of this triple barrage of sound upon the ears is a muddied image. Some
engineers praise the “air” and “depth” of spaced pair time based stereophony, but
perhaps this “air” and “depth” is nothing more than time and phase distortion.
0 dB t=0 ms
0 dB t=+1 ms
0 dB t=+2 ms
0 dB t=+1 ms

TdC–15
A final nail in the coffin of spaced pair techniques appears when
examining any situation where the listener is not in the perfect stereo seat. The
figure below (Figure 3C) investigates such off-axis listening positions. The
original caption to this figure is as follows:
“At a point such as L well off the center line the original time difference a-b is completely swamped by the time difference c-d which is characteristic of the relative positions of the listener and the loudspeakers, and has no relation to the position of the source.” [6]
Figure 3C:
Obviously, off-axis listening to stereo reproduction of any method can distort the
stereo field. With time-delay stereophony, however, it is very easy to see how a
listener, as shown in the figure above, would perceive the sound to be arriving

TdC–16
from whichever speaker is nearest. Proximity to either speaker severely shifts the
time-delay in favor of the nearer speaker. With level-based stereophony, the
stereo field is more stable. Consider the extreme example of hard panning a
sound to one of the speakers: no signal will be coming from the opposite speaker;
it will be therefore impossible for a listener, no matter where they may be located
in the room, to perceive the sound as coming from anywhere but the (infinitely)
louder speaker. The stability of level based stereophony obviously fulfills the
literal definition of “stereo” as being a “solid” image.
Truly, closely spaced omnidirectional microphone recordings are suitable
only for binaural reproduction not stereo recording. For a further, more in depth
discussion of the superiority of coincident microphone technique over the spaced
pair method, please consult the writings of Stanley Lipshitz [7], an authority more
well known in the realm of digital audio, but equally lucid in the field of
stereophony. Professor Lipshitz’s AES preprint is decidedly non-mathematical
and thus a fairly easy read. Much of the paper, in fact, revolves around his own
personal perceptions and aesthetics when listening to stereo recordings.

TdC–17
4. Microphone Polar Patterns
Thus far, the discussion of stereo techniques and microphones has been
decidedly intuitive and non-technical. Through simple reasoning, coincident
techniques have been proven, at least on some level, a superior stereo
configuration to any other method. In the previous discussions, mention was
made of directional microphones with an assumption that the term directional
was clearly understood. While the basic idea of microphone directionality is
simple to grasp, a more in depth and refined definition of microphone behavior is
necessary to further explore coincident techniques.
All first order microphones have two methods by which to respond to an
incoming sound wave. The first method relies on responding to pressure
variations in the air impinging on one side of the microphone’s diaphragm;
microphones of this type are termed pure pressure transducers. Because only one
side of the diaphragm is responding to changes in the air pressure, pressure
transducers respond equally to sounds coming from any direction (It is almost like
trying to determine the location of a sound while being deaf in one ear). Because
of this lack of directionality, pure pressure microphones are labeled
omnidirectional. Mathematically speaking, the equation for a such a sensitivity
would be:
s = 1

TdC–18
where s is the sensitivity of the transducer. In other words, the voltage output of
the microphone is directly related to the air pressure of the sound, irrespective of
oncoming angle.
The second method by which first order microphones respond to
impinging sound relies on comparing the difference in pressure between two sides
(back and front) of the diaphragm; microphones of this type are called pure
pressure gradient transducers. A pure pressure gradient microphone is highly
directional because it can differentiate between sounds coming from the front as
opposed to the rear, thus giving such microphones the common name of
bidirectional. The equation for such a sensitivity would be:
s = Cos( )
where s is again the sensitivity of the diaphragm and is the angle of incidence of
the sound (zero being a sound source located directly in front of the microphone).
In other words, the voltage output of a bidirectional microphone varies directly
with the air pressure of sound as a function of the cosine of the angle at which the
sound strikes the diaphragm.
Many microphones include both a pressure and pressure gradient
component. In fact, it is the ratio of pressure to pressure gradient components in
the sensitivity of a microphone that determines its directional characteristics. The
following table (Table 4A) displays the requisite component combinations for
some common sensitivity patterns:

TdC–19
Polar Pattern Pressure Component Pressure-Gradient Comp. Omnidirectional 1 0 Subcardioid 0.75 0.25 Cardioid 0.5 0.5 Supercardioid 0.37 0.63 Hypercardioid 0.25 0.75 Bidirectional 0 1
To convert this component relationship to a mathematical expression, the
component amounts are simply substituted as coefficients to the original
omnidirectional and bidirectional equations; the components are then summed as
shown below in Table 4B:
Polar Pattern Polar Equation Omnidirectional 1 Subcardioid 0.75 + 0.25*Cos( ) Cardioid 0.50 + 0.50*Cos( ) Supercardioid 0.37 + 0.63*Cos( ) Hypercardioid 0.25 + 0.75*Cos( ) Bidirectional Cos( )
With such equations, the sensitivities of different microphones can be
plotted against the angle of sound incidence, giving a visual view of how the
microphone responds to sound throughout 360 degrees. Before creating such a
polar plot, however, the sensitivities are usually converted to decibels as a closer
approximation of human hearing. The formula for such a conversion is:
dB = 20 * Log (s)
where s is the sensitivity at a given angle. The polar plots for the microphone
patterns given above are presented on the next page. Notice that all negative
decibel values are converted to positive values for graphing purposes.

TdC–20
Ideal Omnidirectional
30
210
60
240
90270
120
300
150
330
180
0
-5
-10
-15dB
-20
Ideal Subcardioid
30
210
60
240
90270
120
300
150
330
180
0
-5
-10
-15dB
-20
Ideal Cardioid
30
210
60
240
90270
120
300
150
330
180
0
-5
-10
-15dB
-20
Ideal Supercardioid
30
210
60
240
90270
120
300
150
330
180
0
-5
-10
-15dB
-20
Ideal Hypercardioid
30
210
60
240
90270
120
300
150
330
180
0
-5
-10
-15dB
-20
Ideal Bidirectional
30
210
60
240
90270
120
300
150
330
180
0
-5
-10
-15dB
-20

TdC–21
Of course, the above equations and polar patterns are only true under
theoretical situations. Most real world microphones, while perhaps exhibiting
ideal or near-ideal behavior at around 1 kHz and/or zero degrees incidence,
quickly diverge from these ideal polar patterns when considering both different
frequencies and non-direct sound incidence. While studio microphones, almost
without exception, have a linear response to on-axis sound, their off-axis response
is one of the main determinants in their vastly differing sound characteristics.
Since omnidirectional and bidirectional patterns can exist as pure pressure
and pressure-gradient microphones respectively, their implementation in
microphone design can be relatively straightforward. As mentioned before,
omnidirectional microphones are often created by having the membrane form one
side of an acoustically closed microphone capsule. Traditionally, at higher
frequencies where the wavelengths become relatively small compared to the
microphone’s body itself, omnidirectional microphones exhibit an acoustic
shadowing effect that adds directionality to the pattern. Bidirectional
microphones, however, most simply constructed as a ribbon open on both sides to
incoming sound, are relatively frequency independent with regard to polar pattern.
The construction of intermediary patterns (the cardioid family) obviously
involves a combination of pressure and pressure gradient design. Early cardioid
microphones simple involved two diaphragms, one omnidirectional and the other
bidirectional, whose outputs were summed equally to give the desired pattern [8].

TdC–22
Other cardioid designs employ acoustic delay paths within the capsule to mimic
somewhat the cancellation property of a bidirectional. Some cardioid diaphragm
designs utilize perforations in the back of the membrane to also add the
bidirectional characteristic to an otherwise pressure only transducer.
In a sort of reverse process, many microphones (especially those with
switchable polar characteristics) employ two oppositely facing cardioid
membranes that can be summed to produce an omnidirectional pattern or
subtracted to form a bidirectional pattern (figure-8). The figure below from [9]
illustrates this possibility:
The amount by which the front and back cardioids are summed in or out of
phase can create a continuous range of patterns, running smoothly from
omnidirectional through to bidirectional. This idea of adding and subtracting the
outputs of two separate membranes to form new, unique, and different polar
patterns plays an important role in the coincident stereo microphone technique of
M/S which will be discussed in the next section.

TdC–23
5. The Ideal Mid/Side Coincident Technique
The previous discussion of adding and subtracting microphone
sensitivities reveals powerful tools for creating new and different pickup patterns.
These sum and difference techniques are particularly appropriate for coincident
stereo setups, such as X/Y or M/S, since the absence of time delay allows
combination without comb filtering. To be particularly exact, the X/Y and M/S
stereo configurations are actually mathematically equivalent; one can be easily
changed to the other through a simple matrixing process. Just as the prior section
necessarily analyzed more closely the topic of microphone directionality and
sensitivity, to more closely compare X/Y and M/S, the M/S technique must be
discussed in deeper detail.
The term M/S, of course, stands for Mid/Side. The Side microphone is
always of the bidirectional pattern and angled perpendicular to the sound source
(traditionally with the positively phase front lobe pointing to the left). The Mid
microphone can be of any pattern and is placed facing the sound source. By
combining the Mid microphone’s output with the Side microphone’s output, a
signal appropriate for the Left channel is created; by combining the Mid
microphone’s output with a reversed phase version of the Side microphone’s
output, a signal appropriate for the Right channel is created. To visualize how
this sum and difference process can create balanced Left and Right signals from
an M/S stereo configuration, diagram 5A is provided on the following page:

TdC–24

TdC–25
The diagram on the previous page (excerpted from [10]) demonstrates the
equivalence of X/Y and M/S through what is commonly referred to as a matrixing
procedure (the matrix is the sum and difference process shown in the middle
between Steps “c” and “d”). Obviously, Step “a” shows a pair of coincident
microphones (in this case, cardioid) offset from the center axis by some angle ;
the Left channel is equivalent to the X microphone and the Right to the Y.
Through the basic definition of a cardioid polar pattern (as discussed in the
previous section), each cardioid microphone is separated into its respective
omnidirectional and bidirectional components (Step “b’). The change from Step
“b” to “c” separates the bidirectional component offset by angle into two
bidirectional components, one at zero degrees and the other at 90 or -90 degrees.
The change made in Step “c” may not be immediately intuitive, but it can be
simply proven by merely summing two perpendicular cosine plots (in other
words, proving the transformation from Step “c” to “b”). To explain it another
way, Step “c” merely divides the offset bidirectional pattern into its component
vectors, much in the same way that any line from the origin of a Cartesian graph
can be divided into a discrete lengths along the X axis and Y axis.
As stated earlier, the change made from Step “d” to “c” (or vice versa as in
the case of M/S to X/Y conversions) is the matrix process. This matrixing
process can be easily understood by making an analogy to simple algebraic
factoring. In Step “c”, both Left and Right share an omnidirectional pattern as

TdC–26
well as a forward pointing bidirectional pattern. In a sense, this omnidirectional
and bidirectional pattern are factored out of both the Left and Right signals to
create the Mid signal, much in the way a common coefficient can be factored out
of any mathematical formula. What remains are two bidirectional patterns, one
positively offset from the sound source by 90 degrees, the other negatively offset
from the sound source by 90 degrees. In mathematical terms, this remainder
could perhaps be represented as (x + (–x)) where x is the bidirectional pattern.
From this remainder, the bidirectional component can be factored out as the Side
signal. The remainder of this second factoring process is simply (1 + (–1)) which
is the sum and difference matrix itself.
In conclusion, Left and Right signals may be derived from any Mid/Side
combination by the following simple formulas:
L = M + S (5B)
R = M – S (5C)
Conversely, Mid and Side components may also be derived from any Left/Right
or X/Y configuration by similarly simple equations:
M = (1/2) * (L + R) (5D)
S = (1/2) * (L – R) (5E)
In the previous equations, a subtraction implies reversing the phase of the
subtracted component. Thus, a bidirectional pattern is always produced when
mixing the Left signal of an X/Y stereo configuration with the Right phase

TdC–27
reversed signal. Through this method, the reverberant portion of any X/Y
recording can be increased or decreased by converting the Left and Right signals
to M/S, raising or lowering the level of the Side product respectively, and re-
matrixing back to Left and Right.
This ability to alter the direct to reverberant ratio of the stereo field after
the recording is one of the as of yet unspoken and implied strengths of the M/S
technique. Many engineers doing location recording send the Mid signal to
Channel One of a stereo recorder and the Side signal to Channel Two. Using this
method, the relative levels of the Mid and Side microphones can, in post-
production, be set to accommodate the desired psychoacoustic nearness or
distance from the performers. Of course, the same procedure can be conducted
with an X/Y recording, but it requires two passes through a sum and difference
matrix instead of one.
In Ron Streicher and Wes Dooley’s classic 1982 paper on M/S stereo [11],
an exhaustive list of X/Y transformations are derived from a multitude of Mid
microphone patterns and ratios of combination with the Side microphone. To
show only examples with worthwhile amounts of stereophony, the relative levels
of Mid or Side microphone are restricted between 30 and 70 percent. Their paper
shows the sensitivities of the M/S microphones in sum and difference examples;
the following pages present representative samples, instead converted to decibel
form, of such M/S possibilities:

Sum
Difference
TdC–28
Ideal Sum/Dif:Omni,Bidir(30/70)
30
210
60
240
90270
120
300
150
330
180
0
-5
-10
-15dB
-20
Ideal Sum/Dif:Omni,Bidir(50/50)
30
210
60
240
90270
120
300
150
330
180
0
-5
-10
-15dB
-20
Ideal Sum/Dif:Omni,Bidir(70/30)
30
210
60
240
90270
120
300
150
330
180
0
-5
-10
-15dB
-20
Ideal Sum/Dif:Sub,Bidir(30/70)
30
210
60
240
90270
120
300
150
330
180
0
-5
-10
-15dB
-20
Ideal Sum/Dif:Sub,Bidir(50/50)
30
210
60
240
90270
120
300
150
330
180
0
-5
-10
-15dB
-20
Ideal Sum/Dif:Sub,Bidir(70/30)
30
210
60
240
90270
120
300
150
330
180
0
-5
-10
-15dB
-20

Sum
Difference
TdC–29
Ideal Sum/Dif:Card,Bidir(30/70)
30
210
60
240
90270
120
300
150
330
180
0
-5
-10
-15dB
-20
Ideal Sum/Dif:Card,Bidir(50/50)
30
210
60
240
90270
120
300
150
330
180
0
-5
-10
-15dB
-20
Ideal Sum/Dif:Card,Bidir(70/30)
30
210
60
240
90270
120
300
150
330
180
0
-5
-10
-15dB
-20
Ideal Sum/Dif:Super,Bidir(30/70)
30
210
60
240
90270
120
300
150
330
180
0
-5
-10
-15dB
-20
Ideal Sum/Dif:Super,Bidir(50/50)
30
210
60
240
90270
120
300
150
330
180
0
-5
-10
-15dB
-20
Ideal Sum/Dif:Super,Bidir(70/30)
30
210
60
240
90270
120
300
150
330
180
0
-5
-10
-15dB
-20

Sum
Difference
TdC–30
Ideal Sum/Dif:Hyper,Bidir(30/70)
30
210
60
240
90270
120
300
150
330
180
0
-5
-10
-15dB
-20
Ideal Sum/Dif:Hyper,Bidir(50/50)
30
210
60
240
90270
120
300
150
330
180
0
-5
-10
-15dB
-20
Ideal Sum/Dif:Hyper,Bidir(70/30)
30
210
60
240
90270
120
300
150
330
180
0
-5
-10
-15dB
-20
Ideal Sum/Dif:Bidir,Bidir(30/70)
30
210
60
240
90270
120
300
150
330
180
0
-5
-10
-15dB
-20
Ideal Sum/Dif:Bidir,Bidir(50/50)
30
210
60
240
90270
120
300
150
330
180
0
-5
-10
-15dB
-20
Ideal Sum/Dif:Bidir,Bidir(70/30)
30
210
60
240
90270
120
300
150
330
180
0
-5
-10
-15dB
-20

TdC–31
Truly, the polar plots on the previous pages show that M/S stereo is, at
least, a versatile recording method. Of course, M/S techniques in no way replace
the need for careful judgment in microphone placement. The choice of pattern for
the Mid microphone is an important decision every engineer must face when
recording with M/S. Ideally, the Mid and Side microphones should be very
closely matched in frequency and transient response. If a ribbon microphone, for
example, is to be used for the Side facing bidirectional transducer, another ribbon
microphone would probably be the best choice for the Mid transducer considering
the unique properties of ribbon microphones. If a variable large diaphragm
condenser, for another example, is to be used for the Mid transducer, it would
again probably be wisest to choose the same model large diaphragm condenser
with pickup pattern set to bidirectional for the Side microphone; such a situation
ensures the closest match and thus more harmonious blend of the mixed Mid and
Side outputs. For further discussion of basic M/S practices, the reader is referred
to an early historical paper on M/S: [12].

TdC–32
6. M/S versus X/Y
As has been shown in the previous section, M/S and X/Y stereo
configurations are mathematically equivalent to each other; a signal in one format
can be easily converted to the other. When considering non-ideal situations such
as real world microphones, however, significant differences between these two
coincident techniques arise, specifically concerning inaccuracies in microphone
polar and frequency response. These practical differences between M/S and X/Y,
when weighed alongside their theoretical differences, result in proving (as shall be
shown) the superiority of the M/S technique over that of X/Y.
A main difference between the two stereo configurations concerns
versatility. The M/S technique is able to make use of any polar pattern; if a
bidirectional microphone is on hand, a microphone of no particular directivity is
necessarily required for M/S. With X/Y techniques, however, pattern choice is
basically limited to microphones with at least a medium amount of directivity, i.e.
cardioids through to bidirectionals. As pure pressure transducer omnidirectional
microphones traditionally have an extended low frequency response compared to
directional microphones (due to compensation equalization for proximity effect),
a superior bass response is possible with M/S recordings versus X/Y. Also, since
the Mid and Side signals can be recorded separately for M/S and then combined
later in the mixing stage, production decisions (such as the width of the stereo
field or psychoacoustical nearness to the performers) can be delayed until after the

TdC–33
recording session or changed at any point in the production process. X/Y stereo,
without converting to M/S and then back to X/Y, is basically limited to the
microphone placement chosen during the tracking session.
The advantages of M/S over X/Y become even more pronounced when
investigating the ramifications of real world inconsistencies in microphone
construction. As is well known and document, the best frequency response for a
microphone is on axis at zero degrees; it is at this angle that the frequency
response analysis for the plots given with any microphone are conducted. When
moving off-axis to the front of the microphone, this frequency response typically
degrades as a function of the angle of incidence, with larger angles of off-axis
sound incidence generating greater discrepancies in frequency response. Such a
phenomenon is commonly documented by polar pattern graphs throughout a
variety of test frequencies for a given microphone. The sonic defects of this poor
off-axis response are more noticeable in X/Y configurations, where both
microphones are angled off-axis to the sound source. Since in M/S recording the
Mid microphone is completely on-axis to the sound source, the best response for
this microphone is optimized. When recording single instruments with a stereo
microphone technique, certainly M/S becomes the obvious choice over X/Y, not
only since the amount of reverberation can be easily controlled by adjusting the
level of the Side microphone, but because the mono sum is the result of the Mid
microphone signal only, not the combination of two off-axis X/Y signals. In fact,

TdC–34
the stereophonic nature of the Left/Right signal in M/S is completely determined
by the Side microphone, so separate decisions can be made concerning the desired
stereo sound versus desired mono sound. Finally, bidirectional microphones
generally tend to have a more consistent response throughout the entire spectrum.
This consistency of bidirectional microphones creates more stable Left/Right
signals, as a rule, for M/S configurations as compared to X/Y.
Of course, not every M/S combination surpasses its X/Y equivalent in
terms of sonic fidelity. The recording engineer should take great care to ensure
that the frequency response and transducer type of the M/S microphones are as
closely matched as possible to create a better blend of the signals. Certain M/S
configurations also tend to exaggerate and distort the inconsistencies in the Mid
microphone’s frequency response. With an informed knowledge of the
application of M/S, however, the practicing engineer may find the M/S technique
unrivalled.

TdC–35
7. Real World Microphone M/S Data
Having carefully analyzed the benefits of coincident techniques over
spaced pair microphones and duly considered the advantages of M/S over X/Y
stereo configurations, one can present a very cogent argument for the universal
use of M/S when recording stereophonically. In real world applications, however,
M/S is not as widely used as one would imagine for a stereo technique of such
superiority; many professional engineers still employ spaced pair omnidirectional
microphones as their main stereo pair when recording ensembles. The reason for
this disuse of M/S may be centered around the slight amount of complication
involved with M/S recording (the matrixing network and decisions about relative
Mid to Side levels), but something more must be triggering the average engineer’s
eschewal of M/S than sheer laziness. Perhaps engineers have experimented with
M/S and found less than satisfactory results. Are all M/S combinations
necessarily superior to their X/Y equivalents, however? Such a question begs a
more practical look into M/S techniques.
While much information is available concerning the frequency response
and polar pattern for any real world microphone, such data does not obviously or
easily relate to the same information regarding the final stereo product of an M/S
recording. In other words, all the technical data given for two microphones used
in an M/S recording does not directly tell the engineer any of the same technical
data for his M/S recording in such a way that could be simply figured out while

TdC–36
on location. The polar patterns of both the Mid and Side microphones at 8 kHz,
for example, may be common knowledge, but the matrixing of the microphone
signals inherent with M/S obscures the resulting polar patterns at 8 kHz for the
final Left and Right sum and differences unless detailed calculations are
performed.
Since rather noticeable flaws (or at least irregularities) exist in basically
every real microphone’s frequency response and polar pattern when compared to
the ideal, such divergences from the ideal also exist in any real world M/S
recording. Also, since previous to this paper no investigation into the results of
real world imperfections in microphone response on the final stereo M/S sum and
difference existed, engineers using M/S could only really guess at the flaws and
irregularities in their M/S recordings. Perhaps what the discriminating ears of
experienced engineers noticed as sonically unappealing about M/S recordings was
the fault of microphone inconsistencies, not M/S inconsistencies as may have
been attributed. Certain M/S combinations, therefore, may more poorly handle
microphone aberrations in response than ideal theory suggests.
To gain a fuller understanding of M/S stereophony and to better judge the
result of the M/S matrixing process on real microphones, a detailed investigation
into the effects of microphone response anomalies is necessary. This paper
purports to undergo just such an investigation. To conduct such a study of all
microphones possibly used with M/S techniques would be beyond the scope of

TdC–37
any paper, so only a few representative real world microphones were chosen in
this study. To further streamline analysis, only Neumann microphones (known
for the highest standard of quality in the recording industry) were analyzed. The
KM100 series represents the typical small diaphragm condenser microphone, the
U89 represents the typical multi-pattern large diaphragm condenser microphone,
and the SM69 represents the typical single-housing dual capsule stereo condenser
microphone design. The results of the M/S sum and difference data for these real
world microphones in presented on the pages of the following sections.
The data used to calculate these sum and difference polar patterns versus
frequency response graphs was extracted from the polar patterns freely available
for download at Neumann’s English web site: http://www.neumann.com. Each
gif file was opened in Photoshop to make exact measurements. At ten degree
intervals, the decibel reduction (calculated in pixels) for each test frequency was
recorded. This data was then mapped onto a 0 – 1 scale for use in number
crunching programs. The result was a 19 X 8 matrix with each row representing a
different test frequency (starting with 125 Hz) and each column representing a
different angle of sound incidence (starting at zero degrees). The compiled data is
available in the appendix.
All Mid/Side to Left/Right conversions of this data were conducted in the
FORTRAN programming environment of MATLAB. With MATLAB,
advertised as numerical visualization software, the resulting matrixes of

TdC–38
Left/Right information could be easily graphed on a polar plot with separation for
individual frequencies. The entire set of originally created MATLAB functions
and their code is also available in the appendix. A large part of this project,
frankly, was the writing and perfecting of these computer programs. For any and
all readers with an educated knowledge of computer programming, please accept
the great inelegance of these functions since the programming experience of the
author is extremely rudimentary and limited.

TdC–39
8. KM100 Polar Pattern versus Frequency Response
KM130 Omni
30
210
60
240
90270
120
300
150
330
180
0
-5
-10
-15dB
-20
125 Hz - 1 kHz2 kHz4 kHz8 kHz16 kHz
KM143 Subcardioid
30
210
60
240
90270
120
300
150
330
180
0
-5
-10
-15dB
-20
125 Hz250 Hz - 1 kHz2 kHz4 kHz8 kHz16 kHz
KM140 Cardioid
30
210
60
240
90270
120
300
150
330
180
0
-5
-10
-15dB
-20
125 Hz250 Hz - 1 kHz2 kHz - 4 kHz8 kHz16 kHz

TdC–40
KM150 Hypercardioid
30
210
60
240
90270
120
300
150
330
180
0
-5
-10
-15dB
-20
125 Hz250 Hz500 Hz - 1 kHz2 kHz4 kHz8 kHz16 kHz
AK20 Bidirectional
30
210
60
240
90270
120
300
150
330
180
0
-5
-10
-15dB
-20
125 Hz - 1 kHz2 kHz & 4 kHz8 kHz16 kHz

125 Hz - 1 kHz2 kHz
4 kHz8 kHz16 kHz
TdC–41
Sum(30/70):KM130 Omni/AK20 Bidir
30
210
60
240
90270
120
300
150
330
180
0
-5
-10
-15dB
-20
Dif(30/70):KM130 Omni/AK20 Bidir
30
210
60
240
90270
120
300
150
330
180
0
-5
-10
-15dB
-20
Sum(50/50):KM130 Omni/AK20 Bidir
30
210
60
240
90270
120
300
150
330
180
0
-5
-10
-15dB
-20
Dif(50/50):KM130 Omni/AK20 Bidir
30
210
60
240
90270
120
300
150
330
180
0
-5
-10
-15dB
-20
Sum(70/30):KM130 Omni/AK20 Bidir
30
210
60
240
90270
120
300
150
330
180
0
-5
-10
-15dB
-20
Dif(70/30):KM130 Omni/AK20 Bidir
30
210
60
240
90270
120
300
150
330
180
0
-5
-10
-15dB
-20

125 Hz250 Hz - 1 kHz2 kHz
4 kHz8 kHz16 kHz
TdC–42
Sum(30/70):KM143 Sub/AK20 Bidir
30
210
60
240
90270
120
300
150
330
180
0
-5
-10
-15dB
-20
Dif(30/70):KM143 Sub/AK20 Bidir
30
210
60
240
90270
120
300
150
330
180
0
-5
-10
-15dB
-20
Sum(50/50):KM143 Sub/AK20 Bidir
30
210
60
240
90270
120
300
150
330
180
0
-5
-10
-15dB
-20
Dif(50/50):KM143 Sub/AK20 Bidir
30
210
60
240
90270
120
300
150
330
180
0
-5
-10
-15dB
-20
Sum(70/30):KM143 Sub/AK20 Bidir
30
210
60
240
90270
120
300
150
330
180
0
-5
-10
-15dB
-20
Dif(70/30):KM143 Sub/AK20 Bidir
30
210
60
240
90270
120
300
150
330
180
0
-5
-10
-15dB
-20

125 Hz250 Hz - 1 kHz
2 kHz & 4 kHz8 kHz16 kHz
TdC–43
Sum(30/70):KM140 Card/AK20 Bidir
30
210
60
240
90270
120
300
150
330
180
0
-5
-10
-15dB
-20
Dif(30/70):KM140 Card/AK20 Bidir
30
210
60
240
90270
120
300
150
330
180
0
-5
-10
-15dB
-20
Sum(50/50):KM140 Card/AK20 Bidir
30
210
60
240
90270
120
300
150
330
180
0
-5
-10
-15dB
-20
Dif(50/50):KM140 Card/AK20 Bidir
30
210
60
240
90270
120
300
150
330
180
0
-5
-10
-15dB
-20
Sum(70/30):KM140 Card/AK20 Bidir
30
210
60
240
90270
120
300
150
330
180
0
-5
-10
-15dB
-20
Dif(70/30):KM140 Card/AK20 Bidir
30
210
60
240
90270
120
300
150
330
180
0
-5
-10
-15dB
-20

125 Hz250 Hz500 Hz - 1 kHz
2 kHz4 kHz8 kHz16 kHz
TdC–44
Sum(30/70):KM150 Hyper/AK20 Bidir
30
210
60
240
90270
120
300
150
330
180
0
-5
-10
-15dB
-20
Dif(30/70):KM150 Hyper/AK20 Bidir
30
210
60
240
90270
120
300
150
330
180
0
-5
-10
-15dB
-20
Sum(50/50):KM150 Hyper/AK20 Bidir
30
210
60
240
90270
120
300
150
330
180
0
-5
-10
-15dB
-20
Dif(50/50):KM150 Hyper/AK20 Bidir
30
210
60
240
90270
120
300
150
330
180
0
-5
-10
-15dB
-20
Sum(70/30):KM150 Hyper/AK20 Bidir
30
210
60
240
90270
120
300
150
330
180
0
-5
-10
-15dB
-20
Dif(70/30):KM150 Hyper/AK20 Bidir
30
210
60
240
90270
120
300
150
330
180
0
-5
-10
-15dB
-20

125 Hz - 1 kHz2 kHz & 4 kHz8 kHz16 kHz
TdC–45
Sum(30/70):AK20 Bidir/AK20 Bidir
30
210
60
240
90270
120
300
150
330
180
0
-5
-10
-15dB
-20
Dif(30/70):AK20 Bidir/AK20 Bidir
30
210
60
240
90270
120
300
150
330
180
0
-5
-10
-15dB
-20
Sum(50/50):AK20 Bidir/AK20 Bidir
30
210
60
240
90270
120
300
150
330
180
0
-5
-10
-15dB
-20
Dif(50/50):AK20 Bidir/AK20 Bidir
30
210
60
240
90270
120
300
150
330
180
0
-5
-10
-15dB
-20
Sum(70/30):AK20 Bidir/AK20 Bidir
30
210
60
240
90270
120
300
150
330
180
0
-5
-10
-15dB
-20
Dif(70/30):AK20 Bidir/AK20 Bidir
30
210
60
240
90270
120
300
150
330
180
0
-5
-10
-15dB
-20

TdC–46
9. U89 Polar Pattern versus Frequency Response
U89 Omnidirectional
30
210
60
240
90270
120
300
150
330
180
0
-5
-10
-15dB
-20
125 Hz - 1 kHz2 kHz4 kHz - 8 kHz16 kHz
U89 Subcardioid
30
210
60
240
90270
120
300
150
330
180
0
-5
-10
-15dB
-20
125 Hz - 250 Hz500 Hz1 kHz2 kHz4 kHz8 kHz16 kHz
U89 Cardioid
30
210
60
240
90270
120
300
150
330
180
0
-5
-10
-15dB
-20
125 Hz250 Hz500 Hz1 kHz2 kHz4 kHz8 kHz16 kHz

TdC–47
U89 Hypercardioid
30
210
60
240
90270
120
300
150
330
180
0
-5
-10
-15dB
-20
125 Hz250 Hz500 Hz1 kHz2 kHz4 kHz8 kHz16 kHz
U89 Bidirectional
30
210
60
240
90270
120
300
150
330
180
0
-5
-10
-15dB
-20
125 Hz - 1 kHz2 kHz - 8 kHz16 kHz

125 Hz - 1 kHz2 kHz4 kHz - 8 kHz16 kHz
TdC–48
Sum(30/70):U89 Omni/U89 Bidir
30
210
60
240
90270
120
300
150
330
180
0
-5
-10
-15dB
-20
Dif(30/70):U89 Omni/U89 Bidir
30
210
60
240
90270
120
300
150
330
180
0
-5
-10
-15dB
-20
Sum(50/50):U89 Omni/U89 Bidir
30
210
60
240
90270
120
300
150
330
180
0
-5
-10
-15dB
-20
Dif(50/50):U89 Omni/U89 Bidir
30
210
60
240
90270
120
300
150
330
180
0
-5
-10
-15dB
-20
Sum(70/30):U89 Omni/U89 Bidir
30
210
60
240
90270
120
300
150
330
180
0
-5
-10
-15dB
-20
Dif(70/30):U89 Omni/U89 Bidir
30
210
60
240
90270
120
300
150
330
180
0
-5
-10
-15dB
-20

125 Hz - 250 Hz500 Hz1 kHz
2 kHz4 kHz8 kHz16 kHz
TdC–49
Sum(30/70):U89 Sub/U89 Bidir
30
210
60
240
90270
120
300
150
330
180
0
-5
-10
-15dB
-20
Dif(30/70):U89 Sub/U89 Bidir
30
210
60
240
90270
120
300
150
330
180
0
-5
-10
-15dB
-20
Sum(50/50):U89 Sub/U89 Bidir
30
210
60
240
90270
120
300
150
330
180
0
-5
-10
-15dB
-20
Dif(50/50):U89 Sub/U89 Bidir
30
210
60
240
90270
120
300
150
330
180
0
-5
-10
-15dB
-20
Sum(70/30):U89 Sub/U89 Bidir
30
210
60
240
90270
120
300
150
330
180
0
-5
-10
-15dB
-20
Dif(70/30):U89 Sub/U89 Bidir
30
210
60
240
90270
120
300
150
330
180
0
-5
-10
-15dB
-20

125 Hz250 Hz500 Hz1 kHz
2 kHz4 kHz8 kHz16 kHz
TdC–50
Sum(30/70):U89 Card/U89 Bidir
30
210
60
240
90270
120
300
150
330
180
0
-5
-10
-15dB
-20
Dif(30/70):U89 Card/U89 Bidir
30
210
60
240
90270
120
300
150
330
180
0
-5
-10
-15dB
-20
Sum(50/50):U89 Card/U89 Bidir
30
210
60
240
90270
120
300
150
330
180
0
-5
-10
-15dB
-20
Dif(50/50):U89 Card/U89 Bidir
30
210
60
240
90270
120
300
150
330
180
0
-5
-10
-15dB
-20
Sum(70/30):U89 Card/U89 Bidir
30
210
60
240
90270
120
300
150
330
180
0
-5
-10
-15dB
-20
Dif(70/30):U89 Card/U89 Bidir
30
210
60
240
90270
120
300
150
330
180
0
-5
-10
-15dB
-20

125 Hz250 Hz500 Hz1 kHz
2 kHz4 kHz8 kHz16 kHz
TdC–51
Sum(30/70):U89 Hyper/U89 Bidir
30
210
60
240
90270
120
300
150
330
180
0
-5
-10
-15dB
-20
Dif(30/70):U89 Hyper/U89 Bidir
30
210
60
240
90270
120
300
150
330
180
0
-5
-10
-15dB
-20
Sum(50/50):U89 Hyper/U89 Bidir
30
210
60
240
90270
120
300
150
330
180
0
-5
-10
-15dB
-20
Dif(50/50):U89 Hyper/U89 Bidir
30
210
60
240
90270
120
300
150
330
180
0
-5
-10
-15dB
-20
Sum(70/30):U89 Hyper/U89 Bidir
30
210
60
240
90270
120
300
150
330
180
0
-5
-10
-15dB
-20
Dif(70/30):U89 Hyper/U89 Bidir
30
210
60
240
90270
120
300
150
330
180
0
-5
-10
-15dB
-20

125 Hz - 1 kHz2 kHz - 8 kHz16 kHz
TdC–52
Sum(30/70):U89 Bidir/U89 Bidir
30
210
60
240
90270
120
300
150
330
180
0
-5
-10
-15dB
-20
Dif(30/70):U89 Bidir/U89 Bidir
30
210
60
240
90270
120
300
150
330
180
0
-5
-10
-15dB
-20
Sum(50/50):U89 Bidir/U89 Bidir
30
210
60
240
90270
120
300
150
330
180
0
-5
-10
-15dB
-20
Dif(50/50):U89 Bidir/U89 Bidir
30
210
60
240
90270
120
300
150
330
180
0
-5
-10
-15dB
-20
Sum(70/30):U89 Bidir/U89 Bidir
30
210
60
240
90270
120
300
150
330
180
0
-5
-10
-15dB
-20
Dif(70/30):U89 Bidir/U89 Bidir
30
210
60
240
90270
120
300
150
330
180
0
-5
-10
-15dB
-20

TdC–53
10. SM69 Polar Pattern versus Frequency Response
SM69 Omnidirectional
30
210
60
240
90270
120
300
150
330
180
0
-5
-10
-15dB
-20
125 Hz - 1 kHz2 kHz4 kHz8 kHz16 kHz
SM69 Subcardioid
30
210
60
240
90270
120
300
150
330
180
0
-5
-10
-15dB
-20
125 Hz250 Hz500 Hz1 kHz2 kHz4 kHz8 kHz16 kHz
SM69 Cardioid
30
210
60
240
90270
120
300
150
330
180
0
-5
-10
-15dB
-20
125 Hz250 Hz500 Hz1 kHz2 kHz4 kHz8 kHz16 kHz

TdC–54
SM69 Hypercardioid
30
210
60
240
90270
120
300
150
330
180
0
-5
-10
-15dB
-20
125 Hz & 250 Hz
500 Hz & 1 kHz
2 kHz & 4 kHz
8 kHz
16 kHz
SM69 Bidirectional
30
210
60
240
90270
120
300
150
330
180
0
-5
-10
-15dB
-20
125 Hz - 1 kHz2 kHz - 8 kHz16 kHz

125 Hz - 1 kHz2 kHz
4 kHz8 kHz16 kHz
TdC–55
Sum(30/70):SM69 Omni/SM69 Bidir
30
210
60
240
90270
120
300
150
330
180
0
-5
-10
-15dB
-20
Dif(30/70):SM69 Omni/SM69 Bidir
30
210
60
240
90270
120
300
150
330
180
0
-5
-10
-15dB
-20
Sum(50/50):SM69 Omni/SM69 Bidir
30
210
60
240
90270
120
300
150
330
180
0
-5
-10
-15dB
-20
Dif(50/50):SM69 Omni/SM69 Bidir
30
210
60
240
90270
120
300
150
330
180
0
-5
-10
-15dB
-20
Sum(70/30):SM69 Omni/SM69 Bidir
30
210
60
240
90270
120
300
150
330
180
0
-5
-10
-15dB
-20
Dif(70/30):SM69 Omni/SM69 Bidir
30
210
60
240
90270
120
300
150
330
180
0
-5
-10
-15dB
-20

125 Hz250 Hz500 Hz1 kHz
2 kHz4 kHz8 kHz16 kHz
TdC–56
Sum(30/70):SM69 Sub/SM69 Bidir
30
210
60
240
90270
120
300
150
330
180
0
-5
-10
-15dB
-20
Dif(30/70):SM69 Sub/SM69 Bidir
30
210
60
240
90270
120
300
150
330
180
0
-5
-10
-15dB
-20
Sum(50/50):SM69 Sub/SM69 Bidir
30
210
60
240
90270
120
300
150
330
180
0
-5
-10
-15dB
-20
Dif(50/50):SM69 Sub/SM69 Bidir
30
210
60
240
90270
120
300
150
330
180
0
-5
-10
-15dB
-20
Sum(70/30):SM69 Sub/SM69 Bidir
30
210
60
240
90270
120
300
150
330
180
0
-5
-10
-15dB
-20
Dif(70/30):SM69 Sub/SM69 Bidir
30
210
60
240
90270
120
300
150
330
180
0
-5
-10
-15dB
-20

125 Hz250 Hz500 Hz1 kHz
2 kHz4 kHz8 kHz16 kHz
TdC–57
Sum(30/70):SM69 Card/SM69 Bidir
30
210
60
240
90270
120
300
150
330
180
0
-5
-10
-15dB
-20
Dif(30/70):SM69 Card/SM69 Bidir
30
210
60
240
90270
120
300
150
330
180
0
-5
-10
-15dB
-20
Sum(50/50):SM69 Card/SM69 Bidir
30
210
60
240
90270
120
300
150
330
180
0
-5
-10
-15dB
-20
Dif(50/50):SM69 Card/SM69 Bidir
30
210
60
240
90270
120
300
150
330
180
0
-5
-10
-15dB
-20
Sum(70/30):SM69 Card/SM69 Bidir
30
210
60
240
90270
120
300
150
330
180
0
-5
-10
-15dB
-20
Dif(70/30):SM69 Card/SM69 Bidir
30
210
60
240
90270
120
300
150
330
180
0
-5
-10
-15dB
-20

125 Hz & 250 Hz
500 Hz & 1 kHz
2 kHz & 4 kHz8 kHz16 kHz
TdC–58
Sum(30/70):SM69 Hyper/SM69 Bidir
30
210
60
240
90270
120
300
150
330
180
0
-5
-10
-15dB
-20
Dif(30/70):SM69 Hyper/SM69 Bidir
30
210
60
240
90270
120
300
150
330
180
0
-5
-10
-15dB
-20
Sum(50/50):SM69 Hyper/SM69 Bidir
30
210
60
240
90270
120
300
150
330
180
0
-5
-10
-15dB
-20
Dif(50/50):SM69 Hyper/SM69 Bidir
30
210
60
240
90270
120
300
150
330
180
0
-5
-10
-15dB
-20
Sum(70/30):SM69 Hyper/SM69 Bidir
30
210
60
240
90270
120
300
150
330
180
0
-5
-10
-15dB
-20
Dif(70/30):SM69 Hyper/SM69 Bidir
30
210
60
240
90270
120
300
150
330
180
0
-5
-10
-15dB
-20

125 Hz - 1 kHz2 kHz - 8 kHz16 kHz
TdC–59
Sum(30/70):SM69 Bidir/SM69 Bidir
30
210
60
240
90270
120
300
150
330
180
0
-5
-10
-15dB
-20
Dif(30/70):SM69 Bidir/SM69 Bidir
30
210
60
240
90270
120
300
150
330
180
0
-5
-10
-15dB
-20
Sum(50/50):SM69 Bidir/SM69 Bidir
30
210
60
240
90270
120
300
150
330
180
0
-5
-10
-15dB
-20
Dif(50/50):SM69 Bidir/SM69 Bidir
30
210
60
240
90270
120
300
150
330
180
0
-5
-10
-15dB
-20
Sum(70/30):SM69 Bidir/SM69 Bidir
30
210
60
240
90270
120
300
150
330
180
0
-5
-10
-15dB
-20
Dif(70/30):SM69 Bidir/SM69 Bidir
30
210
60
240
90270
120
300
150
330
180
0
-5
-10
-15dB
-20

TdC–60
11. Data Analysis
Within the preceding pages of graphs lies a detailed amount of information about
the theoretical behavior of real world M/S combinations. An analysis of this data is
necessary to extract conclusions about the advantages and disadvantages of particular
configurations. To examine the worth of each real world M/S pair, it only seems
appropriate to make a comparison to the equivalent ideal M/S pair. Presumably, ideal
microphone configurations are not only theoretically perfect but would also be the
pinnacle of microphone response and sound quality if existing in the real world.
To facilitate such a comparison, the following tables have been created with the
help of MATLAB. The sensitivities of each real world microphone at a particular
frequency and M/S ratio (as described in parts 8–10) have been subtracted from the ideal
sensitivity at the same angle of incidence. These absolute values of these differences
were then average over the amount of angles of incidence, giving an average deviation
from the ideal through all angles. A total average over all frequencies is also provided in
the penultimate column of each table. Finally, the average deviation of each frequency’s
average from the total average is calculated, thus providing insight as to the stability of
the polar pattern throughout the frequency range. A microphone combination with a low
number in the red type but a high figure in the black type on a yellow background,
therefore, represents an M/S set up that averages close to the ideal but includes a large
amount of deviation in polar response over the entire frequency spectrum.

TdC–61
Table of Sensitivity Differences Between Neumann KM100 M/S Configurations at
various Mid to Side Ratios as Compared to their Ideal M/S equivalents:
Mid Mic. 125 Hz 250 Hz 500 Hz 1 kHz 2 kHz 4 kHz 8 kHz 16 kHz Avg.. Dev.
KM130 Omni
@ 30% 0.0347 0.0347 0.0347 0.0347 0.0310 0.0700 0.1166 0.2061 0.0703 0.0455
@ 50% 0.0265 0.0265 0.0265 0.0265 0.0326 0.0963 0.1601 0.2788 0.0842 0.0706
@ 70% 0.0162 0.0162 0.0162 0.0162 0.0424 0.1448 0.2366 0.4059 0.1118 0.1130
Average 0.0258 0.0258 0.0258 0.0258 0.0353 0.1037 0.1711 0.2969 0.0888 0.0764
KM143 Sub
@ 30% 0.0450 0.0422 0.0422 0.0422 0.0386 0.0622 0.0890 0.1748 0.0670 0.0324
@ 50% 0.0527 0.0438 0.0438 0.0438 0.0457 0.0934 0.1277 0.2142 0.0831 0.0465
@ 70% 0.0625 0.0480 0.0480 0.0480 0.0544 0.1247 0.1582 0.2686 0.1015 0.0617
Average 0.0534 0.0447 0.0447 0.0447 0.0462 0.0934 0.1250 0.2192 0.0839 0.0469
KM140 Card
@ 30% 0.0459 0.0440 0.0440 0.0440 0.0363 0.0363 0.0661 0.1639 0.0601 0.0275
@ 50% 0.0430 0.0287 0.0287 0.0287 0.0331 0.0331 0.0454 0.1538 0.0493 0.0261
@ 70% 0.0438 0.0218 0.0218 0.0218 0.0337 0.0337 0.0306 0.1618 0.0461 0.0289
Average 0.0442 0.0315 0.0315 0.0315 0.0344 0.0344 0.0474 0.1598 0.0518 0.0275
KM150 Hyper
@ 30% 0.0642 0.0651 0.0652 0.0652 0.0530 0.0545 0.0897 0.1673 0.0780 0.0252
@ 50% 0.0699 0.0765 0.0757 0.0757 0.0672 0.0699 0.1035 0.1326 0.0839 0.0171
@ 70% 0.0830 0.0870 0.0877 0.0877 0.0801 0.0840 0.1191 0.1151 0.0930 0.0121
Average 0.0724 0.0762 0.0762 0.0762 0.0668 0.0695 0.1041 0.1383 0.0850 0.0181
AK20 Bidir
@ 30% 0.0486 0.0486 0.0486 0.0486 0.0371 0.0371 0.0782 0.1601 0.0634 0.0279
@ 50% 0.0505 0.0505 0.0505 0.0505 0.0370 0.0370 0.0819 0.1484 0.0633 0.0259
@ 70% 0.0486 0.0486 0.0486 0.0486 0.0371 0.0371 0.0782 0.1601 0.0634 0.0279
Average 0.0492 0.0492 0.0492 0.0492 0.0371 0.0371 0.0794 0.1562 0.0634 0.0272

TdC–62
Table of Sensitivity Differences Between Neumann U89 M/S Configurations at
various Mid to Side Ratios as Compared to their Ideal M/S equivalents:
Mid Mic. 125 Hz 250 Hz 500 Hz 1 kHz 2 kHz 4 kHz 8 kHz 16 kHz Avg... Dev.
U89 Omni
@ 30% 0.0635 0.0635 0.0635 0.0635 0.0706 0.0702 0.0702 0.1979 0.0829 0.0288
@ 50% 0.0623 0.0623 0.0623 0.0623 0.0671 0.0669 0.0669 0.2826 0.0916 0.0478
@ 70% 0.0985 0.0985 0.0985 0.0985 0.0900 0.0624 0.0624 0.3826 0.1239 0.0647
Average 0.0748 0.0748 0.0748 0.0748 0.0759 0.0665 0.0665 0.2877 0.0995 0.0471
U89 Sub
@ 30% 0.0873 0.0873 0.0879 0.0894 0.0951 0.0962 0.0968 0.1801 0.1025 0.0194
@ 50% 0.1027 0.1027 0.1186 0.1371 0.0949 0.1012 0.0981 0.2686 0.1280 0.0374
@ 70% 0.1491 0.1491 0.1901 0.2167 0.1035 0.1207 0.1317 0.3308 0.1740 0.0539
Average 0.1130 0.1130 0.1322 0.1477 0.0978 0.1060 0.1089 0.2598 0.1348 0.0369
U89 Card
@ 30% 0.0848 0.0840 0.0828 0.0817 0.0907 0.0923 0.0932 0.1577 0.0959 0.0155
@ 50% 0.0911 0.0860 0.0854 0.0870 0.0827 0.0857 0.0908 0.1927 0.1002 0.0231
@ 70% 0.0838 0.0864 0.0839 0.0915 0.0546 0.0745 0.0970 0.2320 0.1005 0.0329
Average 0.0866 0.0855 0.0840 0.0867 0.0760 0.0842 0.0937 0.1941 0.0989 0.0238
U89 Hyper
@ 30% 0.0903 0.0919 0.0750 0.0671 0.0858 0.0832 0.0973 0.1426 0.0917 0.0142
@ 50% 0.1275 0.1299 0.0937 0.0535 0.1011 0.0739 0.1095 0.1436 0.1041 0.0235
@ 70% 0.1613 0.1627 0.1107 0.0490 0.1190 0.0750 0.1262 0.1349 0.1174 0.0293
Average 0.1264 0.1282 0.0931 0.0565 0.1020 0.0774 0.1110 0.1404 0.1044 0.0224
U89 Bidir
@ 30% 0.0491 0.0491 0.0491 0.0491 0.0676 0.0676 0.0676 0.1149 0.0643 0.0152
@ 50% 0.0522 0.0522 0.0522 0.0522 0.0676 0.0676 0.0676 0.1196 0.0664 0.0142
@ 70% 0.0491 0.0491 0.0491 0.0491 0.0676 0.0676 0.0676 0.1149 0.0643 0.0152
Average 0.0501 0.0501 0.0501 0.0501 0.0676 0.0676 0.0676 0.1165 0.0650 0.0148

TdC–63
Table of Sensitivity Differences Between Neumann SM69 M/S Configurations at
various Mid to Side Ratios as Compared to their Ideal M/S equivalents:
Mid Mic. 125 Hz 250 Hz 500 Hz 1 kHz 2 kHz 4 kHz 8 kHz 16 kHz Avg.... Dev.
SM69 Omni
@ 30% 0.0459 0.0459 0.0459 0.0459 0.0440 0.0407 0.0698 0.2204 0.0698 0.0376
@ 50% 0.0690 0.0690 0.0690 0.0690 0.0674 0.0557 0.1224 0.2879 0.1012 0.0520
@ 70% 0.1270 0.1270 0.1270 0.1270 0.1084 0.0720 0.1921 0.3983 0.1599 0.0677
Average 0.0806 0.0806 0.0806 0.0806 0.0733 0.0561 0.1281 0.3022 0.1103 0.0524
SM69 Sub
@ 30% 0.0570 0.0600 0.0762 0.0818 0.0771 0.0687 0.0600 0.2146 0.0869 0.0319
@ 50% 0.1128 0.1210 0.1476 0.1547 0.1357 0.1107 0.0917 0.2762 0.1438 0.0368
@ 70% 0.1767 0.1879 0.2274 0.2395 0.2081 0.1692 0.1358 0.3381 0.2103 0.0435
Average 0.1155 0.1230 0.1504 0.1587 0.1403 0.1162 0.0958 0.2763 0.1470 0.0374
SM69 Card
@ 30% 0.0509 0.0458 0.0400 0.0359 0.0442 0.0427 0.0579 0.2069 0.0655 0.0353
@ 50% 0.0708 0.0616 0.0514 0.0407 0.0703 0.0609 0.0894 0.2340 0.0849 0.0384
@ 70% 0.0638 0.0534 0.0364 0.0247 0.0700 0.0543 0.1120 0.2480 0.0828 0.0486
Average 0.0618 0.0536 0.0426 0.0338 0.0615 0.0526 0.0864 0.2296 0.0777 0.0408
SM69 Hyper
@ 30% 0.0541 0.0541 0.0396 0.0396 0.0373 0.0373 0.0482 0.1942 0.0631 0.0328
@ 50% 0.0883 0.0883 0.0541 0.0541 0.0526 0.0526 0.0810 0.1877 0.0824 0.0293
@ 70% 0.1025 0.1025 0.0545 0.0545 0.0522 0.0522 0.1056 0.1712 0.0869 0.0336
Average 0.0816 0.0816 0.0494 0.0494 0.0474 0.0474 0.0783 0.1844 0.0775 0.0319
SM69 Bidir
@ 30% 0.0162 0.0162 0.0162 0.0162 0.0140 0.0140 0.0140 0.1852 0.0365 0.0372
@ 50% 0.0161 0.0161 0.0161 0.0161 0.0138 0.0138 0.0138 0.1854 0.0364 0.0373
@ 70% 0.0162 0.0162 0.0162 0.0162 0.0140 0.0140 0.0140 0.1852 0.0365 0.0372
Average 0.0162 0.0162 0.0162 0.0162 0.0139 0.0139 0.0139 0.1853 0.0365 0.0372

TdC–64
The tables above reveal some exciting insights into real world M/S recordings.
The use of a bidirectional microphone for the Side microphone (as is required for M/S
recording) has the effect of stabilizing the resultant polar pattern as well as bringing it
closer to the ideal. Merely examine the above ratios to notice how that almost every
combination of 30% Mid microphone has the lowest average sensitivity difference (red
figure) and the lowest average deviation among frequencies (black on yellow background
figure). Similarly, real world M/S pairs that involve bidirectional patterns for both Mid
and Side microphone fair rather well as compared to other patterns. Most surprising are
the good results for hypercardioid combinations; using any microphone transducer type,
hypercardioid M/S matrixes have the highest stability of polar pattern in two cases and
the second highest in one. Perhaps some engineers may be discouraged by the semi-
unflattering average differences from the ideal with hypercardioid microphones; this
difference, however, is probably more due to the relatively large amount of leeway in
defining the exact directivity of a hypercardioid pattern. Unlike omnidirectional (all
pressure receptor), bidirectional (all pressure gradient), or cardioid (half and half), the
term hypercardioid often merely implies a pattern that simply lies somewhere between
bidirectional and cardioid. A final comment on this data is that the omnidirectional
pattern obviously makes for a poor Mid microphone choice. Not only are configurations
that employ it far from ideal and erratic in polar response, the amount of stereo
information is quite limited (due to resulting wide angle polar patterns).

TdC–65
12. Summary
This paper has endeavored to shed some light upon the Mid/Side stereo
technique in practice. Through careful numerical handling and computation,
analysis of real world M/S pairs has proven that not all M/S configurations are as
successful as others when employing actual, non-ideal microphones. Hopefully,
this investigation will provide a starting point (or re-starting point) for engineers
who have never quite realized the power of M/S stereo or have previously
experimented unsuccessfully with the technique. As has been also shown, M/S
stereo is in fact an extremely stable, phase coherent, flexible, versatile, and
accurate reproduction method of recording. Such advantages are of specific
interest to those involved in tonmeister recording whose aesthetics are based upon
recreating the natural sound image. Moreover, such exact stereo reproduction is
of interest to all involved with acoustic recording, so almost every music engineer
should find the discussions herein applicable. Of course, the application of the
techniques described in this paper can never ensure a perfect recording; these
techniques can, however, better aide in capturing a perfect performance.

TdC–66
13. Acknowledgments
The author wishes to thank Mr. Ron Streicher and Mr. Wes Dooley for
their initial encouragement and guidance with this project. The timely and
informative responses from Stephan Peus at Neumann GmbH in Germany were
also extremely helpful in assuring the accuracy of the data generated in this paper.
Thanks are also due to Profs. Barry Greenhut and Paul Geluso of the New York
University adjunct faculty for their general inspiration on the subjects of
microphones, stereophony, recording, and the basic process of academic inquiry.
Most importantly, this work would not have been possible, as least in its present
state of production, if not for the generous financial support of Mrs. Clarice Holtz.
Finally, this paper is dedicated to Suzanne and Ted de Clercq whose parental
guidance, if sometimes unappreciated by the author, has nurtured the talents,
intelligence, and humanity of both their sons.

TdC–67
14. References [1] B. F. Hertz, “100 Years with Stereo: The Beginning,” J. Audio Eng. Soc., vol. 29, no. 5, pp. 368-372 (1981 May). [2] A. C. Keller, “Early Hi-Fi and Stereo Recording at Bell Laboratories,” J. Audio Eng. Soc., vol. 29, no. 4, pp. 274-280 (1981 April). [3] H. Fletcher et al., Bell Laboratories Record, vol. 11, pp. 254-61 (1933 May); vol. 12, pp. 194-213 (1934 March). [4] Blumlein, British patent 394, 325, 1931 Dec. 14; reprinted in J. Audio Eng. Soc., vol. 6, p. 91ff (1958 April). [5] J. Blauert, Spatial Hearing: The Psychophysics of Human Sound (MIT Press, Cambridge, MA 1983). [6] J. Moir, “Stereophonic Reproduction,” Audio, pp. 26-28 (1952 October). [7] S. Lipshitz, “Stereo Microphone Techniques: Are the Purists Wrong?” Preprint No. 2261, presented at the 78th Audio Engineering Society Convention, May, 1985. [8] H. F. Olson, “A History of High-Quality Studio Microphones,” presented November 1, 1976, at the 55th Convention of the Audio Engineering Society, New York [9] M. Dickreiter, Tonmeister Technology (Temmer Enterprises, Inc., New York, 1989). [10] M. Hibbing, “XY and MS microphone techniques in comparison,” Preprint No. 2811, presented at the 86th Audio Engineering Society Convention, March, 1989. [11] W. L. Dooley and R. D. Streicher, “M-S Stereo: A Powerful Technique for Working in Stereo,” J. Audio Eng. Soc., vol. 30, no. 10, pp. 707-718 (1982 Oct.). [12] G. Bore and S. F. Temmer, “M-S Stereophony and Compatibility,” Audio, p. 19 (1958 April).

TdC–68
15. Appendix Sunday, November 21st, 1999 Dear Trevor, It is a relatively simple matter to generate "mathematically correct" polar patterns for the "virtual microphone pair" created with any particular Mid-pattern and Mid-to-Side ratio; these are simply mathematical relationships derived from formula. The difficulty arises, however, whenever one considers "real-world" microphones -- particularly when the polar (frequency and phase) response of the two microphones are not closely matched. Given the variations in response of microphones with respect to polar pattern, the "textbook" patterns shown in the diagrams in our paper no longer represent reality: they may be accurate at a given frequency -- and even then, only in the horizontal plane -- but will rapidly diverge from these patterns as a result of the actual response of the microphones themselves. Remember that the polar pattern of the "virtual" microphones created by the Mid-Side system are a result of combining the polar patterns of the two component microphones. Therefore, any aberrations in their response likewise will be reflected (in combination) in the response of the resulting "virtual pair." With modern high-power computer systems, if the actual polar response of the component microphones is known, the derived polar response also could be described reasonably accurately. Again, if the two component microphones are reasonably well matched (such as with a single-point multi-pattern stereo microphone or two well matched individual mics) this will be less cumbersome than if two dissimilar mics are used to create the M/S pair. As you wisely stated in your original message: "the matrixing of M/S and use of non-stereo pairs seems to imply (in my mind) a more complicated set of circumstances for the final stereo product." I couldn't agree more.
This looks like it will be a fascinating project for you to undertake. Good luck. Best Regards, Ron Streicher Tuesday, Feb 15th, 2000 Dear Neumann Microphones, I was hoping you had detailed polar plot information (throughout a broad spectrum of frequencies) for some of your microphones, the KM100 (including

TdC–69
AK20) series, U87/89, and TLM series in particular. The polar plots themselves (available on your website) are helpful, but even more helpful would be the raw numerical data with which these graphs were produced. If such data is available (decibel attenuation versus angle of incidence for each test frequency), I would hope your corporation would be generous enough to share it with a student of the recording sciences. Sincerely, Trevor de Clercq Master’s Candidate, New York University Wednesday, Feb 16th, 2000 Dear Mr. de Clercq, To our regret we do not have any numerical data of polar patterns you are asking for. We do the measurements needed inside our anechoic chamber and use them directly to put them into our catalogues (after some minor “hand made” corrections due to some shortcomings of the room i.e. reflections from fixing items, from turntable, from the not ideal room size at very low frequencies etc known to us). Be sure that otherwise we would like to help you very much! With best regards, Stephan Peus (Director of Development) Georg Neumann GmbH, Berlin Monday, March 20th, 2000 Hello Mr. Peus, 1) Many of your directional mics (such as the hypercardioid pattern for the SM69) have patterns closer to subcardioid in the lower frequencies (or 8 kHz in the SM69 hypercardioid example). The back lobe of an ideal hypercardioid microphone, of course, has a reverse phase. But with these frequency ranges, no real back lobe exists. Is phase through these frequencies always in phase with zero degrees, or does it flip at a pseudo-back lobe point (such as 225 degrees for 125 Hz on the SM69 hypercardioid)? 2) Conversely, some of your cardioid microphone polar patterns (again the SM69 for example), show almost super or hypercardioid-like patterns in the high frequency ranges. With these frequencies (16 kHz on the SM69 cardioid is a

TdC–70
perfect example), is the back lobe out of phase with zero degrees (like an ideal bidirectional mic) or does the microphone exhibit an in-phase response throughout the pattern (merely minimized at 90 degrees incidence)? Thank you so much for any information you can share, Trevor de Clercq Master's Candidate, New York University Tuesday, March 21st, 2000 Dear Mr. de Clercq, 1) To get a deep notch within any frequency the system has to fulfill two conditions: the two signal portions (from the front and from the rear of the membrane) have to be out of phase as well as have to be of equal or similar ampiltude. In case of the examples cited the amplitude condition failed. Therefor the rear lobe is out of phase though there is no specific deep cancellation (at 225° and 125 Hz for example). 2) Yes, the rear lobe is out of phase, although the capsule is not still working as pressure gradient system at frequencies higher than some 5 kHz. The polar pattern (supercardioide at high frequencies) is caused by bending effects and shadowing effects around the capsule system being there as an obstacle within the sound waves. With best regards, Stephan Peus (Director of Development) Georg Neumann GmbH, Berlin Tuesday, April 4th, 2000 Dear Mr. Peus, 1) You have confirmed that low frequency response on a hypercardioid mic is still reverse phase for the back lobe even if a full deep notch is not achieved. I have noticed dips in response at high frequencies in subcardioid mics (KM 143 at 8 kHz and 16 kHz for angles greater than 150 degrees) and also omni mics (KM 130 at 16 kHz). I have been assuming that phase is consistently positive throughout all angles of incidence for these mics since they are mostly pressure receptors--the dips coming from a mere shadow of the mic body. But the similarity to the hypercardioid low frequency dips, especially in the subcardioid

TdC–71
response, has made me wonder if these dips are implying a reverse phase lobe at higher frequencies for oblique angles of incidence. Is my original assumption that phase is always positive for subcardioid and omni mics correct? 2) You have also confirmed the reverse lobe for the SM69 at 16kHz at angles of incidence greater than 140 degrees. I've noticed that other high frequencies (2 kHz - 8 kHz) for the SM69 cardioid display dips in response but not a full deep cancellation. Am I correct in assuming these rear lobes (again for angles greater than 140 degrees) are similar to hypercardioid low frequencies in that they have a reverse phase but just not a deep notch? With sincere thanks, Trevor de Clercq Master’s Candidate, New York University Wednesday, April 5th, 2000 Dear Mr. de Clercq, 1. Your assunption is right regarding any sound portion coming to the rear side of the membrane. With omni microphones there is no rear entrance for sound. With pressure gradient systems there is no longer any rear entrance for frequencies higher than some 5 kHz. But, for instance, the wavelength of 16 kHz is just 21 mm. Therefore the signal path from behind the microphone to its front side may cause phase rotation more than 360 degrees. 2. Yes, you are right in your assumption. With best regards, Stephan Peus (Director of Development) Georg Neumann GmbH, Berlin

TdC–72
MATLAB FUNCTION: DECTOSEN function [outp] = dectosen(inp) % function dectosen :converts decibel data to sensitivity data % % input arguments : inp =matrix of decibel data % % output arguments : outp=matrix of sensitivity data % % history : Trevor de Clercq, 3/18/00 % Tonmeister Master's Thesis, New York University % find length (amount of test angles) and width (amount of test frequencies) rowcol=size(inp); wid=rowcol(1); leng=rowcol(2); % initialize temp and output matrixes inpab=zeros(wid,leng); inpdec=zeros(wid,leng); outp=zeros(wid,leng); negtemp=zeros(wid,leng); outpab=zeros(wid,leng); % find and save negative values for after conversion for a=1:wid for b=1:leng if inp(a,b) < 0 negtemp(a,b) = -1; else negtemp(a,b) = 1; end end end % convert zero to one range plotting to decibels for i=1:wid for h=1:leng inpab(i,h) = abs(inp(i,h)); if inpab(i,h) == 0 inpdec(i,h) = 1;

TdC–73
else if inpab(i,h) > 0.2 inpdec(i,h) = 25*inpab(i,h) - 25; else inpdec(i,h) = 20*(log10(5*inpab(i,h))) - 20; end end end end % convert decibels to sensitivities for j=1:wid for k=1:leng if inpdec(j,k) == 1 outpab(j,k) = 0; else outpab(j,k) = 10^(inpdec(j,k)/20); end end end % add back negative phase signs for c=1:wid for d=1:leng if negtemp(c,d) < 0 outp(c,d) = -1*outpab(c,d); else outp(c,d) = outpab(c,d); end end end MATLAB FUNCTION: DEVIATION function[deve]=deviation(id,dev) % function deviation : finds the average difference between two % input matrixes % % input arguments :id =matrix of data % % dev =second matrix of data % % output arguments :deve=average difference for two input matrixes %

TdC–74
% history :Trevor de Clercq, 4/29/00 % Tonmeister Mater's Thesis, New York University % convert inputs to absolute values ideal=abs(id); deviant=abs(dev); % find length and width of input matrix rowcol = size(ideal); wid = rowcol(1); leng = rowcol(2); % create matrix of absolute differences totaldif=ideal-deviant; abstotdif=abs(totaldif); % initialize average numerator avenum = 0; % add all elements for matrix of absolute differences for i=1:wid for j=1:leng avenum=avenum + abstotdif(i,j); end end % find average denomenator aveden = wid * leng; % calculate average difference deve = avenum / aveden; MATLAB FUNCTION: POLARPLOT360 function[ ]=polarplot360(level,ptitle) % function polarplot: accepts raw data describing the directivity of a % specific microphone for a variety of test % frequencies and plots data on polar graph % % input arguments: level =an array containing the decibel level of
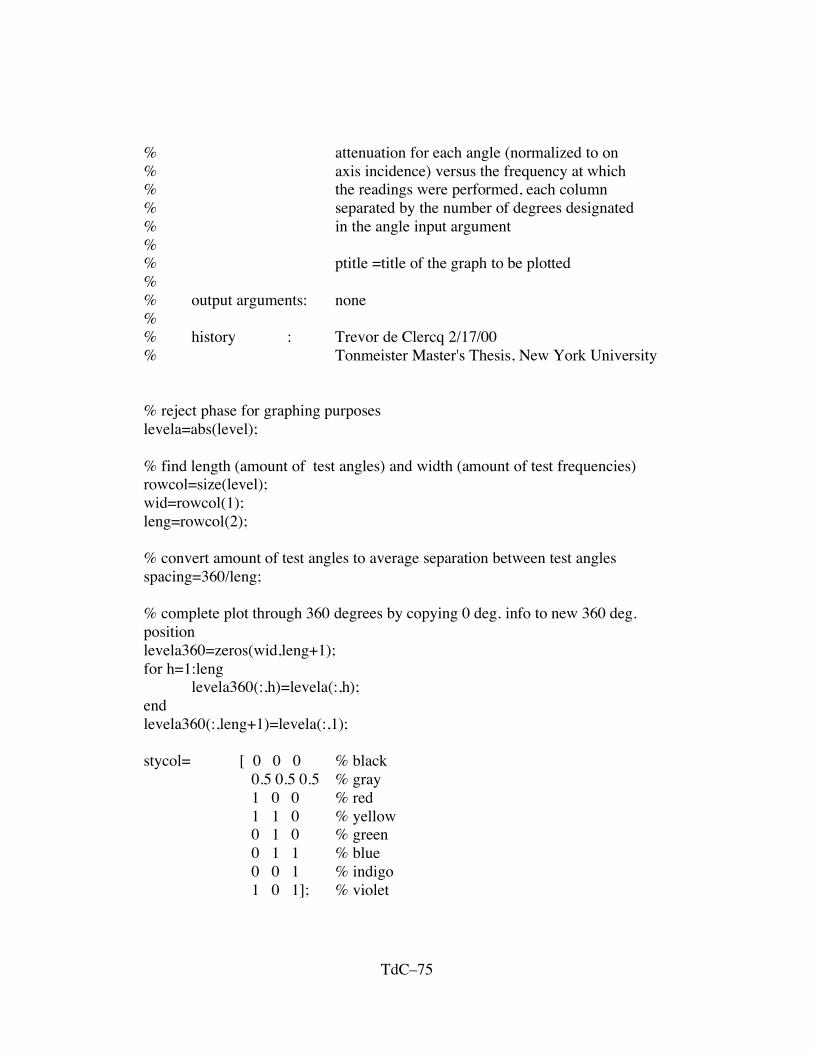
TdC–75
% attenuation for each angle (normalized to on % axis incidence) versus the frequency at which % the readings were performed, each column % separated by the number of degrees designated % in the angle input argument % % ptitle =title of the graph to be plotted % % output arguments: none % % history : Trevor de Clercq 2/17/00 % Tonmeister Master's Thesis, New York University % reject phase for graphing purposes levela=abs(level); % find length (amount of test angles) and width (amount of test frequencies) rowcol=size(level); wid=rowcol(1); leng=rowcol(2); % convert amount of test angles to average separation between test angles spacing=360/leng; % complete plot through 360 degrees by copying 0 deg. info to new 360 deg. position levela360=zeros(wid,leng+1); for h=1:leng levela360(:,h)=levela(:,h); end levela360(:,leng+1)=levela(:,1); stycol= [ 0 0 0 % black 0.5 0.5 0.5 % gray 1 0 0 % red 1 1 0 % yellow 0 1 0 % green 0 1 1 % blue 0 0 1 % indigo 1 0 1]; % violet

TdC–76
% convert degrees to radians spacer=(2*pi*spacing/360); % make array of angles for polar function t=0:spacer:2*pi; % initialize polar plot for multiple graphs revpolar(0,0); hold on; % plot polar graph of input data for i=1:wid revpolar(t,levela360(i,:),stycol(i,:)); end %title('Dif (30/70) : AK20 bidir / AK20 bidir'); title(ptitle); % fits six polar patterns with separate titles on one page set(gcf,'Position',[100 100 195 195],'PaperPositionMode','auto'); % fits two polar patterns with separate titles on one page % set(gcf,'Position',[100 100 320 320],'PaperPositionMode','auto'); % rotates graph to put zero degrees at "north" set(gca,'View',[-270 -90]); % annotates decibel levels on graph text(1,0,'0'); text(0.8,0,'-5'); text(0.6,0,'-10'); text(0.4,0,'-15dB'); text(0.2,0,'-20'); MATLAB FUNCTION: REVPOLAR function hpol = polar(theta,rho,line_style) % POLAR Polar coordinate plot. % POLAR(THETA, RHO) makes a plot using polar coordinates of % the angle THETA, in radians, versus the radius RHO. % POLAR(THETA,RHO,S) uses the linestyle specified in string S.

TdC–77
% See PLOT for a description of legal linestyles. % % See also PLOT, LOGLOG, SEMILOGX, SEMILOGY. % Copyright (c) 1984-98 by The MathWorks, Inc. % $Revision: 5.15 $ $Date: 1997/11/21 23:33:09 $ % $REVISION by Trevor de Clercq 3/00 denoted by % *** if nargin < 1 error('Requires 2 or 3 input arguments.') elseif nargin == 2 if isstr(rho) line_style = rho; rho = theta; [mr,nr] = size(rho); if mr == 1 theta = 1:nr; else th = (1:mr)'; theta = th(:,ones(1,nr)); end else line_style = 'auto'; end elseif nargin == 1 line_style = 'auto'; rho = theta; [mr,nr] = size(rho); if mr == 1 theta = 1:nr; else th = (1:mr)'; theta = th(:,ones(1,nr)); end end if isstr(theta) | isstr(rho) error('Input arguments must be numeric.'); end if ~isequal(size(theta),size(rho)) error('THETA and RHO must be the same size.'); end

TdC–78
% get hold state cax = newplot; next = lower(get(cax,'NextPlot')); hold_state = ishold; % get x-axis text color so grid is in same color tc = get(cax,'xcolor'); ls = get(cax,'gridlinestyle'); % Hold on to current Text defaults, reset them to the % Axes' font attributes so tick marks use them. fAngle = get(cax, 'DefaultTextFontAngle'); fName = get(cax, 'DefaultTextFontName'); fSize = get(cax, 'DefaultTextFontSize'); fWeight = get(cax, 'DefaultTextFontWeight'); fUnits = get(cax, 'DefaultTextUnits'); set(cax, 'DefaultTextFontAngle', get(cax, 'FontAngle'), ... 'DefaultTextFontName', get(cax, 'FontName'), ... 'DefaultTextFontSize', get(cax, 'FontSize'), ... 'DefaultTextFontWeight', get(cax, 'FontWeight'), ... 'DefaultTextUnits','data') % only do grids if hold is off if ~hold_state % make a radial grid hold on; maxrho = max(abs(rho(:))); hhh=plot([-maxrho -maxrho maxrho maxrho],[-maxrho maxrho maxrho -maxrho]); axis image; v = [get(cax,'xlim') get(cax,'ylim')]; ticks = sum(get(cax,'ytick')>=0); delete(hhh); % check radial limits and ticks rmin = 0; rmax = v(4); rticks = max(ticks-1,2); if rticks > 5 % see if we can reduce the number if rem(rticks,2) == 0 rticks = rticks/2; elseif rem(rticks,3) == 0 rticks = rticks/3; end

TdC–79
end % define a circle th = 0:pi/50:2*pi; xunit = cos(th); yunit = sin(th); % now really force points on x/y axes to lie on them exactly inds = 1:(length(th)-1)/4:length(th); xunit(inds(2:2:4)) = zeros(2,1); yunit(inds(1:2:5)) = zeros(3,1); % plot background if necessary if ~isstr(get(cax,'color')), patch('xdata',xunit*rmax,'ydata',yunit*rmax, ... 'edgecolor',tc,'facecolor',get(gca,'color')); end % draw radial circles c82 = cos(82*pi/180); s82 = sin(82*pi/180); rinc = (rmax-rmin)/rticks; for i=(rmin+rinc):rinc:rmax hhh = plot(xunit*i,yunit*i,ls,'color',tc,'linewidth',1); % *** text((i+rinc/20)*c82,(i+rinc/20)*s82, ... % *** [' ' num2str(i)],'verticalalignment','bottom') end set(hhh,'linestyle','-') % Make outer circle solid % plot spokes th = (1:6)*2*pi/12; cst = cos(th); snt = sin(th); cs = [-cst; cst]; sn = [-snt; snt]; plot(rmax*cs,rmax*sn,ls,'color',tc,'linewidth',1) % annotate spokes in degrees rt = 1.1*rmax; for i = 1:length(th) text(rt*cst(i),rt*snt(i),int2str(i*30),'horizontalalignment','center') if i == length(th) loc = int2str(0); else loc = int2str(180+i*30);

TdC–80
end if i ~= length(th) % *** addition by TdC text(-rt*cst(i),-rt*snt(i),loc,'horizontalalignment','center') end end % set view to 2-D view(2); % set axis limits axis(rmax*[-1 1 -1.15 1.15]); end % Reset defaults. set(cax, 'DefaultTextFontAngle', fAngle , ... 'DefaultTextFontName', fName , ... 'DefaultTextFontSize', fSize, ... 'DefaultTextFontWeight', fWeight, ... 'DefaultTextUnits',fUnits ); % transform data to Cartesian coordinates. xx = rho.*cos(theta); yy = rho.*sin(theta); % plot data on top of grid if strcmp(line_style,'auto') q = plot(xx,yy); else q = plot(xx,yy,'Color',line_style,'LineWidth',1); % *** addition by TdC end if nargout > 0 hpol = q; end if ~hold_state axis image; axis off; set(cax,'NextPlot',next); end set(get(gca,'xlabel'),'visible','on') set(get(gca,'ylabel'),'visible','on') MATLAB FUNCTION: SENTODEC function [outp] = sentodec(inp)

TdC–81
% % function sentodec: converts sensitivity data to decibel data % % input arguments : inp =matrix of sensitivity data % % output arguments: outp=matrix of decibel data % % history : Trevor de Clercq 3/18/00 % Tonmeister Master's Thesis, New York University % find length (amount of test angles) and width (amount of test frequencies) rowcol=size(inp); wid=rowcol(1); leng=rowcol(2); % initialize temp and outp matrixes inpdec=zeros(wid,leng); outpab=zeros(wid,leng); outp=zeros(wid,leng); negtemp=zeros(wid,leng); % find and save negative values for after conversion for a=1:wid for b=1:leng if inp(a,b) < 0 negtemp(a,b) = -1; else negtemp(a,b) = 1; end end end % convert sensitivities to decibels for i=1:wid for h=1:leng % protect from log of zero (negative infinity) if inp(i,h) == 0 % set log of zero to "dummy" input of one inpdec(i,h)=1; % protect against log of negatives to exclude imagninary nums else inpdec(i,h) = 20*log10(abs(inp(i,h)));

TdC–82
end end end % convert decibels to range of zero to one for plotting purposes for j=1:wid for k=1:leng % revert "dummy" input from log of zero to zero on graph if inpdec(j,k) == 1 outpab(j,k) = 0; % convert decibels to logarthmically scaled graph else if inpdec(j,k) > -20 outpab(j,k) = inpdec(j,k)/25 + 1; % scale bottom 0.2 range of graph to include all below -20 dB else outpab(j,k) = (10^((inpdec(j,k)/20)+1))*0.2; end end end end % add back negative phase signs for c=1:wid for d=1:leng if negtemp(c,d) < 0 outp(c,d) = -1*outpab(c,d); else outp(c,d) = outpab(c,d); end end end MATLAB FUNCTION: SUMDIF function [leftnormdec,rightnormdec]=sumdif(mid,side,percent,sd) % function sumdif : calculates the sum (left) or difference (right) of % a set of mid and side microphones at some % matrix percentage % % input arguments : mid =matrix of data for the mid microphone % with each row representing a different % test frequency and each column representing

TdC–83
% a different angle of incidence % % side =matrix of data for the side microphone % with each row representing a different % test frequency and each column representing % a different angle of incidence % % percent=the matrix percentage of mid versus side % microphone which gives left/right output % % sd =indentifies whether the input data is % in sensitivity form or decibel form % % output arguments: leftnormdec =the left channel after sum/difference % M/S, normalized so that the largest % value is one and in decibel form % % rightnormdec=the right channel after sum/difference % M/S, normalized so that the largest % value is one and in decibel form % % history : Trevor de Clercq, 3/19/00 % Tonmeister Master's Thesis, New York University cent=percent/100; clf; % convert decibel data to sensitivity for sum/dif if sd=='d' midsen=dectosen(mid); sidesen=dectosen(side); else midsen=mid; sidesen=side; end % initialize arrays to hold 360 degree information rowcol=size(midsen); leng=rowcol(2); fleng=leng*2-2; mid360=zeros(rowcol(1),fleng);

TdC–84
side360=mid360; % transfer 180 degree array to first half of 360 array for h=1:leng mid360(:,h)=midsen(:,h); side360(:,h)=sidesen(:,h); end % transfer mirror image of 180 degree array to fill rest of 360 array for i=1:(leng-2) mid360(:,leng+i)=midsen(:,leng-i); side360(:,leng+i)=sidesen(:,leng-i); end % rotate side by -90 degrees through shifting array members sidetemp=side360; for j=1:fleng/4 side360(:,3*fleng/4+j)=sidetemp(:,j); end for k=1:3*fleng/4 side360(:,k)=sidetemp(:,fleng/4+k); end % matrix mid and side to get left and right signals left=cent*mid360+(1-cent)*side360; right=cent*mid360-(1-cent)*side360; % normalize graph for largest value to equal zero decibels zerodbleft=max(max(left)); zerodbright=max(max(right)); leftnorm=left/zerodbleft; rightnorm=right/zerodbright; % convert sensitivity data to decibel for plotting leftnormdec=sentodec(leftnorm); rightnormdec=sentodec(rightnorm); MATLAB FUNCTION: SUMDIFDEV

TdC–85
function [devmatrix]=sumdifdev(neumid,neuside,idmid,idside,percent) % function sumdifdev: finds difference of sum and difference % between M/S pair A and M/S pair B % % input arguments : neumid =mid mic for M/S pair A % % neuside =side mic for M/S pair A % % idmid =mid mic for M/S pair B % % idside =side mic for M/S pair B % % percent =percent of mid to side for matrix % % output arguments: matrix of deviations of M/S pair A from % M/S pair B % % history : Trevor de Clercq, 4/29/00 % Tonmeister Master's Thesis, New York University % put input mid and side microphones through matrix for sum/dif [leftneu,rightneu]=sumdif(neumid,neuside,percent,'d'); [leftid,rightid]=sumdif(idmid,idside,percent,'d'); % convert decibels to sensitivities to find differences neusen=dectosen(leftneu); idsen=dectosen(leftid); % find length and width of input matrix rowcol = size(neumid); wid = rowcol(1); leng = rowcol(2); % intialize output matrix totwid=wid + 1; devs=zeros(totwid,1); % find differences for each test frequency for i=1:wid devs(i)=deviation(neusen(i,:),idsen(i,:));

TdC–86
end % find total differences devs(totwid)=deviation(neusen,idsen); % associate output variable with temp variable devmatrix=devs; MATLAB FUNCTION: SUMDIFPLOT function sumdifplot(mid,side,percent,lr,ptitle,sd) % function sumdifplot: plots the sum (left) or difference (right) of % a set of mid and side microphones at some % matrix percentage % % input arguments : mid =matrix of data for the mid microphone % with each row representing a different % test frequency and each column representing % a different angle of incidence % % side =matrix of data for the side microphone % with each row representing a different % test frequency and each column representing % a different angle of incidence % % percent=the matrix percentage of mid versus side % microphone which gives left/right output % % lr =chooses to graph either left or right % % ptitle =the title for the plot % % sd =indentifies whether the input data is % in sensitivity form or decibel form % % history : Trevor de Clercq, 4/3/00 % Tonmeister Master's Thesis, New York University % sends input to sumdif and gets both left and right matrix [left,right]=sumdif(mid,side,percent,sd);

TdC–87
% choose plot of sum or difference if lr=='l' polarplot360(left,ptitle); else polarplot360(right,ptitle); end

TdC–88
KM130 =[1.0000 1.0000 1.0000 1.0000 1.0000 1.0000 1.0000 1.0000 1.0000 1.0000 1.0000 1.0037 1.0026 1.0014 1.0074 1.0074 1.0115 1.0082 1.0074
1.0000 1.0000 1.0000 1.0000 1.0000 1.0000 1.0000 1.0000 1.0000 1.0000 1.0000 1.0037 1.0026 1.0014 1.0074 1.0074 1.0115 1.0082 1.0074 1.0000 1.0000 1.0000 1.0000 1.0000 1.0000 1.0000 1.0000 1.0000 1.0000 1.0000 1.0037 1.0026 1.0014 1.0074 1.0074 1.0115 1.0082 1.0074
1.0000 1.0000 1.0000 1.0000 1.0000 1.0000 1.0000 1.0000 1.0000 1.0000 1.0000 1.0037 1.0026 1.0014 1.0074 1.0074 1.0115 1.0082 1.0074 1.0000 1.0010 1.0001 0.9850 0.9810 0.9866 0.9850 0.9794 0.9779 0.9779 0.9852 0.9699 0.9749 0.9763 0.9707 0.9686 0.9699 0.9635 0.9632
1.0000 0.9938 1.0001 0.9850 0.9763 0.9603 0.9521 0.9304 0.9188 0.9044 0.8958 0.8839 0.8728 0.8614 0.8662 0.8564 0.8607 0.8583 0.8529 1.0000 0.9852 0.9863 0.9749 0.9603 0.9396 0.9157 0.8839 0.8510 0.8162 0.7991 0.7676 0.7479 0.7410 0.7306 0.7378 0.7350 0.7399 0.7353
1.0000 0.9707 0.9398 0.8993 0.8454 0.7776 0.7050 0.6351 0.5524 0.4779 0.4255 0.6616 0.3393 0.3182 0.2768 0.2535 0.2978 0.3578 0.3750]
KM143 =[1.0000 0.9925 0.9844 0.9728 0.9641 0.9536 0.9396 0.9137 0.8944 0.8731 0.8257 0.7861 0.7488 0.7204 0.6727 0.6387 0.6114 0.5914 0.5821 1.0000 0.9925 0.9844 0.9728 0.9641 0.9536 0.9396 0.9041 0.8784 0.8731 0.8417 0.7931 0.7757 0.7415 0.7099 0.6887 0.6682 0.6588 0.6567
1.0000 0.9925 0.9844 0.9728 0.9641 0.9536 0.9396 0.9041 0.8784 0.8731 0.8417 0.7931 0.7757 0.7415 0.7099 0.6887 0.6682 0.6588 0.6567 1.0000 0.9925 0.9844 0.9728 0.9641 0.9536 0.9396 0.9041 0.8784 0.8731 0.8417 0.7931 0.7757 0.7415 0.7099 0.6887 0.6682 0.6588 0.6567
1.0000 0.9999 0.9914 0.9831 0.9746 0.9431 0.9293 0.9041 0.8784 0.8433 0.8257 0.7861 0.7590 0.7310 0.7099 0.6989 0.6822 0.6797 0.6791 1.0000 0.9999 0.9844 0.9728 0.9536 0.9269 0.8960 0.8569 0.8184 0.7985 0.7349 0.6822 0.6451 0.6144 0.5934 0.5684 0.5547 0.5459 0.5448
1.0000 0.9925 0.9844 0.9663 0.9431 0.9163 0.8793 0.8499 0.8110 0.7612 0.7275 0.6587 0.5684 0.4768 0.3975 0.3443 0.3896 0.4466 0.4701 1.0000 0.9778 0.9302 0.8692 0.7893 0.7204 0.6655 0.6114 0.5607 0.5075 0.4393 0.3966 0.3443 0.2542 0.2064 0.2073 0.2787 0.3484 0.3731]
KM140 =[1.0000 0.9936 0.9791 0.9615 0.9430 0.9066 0.8764 0.8382 0.7933 0.7445 0.6960 0.6374 0.5822 0.5336 0.4664 0.4219 0.3879 0.3480 0.3358
1.0000 0.9936 0.9791 0.9615 0.9430 0.9169 0.8864 0.8544 0.8004 0.7445 0.6888 0.6211 0.5396 0.4458 0.3523 0.2617 0.1709 0.0673 0 1.0000 0.9936 0.9791 0.9615 0.9430 0.9169 0.8864 0.8544 0.8004 0.7445 0.6888 0.6211 0.5396 0.4458 0.3523 0.2617 0.1709 0.0673 0
1.0000 0.9936 0.9791 0.9615 0.9430 0.9169 0.8864 0.8544 0.8004 0.7445 0.6888 0.6211 0.5396 0.4458 0.3523 0.2617 0.1709 0.0673 0 1.0000 0.9936 0.9860 0.9615 0.9430 0.9066 0.8601 0.8151 0.7632 0.7007 0.6300 0.5519 0.4545 0.3626 0.2747 0.1766 0.0786 0.0444 0
1.0000 0.9936 0.9860 0.9615 0.9430 0.9066 0.8601 0.8151 0.7632 0.7007 0.6300 0.5519 0.4545 0.3626 0.2747 0.1766 0.0786 0.0444 0 1.0000 1.0009 0.9928 0.9842 0.9692 0.9327 0.9027 0.8544 0.8076 0.7518 0.6888 0.6211 0.5134 0.3991 0.2850 0.1766 0.2170 0.2592 0.2993
1.0000 0.9780 0.9329 0.8601 0.7823 0.7150 0.6573 0.5980 0.5112 0.4599 0.3996 0.3255 0.2942 0.2383 0.1710 0.2354 0.2239 0.2220 0.2774]
KM150 =[1.0000 0.9936 0.9791 0.9615 0.9327 0.8963 0.8601 0.7920 0.7188 0.6131 0.4740 0.2332 0 -0.0776 -0.3991 -0.5070 -0.5750 -0.6156 -0.6204 1.0000 0.9853 0.9628 0.9452 0.9224 0.8757 0.8339 0.7851 0.7045 0.6058 0.4524 0.1939 0 -0.0570 -0.2850 -0.4382 -0.5126 -0.5556 -0.5693
1.0000 0.9936 0.9697 0.9515 0.9224 0.8860 0.8438 0.7851 0.7116 0.6058 0.4596 0.2332 0 -0.0879 -0.3159 -0.4545 -0.5288 -0.5556 -0.5693 1.0000 0.9936 0.9697 0.9515 0.9224 0.8860 0.8438 0.7851 0.7116 0.6058 0.4596 0.2332 0 -0.0879 -0.3159 -0.4545 -0.5288 -0.5556 -0.5693
1.0000 0.9853 0.9723 0.9452 0.9224 0.8757 0.8339 0.7620 0.7045 0.6131 0.4969 0.2794 0.0851 -0.1758 -0.3729 -0.4807 -0.5426 -0.5785 -0.5839 1.0000 0.9865 0.9697 0.9452 0.9121 0.8757 0.8339 0.7620 0.7045 0.6131 0.4969 0.2726 0.0851 -0.0570 -0.3365 -0.4907 -0.5357 -0.5785 -0.5839
1.0000 0.9708 0.9628 0.9353 0.9121 0.8757 0.8175 0.7527 0.6888 0.6058 0.4596 0.2332 0.0588 0 -0.0673 -0.1928 -0.2495 -0.2592 -0.2701 1.0000 0.9924 0.9860 0.9678 0.9533 0.9121 0.8501 0.7988 0.7116 0.6204 0.5184 0.3580 0.2191 0 -0.3523 -0.5233 -0.5126 -0.6156 -0.6861]
AK20 =[1.0000 1.0011 0.9723 0.9353 0.8860 0.7981 0.6836 0.4896 0.2592 0 -0.2592 -0.4896 -0.6836 -0.7981 -0.8860 -0.9353 -0.9723 -0.9865 -1.0000
1.0000 1.0011 0.9723 0.9353 0.8860 0.7981 0.6836 0.4896 0.2592 0 -0.2592 -0.4896 -0.6836 -0.7981 -0.8860 -0.9353 -0.9723 -0.9865 -1.0000 1.0000 1.0011 0.9723 0.9353 0.8860 0.7981 0.6836 0.4896 0.2592 0 -0.2592 -0.4896 -0.6836 -0.7981 -0.8860 -0.9353 -0.9723 -0.9865 -1.0000
1.0000 1.0011 0.9723 0.9353 0.8860 0.7981 0.6836 0.4896 0.2592 0 -0.2592 -0.4896 -0.6836 -0.7981 -0.8860 -0.9353 -0.9723 -0.9865 -1.0000 1.0000 0.9936 0.9791 0.9452 0.9066 0.8187 0.6999 0.5126 0.2892 0 -0.2892 -0.5126 -0.6999 -0.8187 -0.9066 -0.9452 -0.9791 -0.9936 -1.0000
1.0000 0.9936 0.9791 0.9452 0.9066 0.8187 0.6999 0.5126 0.2892 0 -0.2892 -0.5126 -0.6999 -0.8187 -0.9066 -0.9452 -0.9791 -0.9936 -1.0000 1.0000 0.9865 0.9723 0.9289 0.8654 0.7720 0.6310 0.4203 0.1260 0 -0.1260 -0.4203 -0.6310 -0.7720 -0.8654 -0.9289 -0.9723 -0.9865 -1.0000
1.0000 0.9780 0.9167 0.7587 0.6271 0.6009 0.5985 0.4964 0.2892 0 -0.2892 -0.4964 -0.5985 -0.6009 -0.6271 -0.7587 -0.9167 -0.9780 -1.0000]
U89omni =[1.0000 1.0000 1.0000 1.0000 1.0000 1.0000 1.0000 1.0000 1.0000 1.0000 1.0000 1.0000 1.0000 1.0000 1.0000 1.0000 1.0000 1.0000 1.0000 1.0000 1.0000 1.0000 1.0000 1.0000 1.0000 1.0000 1.0000 1.0000 1.0000 1.0000 1.0000 1.0000 1.0000 1.0000 1.0000 1.0000 1.0000 1.0000
1.0000 1.0000 1.0000 1.0000 1.0000 1.0000 1.0000 1.0000 1.0000 1.0000 1.0000 1.0000 1.0000 1.0000 1.0000 1.0000 1.0000 1.0000 1.0000 1.0000 1.0000 1.0000 1.0000 1.0000 1.0000 1.0000 1.0000 1.0000 1.0000 1.0000 1.0000 1.0000 1.0000 1.0000 1.0000 1.0000 1.0000 1.0000
1.0000 0.9936 1.0021 1.0160 1.0000 1.0000 1.0104 1.0090 1.0153 1.0146 1.0153 1.0090 1.0104 1.0000 1.0000 0.9941 1.0021 0.9936 1.0000 1.0000 1.0073 1.0090 1.0104 1.0206 1.0467 1.0529 1.0577 1.0668 1.0730 1.0668 1.0577 1.0529 1.0467 1.0206 1.0104 1.0090 1.0080 1.0000

TdC–89
1.0000 1.0073 1.0090 1.0104 1.0206 1.0467 1.0529 1.0577 1.0668 1.0730 1.0668 1.0577 1.0529 1.0467 1.0206 1.0104 1.0090 1.0080 1.0000 1.0000 0.9780 0.9167 0.8175 0.6580 0.4972 0.3368 0.2401 0.2220 0.2190 0.2220 0.2401 0.3368 0.4972 0.6580 0.8175 0.9167 0.9780 1.0000]
U89sub =[1.0000 0.9938 0.9862 0.9585 0.9396 0.9188 0.9093 0.8933 0.8812 0.8676 0.8583 0.8538 0.8400 0.8247 0.7984 0.7807 0.7582 0.7471 0.7353 1.0000 0.9938 0.9862 0.9585 0.9396 0.9188 0.9093 0.8933 0.8812 0.8676 0.8583 0.8538 0.8400 0.8247 0.7984 0.7807 0.7582 0.7471 0.7353
1.0000 0.9852 0.9794 0.9585 0.9396 0.9132 0.8993 0.8770 0.8438 0.8235 0.7991 0.7815 0.7643 0.7465 0.7306 0.7050 0.6885 0.6794 0.6765 1.0000 0.9779 0.9699 0.9521 0.9396 0.9132 0.8829 0.8676 0.8365 0.8015 0.7688 0.7350 0.7050 0.6835 0.6628 0.6457 0.6257 0.6201 0.6176
1.0000 1.0010 1.0026 1.0014 0.9970 0.9970 1.0014 0.9862 0.9635 0.9412 0.9115 0.8770 0.8400 0.8143 0.7880 0.7543 0.7350 0.7241 0.7132 1.0000 1.0010 1.0026 1.0014 0.9970 0.9970 0.9850 0.9699 0.9550 0.9338 0.9115 0.8770 0.8400 0.7984 0.7410 0.7050 0.6490 0.6274 0.6250
1.0000 1.0010 1.0095 1.0014 1.0074 1.0177 1.0178 1.0328 1.0457 1.0368 1.0082 0.9630 0.8929 0.7984 0.6732 0.5865 0.5396 0.5597 0.5662 1.0000 0.9779 0.9304 0.8500 0.7306 0.5950 0.4414 0.3210 0.2091 0.1618 0.1572 0.1721 0.1879 0.2504 0.3446 0.4414 0.5164 0.5754 0.5882]
U89card =[1.0000 0.9936 0.9860 0.9615 0.9430 0.8963 0.8764 0.8544 0.8233 0.8029 0.7776 0.7527 0.7324 0.6944 0.6374 0.5822 0.5357 0.4969 0.4745
1.0000 0.9936 0.9791 0.9515 0.9327 0.8963 0.8664 0.8312 0.7933 0.7664 0.7345 0.7066 0.6673 0.6215 0.5804 0.5233 0.4734 0.4453 0.4307 1.0000 0.9853 0.9723 0.9515 0.9327 0.8860 0.8664 0.8312 0.7933 0.7518 0.6973 0.6511 0.5985 0.5336 0.4766 0.4056 0.3255 0.2892 0.2555
1.0000 0.9853 0.9697 0.9452 0.9224 0.8860 0.8501 0.8082 0.7561 0.7007 0.6444 0.5750 0.5070 0.4196 0.3420 0.2617 0.1709 0.0888 0 1.0000 1.0009 1.0021 0.9941 0.9897 0.9739 0.9615 0.9329 0.8893 0.8467 0.7789 0.7066 0.6310 0.5234 0.4093 0.2780 0.1709 0.0219 0
1.0000 0.9936 0.9860 0.9678 0.9636 0.9430 0.9289 0.9005 0.8748 0.8467 0.8076 0.7458 0.6836 0.6112 0.5542 0.5296 0.5195 0.5341 0.5401 1.0000 0.9936 0.9860 0.9678 0.9636 0.9739 0.9678 0.9628 0.9408 0.9124 0.8520 0.7458 0.5722 0.2953 0 -0.2942 -0.4109 -0.4740 -0.4745
1.0000 0.9865 0.9466 0.8927 0.7926 0.6944 0.5822 0.4502 0.2892 0 -0.0073 -0.0231 -0.0425 -0.1140 -0.2747 -0.2780 -0.1709 -0.0444 0]
U89hyp =[1.0000 0.9936 0.9723 0.9452 0.9121 0.8757 0.8339 0.7851 0.7417 0.7007 0.6516 0.5912 0.4971 0.3420 0 -0.0588 -0.2956 -0.4368 -0.4745 1.0000 0.9936 0.9723 0.9452 0.9121 0.8757 0.8339 0.7851 0.7417 0.7080 0.6816 0.6280 0.5396 0.3991 0 -0.0588 -0.3810 -0.5040 -0.5474
1.0000 0.9865 0.9628 0.9353 0.9066 0.8599 0.8175 0.7689 0.7116 0.6496 0.5556 0.4272 0.2780 0.0570 -0.1243 -0.3956 -0.5288 -0.5856 -0.6058 1.0000 0.9780 0.9628 0.9289 0.8963 0.8496 0.8175 0.7458 0.6672 0.5620 0.3852 0.1709 0 -0.2383 -0.4664 -0.5822 -0.6442 -0.6888 -0.7080
1.0000 0.9780 0.9697 0.9452 0.9224 0.8757 0.8339 0.7758 0.7260 0.6569 0.5628 0.4272 0.2517 0 -0.1140 -0.3793 -0.4896 -0.5484 -0.5620 1.0000 0.9780 0.9628 0.9353 0.9066 0.8757 0.8438 0.7988 0.7488 0.6496 0.5628 0.4896 -0.4971 -0.5701 -0.6271 -0.6736 -0.6904 -0.7045 -0.7007
1.0000 0.9780 0.9560 0.9353 0.9066 0.8757 0.8501 0.8151 0.7704 0.7153 0.6601 0.5912 0.5134 0.4766 -0.5131 -0.5822 -0.6604 -0.6960 -0.7007 1.0000 0.9780 0.9329 0.8601 0.7720 0.6477 0.5233 0.3810 0.2148 0 -0.0516 -0.1478 -0.3042 -0.4561 -0.5439 -0.5985 -0.6374 -0.6444 -0.6496]
U89bidir =[1.0000 0.9936 0.9628 0.9353 0.8860 0.7981 0.6836 0.4734 0.2592 0 -0.2592 -0.4734 -0.6836 -0.7981 -0.8860 -0.9353 -0.9628 -0.9936 -1.0000
1.0000 0.9936 0.9628 0.9353 0.8860 0.7981 0.6836 0.4734 0.2592 0 -0.2592 -0.4734 -0.6836 -0.7981 -0.8860 -0.9353 -0.9628 -0.9936 -1.0000 1.0000 0.9936 0.9628 0.9353 0.8860 0.7981 0.6836 0.4734 0.2592 0 -0.2592 -0.4734 -0.6836 -0.7981 -0.8860 -0.9353 -0.9628 -0.9936 -1.0000
1.0000 0.9936 0.9628 0.9353 0.8860 0.7981 0.6836 0.4734 0.2592 0 -0.2592 -0.4734 -0.6836 -0.7981 -0.8860 -0.9353 -0.9628 -0.9936 -1.0000 1.0000 0.9936 0.9723 0.9353 0.8757 0.7823 0.6573 0.4272 0.1260 0 -0.1260 -0.4272 -0.6573 -0.7823 -0.8757 -0.9353 -0.9723 -0.9936 -1.0000
1.0000 0.9936 0.9723 0.9353 0.8757 0.7823 0.6573 0.4272 0.1260 0 -0.1260 -0.4272 -0.6573 -0.7823 -0.8757 -0.9353 -0.9723 -0.9936 -1.0000 1.0000 0.9936 0.9723 0.9353 0.8757 0.7823 0.6573 0.4272 0.1260 0 -0.1260 -0.4272 -0.6573 -0.7823 -0.8757 -0.9353 -0.9723 -0.9936 -1.0000
1.0000 0.9865 0.9491 0.8927 0.8084 0.6841 0.5396 0.3418 0.0888 0 -0.0888 -0.3418 -0.5396 -0.6841 -0.8084 -0.8927 -0.9491 -0.9865 -1.0000]
SM69omni=[1.0000 1.0000 1.0000 1.0000 1.0000 1.0000 1.0000 1.0000 1.0000 1.0000 1.0000 1.0000 1.0000 1.0000 1.0000 1.0000 1.0000 1.0000 1.0000 1.0000 1.0000 1.0000 1.0000 1.0000 1.0000 1.0000 1.0000 1.0000 1.0000 1.0000 1.0000 1.0000 1.0000 1.0000 1.0000 1.0000 1.0000 1.0000
1.0000 1.0000 1.0000 1.0000 1.0000 1.0000 1.0000 1.0000 1.0000 1.0000 1.0000 1.0000 1.0000 1.0000 1.0000 1.0000 1.0000 1.0000 1.0000 1.0000 1.0000 1.0000 1.0000 1.0000 1.0000 1.0000 1.0000 1.0000 1.0000 1.0000 1.0000 1.0000 1.0000 1.0000 1.0000 1.0000 1.0000 1.0000
1.0000 0.9938 0.9932 1.0014 1.0074 1.0074 1.0178 1.0259 1.0299 1.0441 1.0299 1.0259 1.0178 1.0074 1.0074 1.0014 0.9932 0.9938 1.0000 1.0000 1.0082 1.0164 1.0279 1.0385 1.0648 1.0707 1.0793 1.0976 1.0956 1.0976 1.0793 1.0707 1.0648 1.0385 1.0279 1.0164 1.0082 1.0000
1.0000 0.9852 0.9467 0.9157 0.8821 0.8821 0.9421 0.9862 1.0299 1.0368 1.0299 0.9862 0.9421 0.8821 0.8821 0.9157 0.9467 0.9852 1.0000 1.0000 0.9779 0.9235 0.8235 0.6835 0.5272 0.3821 0.2978 0.2986 0.3015 0.2986 0.2978 0.3821 0.5272 0.6835 0.8235 0.9235 0.9779 1.0000]
SM69sub =[1.0000 0.9938 0.9768 0.9585 0.9396 0.9029 0.8829 0.8538 0.8208 0.8015 0.7833 0.7676 0.7479 0.7410 0.7202 0.7214 0.7212 0.7096 0.7132
1.0000 0.9938 0.9768 0.9585 0.9396 0.9029 0.8829 0.8443 0.8208 0.7941 0.7688 0.7513 0.7378 0.7202 0.6995 0.6886 0.6816 0.6721 0.6691 1.0000 0.9925 0.9768 0.9521 0.9292 0.9029 0.8728 0.8374 0.8063 0.7647 0.7313 0.6885 0.6621 0.6317 0.5950 0.5600 0.5396 0.5077 0.5000
1.0000 0.9925 0.9768 0.9521 0.9292 0.9029 0.8664 0.8305 0.7991 0.7574 0.7168 0.6816 0.6457 0.5950 0.5583 0.5007 0.4535 0.4255 0.4044 1.0000 0.9925 0.9862 0.9850 0.9707 0.9603 0.9421 0.9071 0.8740 0.8088 0.7543 0.6722 0.6029 0.5272 0.4698 0.4149 0.3838 0.3735 0.3603
1.0000 1.0010 1.0001 1.0014 0.9970 0.9866 0.9850 0.9630 0.9260 0.8824 0.8293 0.7582 0.6785 0.6054 0.5272 0.4743 0.4304 0.4110 0.3971 1.0000 0.9925 0.9794 0.9585 0.9603 0.9603 0.9850 0.9932 1.0227 1.0221 0.9938 0.9235 0.8235 0.6995 0.5846 0.5600 0.6188 0.6866 0.7132

TdC–90
1.0000 0.9707 0.9235 0.8235 0.6732 0.5272 0.3229 0.1954 0.1414 0.1912 0.2164 0.2117 0.2043 0.1930 0.2768 0.3821 0.5001 0.5597 0.5882]
SM69card =[1.0000 0.9925 0.9862 0.9585 0.9499 0.9236 0.8993 0.8538 0.8135 0.7868 0.7471 0.7118 0.6785 0.6421 0.6157 0.5865 0.5629 0.5452 0.5368 1.0000 0.9925 0.9794 0.9585 0.9499 0.9236 0.8993 0.8607 0.8135 0.7647 0.7168 0.6653 0.6293 0.5846 0.5479 0.5171 0.4862 0.4630 0.4632
1.0000 0.9865 0.9699 0.9585 0.9396 0.9029 0.8728 0.8374 0.7991 0.7500 0.6866 0.6257 0.5007 0.4020 0.2975 0.2636 0.2978 0.3506 0.3750 1.0000 0.9865 0.9699 0.9585 0.9396 0.9029 0.8829 0.8443 0.8063 0.7353 0.6721 0.5861 0.4843 0.3916 0.2975 0.1943 0.0861 0.0447 0
1.0000 0.9925 0.9862 0.9686 0.9396 0.9029 0.8500 0.7909 0.7471 0.6838 0.6274 0.5560 0.4414 0.3446 0.1723 -0.2800 -0.4304 -0.5005 -0.5368 1.0000 0.9925 0.9862 0.9686 0.9396 0.9029 0.8664 0.8305 0.7918 0.7500 0.6939 0.6188 0.4579 0.2768 0.1460 -0.2371 -0.3838 -0.4932 -0.5368
1.0000 0.9852 0.9536 0.9157 0.8821 0.8558 0.8500 0.8770 0.8958 0.8824 0.8510 0.7444 0.5865 0.3549 0.2768 -0.3393 -0.4932 -0.6117 -0.6544 1.0000 0.9707 0.9071 0.8235 0.6421 0.4227 0.2043 0.0628 0.0375 0 -0.0074 -0.0147 -0.0294 -0.0574 -0.0942 -0.1779 -0.2815 -0.3433 -0.3750]
SM69hyp =[1.0000 0.9936 0.9791 0.9452 0.9066 0.8496 0.7850 0.7228 0.6672 0.6058 0.5556 0.4896 0.4219 0.3888 -0.4196 -0.4971 -0.5912 -0.6601 -0.6715
1.0000 0.9936 0.9791 0.9452 0.9066 0.8496 0.7850 0.7228 0.6672 0.6058 0.5556 0.4896 0.4219 0.3888 -0.4196 -0.4971 -0.5912 -0.6601 -0.6715 1.0000 0.9853 0.9628 0.9253 0.8860 0.8393 0.7850 0.7458 0.6888 0.6058 0.4740 0.2794 -0.0588 -0.1710 -0.5439 -0.6509 -0.7228 -0.7488 -0.7591
1.0000 0.9853 0.9628 0.9253 0.8860 0.8393 0.7850 0.7458 0.6888 0.6058 0.4740 0.2794 -0.0588 -0.1710 -0.5439 -0.6509 -0.7228 -0.7488 -0.7591 1.0000 0.9853 0.9628 0.9253 0.8860 0.8393 0.7913 0.7390 0.6816 0.5985 0.4740 0.2564 -0.0688 -0.1813 -0.5439 -0.6573 -0.7228 -0.7488 -0.7591
1.0000 0.9853 0.9628 0.9253 0.8860 0.8393 0.7913 0.7390 0.6816 0.5985 0.4740 0.2564 -0.0688 -0.1813 -0.5439 -0.6573 -0.7228 -0.7488 -0.7591 1.0000 0.9936 0.9628 0.9353 0.9066 0.8757 0.8438 0.8312 0.7933 0.7445 0.7045 0.6604 -0.6473 -0.6580 -0.6944 -0.7424 -0.7851 -0.8004 -0.8029
1.0000 0.9780 0.9236 0.8339 0.7047 0.5542 0.4219 0.3187 0.2148 0.1606 -0.1332 -0.1709 -0.2617 -0.3991 -0.4869 -0.5722 -0.6211 -0.6601 -0.6642]
SM69bidir=[1.0000 0.9938 0.9699 0.9421 0.9029 0.8454 0.7643 0.6257 0.4557 0 -0.4557 -0.6257 -0.7643 -0.8454 -0.9029 -0.9421 -0.9699 -0.9938 -1.0000 1.0000 0.9938 0.9699 0.9421 0.9029 0.8454 0.7643 0.6257 0.4557 0 -0.4557 -0.6257 -0.7643 -0.8454 -0.9029 -0.9421 -0.9699 -0.9938 -1.0000
1.0000 0.9938 0.9699 0.9421 0.9029 0.8454 0.7643 0.6257 0.4557 0 -0.4557 -0.6257 -0.7643 -0.8454 -0.9029 -0.9421 -0.9699 -0.9938 -1.0000 1.0000 0.9938 0.9699 0.9421 0.9029 0.8454 0.7643 0.6257 0.4557 0 -0.4557 -0.6257 -0.7643 -0.8454 -0.9029 -0.9421 -0.9699 -0.9938 -1.0000
1.0000 0.9925 0.9794 0.9421 0.9029 0.8558 0.7643 0.6421 0.4557 0 -0.4557 -0.6421 -0.7643 -0.8558 -0.9029 -0.9421 -0.9794 -0.9925 -1.0000 1.0000 0.9925 0.9794 0.9421 0.9029 0.8558 0.7643 0.6421 0.4557 0 -0.4557 -0.6421 -0.7643 -0.8558 -0.9029 -0.9421 -0.9794 -0.9925 -1.0000
1.0000 0.9925 0.9794 0.9421 0.9029 0.8558 0.7643 0.6421 0.4557 0 -0.4557 -0.6421 -0.7643 -0.8558 -0.9029 -0.9421 -0.9794 -0.9925 -1.0000 1.0000 0.9707 0.9304 0.8500 0.7099 0.5583 0.3229 0.0861 0.0447 0 -0.0447 -0.0861 -0.3229 -0.5583 -0.7099 -0.8500 -0.9304 -0.9707 -1.0000]
idomni =[1.0000 1.0000 1.0000 1.0000 1.0000 1.0000 1.0000 1.0000 1.0000 1.0000 1.0000 1.0000 1.0000 1.0000 1.0000 1.0000 1.0000 1.0000 1.0000 1.0000 1.0000 1.0000 1.0000 1.0000 1.0000 1.0000 1.0000 1.0000 1.0000 1.0000 1.0000 1.0000 1.0000 1.0000 1.0000 1.0000 1.0000 1.0000
1.0000 1.0000 1.0000 1.0000 1.0000 1.0000 1.0000 1.0000 1.0000 1.0000 1.0000 1.0000 1.0000 1.0000 1.0000 1.0000 1.0000 1.0000 1.0000 1.0000 1.0000 1.0000 1.0000 1.0000 1.0000 1.0000 1.0000 1.0000 1.0000 1.0000 1.0000 1.0000 1.0000 1.0000 1.0000 1.0000 1.0000 1.0000
1.0000 1.0000 1.0000 1.0000 1.0000 1.0000 1.0000 1.0000 1.0000 1.0000 1.0000 1.0000 1.0000 1.0000 1.0000 1.0000 1.0000 1.0000 1.0000 1.0000 1.0000 1.0000 1.0000 1.0000 1.0000 1.0000 1.0000 1.0000 1.0000 1.0000 1.0000 1.0000 1.0000 1.0000 1.0000 1.0000 1.0000 1.0000
1.0000 1.0000 1.0000 1.0000 1.0000 1.0000 1.0000 1.0000 1.0000 1.0000 1.0000 1.0000 1.0000 1.0000 1.0000 1.0000 1.0000 1.0000 1.0000 1.0000 1.0000 1.0000 1.0000 1.0000 1.0000 1.0000 1.0000 1.0000 1.0000 1.0000 1.0000 1.0000 1.0000 1.0000 1.0000 1.0000 1.0000 1.0000]
idsub =[1.0000 0.9987 0.9947 0.9882 0.9791 0.9675 0.9536 0.9376 0.9196 0.9000 0.8793 0.8580 0.8367 0.8163 0.7976 0.7817 0.7695 0.7618 0.7592
1.0000 0.9987 0.9947 0.9882 0.9791 0.9675 0.9536 0.9376 0.9196 0.9000 0.8793 0.8580 0.8367 0.8163 0.7976 0.7817 0.7695 0.7618 0.7592 1.0000 0.9987 0.9947 0.9882 0.9791 0.9675 0.9536 0.9376 0.9196 0.9000 0.8793 0.8580 0.8367 0.8163 0.7976 0.7817 0.7695 0.7618 0.7592
1.0000 0.9987 0.9947 0.9882 0.9791 0.9675 0.9536 0.9376 0.9196 0.9000 0.8793 0.8580 0.8367 0.8163 0.7976 0.7817 0.7695 0.7618 0.7592 1.0000 0.9987 0.9947 0.9882 0.9791 0.9675 0.9536 0.9376 0.9196 0.9000 0.8793 0.8580 0.8367 0.8163 0.7976 0.7817 0.7695 0.7618 0.7592
1.0000 0.9987 0.9947 0.9882 0.9791 0.9675 0.9536 0.9376 0.9196 0.9000 0.8793 0.8580 0.8367 0.8163 0.7976 0.7817 0.7695 0.7618 0.7592 1.0000 0.9987 0.9947 0.9882 0.9791 0.9675 0.9536 0.9376 0.9196 0.9000 0.8793 0.8580 0.8367 0.8163 0.7976 0.7817 0.7695 0.7618 0.7592
1.0000 0.9987 0.9947 0.9882 0.9791 0.9675 0.9536 0.9376 0.9196 0.9000 0.8793 0.8580 0.8367 0.8163 0.7976 0.7817 0.7695 0.7618 0.7592]
idcard =[1.0000 0.9973 0.9893 0.9759 0.9568 0.9316 0.9000 0.8614 0.8148 0.7592 0.6929 0.6138 0.5184 0.4015 0.2545 0.1340 0.0604 0.0152 0 1.0000 0.9973 0.9893 0.9759 0.9568 0.9316 0.9000 0.8614 0.8148 0.7592 0.6929 0.6138 0.5184 0.4015 0.2545 0.1340 0.0604 0.0152 0
1.0000 0.9973 0.9893 0.9759 0.9568 0.9316 0.9000 0.8614 0.8148 0.7592 0.6929 0.6138 0.5184 0.4015 0.2545 0.1340 0.0604 0.0152 0 1.0000 0.9973 0.9893 0.9759 0.9568 0.9316 0.9000 0.8614 0.8148 0.7592 0.6929 0.6138 0.5184 0.4015 0.2545 0.1340 0.0604 0.0152 0
1.0000 0.9973 0.9893 0.9759 0.9568 0.9316 0.9000 0.8614 0.8148 0.7592 0.6929 0.6138 0.5184 0.4015 0.2545 0.1340 0.0604 0.0152 0 1.0000 0.9973 0.9893 0.9759 0.9568 0.9316 0.9000 0.8614 0.8148 0.7592 0.6929 0.6138 0.5184 0.4015 0.2545 0.1340 0.0604 0.0152 0

TdC–91
1.0000 0.9973 0.9893 0.9759 0.9568 0.9316 0.9000 0.8614 0.8148 0.7592 0.6929 0.6138 0.5184 0.4015 0.2545 0.1340 0.0604 0.0152 0 1.0000 0.9973 0.9893 0.9759 0.9568 0.9316 0.9000 0.8614 0.8148 0.7592 0.6929 0.6138 0.5184 0.4015 0.2545 0.1340 0.0604 0.0152 0]
idhyper =[1.0000 0.9960 0.9839 0.9632 0.9330 0.8917 0.8367 0.7637 0.6640 0.5184 0.2628 -0.0130 -0.2775 -0.4925 -0.6090 -0.6812 -0.7263 -0.7512 -0.7592 1.0000 0.9960 0.9839 0.9632 0.9330 0.8917 0.8367 0.7637 0.6640 0.5184 0.2628 -0.0130 -0.2775 -0.4925 -0.6090 -0.6812 -0.7263 -0.7512 -0.7592
1.0000 0.9960 0.9839 0.9632 0.9330 0.8917 0.8367 0.7637 0.6640 0.5184 0.2628 -0.0130 -0.2775 -0.4925 -0.6090 -0.6812 -0.7263 -0.7512 -0.7592 1.0000 0.9960 0.9839 0.9632 0.9330 0.8917 0.8367 0.7637 0.6640 0.5184 0.2628 -0.0130 -0.2775 -0.4925 -0.6090 -0.6812 -0.7263 -0.7512 -0.7592
1.0000 0.9960 0.9839 0.9632 0.9330 0.8917 0.8367 0.7637 0.6640 0.5184 0.2628 -0.0130 -0.2775 -0.4925 -0.6090 -0.6812 -0.7263 -0.7512 -0.7592 1.0000 0.9960 0.9839 0.9632 0.9330 0.8917 0.8367 0.7637 0.6640 0.5184 0.2628 -0.0130 -0.2775 -0.4925 -0.6090 -0.6812 -0.7263 -0.7512 -0.7592
1.0000 0.9960 0.9839 0.9632 0.9330 0.8917 0.8367 0.7637 0.6640 0.5184 0.2628 -0.0130 -0.2775 -0.4925 -0.6090 -0.6812 -0.7263 -0.7512 -0.7592 1.0000 0.9960 0.9839 0.9632 0.9330 0.8917 0.8367 0.7637 0.6640 0.5184 0.2628 -0.0130 -0.2775 -0.4925 -0.6090 -0.6812 -0.7263 -0.7512 -0.7592]
idbidir =[1.0000 0.9947 0.9784 0.9500 0.9074 0.8465 0.7592 0.6272 0.3916 0 -0.3916 -0.6272 -0.7592 -0.8465 -0.9074 -0.9500 -0.9784 -0.9947 -1.0000
1.0000 0.9947 0.9784 0.9500 0.9074 0.8465 0.7592 0.6272 0.3916 0 -0.3916 -0.6272 -0.7592 -0.8465 -0.9074 -0.9500 -0.9784 -0.9947 -1.0000 1.0000 0.9947 0.9784 0.9500 0.9074 0.8465 0.7592 0.6272 0.3916 0 -0.3916 -0.6272 -0.7592 -0.8465 -0.9074 -0.9500 -0.9784 -0.9947 -1.0000
1.0000 0.9947 0.9784 0.9500 0.9074 0.8465 0.7592 0.6272 0.3916 0 -0.3916 -0.6272 -0.7592 -0.8465 -0.9074 -0.9500 -0.9784 -0.9947 -1.0000 1.0000 0.9947 0.9784 0.9500 0.9074 0.8465 0.7592 0.6272 0.3916 0 -0.3916 -0.6272 -0.7592 -0.8465 -0.9074 -0.9500 -0.9784 -0.9947 -1.0000
1.0000 0.9947 0.9784 0.9500 0.9074 0.8465 0.7592 0.6272 0.3916 0 -0.3916 -0.6272 -0.7592 -0.8465 -0.9074 -0.9500 -0.9784 -0.9947 -1.0000 1.0000 0.9947 0.9784 0.9500 0.9074 0.8465 0.7592 0.6272 0.3916 0 -0.3916 -0.6272 -0.7592 -0.8465 -0.9074 -0.9500 -0.9784 -0.9947 -1.0000
1.0000 0.9947 0.9784 0.9500 0.9074 0.8465 0.7592 0.6272 0.3916 0 -0.3916 -0.6272 -0.7592 -0.8465 -0.9074 -0.9500 -0.9784 -0.9947 -1.0000]