Embed Size (px)
Citation preview

A More Fundamental Wall Lubrication Force from Turbulent Dispersion Regularization
for Multiphase CFD Applications
Nazar Lubchenko, Ben Magolan, Rosie Sugrue, Emilio Baglietto
Department of Nuclear Science and Engineering, Massachusetts Institute of Technology,
Cambridge, MA 02139, USA
ABSTRACT
Accurate prediction of the gas volume fraction distribution in the near-wall region is critical for
the simulation of bubbly flows. Resolving the near-wall gas profile remains a considerable
challenge for multiphase computational fluid dynamics (M-CFD) simulations based on the
Eulerian-Eulerian framework, where the coupling of interfacial momentum exchange through
closure relations for lift and turbulent dispersion leads to a non-physical gas accumulation in the
wall-layer cells. Wall lubrication models have been developed in an attempt to remedy this
behavior by providing an artificial force to move the void fraction profile away from the wall.
Currently, such models suffer from a severe lack of generality, being characterized by
overspecified formulations that are highly dependent on tunable coefficients; moreover, their
application often leads to dramatic overcorrections of the void fraction profile, resulting in the first
few wall-layer cells being unphysically devoid of the gas phase. Here, we propose a new wall
lubrication model that is derived through regularization of turbulent dispersion in the near-wall
region to account for the decreasing cross-sectional area of the bubbles. This novel approach is
assessed via simulation of experiments from the Liu and Bankoff database using a custom
modified version of the twoPhaseEulerFoam solver in OpenFOAM v3.0.1. Comparison with the
original model of Antal et al. [Antal, S.P., R.T. Lahey Jr, and J.E. Flaherty. 1991. "Analysis of
phase distribution in fully developed laminar bubbly two-phase flow." International Journal of
Multiphase Flow 17 (5): 635-652.] and a mesh sensitivity study demonstrate the model’s strong
performance in volume fraction prediction in addition to its ability to scale well with varying
thicknesses of the first wall-layer. This methodology is entirely general and can be used to derive
a wall lubrication model from any turbulence dispersion model and assumed void fraction profile.
The approach could further be extended for application to multi-group bubble size models.
1. INTRODUCTION
Understanding and predicting two-phase flow behavior is essential for a wide range of industrial
applications including nuclear reactors and various chemical processes. Of particular interest is the
distribution of the gas volume fraction profile in the near-wall region, as it directly affects other
flow parameters such as turbulent quantities and, when involved, heat transfer. As the application
of multiphase computational fluid dynamics (M-CFD) based on the Eulerian-Eulerian two-fluid
model (Bestion et al. 2009, Lo, Splawski and Yun 2011, In and Chun 2009) is gaining increasing
popularity in the attempt to deliver predictions of design flow quantities, great care must be taken
to ensure that these methods are equipped with physically based closure relations for turbulence
and interfacial momentum exchange.
Interfacial momentum exchange is partitioned into a series of component forces that describe the
interaction between the gas and liquid phases, which together impact the resulting volume fraction

distribution, while also affecting other flow parameters such as velocities and turbulent quantities.
In the axial (primary) flow direction, the drag force is the dominant mechanism that opposes the
buoyancy force and determines the terminal rising velocity of the bubbles. Likewise, in the lateral
flow direction it is common practice to model the effects of only lift and turbulent dispersion; such
treatment however disregards the effects of the walls on the gas distribution and most often leads
to non-physical overshoots of the gas fraction in the near wall computational cells in case of
upward flow.
Several wall lubrication models have been proposed, which attempt to correct the non-physical
gas accumulation through prescription of an artificial force in the near-wall region to drive the gas
phase away from the wall. Antal et al. (1991) derived the first such closure relation for
cylindrically-shaped bubbles in laminar flow, by assuming asymmetrical drainage of the liquid
around the bubble in the near-wall region; the model coefficients were then adjusted to account
for the spherical bubble shape. While modifications were later advanced by Tomiyama (1998) and
Frank et al. (2008), all models deriving from the Antal et al. (1991) lineage inevitably suffer from
a lack of generality in their formulation, being highly dependent on the calibration coefficients that
require re-tuning for each flow condition. Most importantly, all such models typically overcorrect
for the issue, prescribing a disproportioned lubrication force that propagates a few bubble
diameters away from the wall, thereby pushing all gas away from the wall and further influencing
the bulk distribution. Consequently, it is common practice to neglect modeling wall lubrication in
engineering applications that are highly sensitive to void fraction at the wall, such as boiling
(Mimouni et al. 2008).
Recently, two modeling approaches have been proposed that both involve deactivation of the lift
force in the near-wall region. Shaver and Podowski (2015) achieve this by forcing the lift
coefficient to zero near the wall and neglecting wall lubrication; they model solely the effects of
turbulent dispersion, which leads to a flat volume fraction profile in the near-wall region.
Vaidheeswaran et al. (2017) do not solve for momentum transfer near the wall, effectively
truncating the lift force to zero thereby obtaining a flat volume fraction profile; from this flattened
profile they reconstruct a parabolic volume fraction profile based on geometrical arguments by
considering the bubble chord length.
In the present work, a wall lubrication model is advanced that is fundamentally different from
previous works. While sharing some similarity with the work of Vaidheeswaran et al. (2017) in
that it relates the volume fraction profile to the bubble geometry, it considerably deviates from
their approach by associating this dependence with the cross-sectional area of the bubble. More
importantly, in this work the void fraction profile is resolved in the near-wall layer through
modification of the wall lubrication force, as opposed to reconstructed solely based on geometric
arguments. This is accomplished through regularization of turbulent dispersion in the near-wall
region in order to restore the desired behavior of the gas volume fraction. It is important to note
that the present work was conducted without any awareness of the work of Vaidheeswaran et al.
(2017), and the commonalities are a confirmation of the physical soundness of the underlying idea.
This newly proposed approach for modeling wall lubrication is assessed on the simulation of two
representative cases from the Liu and Bankoff experimental database (Liu 1989, Liu and Bankoff
1993a, Liu and Bankoff 1993b) using a custom version of the twoPhaseEulerFoam solver of
OpenFOAM v.3.0.1. The model is directly compared with the existing model of Antal et al. (1991)

to evaluate its merits. A sensitivity study of the first wall layer element is also performed to
examine the effect of mesh size on volume fraction distribution.
Section 2 of this paper motivates the need for this work by delving into the formulation of
momentum closures, highlighting the limitations of current wall lubrication models, and
examining the collective behavior of lateral redistribution forces on the void fraction profile.
Section 3 presents the new wall lubrication model through an analysis of the physical behavior of
the void fraction profile, introduced its derivation from the turbulent dispersion force, and lastly,
discusses the stability and limitations of the current implementation in CFD. Section 4 discusses
the model assessment on the Liu and Bankoff test cases (Liu 1989) as well as providing a
sensitivity study for the first wall layer element. Lastly, Section 5 concludes with a discussion of
the present model’s extension to other turbulent dispersion models along with its applicability to
multi-group methods.
2. GOVERNING EQUATIONS
The Eulerian-Eulerian framework, or two-fluid model (Bestion, et al. 2009, Lo, Splawski and Yun
2011, In and Chun 2009), is employed in this analysis. Turbulence is modeled solely for the liquid
phase using the standard k-ε model (Launder and Spalding 1974). Interfacial forces are modeled
in accordance with the Bubbly And Moderate void Fraction (BAMF) model (Sugrue, et al. 2017),
which consists of the drag coefficient model by Tomiyama (Tomiyama, Kataoka, et al. 1998), a
constant lift coefficient of 0.025 with adjustment in the near wall region (Shaver and Podowski
2015), and the turbulent dispersion model by Burns (Burns, et al. 2004). Each of the three forces
are discussed first in the following sections, and a review of wall lubrication models is presented
later to highlight and motivate the present work. Lastly, the collective behavior of the lateral
redistribution forces is examined to explore how the combination of these forces serve to impact
the resulting void fraction profile.
2.1 Drag Force
The drag force quantifies the momentum exchange due to the relative motion between the gas and
liquid phases. It opposes the relative motion of the gas phase and is expressed as:
LGLGL
b
DD
D
CVVVVF
4
3 (1)
Here, Db is the average bubble diameter and CD is the drag coefficient which is determined from
the drag model. Since most drag models for bubbly flow work well in low void fraction regimes
(as demonstrated by Rzehak and Krepper (2013)), the choice of the model has minimal impact on
the results. In the present paper, the Tomiyama drag coefficient model assuming moderate
contamination by surfactants is utilized (Tomiyama, Kataoka, et al. 1998):
4Eo
Eo
3
8,
Re
72,Re15.01
Re
24minmax
687.0
b
b
b
DC (2)
where bubble Reynolds number Reb and Eötvös number Eo are:

L
bLGL
b
D
VV Re (3)
2
Eo bGL Dg (4)
2.2 Lift Force
The lift force accounts for the lateral motion of bubbles due to velocity gradients in the continuous
phase (Drew and Lahey 1987):
LLGLLL C VVVF (5)
The lift coefficient, CL, is currently assumed to depend mostly on the size of the bubbles while the
influence of turbulence properties is not fully understood (Tomiyama 1998). A positive lift
coefficient is used for small spherical bubbles of low Eötvös number, which results in wall-peaked
distribution of void fraction; conversely, a negative coefficient is used for large deformable
bubbles that results in a center-peaked distribution. In the present paper, we focus only on wall-
peaked distributions in the low Eötvös number regime. There remains no consensus for the value
of the lift coefficient should be, with models delivering predictions that vary by more than an order
of magnitude. It was recently demonstrated that for small bubbles a value of the order of 0.025 is
most appropriate (Baglietto and Christon 2013).
The lift force reaches its maximum at the wall, where the gradient of liquid velocity is the highest.
This results in the already mentioned unphysical asymptotic spike for the gas fraction at the walls.
As the introduction of an ‘artificial’ wall lubrication force suffers of lack of general applicability
and non-local effects (see Section 2.4), Shaver and Podowski (2015) proposed instead a simplified
correction, where the lift force is damped near the wall, reducing it to zero everywhere closer than
one bubble radius from the surface:
bL
b
bb
L
b
L
DyC
DyD
y
D
yC
Dy
C
/1
1/5.0,12
212
3
5.0/,0
0
32
0 (6)
where CL0 is the nominal lift coefficient.
2.3 Turbulent Dispersion
Turbulent fluctuations produce randomness in the relative velocity between phases, which leads
to fluctuations in the drag force. While these fluctuations in the axial direction are low by
comparison to the absolute value of axial forces (mean drag and buoyancy force), they bring a
considerable impact on the redistribution of bubbles in the lateral direction. This effect can be
expressed as a dispersive force acting on the gas phase. This turbulent dispersion force was derived
by Burns et al. (2004) by time averaging of the drag:

1
11
4
3
TD
turb
LLG
b
DTD
D
CVVF (7)
where TD is the Schmidt number of turbulent dispersion, usually taken as 1. A number of other
models have been proposed in the past, notably the Imperial College model (Gosman, Lekakou
and Politis 1992) and RPI model (Lopez de Bertodano 1992). The former is very similar to the
model by Burns and has the same limit for low void fraction. The latter proposed a more empirical
expression for the turbulent dispersion force:
LLTDTD kCF (8)
where CTD is the turbulent dispersion coefficient, which can either be expressed as a constant
(Lopez de Bertodano 1992), or be a function of bubble and flow parameters (Lopez de Bertodano
1998). Nonetheless, the turbulent dispersion force is always proportional to the gradient of void
fraction:
TDF (9)
2.4 Wall Lubrication
Drag, lift, and turbulent dispersion forces cannot correctly capture the reduction of the gas fraction
near the wall; an artificial wall lubrication force has therefore been commonly adopted to drive the
bubbles away from the wall.
The first such wall lubrication model was derived by Antal et al. (1991) considering a rising bubble
in laminar flow pushed by the lift force towards the wall. The no-slip condition at the wall slows
the drainage rate of the liquid film between the bubble and the wall; this increases the drainage
rate on the opposite side, resulting in a force which opposes lift. These assumptions resulted in a
derivation of a lubrication force for a cylinder near the wall using Blasius’s theorem:
nVV
Fb
LGLWLWL
DC
2
(10)
where CWL is the wall lubrication coefficient. The derivation was performed for a cylinder, but the
results were expanded to bubbles, with an adjustment of the wall lubrication coefficient. The final
correlations proposed by the authors are the following:
0,
2max 21
y
DCCC b
wwWL (11)
104.006.01 LGwC VV (12)
147.02 wC (13)
The Antal wall lubrication has been the de-facto standard for the simulation of the bubbly flow.
However, there is no general agreement on the values of the coefficients. Starting from the very
first applications of the model, constant coefficients Cw1 and Cw2 have been proposed (Lopez de
Bertodano, Lahey and Jones 1994). Over time, both coefficients varied in wide range, with Cw1

being between 0.02 and 0.1, and Cw2 being between 0.01 and 0.147 (Frank, et al. 2008, Politano,
Carrica and Converti 2003, Biswas, Esmaeeli and Tryggvason 2005). In the present paper, values
of 0.01 and 0.05 are used, as suggested by Frank et al. (2008).
Two other notable models were derived based on the Antal proposal. Tomiyama (1998) modified
the functional dependence by adding a function of pipe diameter, which damped wall lubrication
while approaching the center of the pipe. Additionally, in his formulation wall lubrication does not
depend on the volume fraction of the gas phase:
nVVF2
LGLWLWL C (14)
33Eo50.04,0.007Eo
5Eo1,11
2
179.0Eo933.0
22
e
yDy
DC b
WL (15)
The Tomiyama (1998) model was further modified by Frank et al. (2008), who re-introduced the
dependence on void fraction, also adding three additional fitting coefficients:
nVVF2
LGLWLWL C (16)
33Eo50.04,Eo 0.007
5Eo1,
10
101
8.6
1,0max
179.0Eo933.0
7.0
e
D
yy
D
y
C
b
bWL (17)
As can be seen, the models for wall lubrication become increasingly complicated with each new
iteration, as additional fitting coefficients are introduced. The reasoning behind these models is
vague: all of them are based on the assumption of the force which repels bubbles from the wall.
However, this force was derived for inadequate conditions (laminar flow with infinite cylindrical
“bubbles”), and was fitted to match the experimental data.
In some cases, the overfitting of wall lubrication results in very strong repulsion near the wall,
with zero void fraction in the few near-wall cells (Frank et al. 2008, Marfaing et al. 2016). This is
especially inadequate for example in cases including nucleate boiling in bubbly flow. To overcome
this problem, a number of researchers do not include any lubrication force in their simulations
(Mimouni et al. 2008), therefore producing the discussed overshoot of gas fraction near the wall.
In the absence of more physically based models, the approach of Shaver and Podowski (2015)
provides a more practical solution by damping the lift force near the wall (Eq. (6)).
2.5 Collective Behavior of Lateral Re-Distribution Forces
Together, the three lateral forces (lift, turbulent dispersion, and wall lubrication) serve to
redistribute the void fraction profile across the channel. Their collective behavior is illustrated in
Figure 1 for four different combinations of forces and their closure relations:
Lift (black): all gas pushed towards the wall (for spherical bubbles of low Eötvös number)
Lift, Turbulent Dispersion (green): the balance between these two forces still results in a
significant overprediction of void fraction at the wall due to dominance of velocity
gradients in near-wall region
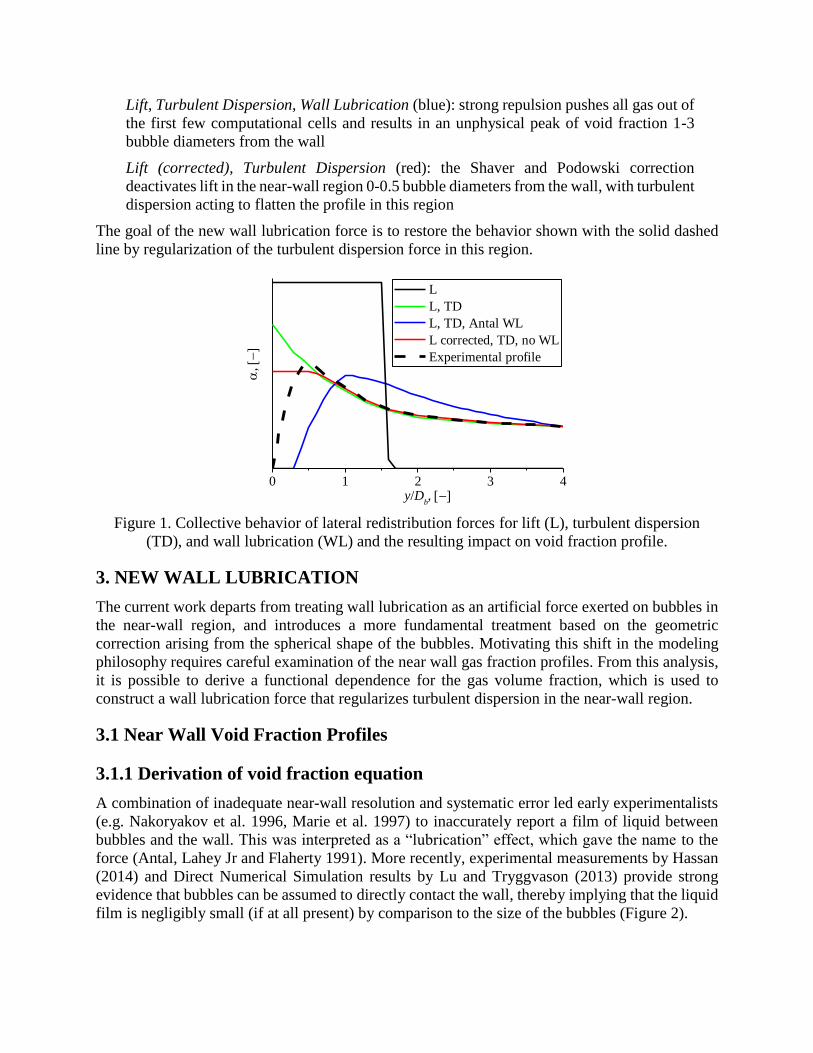
Lift, Turbulent Dispersion, Wall Lubrication (blue): strong repulsion pushes all gas out of
the first few computational cells and results in an unphysical peak of void fraction 1-3
bubble diameters from the wall
Lift (corrected), Turbulent Dispersion (red): the Shaver and Podowski correction
deactivates lift in the near-wall region 0-0.5 bubble diameters from the wall, with turbulent
dispersion acting to flatten the profile in this region
The goal of the new wall lubrication force is to restore the behavior shown with the solid dashed
line by regularization of the turbulent dispersion force in this region.
Figure 1. Collective behavior of lateral redistribution forces for lift (L), turbulent dispersion
(TD), and wall lubrication (WL) and the resulting impact on void fraction profile.
3. NEW WALL LUBRICATION
The current work departs from treating wall lubrication as an artificial force exerted on bubbles in
the near-wall region, and introduces a more fundamental treatment based on the geometric
correction arising from the spherical shape of the bubbles. Motivating this shift in the modeling
philosophy requires careful examination of the near wall gas fraction profiles. From this analysis,
it is possible to derive a functional dependence for the gas volume fraction, which is used to
construct a wall lubrication force that regularizes turbulent dispersion in the near-wall region.
3.1 Near Wall Void Fraction Profiles
3.1.1 Derivation of void fraction equation
A combination of inadequate near-wall resolution and systematic error led early experimentalists
(e.g. Nakoryakov et al. 1996, Marie et al. 1997) to inaccurately report a film of liquid between
bubbles and the wall. This was interpreted as a “lubrication” effect, which gave the name to the
force (Antal, Lahey Jr and Flaherty 1991). More recently, experimental measurements by Hassan
(2014) and Direct Numerical Simulation results by Lu and Tryggvason (2013) provide strong
evidence that bubbles can be assumed to directly contact the wall, thereby implying that the liquid
film is negligibly small (if at all present) by comparison to the size of the bubbles (Figure 2).
0 1 2 3 4
,
y/Db,
L
L, TD
L, TD, Antal WL
L corrected, TD, no WL
Experimental profile
(a) (b) (c)
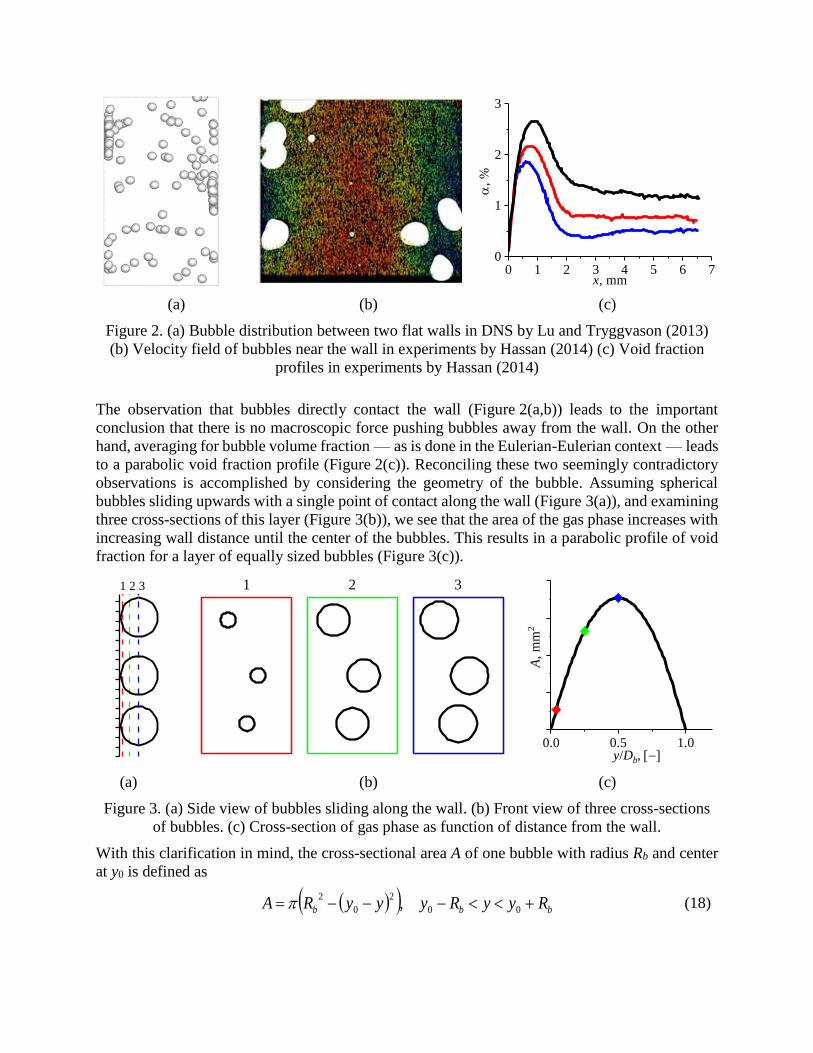
Figure 2. (a) Bubble distribution between two flat walls in DNS by Lu and Tryggvason (2013)
(b) Velocity field of bubbles near the wall in experiments by Hassan (2014) (c) Void fraction
profiles in experiments by Hassan (2014)
The observation that bubbles directly contact the wall (Figure 2(a,b)) leads to the important
conclusion that there is no macroscopic force pushing bubbles away from the wall. On the other
hand, averaging for bubble volume fraction — as is done in the Eulerian-Eulerian context — leads
to a parabolic void fraction profile (Figure 2(c)). Reconciling these two seemingly contradictory
observations is accomplished by considering the geometry of the bubble. Assuming spherical
bubbles sliding upwards with a single point of contact along the wall (Figure 3(a)), and examining
three cross-sections of this layer (Figure 3(b)), we see that the area of the gas phase increases with
increasing wall distance until the center of the bubbles. This results in a parabolic profile of void
fraction for a layer of equally sized bubbles (Figure 3(c)).
(a) (b) (c)
Figure 3. (a) Side view of bubbles sliding along the wall. (b) Front view of three cross-sections
of bubbles. (c) Cross-section of gas phase as function of distance from the wall.
With this clarification in mind, the cross-sectional area A of one bubble with radius Rb and center
at y0 is defined as
bbb RyyRyyyRA 00
2
0
2, (18)
0 1 2 3 4 5 6 70
1
2
3
,
%
x, mm
1 2 3 1 2 3
0.0 0.5 1.0
A,
mm
2
y/Db,

If the total surface density of the bubbles close to the wall is N bubbles/m2 and bubble centroids
are located at y0 = Rb, then, neglecting the contribution by bubbles with centroids located further
than Rb, the void fraction at distance y from the wall is
22yRRN bb (19)
The maximum void fraction is achieved at distance Rb from the wall, and equation (19) can be
rewritten as
2
max
22/11/11 bbb RyRyRN (20)
It is not surprising to note that this result is similar to the profile advanced by Vaidheeswaran et
al. (2017) wherein the authors relate bubble chord length to the near-wall void fraction profile.
3.1.2 Validation of void fraction equation
To further corroborate the soundness of the void fraction profile proposed in Eq. (20), the
analytical distribution is compared here to the data from the Liu and Bankoff bubbly flow
experiments (Liu 1989, Liu and Bankoff 1993a, Liu and Bankoff 1993b). The experimental facility
consisted of a cylindrical pipe with inner diameter of 38.1 mm. Gas was injected at the bottom of
the test section, forming bubbles with average diameters in the range of 2-4 mm. Radial profile
measurements of liquid and gas local velocity, void fraction, bubble size, and turbulent properties
were performed at four planes above the injection point for 42 combinations of inlet liquid and gas
superficial velocities. Twelve cases that represent almost the full range of velocities in the
experiment have been selected for model validation. The numbering convention and
accompanying superficial liquid (JL) and gas (JG) velocities for these sets are summarized in
Table 1.
Table 1. Numbering convention and superficial velocities for twelve selected cases from the Liu
and Bankoff experimental database (Liu 1989).
JL = 0.376 m/s JL = 0.753 m/s JL = 1.087 m/s
JG = 0.027 m/s 1 15 29
JG = 0.067 m/s 2 16 30
JG = 0.180 m/s 4 18 32
JG = 0.293 m/s 6 20 34
The experiments provide data for void fraction near the wall with a resolution of 0.7 mm, which
is below the size of the bubbles in all cases. The void fraction profiles for the selected sets are
shown in Figure 4(a), where the peak void fraction ranges from 7% to 50% and the bulk void
fraction varies between 2% to 40%. The peak of the void fraction is achieved at the third or fourth
probe, depending on the case.
The experimental profiles in Figure 4(a) are normalized for each set by mean bubble diameter in
x and by peak void fraction in y and are compared with the analytical prediction (20) in Figure 4(b).
These results are consistent with the analytical prediction, where the variation in the location of
the peak void fraction is related to measurement uncertainty due to the spatial resolution of the
sensors.
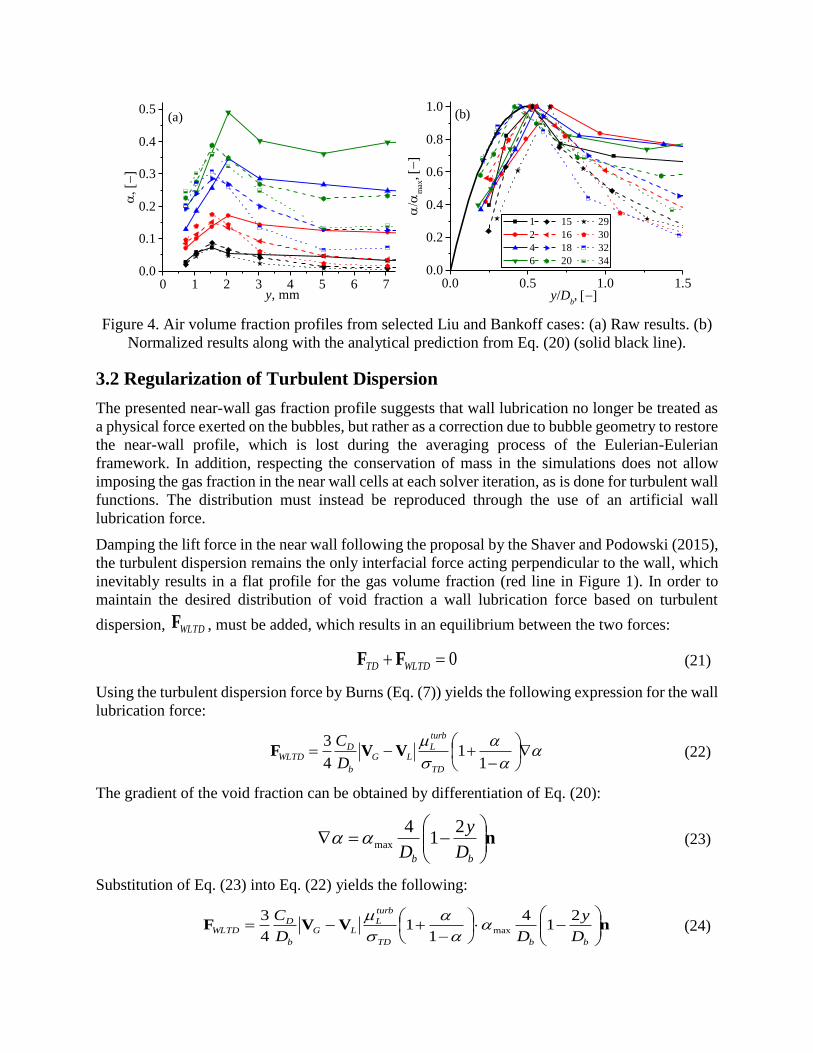
Figure 4. Air volume fraction profiles from selected Liu and Bankoff cases: (a) Raw results. (b)
Normalized results along with the analytical prediction from Eq. (20) (solid black line).
3.2 Regularization of Turbulent Dispersion
The presented near-wall gas fraction profile suggests that wall lubrication no longer be treated as
a physical force exerted on the bubbles, but rather as a correction due to bubble geometry to restore
the near-wall profile, which is lost during the averaging process of the Eulerian-Eulerian
framework. In addition, respecting the conservation of mass in the simulations does not allow
imposing the gas fraction in the near wall cells at each solver iteration, as is done for turbulent wall
functions. The distribution must instead be reproduced through the use of an artificial wall
lubrication force.
Damping the lift force in the near wall following the proposal by the Shaver and Podowski (2015),
the turbulent dispersion remains the only interfacial force acting perpendicular to the wall, which
inevitably results in a flat profile for the gas volume fraction (red line in Figure 1). In order to
maintain the desired distribution of void fraction a wall lubrication force based on turbulent
dispersion, WLTDF , must be added, which results in an equilibrium between the two forces:
0 WLTDTD FF (21)
Using the turbulent dispersion force by Burns (Eq. (7)) yields the following expression for the wall
lubrication force:
11
4
3
TD
turb
LLG
b
DWLTD
D
CVVF (22)
The gradient of the void fraction can be obtained by differentiation of Eq. (20):
n
bb D
y
D
21
4max (23)
Substitution of Eq. (23) into Eq. (22) yields the following:
nVVF
bbTD
turb
LLG
b
DWLTD
D
y
DD
C 21
4
11
4
3max
(24)
0 1 2 3 4 5 6 70.0
0.1
0.2
0.3
0.4
0.5(a)
y, mm0.0 0.5 1.0 1.5
0.0
0.2
0.4
0.6
0.8
1.0
max
,
y/Db,
1 15 29
2 16 30
4 18 32
6 20 34
(b)
The resulting formulation in Eq. (24) is not local as it depends on the peak void fraction value. To
remedy this, αmax can be expressed as a function of local void fraction with Eq. (20) and substituted
into Eq. (24) to deliver a local expression for wall lubrication:
nVVF
bb
b
TD
turb
LLG
b
DWLTD
D
y
D
D
yD
C 21
4
211
11
4
32
(25)
Further simplification of Eq. (25) yields the final form for the wall lubrication model:
2/,0
2/,21
11
4
3
b
b
b
b
TD
turb
LLG
b
D
WLTD
Dy
DyyD
yD
yD
CnVV
F
(26)
Note that the proposed wall lubrication force (26) has been obtained by replacing the void fraction
gradient with a function of bubble diameter and distance from the wall:
nyD
yD
y b
b
21 (27)
Consequently, this same procedure can be coupled with any turbulent dispersion model
incorporating this modeling approach; for example, if coupling to the RPI turbulent dispersion
model (Lopez de Bertodano 1998) the resulting wall lubrication model formulation would
resemble:
2/,0
2/,21
b
b
b
bLLTD
WLTD
Dy
DyyD
yD
ykC n
F
(28)
3.3 Model Stability and Limitations
The wall lubrication model advanced in Eq. (26) does not require the use of limiters nor tunable
coefficients to control performance, which greatly improves its general applicability and ease of
use. Further, potential numerical instabilities posed by the discretization scheme are minimized as
the model formulation does not depend on the void fraction gradient.
The model formulation ensures consistent and reliable performance for all sizes of the first wall-
layer element. If a very coarse mesh element is utilized the wall lubrication force is automatically
deactivated if the cell thickness exceeds that of the bubble diameter. Likewise, the wall lubrication
force is proportional to α/y in the limit of a very fine mesh element; this dependency guarantees a
strong repulsive force that automatically enforces the asymptotic limit that void fraction goes to
zero at the wall.
Spherical, non-deformable bubbles (low Eötvös number) of constant diameter that result in a wall-
peaked void fraction profile have been assumed in the model derivation. These assumptions remain
valid with increasing void fraction provided that the averaged cross-sectional profile of slightly
deformable bubbles is similar to that of spherical bubbles (Eq. (18)). In the case of a center-peaked
void fraction distribution, the model can be left intact as the negative lift force will repel the gas
phase away from the wall, resulting in a low void fraction very close to the wall and a
corresponding insignificant value of wall lubrication. These modeling assumptions breakdown for
further increases in void fraction where the flow regime transitions from bubbly to slug/churn flow;
in such a flow regime it is advised that the wall lubrication model be deactivated.
Equation (26) is readily extensible to poly-dispersed simulation approaches and can be applied
independently to each bubble group if multigroup equations are solved for the gas phase, as is done
for example with the inhomogeneous MUSIG model (Frank et al, 2005). Alternatively, if a certain
volume-fraction density function of bubbles αV(Db) is prescribed, as is done with Population
Balance Models (Marchisio and Fox 2013), equation (26) or (27) can be integrated over bubble
diameters:
max
min
,D
D
bbVbWLTD
WLTD dDDyD
y
FF (29)
4 MODEL ASSESSMENT
The proposed wall lubrication model (Eq. (26)) is tested on the simulation of selected cases from
the Liu and Bankoff experimental database (Liu 1989, Liu and Bankoff 1993a, Liu and Bankoff
1993b). To demonstrate portability and solver independence the model was implemented and
tested in both STAR-CCM+ v. 10.04.011 and a custom version of the twoPhaseEulerFoam solver
in OpenFOAM v. 3.0.1. Consistent with the results reported in Sugrue et al. (2017), no appreciable
difference was observed between the two implementations, and therefore only the OpenFOAM
results are reported in this work.
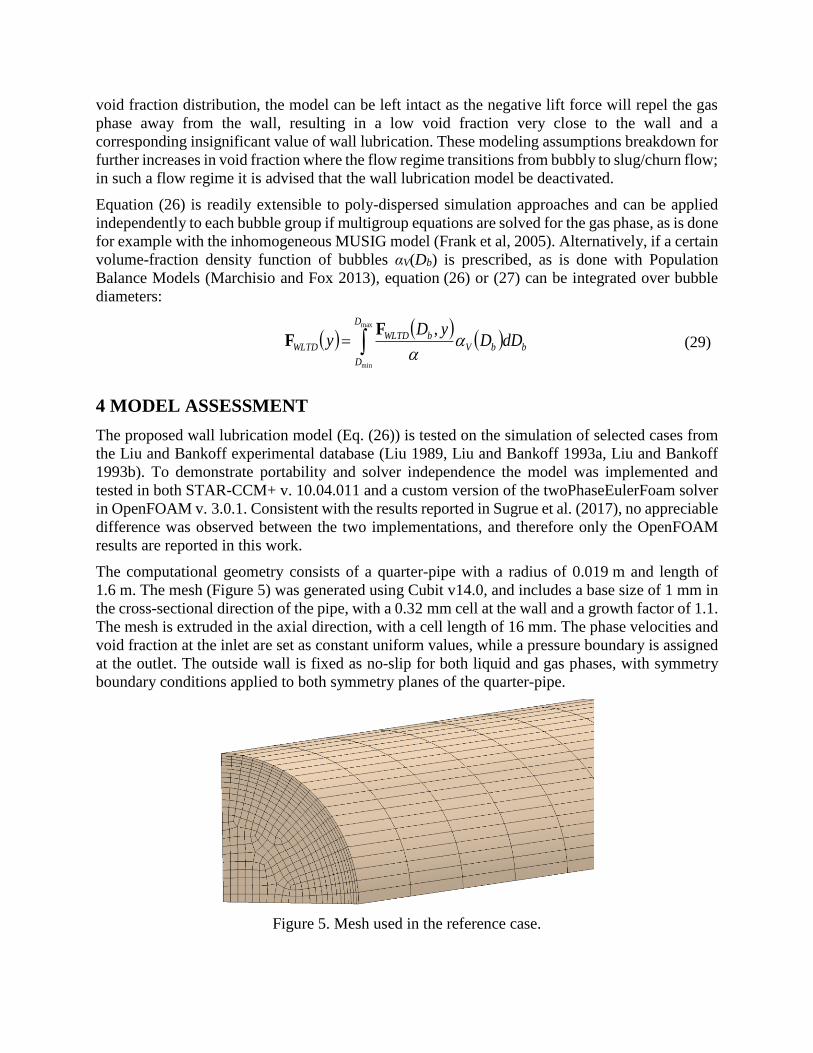
The computational geometry consists of a quarter-pipe with a radius of 0.019 m and length of
1.6 m. The mesh (Figure 5) was generated using Cubit v14.0, and includes a base size of 1 mm in
the cross-sectional direction of the pipe, with a 0.32 mm cell at the wall and a growth factor of 1.1.
The mesh is extruded in the axial direction, with a cell length of 16 mm. The phase velocities and
void fraction at the inlet are set as constant uniform values, while a pressure boundary is assigned
at the outlet. The outside wall is fixed as no-slip for both liquid and gas phases, with symmetry
boundary conditions applied to both symmetry planes of the quarter-pipe.
Figure 5. Mesh used in the reference case.

The standard k-ε turbulence model with standard wall functions is prescribed for the liquid phase,
while laminar flow was modeled for the gas phase. Tomiyama’s drag force coefficient (1)-(2) and
Burns turbulent dispersion force (7) are selected from the code libraries while a constant lift force
coefficient with the Shaver and Podowski correction (5)-(6), along with the proposed wall
lubrication model (Eq. 26), have been implemented into a custom version of the
twoPhaseEulerFoam solver.
4.1 Results
Figure 6 compares simulation predictions for three near-wall modeling approaches with the fully
developed experimental gas fraction, liquid velocity, and gas velocity distributions recorded at the
L/D = 36 measurement plane for Sets 1 and 32 from the Liu and Bankoff database (Liu 1989).
These two sets correspond to low and high gas fraction flow regimes, with their relevant flow
properties summarized in Table 2.
Table 2. Selected cases from Liu and Bankoff database (Liu 1989) used for model assessment.
Set 1 Set 32
JG, m/s 0.027 0.180
JL, m/s 0.376 1.087
Average void fraction α, % 4.07 11.0
Average bubble diameter Db, mm 2.678 2.995
The wall lubrication model by Antal et al. (1991) largely fails to capture the gas fraction profile
near the wall; as Antal’s lubrication force acts up to five bubble diameters away from the wall, it
pushes the gas phase almost entirely away from the wall resulting in a gas fraction profile that is
no longer wall-peaked. The Shaver and Podowski (2015) correction represents an improvement in
that it adequately captures the distribution in the bulk and predicts a near-wall peak; however, with
turbulent dispersion being the only force active in the near-wall region, this approach yields a flat
gas fraction profile at the wall. Lastly, introduction of the proposed wall lubrication model (26)
recovers the gas fraction peak without changing its behavior in the bulk. It should be noted that
the magnitude of the peak depends on the balance of the lift force with turbulent dispersion and
not on the near wall lubrication; the limitations in the generality of the lift force closure drive the
discrepancy in the peak values.
The significantly lower void fraction predictions near the wall that arise with the Antal model
further have a measurable influence on the buoyancy, with a reduction near the wall and an
increase in the bulk, ultimately resulting in profiles for liquid and gas velocity that do not capture
the characteristic flat experimental distribution, which is instead observed without Antal wall
lubrication activated. The proposed wall lubrication model produces velocity distributions very
similar to the simple lift damping, where the difference is related to the re-distribution of gas
volume fraction and corresponding effects on buoyancy near the wall. It is again the uncertainty
in the lift formulation that leads to inaccurate gas fraction peaks and drives the residual error in
the velocity distributions. The gas peak is overpredicted for Set 1 (left column), therefore
overpredicting the buoyancy in the near wall and driving an excessively flat profile; on the contrary
the maximum gas fraction is underpredicted for Set 32 (right column) resulting in higher buoyancy
in the bulk and less flat profiles.
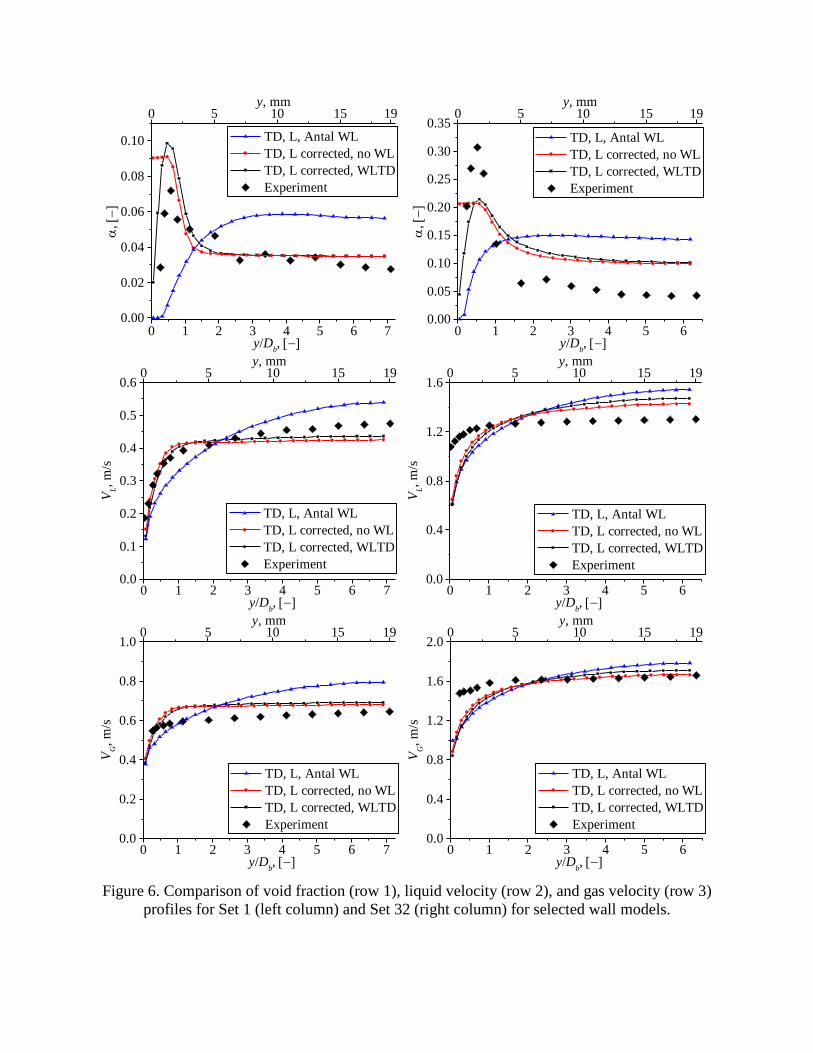
Figure 6. Comparison of void fraction (row 1), liquid velocity (row 2), and gas velocity (row 3)
profiles for Set 1 (left column) and Set 32 (right column) for selected wall models.
0 1 2 3 4 5 6 70.00
0.02
0.04
0.06
0.08
0.10 TD, L, Antal WL
TD, L corrected, no WL
TD, L corrected, WLTD
Experiment
,
y/Db,
0 5 10 15 19y, mm
0 1 2 3 4 5 60.00
0.05
0.10
0.15
0.20
0.25
0.30
0.35 TD, L, Antal WL
TD, L corrected, no WL
TD, L corrected, WLTD
Experiment
,
y/Db,
0 5 10 15 19y, mm
0 1 2 3 4 5 6 70.0
0.1
0.2
0.3
0.4
0.5
0.6
VL,
m/s
y/Db,
TD, L, Antal WL
TD, L corrected, no WL
TD, L corrected, WLTD
Experiment
0 5 10 15 19y, mm
0 1 2 3 4 5 60.0
0.4
0.8
1.2
1.6
VL,
m/s
y/Db,
TD, L, Antal WL
TD, L corrected, no WL
TD, L corrected, WLTD
Experiment
0 5 10 15 19y, mm
0 1 2 3 4 5 6 70.0
0.2
0.4
0.6
0.8
1.0
VG,
m/s
y/Db,
TD, L, Antal WL
TD, L corrected, no WL
TD, L corrected, WLTD
Experiment
0 5 10 15 19y, mm
0 1 2 3 4 5 60.0
0.4
0.8
1.2
1.6
2.0
VG,
m/s
y/Db,
TD, L, Antal WL
TD, L corrected, no WL
TD, L corrected, WLTD
Experiment
0 5 10 15 19y, mm

4.2 Mesh Refinement Study
An important aspect of the wall lubrication model is related to its behavior on varying
computational mesh sizes. To examine this sensitivity, a study was performed for Set 1 in which
the size of the near-wall cell was varied significantly, from 0.32 mm to 1.5 mm , with a constant
mesh base size of 1 mm and a corresponding growth (or reduction, for the case of 1.5 mm) factor
of 1.1. As observed in Figure 7, all cases produced similar results, with monotonic variations in
the void fraction and velocity profiles. The results in particular demonstrate how the model
correctly attempts to resolve the same void fraction distribution, where all points in the bubbly
layer are practically collocated at all mesh resolutions. The limited number of discretization points
however drives the overall reduction of the integral gas fraction in the near wall and the resulting
difference in the velocity profiles stemming from the altered buoyancy contributions.
Figure 7. Void fraction, liquid velocity, and gas velocity for Set 1 in grid convergence study.
5. CONCLUSIONS
A new wall lubrication model for Eulerian-Eulerian M-CFD has been proposed in order to improve
prediction of the reduction in near-wall gas fraction distribution that arises in bubbly flow. In
contrast to previous methods, which interpreted the lubrication force as a physical force pushing
bubbles away from the wall, this work brings forward a renewed understanding, where the gas
fraction distribution is a direct consequence of the a reduction in cross-sectional area of the
bubbles, by virtue of their shape, which is assumed as spherical. The new proposition has found
strong support from the inspection of both Direct Numerical Simulation and experimental data,
which demonstrate that no measurable liquid layer exists between bubbles and the wall. The
physical understanding has then been formulated into a robust model by regularization of turbulent
dispersion in the near-wall region. The consistent limiting behavior of the model has further been
discussed as a key to robust applicability in M-CFD.
Model validation has been performed by simulation of two representative cases from the Liu and
Bankoff experimental database, using a custom version of the twoPhaseEulerFoam solver in
OpenFOAM v3.0.1. The model confirms significant improvement in prediction of the near-wall
void fraction profile by comparison to the wall lubrication model by Antal et al. (1991). A mesh
0 1 2 3 4 5 6 70.00
0.02
0.04
0.06
0.08
0.10
y/Db,
y = 0.32 mm
y = 0.5 mm
y = 0.8 mm
y = 1.5 mm
0 5 10 15 19y, mm
0 1 2 3 4 5 6 70.0
0.1
0.2
0.3
0.4
0.5
VL,
m/s
y/Db,
y = 0.32 mm
y = 0.5 mm
y = 0.8 mm
y = 1.5 mm
0 5 10 15 19y, mm
0 1 2 3 4 5 6 70.0
0.2
0.4
0.6
0.8
VG,
m/s
y/Db,
y = 0.32 mm
y = 0.5 mm
y = 0.8 mm
y = 1.5 mm
0 5 10 15 19y, mm

refinement study has further demonstrated the model’s ability to be robustly applied on coarse
meshes, up to the point where it is automatically deactivated.
While the model advanced in this work is based on the turbulent dispersion formulation developed
by Burns et al. (2004), the underlying methodology in its derivation is entirely general and can be
applied to any turbulent dispersion model. This is also generally valid for the underlying void
fraction profile, which while derived here for spherical bubbles, can easily be modified to account
for other profiles, such as bubble growth on the wall due to boiling. Lastly, this methodology
naturally extends to poly-dispersed flows and can be seamlessly incorporated into multi-group
models.
All applications of the presented model formulation to general M-CFD conditions should carefully
review the underlying assumptions, in order to guarantee their validity. The present wall
lubrication formulation has been derived assuming spherical bubble shape in adiabatic flow
conditions, and therefore should be modified accordingly when simulating highly deformable
bubbles and/or boiling heat transfer. The model has been derived in combination with the Shaver
and Podowski lift correction to the near wall void fraction profile, the exact shape of this
correction, as well as the balance of lift and turbulent dispersion forces, are yet to be addressed.
Nonetheless, the resulting wall lubrication model represents a significant advancement in the
general applicability and provides measurable prediction improvements for simulation of bubbly
flows.
ACKNOWLEDGEMENTS
This work has been supported by the Department of Energy Consortium for Advanced Simulation
of Light Water Reactors (CASL). This research was also performed under appointment to the
Rickover Fellowship Program in Nuclear Engineering sponsored by Naval Reactors Division of
the National Nuclear Security Administration.
REFERENCES
Antal, S.P., R.T. Lahey Jr, and J.E. Flaherty. 1991. "Analysis of phase distribution in fully
developed laminar bubly two-phase flow." International Journal of Multiphase Flow 17
(5): 635-652.
Baglietto, E, and M. Christon. 2013. Demonstration & assessment of advanced modeling
capabilities to multiphase flow with sub-cooled boiling. Technical Report CASL-U-2013-
0181-001.
Bestion, D., D. Lucas, M. Boucker, H. Anglart, I. Tiselj, and Y. Bartosiewicz. 2009. "Some lessons
learned from the use of two-phase CFD for nuclear reactor thermalhydraulics." NURETH-
13: Proceedings of the 13th international topical meeting on nuclear reactor thermal
hydraulics. Kanazawa, Japan.
Biswas, Souvik, Asghar Esmaeeli, and Gretar Tryggvason. 2005. "Comparison of results from
DNS of bubbly flows with a two-fluid model for two-dimensional laminar flows."
International Journal of Multiphase Flow 31: 1036-1048.

Burns, Alan D., Thomas Frank, Ian Hamill, and Jun-Mei Shi. 2004. "The Favre Averaged Drag
Model for Turbulent Dispersion in Eulerian Multi-Phase Flows." 5th International
Conference on Multiphase Flow, ICMF'04. Yokohama, Japan.
Drew, D. A., and R. T. Lahey. 1987. "The Virtual Mass and Lift Force on a Sphere in Rotating
and Straining Inviscid Flow." International Journal of Multiphase Flow 13 (1): 113-121.
Frank, T., P.J. Zwart, J.-M. Shi, E. Krepper, D. Lucas, and U. Rohde. 2005. "Inhomogeneous
MUSIG Model – a Population Balance Approach for Polydispersed Bubbly Flows."
International Conference Nuclear Energy for New Europe 2005. Bled, Slovenia.
Frank, Th., P.J. Zwart, E. Krepper, H.-M. Prasser, and D. Lucas. 2008. "Validation of CFD models
for mono- and polydisperse air–water two-phase flows in pipes." Nuclear Engineering and
Design 238: 647–659.
Gosman, A.D., C. Lekakou, and S. Politis. 1992. "Multidimensional Modeling of Turbulent Two-
Phase Flows in Stirred Vessels." AIChE Journal 38 (12): 1946-1956.
Hassan, Y. A. 2014. Full-Field Measurements of Turbulent Bubbly Flow Using Innovative
Experimental Techniques. Technical Report CASL-U-2014-0209-000, Technical Report
CASL-U-2014-00209-000.
In, Wang-Kee, and Tae-Hyun Chun. 2009. "CFD analysis of a nuclear fuel bundle test for void
distribution benchmark." NURETH-13: Proceedings of the 13th international topical
meeting on nuclear reactor thermal hydraulics. Kanazawa, Japan.
Launder, B.E., and D.B. Spalding. 1974. "The Numerical Computation of Turbulent Flows."
Computer Methods in Applied Mechanics and Engineering 3: 269-289.
Liu, T.J. 1989. Experimental investigation of turbulence structure in two-phase bubbly flow.
Evanston, Illinois: Ph.D. Thesis, Northwestern University.
Liu, T.J., and S.G. Bankoff. 1993a. "Structure of air-water bubbly flow in a vertical pipe—I. liquid
mean velocity and turbulence measurements." International Journal of Heat and Mass
Transfer 36 (4): 1049-1060.
Liu, T.J., and S.G. Bankoff. 1993b. "Structure of air-water bubbly flow in a vertical pipe—II. Void
fraction, bubble velocity and bubble size distribution." International Journal of Heat and
Mass Transfer 36 (4): 1061-1072.
Lo, S., A. Splawski, and B. J. Yun. 2011. "The Importance of Correct Modeling of Bubble Size
and Condensation in Prediction of Sub-Cooled Boiling Flows." NURETH-14: Proceedings
of the 14th international topical meeting on nuclear reactor thermal hydraulics. Toronto,
Ontario, Canada.
Lopez de Bertodano, M. 1992. Turbulent bubbly two-phase flow in a triangular duct. Ph.D. thesis,
Troy, New York: Rensselaer Polytechnic Institute.
Lopez de Bertodano, M. 1998. "Two Fluid Model for Two-Phase Turbulent Jets." Nuclear
Engineering and Design 179: 65-74.
Lopez de Bertodano, M., R.T. Lahey, and O.C. Jones. 1994. "Phase distribution in bubbly two-
phase flow in vertical ducts." International Journal of Multiphase Flow 20 (5): 805-818.

Lu, J., and G. Tryggvason. 2013. "Dynamics of nearly spherical bubbles in a turbulent channel
upflow." Journal of Fluid Mechanics 732: 166-189.
Marchisio, Daniele L., and Rodney O. Fox. 2013. Computational Models for Polydisperse
Particulate and Multiphase Systems. Cambridge, UK: Cambridge Series in Chemical
Engineering.
Marfaing, O., M. Guingo, J. Laviéville, G. Bois, N. Méchitoua, N. Mérigoux, and S. Mimouni.
2016. "An analytical relation for the void fraction distribution in a fully developed bubbly
flow in a vertical pipe." Chemical Engineering Science 152: 579 585.
Marie, J.L., E. Moursali, and S. Tran-Cong. 1997. "Similarity law and turbulence intensity profiles
in a bubbly boundary layer at low void fractions." International Journal of Multiphase
Flow 23 (2): 227-247.
Mimouni, S., M. Boucker, J. Lavieville, A. Guelfi, and D. Bestion. 2008. "Modelling and
computation of cavitation and boiling bubbly flows with the NEPTUNE_CFD code."
Nuclear Engineering and Design 238: 680-692.
Nakoryakov, V.E. 1986. "Study of upward bubbly flow at low liquid velocities." Izv. sib. Otdel
Akad. Nauk SSSR. 16: 15-20.
Nakoryakov, V.E., O.N. Kashinsky, V.V. Randin, and L.S. Timkin. 1996. "Gas-Liquid Bubbly
Flow in Vertical Pipes." Journal of Fluids Engineering 118: 377-382.
Politano, M.S., P.M. Carrica, and J. Converti. 2003. "A model for turbulent polydisperse two-
phase flow in vertical channels." International Journal of Multiphase Flow (29): 1153-
1182.
Rzehak, Roland, and Eckhard Krepper. 2013. "CFD modeling of bubble-induced turbulence."
International Journal of Multiphase Flow 55: 138-155.
Shaver, D. R., and M. Z. Podowski. 2015. "Modeling of interfacial forces for bubbly flows in
subcooled boiling conditions." Transactions of the American Nuclear Society (Proc. of
ANS Winter Meeting) 113: 1368-1371.
Sugrue, R., B. Magolan, N. Lubchenko, and E. Baglietto. 2017. "Assessment of a Simplified Set
of Momentum Closure Relations for Low Volume Fraction Regimes in STAR-CCM+ and
OpenFOAM." Annals of Nuclear Energy 110: 79-87.
Tomiyama, A. 1998. "Struggle with computational bubble dynamics." Multiphase Science and
Technology 10: 369-405.
Tomiyama, A., I. Kataoka, I. Zun, and T. Sakaguchi. 1998. "Drag coefficients of single bubbles
under normal and micro gravity conditions." JSME International Journal 41 (2): 472-479.
Vaidheeswaran, A., D. Prabhudharwadkar, P. Guilbert, J.R. Buchanan, and M. Lopez de
Bertodano. 2017. "New Two-Fluid Model Near-Wall Averaging and Consistent Matching
for Turbulent Bubbly Flows." Journal of Fluids Engineering 139 (011302): 1-11.


![[Tech-lubrication]Lubrication Inst for BEVT S1501CII ... · Microsoft Word - [Tech-lubrication]Lubrication Inst for BEVT S1501CII_20130613R02.doc Author: EHickman Created Date: 11/7/2013](https://img.dokumen.tips/doc/110x75/5f063c3e7e708231d416f958/tech-lubricationlubrication-inst-for-bevt-s1501cii-microsoft-word-tech-lubricationlubrication.jpg)