Embed Size (px)
Citation preview

-, ,. , ,,~6 8 CI~1t ENGINEERING STUDIES ~R . . AL RESEARCH SERIES NO. 268 .
Metz :lteference Room Civil EnginGeri~g Department BI06 C. E. Building University of Illinois Urbana, Illinois 61801
A MODEL TO SIMULATE
THE RESPONSE OF CONCRETE
TO MULTI-AXIAL LOADING
by
HEDLEY E. H. ROY -:.
METE A. SOZEN
UNIVERSITY OF ILLINOIS URBANA, ILLINOIS JUNE, 1963


A MODEL TO S~MVLATE THE R~SPONSE Of CONCRETE TO MULTi-AX~AL LOADGNG
by
Mete A 0 Sozen
June 1953


,j 0
lei Object .. 0 0 0 • 0
1.2 Out]U~e of Studoe5 i 0 3 Ackb1o~1J ~ edgmen t s
T!1)3lE Of CONTENTS
[ntroductory Remarks ... , , . 0 •• , c
2,,2 2.3 204 205 206 207
Stress-Strain Relationships for Con~rets Rev~ew of Concrete Fai I~re lheor~es 8re5~er and Pester 0 0 0 0 0 0
McHenry and Karni 0 0 0 0
Re i tid us 0 0
Baker 0 0 0 0 0 0
DEVElO?ME~T Of A NEW FA~lURE THEORY
303 u;ltrodu.:tory Reril,ork~3
302 ?r~~~m~nary Models 3.3 T~a C~b~c Mode] a •
304 The F2~ 1ure Theory
'-'_ .; J-
~~~8ductory Remarks
- : . -::: :: ..: :-. t c r:1 ~=-ma r k 5 c ~ ceo • 0 0 0 a C 0 coo 0
5~-~: ~~ of Granular ~8d~3 U~der CGmb~~ad Ccmpress~ve
r,- __ -=:..-4 - - --
... - :: : :.
O~t~~~8 of Tests BehayJor of Test
6.3 Effect of Var~ab1e5 0 0 0 •
604 Discussion of Test ResuJts 6.5 Stress-Strain Relationship Obtainsd F~om Test Results.
3
4
4 4 6
10 12 13 21
23
23 24 27 32
40
40 4C~
42
4&
48
57
5:2
62 53 65 68 72

TABLES
f~GURfS 0
The fan ~ure Theory 0
AppeacatRon of The fan lure Theory to Concrete Under Uniaxial Stresses 0
Appijilcation of The fai lure Theory to Concrete Under Tr~axoa! Stresses 0
ExpersmentaJ Program 0
EXPfR~MENTAL WORK
Aol Test Specimens 0
A02 Concr(=te 0 A03 Castingp Forms v Reinforcement Ao4 Unstrumentation AoS Test Procedure u AoS Measured Load-Deformation Characteristics
DER li VAT H)~l S
R 0] Nod,=;B 5 0 0
802 Unconfined Ccmpression 803 Spira1 Reinforcement 0 604 Rectangular Transverse Reinforcement 0
75
75
71 78
80
82
84
123 il24 u25
027
tS7 2CH
204
:.. .~

Tab!e Noo
2
3
B 0 1
'·~v-
Rod Forces under Un~axia) Pressure - Reinius Model 0
Preliminary Reinius Fai lure Theory 0
fai l~re Theorv 0 0 0 c
Properties of Specimens and Concrete • 0
Test Results: Specimens with Ties Only
Test Results: Specimens with Ties longilt~dnnal Bars 0 0 0 0 0
and 4-Noo 2
Test Results: Specimens with T~e5 and 4-Noo 3 longitudinal Bars
Properties of Reinforcing Bars
Calcu!ation of IhBoretica~ Relat~ons for U~confined tcmpress~on . 0 q 0 , 0 0 0 0 0 Q 0 0
C3]CUJatnoUl of 'U'h~o~etnc,a1 Lcad-S-t:ajUl Re~atG0[13 for
82
82
83
130
132
133
134
135
215
)'bd:~d iCoillfarJ:3':::! bj S? rr3~ Resr;fc;ceS'2nt {Pro = 001 .;:0) 215 ~ u c"
Ca~cu)at~on of Thearst~~al load-Strain Relations for
;·{od.s; ~ Conf ~ n·:;:d 2 by 2 GL"'Gd
Load-Stra~n R8~at~o~s for Mode I Confinsd by Ractangular Reinfor~ement9 3 by 3 Grid
Strai~ Rela~ions fer Mode~ Conf~ned by Rectangular Reinforcement) 4 by 4 Gr~d 0 0 • 0 0
Area Relations for Mode1 Reinrorcament s 4 by 4 G: d oj 0 ;;, 0 a
Rectangu 1.a;
Load-Strain Re atiQ~s fo: Mcds1 Confined by Rectangular RBinforcement D 4 by 4 Gr~~ a • ~ 0 0 0 a
217
218
2}9
220
221
222
222
223

figure Noo
20 1 1
30 1
302
303'3
3 /1 o -r
305
306
-vi-
L!ST OF FIGURES
Stress-Strain Curves Measured from 3 by 6-ino Cylinders (Reference 2) 0 0 0 0 0 • 0 0
Stress-Strain Curves Measured from 7 by 22-!no Cylinders under Lateral Hydraul!c Pressure (Reference 3) 0 0 0 0 0 0 0 0 0 0 0 0 0 0 0 0 0
Load-Deformation Curves Measured from 5 by 5 by 25-ino P r i sm s (R e fer e n ce 5) 0 0 0 0 0 0 0 0 0 0 0 0 0 0 0 0 0
Load-Deformation Curves Measured from 5 by 10 by 25-ino Prisms (Reference 5) 0 0 0 0 0 0 0 0 0 0 0 0
MohrDs Circle Envelopes Karman and Boker Tests (Reference 9) o. 0 •
Comparison of the Linear and Quadratic functions Proposed by Bresler and Pister with Test Data from Richart s Brandtzae99 and Brown (References 3 and 12)0 0
ReiniusO Model (Reference 1)
Two-Dimensional ~odel
Stress-Strain Curves~ Reiniuso Theory (Reference 1) 0 0
Unconfined Concrete under Repeated Load1ng
2ake~Ds Lattice (Reference 17) 0 0 0 0 0 0 0 0 0 0 , •
~etrah2dia1 Model 0
J10del
.:::::·:2·:~ic DJ.agram of Proposed Cubic Mod·el 0 0 0 0
:2;le=ticn of Model under Unconfined Compression
~crmal Dls~ilbution Curve
Load-Strain Re1at~onshi?s for a S!ngie Ccmpression Strut Based on a Norma! Distribution of Effective Area v 50S t r a ~ ill 0 0 0 0 0 0 0 0 0 0 0 0 0 0 0 0 0 0
84
85
86
87
88
89
90
91
92
93
94
95
q .... - !
98
99
100
101

-\{ il ~-
307 Computed Load-Strain RelationshJp of Cubic Medel Based on a Normal Di5tribut~on of Effective Area vSo Strain 0 0 0 0 0 0 0 0 0 o. 0 0 0 0
308 Computed load-Strailro Relat!oUlsh[p TO;'" a S~n91e CcmpressnoOl Stn..lt Based on a Skewed Da:5trfibLltilon of Effective Area V50 StraIn 0 0 0 0 0 0 0 0
Computed Load-Strain Relationship for a Single Tension Strut Based on a Skewed Distribution of Effective Area V$o Strain 0 0 0
Predicted load V50 lon9~tudina] Strain R81atio~5hip for Unconfined Concrete Based on the Cubic Model
Predicted load V50 Transverse Stra~n Relationship for Unconf~ned Concrete Based on the Cubic Model
Stress-Strain Re1ations of aodv-Centered Cubic Array of Spheres (RefzrenGs 20~ . 0 coo 0 0 0
Stress-Strain Relat10ns of f~n9 Sa~d Qbta~ned Under rriax~a~ Compression ~RefeTenca 2~) D 0 0 0 0
Computed load-Strain Relat~8n~~lp 70r Concrete CQ:lfo~ed by ~PG ra ~ R:SJ&'lfcrc82;e::t
::iii an ~n 8'!-i Q':;: th~:; 2 ~y " :Gr rl u , u d.. ....
P 1 an VD ;e~i\lJ of -1-.1""0 3 t:,-y '? G;'"" J d t... ~ ~ i: .... ,;) 0 C 0 0 0
? ~ an ;JG e'iJ oi \ tn:8 4- 4 :G :- G d
Ccmputsd Load-Strain Relat~cn5h~p ~or Concrete Confined by Recta~9u1ar Re~~fc:c2mB~tD 2 by 2 Grid
Gcmputed Load-3tra~n Re}3t~o~3~~~ for CC~c;8te Conf!~ed by Recta~gular Re~nfo~:eme~tD 3 by 3 Grid
5010 lComputed loaD·-£tuaGUl R::d?-t~on:5.~ p fo: COJlcr,ete Confined by Rectansu;er Rei~fo~CB~e~t~ 4 by 4 Grid
Va~nataOITl of COIT:!puted Ma~;(frmt1m Load -'!1)th filne:ilZS3 of Grid - Rectangular rra~EYSr5e Re~:nforC2me~t a 0
Deflected Shape at Maxi~~m Load) 4 by 4 Gr~d -J'la 9 Ul ~ f J ca t ij 0 n ~ 00 x 0 0 ~ 0 0 " 0 0 0 0 0 0 0 0
;02
103
104
l05
106
107
iO]
108
109
1 J 0
j 11
113
113

u~ o~·
,A 0 10
-\ji~!-
Effect or ~!e Spacing en load-Deformation Relationship of Concrete Confined by Rectangular Reinforcement 0 0 0 0 0 0 0 0 0 0 0 0 0
Effect of longitudinal Reinforcement on LoadDeformation Relationship of Concrete Confined by Rectangular Reinforcement 0 0 0 0 0 0 0 0 0 0
Co~umn5 with Tues and No longJtudfinai Re!nforcement 0
Columns with Ties and 4-Noo 2 longitudinal Bars 0
Typical Stress-Strain Relation for Concrete Confined by
1 ! 6
~ 1 7
118
120
Rectangular Ties 0 0 0 0 0 • 0 • 0 • 0 0 121
Relation Between Strain at 50 Percent Maximum Net Load and Relative Tie Spac~ng 0 0 0 0 0 0 0 0
TypicaJ Stress-Stra3n Relation for Noo 2 Reinforcing
Typica1 Stress-Str2~n Relation for No. 3 Re!nforc~n9 Bars
Histogram for the Yield Stress of Noo 2 Reinforcing Bars
Measured Load-Deformation 1100 and J200 0 0 0 0 • 0
MEasured load-Deformation ~300 and 2100 0 0 0 • 0 •
Measured load-Deformation 2200 and 2300 . 0 0 0 0 0
:i1~2 :3 IJ;ed 3100 and
LC3d-Deformatlcn 3200 0 0 0 0 0 0
Measured Load-Dzfor~3t[cn 3300 and 4JOO 0 0 0 0 • 0
Measured Load-Defo~mation 4200 a~d 4300 0 •• 0 • 0
:Measured SiOa and
Load- Deforma t a on 5200 0 0 • • 0 0
Re1atoonsnzps fOii
for
for
Spec.nmen3
for r.- 0
,~pecu mens
122
137
139
140
i4.2.
143
144
145
146

- Lx-
f!qure Noo
Measured load-Deformation Relationships for Specimen 5300 0 0 0 0 0 0 0 0 0 Q 0 0 0 0 0 0 0 0 0 0 0 0 0 0 0
Measured load-Deformat~on Reiationships for Specimens 1102 and 1122 0 0 0 0 0 0 0 0 0 0 0 0 0 0 0 0 0 0 0 0
Measured load-Deformation Relationships for Specimens 1 i 32 and i 202 0 0 0 0 0 0 0 0 0 0 0 0 0 0 0 0 0 0 0 0
Measured Load-Deformation Relationships for Specimens 1222 and 1232 0 0 0 0 0 0 0 0 0 0 0 0 0 0 0 0 0 0 0 0
Measured load-Deformation Relationships for Specimens 1302 and 1322 0 0 0 0 0 0 0 0 0 0 0 0 0 0 0 0 0 0 0 0
Measured Load-Deformat~on Relat~on3h~ps for Specimens 1332 and 2102 0 0 0 0 0 0 0 0 0 0 0 0 0 0 0 0 0 0 0 0
Measured Load-Deformation Relationships for Specimens 2122 and 2132 0 0 0 0 0 0 0 0 0 0 0 0 U 0 0 0 0 0 0 0
Measured load-Deformation Relat~onsh~ps for Spec~mens 2202 2i:ld 2222 0 0 0 0 0 0 0 0 coo 0 0 0 0 0 0 0 0 0
,.~ 0 19 Measured Load-Deformation Relat~o~3hlps for Spec~mens 2232 and 2302
Measured Lead-Deformation R~]a:~onsh~p3 for Specimens 2322 aJ'Jd 2332 0 0 0 0 0 0 0 0 0 0 0 0 0 0 0 0 0 0 0 0
Mzasured Load-D2fo;~at~on R81at~o~3hlps for Spec~msn5 3103 and 3123 0 0 0 0 0 0 0 0 0 0 0 0 0 0 0 0 0 0 0 0
;; 0 22 MS33ured Load-Daformatio~ Rs13~~on3h1ps i~r Specimens 3133 and ,3203 0 0 0 0 0 0 0 0 0 0 0 0 0 0 0 0 0 0 0 0
3223 and 3233
M23sured Load-Deformation Rejat~onships far Specimens 3303 and 3323
,t; 0 25 Measured Load-Deformation Relationshlps for Spec~mens 3333 and 4102
P., 0 2S Measured load-Deformation Relat!onshIps for Spec~mens 4122 and 4~32 0 0 0 0 0 0 0 0 0 0 0 0 0 0 0 0 0 0 0 0
147
148
149
150
15 ]
152
]53
154
~55
1'-"',,::;)0
158
160
161
1:52

-x-
'=>J
UST OfF fuGURES (ContOd)
fiqure NOr. Paqe -.-':-
A02? Measured Load-Deformation Re1atio01ships for Specimens 4202 and 4222 0 0 0 0 0 0 0 0 0 0 0 0 0 0 0 0 153
!L28 Measured Load-Deformation Reiationships for Specnmens 4232 and 4302 0 0 0 0 0 0 0 0 0 0 0 0 0 0 0 0 0 0 !54
Ao 29 Measured Load-Deformation Relationsh~ps for Specimens 4322 and 4332 0 0 0 0 0 0 0 0 0 0 0 0 0 0 0 0 0 165
A030 Measured load-Deformatnon Relat~onship5 for Spec~meUls
5102 and 5122 0 0 0 0 0 0 0 0 0 0 0 0 0 0 0 0 0 0 0 ~66
A 0 31 Measured Load-Deformation RelatBo3lshfips for SpecBmens 5132 and 5202 0 0 0 0 0 0 0 0 0 0 0 0 0 0 0 0 0 0 167
Ao32 Measured load-DeformatIon Re1atioUlsh1PS -for Specimens 5222 and 5232 0 0 0 0 0 0 0 0 0 0 0 0 0 0 0 0 0 0 0 168
-, .......
lL33 Measured load-De'formatilon R,.c a at g on 5 h J p:3 for Specimens 5302 and 5322 0 0 0 0 0 0 0 0 0 0 0 0 0 0 0 0 0 0 n69
Ao34 }1·e3 S 1..l r'cd load-D·e'format B O&l Kelatio51sh2ps for Spec ~ men 5332 0 0 0 0 0 0 0 0 0 0 0 0 0 0 0 0 0 0 0 170
ar:., 0 35 Re~ationshjps of Load vso Straan iUl fa 1 lure Zone for Specimens 1102 and ! 122 0 0 Q 0 0 0 0 0 0 0 0 0 Q 0 0 0 17 !
.Ao35 Re1ationshnps of load '~:£ 0 Str<3af: ~U1 I\: Q
u a ~ lure Zone for Specilmens ! j32 a~d 1202 0 0 0 0 0 0 Q 0 ~ 0 0 0 0 0 a 0 1 72
Ao37 Re~atfioUl;sh~p5 of load VSo StrraGBl ~U1 fa[ ! rJre Zone for Sp.eC~m\=rns 1:222 aUld 1232 0 0 0 0 0 0 0 0 0 0 0 0 0 0 0 0
1'·..., u.;:;
A.o 38 R:21at~onshlp:s of Load V:3o St r2 L1 ~ Ul fa~ 1ure Zone "rOr Sp-ec~m2:!ls 1302 arid 1322 0 0 0 0 0 0 0 a 0 0 a a 0 0 0 0 i74
Ao39 R~ La t D en s hlp;3 not;: ...,J Load V50 St r:;d n In Fai 1ure ZOille for
r- 0 3332 aUld 2102 175 ;0p8C J m·ens 0 0 0 0 0 0 a 0 0 0 0 0 0 0
U /1 n ",.o-:'"v a,8 Lat ~ onsh il p:5 of Load YSo Str.afin in fa3 lure Zone for
Spedmens 2122 and 2!32 0 0 0 0 0 0 0 0 0 0 0 0 0 0 j 75
;~, 041 Rei2tJOnshnps of load VSo S'tr.anJl ~n fa1 1ure Zone for Speclm'eilS 2202 cu1d 2222 0 0
; '/1 0 0 0 0 0 0 0 0 0 0 0 0 0 0 l J ,)
Ao42 Relationships of Lead \ISo Str3~n [01 iFaJ lure Zone tor Specnmens 2232 and 2302 0 0 0 0 0 0 0 a 0 0 0 0 0 0 0 0 178

-XL-
UST OF
Pace ~
Relc:t1on~htps of l.oad VSo Stra~n [ n Fal 1ure Zone J:.r. ... t ...-Ii
Specimens 2322 and 2332 0 0 0 • 0 . 0 0 0 0 0 0 0 0 0 179
Ao44 Relat1onsh1ps of Load VSo Stra~n ~ n Fc:d lure Zoree ror Spec~men5 3103 and 3123 0 0 0 0 0 0 0 0 0 0 0 0 180
Re 12 t [ O~ sh r p::, of Load vso Stra~r: r n Fat lure ZOGe fe,t:
SpecIme05 3133 and 3203 0 0 0 0 0 0 0 0 0 0 l81
r"': '" ~ Cl i- C Ke ~2!..1 on~u [PS of Load vs.o Strain [L1 r- n
tieL tute- Zo::e fcr Spec[mE:r~s 3223 and 3233 0 0 0 0 0 0 0 0 0 0 c 0 0 0 0 I82
Relattorlshfps of Load V'So Str2~n tn Fa & lu.~e z'o:;ce fc~
Specimens 2,303 and 3323 0 0 0 0 0 0 0 0 0 0 0 0 0 0 183
Ao4-8 Re.latfonshrps of Load VSo S t ra G n in Fa~ lure z.o~.e fer' Specimens 2333 and 4102 0 0 0 0 0 0 0 0 0 0 0 0 0 184
Relatlonsh~p::: of Load VSo Strafin rn far lure ZO;'18 foD' Specfimens 4122 and 4132 0 0 0 0 0 0 0 0 0 0 0 0 0 0 0 18.5
Relationships Oi;:: Load vso Strcdn ~n Fa ~ lure Zc~e ~ror
c: • 4202 and 4222 ""pec! mens 0 0 0 0 0 0 0 0 0 0 0 0 0 0 186
Ao51 Relattonships or-, Loe.d vso Straln ~n Fa~ lure ZOLle fOIl'
Spec~mens 4232 and 4302 0 0 0 0 0 0 0 0 0 0 0 0 0 0 187
Relatfo:lshrps of Load vso St ra fi n tn fan !ure Zone for Specimens 4322 and 4332 0 0 0 0 0 0 0 0 0 0 0 0 0 0 0 188
RelatDonships of load vSo Strann ~n Fai lure Zone folJ" Specimens 5102 and 5122 0 0 0 0 0 0 0 0 0 0 0 0 0 0 0 i89
Ao.54 Relationsh8ps of Load VSo St ra nul in Fed lure Zone for Speer mens 5132 and 5202 0 0 0 0 0 0 0 0 0 0 0 0 0 0 0 190
RelatIonships of Load VSo Stragn In Faa lure Zone for Specimens 5222 and 5232 0 0 0 0 0 0 0 0 0 0 0 0 0 0 191
Re1:atiollsh~ps of Load '150 StraSrl in Fai lure Zone for Specfimens 5302 and 5322 0 0 0 0 0 !92
RelatIonship of Load vSo Stratn ~n Fai lure Zone for Spec ~ men 5332.0 0 0 0 0 0 0 0 0 0 0 0 0 193
Photograph of !nstrumentatfton 0 194
Specimens of Series 1 After Testing 194

-XI i-
L!ST OF FnGURES (Contle)
Specimens of Series 2 and 3 After Testing
Specimens of Ser i es 4 and 5 After Test1ng
Theoretical Relation Between PLA and E_ for Axial Co~pres5icn wfth Confinement pf8vlded 'by Spiral Reinforcement (p = 0.2 f~) .... 0 0 . c c:
Quadrc.nt of 3 by 3 Gr 1 d Hodel Shewing Assumed Def1ections . 0 " 0 . 0 0 . 0 0 0 0 0 0 0
Quadrant of 6, by 4· Gri d I"~cde 1 Shov>'r rig Assumed Deflections 0 0 0 0 0 0 0 0 0 0 0 .
Paqe
lee: oJ ...,
1°"" ..,;0
224
225
. 0 226
0 227

- 1-
i . HITRODUCT t OR
1.1 Gb i ect
The object of the thesis is t'r\'Ofotd: to develop a theo.eticcl
eKpla~2tion of so~e of the phen~~ena observed in tests of concrete under
different stress co~ditlons; 2nd to pre5~r.t the results of a test program
which ~,,'2S, conducted on 2 ser£E.S of c:;da:lly-ioa:ccd prisms ~:1th longitudtn2.1
The thc;cry I(.::--':ch \".!as developed gave.;; S::)Qd fepreseL1t2.tion of the
behavior of unconf1ned co~crete throughout the entire range of the load
deflection curve. AccordinglYr it \<':~s pos5£b!e to explc:in the ractors
respor1s1ble: for the f2ilure of concrete under this type of loading conditIo:;.
~n 2dciitio~s thG theory wzs extenced to the case of c~~fined co.~presslcn to
1 t lustrcte the effect of different types of ccnrlnerncnt.
1.2 Outline of Studies
(c::) Theory
Fo'lowing 2 r~view of some of the existing theories of f2i lure
which have been applied to concrete, a description is given of the develop
ment of a model which is assumed to be representative of the structure of
cement paste. The basic unit of the resulting model consists of non-deforming
sphere$~ cubical Iy 2rranged, and interconnected by elastic struts. Based on
observations of the beha' ,or of concrete, load-strain relations for the
component struts of the model are derived p and the behavior of the resulting
matrix is then studied.

-2-
The first loading condition which is investigated is that of
unconfined compression of concr~t~. The proposed model is subjected to
continuously increasing ccmpressive stra!n and the resulting load-strain
relations are d:!riv~d and compared with those obtained from tests of
concret~. Observations about t02 b~havior of concrete, which are implied
by that of th~ model, are discussed.
!n a simj lar manner, the mod~l is subjected to axial compression
and simultaneous uniform lateral confining pressure. The behavior of the
model is compared with that of concrete tested under triaxial ccmpression,
and the theoretical resuits are projact·ed to practical conditions a-fter a
consideration of the structur~ of concr~te.
Finally, th2 modal is applied to th~ case of a~ial }y-load~d
concret~ wh~ch is confined laterally by means of rectangular transvarsz
reinforC2rn3nt. Sinc.3 thjs t'jP~ of r~~nforcei1l~nt produc25 nonuniform
transv~rse pr~ssure, th~ theoretical solution is obtain~d by inyestigating
a n.e!j.,.:ork oJ str~ts, form:~d by 3t:addng a rn::mber of th,~ ind~vidu~l ClJD'cS
t0geth~r to form tha total structure.
1h-~ r~sult5 for thz condition of uniform lateral confinzm~n! .are
CCll1p.ared 'rlith thosz 'for d-;z condition o'r r·ectanguiar tr3n5'J~T5:~ r2i nforczr;v;r:1 ,
·3nd th; r~a50n:s for th~ di'ff~r;~nccS b~t':'''i;z·~n th~5~ t'fiO C3S~S r)n:~ di scusszd.
{b) E~o3rim~ntal Inv~3tiq3tion
A d~:scripticn is given of a sarlas of tests conduct~d on square,
ax;al1y-lcad~d col~mns confined by factanguiaf ties. A total of 50 5p~clmsns
'i':rerz t-~st:!d, all of which had dim'~nsion5 of 5 by 5 by 25 in., and ncrninai

-3-
concrete strength of 3000 pSG. The serges included 15 plann concrete prosms
as centrol specimens. and the volumetric ratio of the transverse reinforce-
ment in the remaining 45 specimens was kept constant at 0.020 '
The var~ables used, in the tests were the spacing and stiffness of
re n nfor cemen to
103 Acknowledgments
The work descrobed in this report was c.3rded OGJt Bn the Stn~cta.gra]
Research laboratory of the Department of elvi 1 Engineer~ng9 University of
ch3ractar~stics of reinforced concrete members sponsored by the Portland Cement
A s so;: 1 a ! j on 0
Th~5 raport is bas~d on a doctoral dl53artat~on prepared by H. Eo HD

-4-
2. FA.LURETHEORIES
2.1 introductory Remarks
an ord-zr to dra:'1J intel i igent conclusions fran tzst results .6lnd
in order to project thes~ results beyond the limitations of the test
conditions, it ~s necessary to have a theory of fal lure for the material
concarned. ~n Section 2.2, a brief discussion is presented of the obs~rv~d
load-deformation characteristics of concrete. A fll:ITlber of thzories h3'Je
been developed to explain various facets of the observed phencmena, but
they have been found to h~ve, at best, a limited application. in the
fo 1l owi i1g sect i ~ns ~ sc.'1'le of tn:3S2 th~or j es ~j 1 1 be out 1 j ned and th:e i r
limitations discussed. P3rt~cular attention wi 11 bg given to th~ theory ..;1.
proposed by ET1~n9 Rainius (l)-since it appears to agree quite closely
with the 3tructur~ and many aspects of the behavior of concrete.
2.2 Stress-Strain R~lationships for Concrete
(a) Unconfined toncTste
Figure 2.1 5ho~s typical lo~d-striin rs1ation3 for unconfinad
norma 1 y,:-e i ght 299 r.2g.at-e concrct8 subj ected to a;d a 1 ccmprzss ion {2). Th:a
strain .:3:[ ;jJ]ximt:m lo.ad tl5U,311y r3 ingz5 'frem 0.0015 to 0.0025. for strains
beyond peak lo3d j since thare 15 a sudden release in en~rgy aft9T the
m.a,Ximun load is r~3c;'ed.
;'~ N urn be r s r n par en the s e s ref e r toe n t r i e 5 i n t he 1 j 5 t 0 f ref ere. nee s .

-5-
(b) Confined Concrete
An extensive test progr@m was conducted by Ricnsit 3 3ra~dtz~e9
and Bro~",,"ll (3) to stlJdy thz behavior of concr3t~ under ccmbined ccmpr'e5$iv~
stre5S. SC""ne of thear re5~lts ~re scrr:mariz:ed in fjg. 2.2. They fO\.ind that
lateral confining pressures produce an increasa in strength and also in
deformation at and beyond p2Jk i03d.
1hz equation dzrivsd by th~ authors expre3sing the str~ngth oj
strength of unccnfin~d
f2 ~ confining prsssurs
~ichJrt, Brandtz33S ond 3ro~n (4) also tested a ssrl~s oj columns
T~3t3 carried out by Szulc!ynsk~ (5) cn ractan9ul~T col~rnns rein-

-6-
also prod~ces 5a~e oncrease in strength and con5Hderab~e ancrease un ductB aatyo
w~th iNOo2 ties at 2.~B[Jlo spacing and curves 3 to specImens wnth HOo.3 t[es at
The va:dabties Q...lsed ~"13r·3 amount of lateral reoruforccment v strength of
concrete and shape of cross sectiono The proposed equation of the strength of
of ~
.- u;not str,ength In ccrnpressijon
po =: ?Jnilt strzngth c o'f pr~5m without reD [)l'fOrc·~1v~nt
f2 =: uatsra1 confo:n[ns preSSlJf'cv
dat~rmJnad as th2 avsfage stress across a line joining the mBd-po~nt or two
adjacent 5!de.3o
which are applicable to
~,., • 0 cono:]1:Jcno
basic stress cond~tocn to which concrete can be 5ubjectedo Reonau5 (1)

-7-
suc\C,eeded hu deroving the portnon of the ~ .. mcoJrfiJ'led ccmpres500ilU ~[\2!rve:s [UP to
behav~or in th~s reg~on [s an inherent characteri5t~c of co~creteo
The maximum stress and maximum strain theor~ss are based en the
as~umpt~on that fal lure is dependent on stresses or 5trains in one princ~pa]
fact very clearlyo lh~ maximum strain theory may be applied to cases O~ which
::stretched by a
t thijs body contained at 1east one smal1 crack~ 3nd that

-8-
;~.
the cr2ckD ~a:s equal to the rate of absorptao!n of energy in the format~oln of
new sUrfaC8$o GrifflthDs theory 15 based on the behavior of the material at
the microscopic level v and so is difficult to apply to relatively large speci-
mens with nonuniform stress di5tr~butionso
Shear or sliding fai1ure theories have been applied quite extensively
to concreteo These theories assume that fai lure takes place by sliding a10ng
the sliding plane satisfy a given relationshipo
IT - tha norma1 stress on the plane of s~iding
AJ~ the shear fal lure theories are based O~ the same general assumptiong
wh~ch ~s that fai 1ure is dependent on the major and m~nor principal stressss g
ments hav~ ?:odu~sd resuit5 which conflict with thrs assumption to a certain
thus producing a sma11 value
of the intermed~ats stress; and they a1so subjected cylinders to 1arge
latera1 pressures and small end pres5ures 9 producing a h~9h intermed~ate stresso

-9-
The re5u~t8ng MohrBs circle envelopes for the fai lure of these specimens are
shown in fig. 205. The solid curve is the fai lure envelope for the condition
of high intermediate stress p and the broken curve is that for the condition of
low ontermedaate stress.
~t can be seen from Figo 205 that variations sn the Intermediate
principa~ stress produced strength differences of approximately ten percent.
On the basis of these results, B~ker (9) concluded that Mchros theory was
invalidated s and that the intermediate stress should not bs disregarded.
Re~rdus (0 tested concrete prDsms under ccrnb~lned axoal CaJtlPlfe:S5~0U1
and one-directional lateral confining pressure. The confining pressures ranged
up to 15 percent of the axial pressure. The result5ng strength i~crease wa~
a?proximats1y equal to the magnitude of the lateral pres5ure~ and henca the
strength was dependent on th3 ~ntermediate pr~ncipa1 stresso
The rzsu J ts of thas'z test s 9 and others conducted by ~'iast 1 tJ~d (] 0):)
and Bel Jemy (11), imply that Mohr 3 s theory is not correcto However~ the
~nfJ~e~~e of the intermediate principal stress is not sufficiently great to
be crJt[cal for applications to concreteo
A dra'flDack of .l1ohr ° s theory ! s that i j'l scme J nstances 9 as ~ n
C3se of col~mn5 ccnflned by rectangular ties s one or more of the pr~nc!pal
stressas may v3ry over the cross 5ectio~, and may also be difficult or even
3randtz339 (3) developed a theory based on the ass~mption that
concrete ls composed o'f a numb~r of nonisotroplc elern·ents v each .of wh~\Ch has
a faX8d:faa!L1re p1ane along w,ic.h slading failure may OCClJro ~Ul add3'ta0IT1 to
the possib~ lity of a plastic sliding failure D ~t !s assumed that the materia1
may fai 1 by splitting whenever the tensile stress in any direction reaches a

-10-
limotong va~ue rrto Hence 9 8randtzaegOs theory states that failure as caused
by simu!taneOllS OOspHttingOB and oOdisorga31~zoU19QO effects v the former being of
promary ~mportanceo The presence of an external lateral restraint replaces
much of the lateral tension in the elastic elementso BrandtzaegOs theory is
applficabie on~y up to the poant at wh~ch splilttong iaa iure occ~r5o
Many investigators have noted that all three principal stresses are
important for the condition of failureo Th;s fact is taken into account in
the octahedral shearing stress theoryv which is equivalent to the energy of
distortion theory and 50 subject to the same 1imitationso The octahedral
shearing stf355 is determined by the equation
Bresler and Pister (12) developed a theory using stress invariants
are defJned as follows:
U f'5 2 3
and
state of stress at any point on the s~rface can be expressed in terms of a

- 11-
shearing stress 'r and a normal stress cr 0 The BBmean stresses DO are obtanned S 5
by averaging these stresSeS over the spherocal surface
'>-'1h i ell 1 eads to
U a = ~ ( 0" 1 +0-2 +cr 3) = ±' ~ 1
T = __ 1 __ [(cr -cr )2 + (0' -0" )2 a J"15 1 2 2 3
=Hs Uj2_31/
12
~ t can be seen that the :lmc21n sneari ng stresS!,l is equa l to a constant
tjmes the octahedral shearing stresso The Olmean stresses ll do not contain the
third stress invariant J 3 , but Movozhi lov has shown that its effect is almost
Bres]ar and ?ister carried out tests on hollow concrete cylinders
:subjected to '\j3T'lous,ccmbh1atlcns of torslcn and a~dal io~do They attempted
to jITlterpret their data by two trial functions involv~n9 0'" and T as follows: 3 a
'r
"a fO = Al
c
and a quadratic function

, -12-
from the test resu1ts 9 and depended on the size of test specimen.
~n an effort to test the val~d!ty of thus theory, Oran (13}9 tried
to apply it to the results of the tests by Richart g Brandtzaeg and Brown (3)9
Series 29 3A and 38. The results are shown in F~g. 206 9 and Eqs. 2.8 and
2.9 9 developed by Bresler and Pister~ have been p!otted on the same graph
for ccmpa IT" B SO[ll.
figure 2.6 illustrates that the theory by Bresler and Pister is
not able to represent faithfully the phenomena observed over the whole range
of the tests by Richart et alo Not only do the speciflc curves der~ved by
Bresler and Pister fall to agree with the test results J but also each series
of tests produces a different curve) which suggeststhat the parameters
cr IfG and T If ° cannot properly be applied to the tests. a G a c
diameters. The specimens were sUbjected to a combination of internal pressure
a~d ax!a1 compression. The maxi~~m tens! 18 stress produced by the inte~na~
prsssure was between 7 and 12 p~rcent of the compressive strength of the
The generai trend of the results ~3S that eithe~ stress prod~:ed
2 reduGt~cn' in the maxlmwm value of the other stress. The very approximate
relation between the stresses which was ment~oned by the authors was that when
.:, .. :
.-...,;;'

~13-
either stress was at a value of 50 percernt of the strength for that stress
aione.9 the other stress was reduced by 50 percent o
The authors attempted to analyze the results in a ma~ner S1ffil ]ar
to that of Bresler and Paster (12)0 They piotted the relat~oinshap bet1?Iee01
the octahedral normal stress and the octahedral shearing stress at tal lureD
and found it to be essentially linaar g except near ccnd~tions of simple
compress!ve and sample tensi 1e strBsseso
No snng!e relatoonship bet1;,veen tn,e o:tahedral stresSeS cou1d be
app]ied to the whole range of the testso ihns fact~ together wath the data
presented fin figo 206~ results in the conclusion that faa lure theorIes which
are dependent on a relation between the octahedral stresses g or simi1ar
parameters D are invalid for concretso
is ccmposed of cement particles in various stages of hydraticn g ~nts~co~nscted
inforrn3t~onD Rainiu5 (I) dsvelopsd a model which he 3ssumed to be representa-
tave of structure of concreteg
F~g~re 207 shows a diagram of the Reiniu3 ~ode10 ~t cons~5ts of a
paste) arranged in a body-centered The bas~~ un~t is 3
cube w~ th a sphere at each corner and one in thB centero The center-to-center
spacing of the spheres in closest proximity to each other as aS5cmed to be a ,..
da stance.§.; heUlce the Length of oO"!e s1de of th.e::~be ~;5 2a/ .. 130

-14-
The spheres are onterconnected by a number of rods v analogous to
the need~e-]!ke crystals nn the gelo The rods are homogeneous 9 e~astflcv have
a constant modulus of elasticityv and are capable of carrying both tensi le
and ccrnpresslve forceso They are attached to the spheres by means of pinned
COii101P-ctaonso
~t is assumed that the bonds between spheres of spacing a can carry
transverse as well as longitudinal stresseso Accordingl~D they are represented
by four rods intersecting at point Ao Each rod is assumed to have length £4
and area A~o Two of the rods v AS and AG v 1ne in the vertoca~ plane passBng "+
through the centers of the sphereso The other two rods v AD and AEo ]~e ~n a
plane also passing through the centers of the spheres v but perpendicular to
p1ane ABta The angle of inclination of the rods is denoted by ~ as indicated
rods. These rods have lengths 1,9 12 and £~ and areas A1D A~ and A.3 D and carry i ~ ,L ~
The area of a face of the cube is considered to be unit yo Hence v
P and P v y Z
in the d~rections aT ths corre-
Re~nius prDport~cJled the areas a~d iengths of the rods a together with
under unrestrained loading in one directiono The results are:

=15~
AI = A2 = A3 =:l 4A4
.e1
=: .22 = .£ = 1 0 5-Z 4 ~2 0 ~ 0) 3
f3 = 55°
v -= 00144
Re~n~U5 next determined the forces in each rod when the structurs
is 5ubje~ted to uniaxia~ pressure P s P or P and ~5 unrestrained in the x y z
other t':'ciO durectBoUlso The results are s~mmarijzed ~'i1 Tabtie TIo The SOgOl con=
ventoo~ used flS that ccmpressoon is positive a~d ~e~50o~ negatnveo
The effect of unrestrained loading can be seen more readi ly by'
of for~e fg vertical strut PS and d~agona) struts PQ a~d PR wilD be 5ubje~ted
go J~to tensooOlo
fai lure is a=ccmpan~ed by tension crac~s which are usual~y para!~sl to the
and the aggregate or cement particles o
~t seems probable that when concrete ~s ~c3dedg the weakest tS~5~on
crystals w~ ~1 break firsts and in so doing w! 1~ 5~bject other ccmpr255ion
~16-
figo 2a8bo ~f strut QR breaks D the total force F must then be carried by
strut PS and hence addntional load is transferred to the system of struts STUVa
As the load is increased, the next weakest crystals 9 or their bonds. wi 11 fai 10
Thus v the number of tension fan lures and the transverse expansnon we]1 be
acceoerated with increasing loado
~f fal lure in tension is prevented v rupture of the concrete wi 11
occ.ur as a restdt of failure of the crystais !.Endler ccmpreS580Q1a
~n expla~ning the failure phencmeno~ by means of the Reonius mode~D
the behavior of the whole concrete mass can be studied by considering a single
cube a As can be seen frem Tab 1 e lv lmd'ei!" uno,est ra i ned ~ oad a ng P v rods 1 v 2 z
and AB (figo 207) are subjected to approximately equal tensi Ie stresses. since
throughout the structure can be simulated by reducing tha area of rods 19 2
and AB a5 tha lead is increased g whi 1a keeping the rod langths o the modulus
of elasticity E and the angle ~ constanta
Reinius first assumed that as the tensi Je crystals breaks the ceQ-
preS5~on crystals can withstand the resulting incrsased stress ~ithout faB ]ingo
The resulting rod stresses and deformations are gIven ;~ Table 2 for tension
~nordar to relate rod 3fS35 to the mag~~tudB of P D Reinius selected 2
so that the resulting curve for t~ansyerse dzformat~on
vs load was 5~m~ Jar to that cbta~ned frcm the tests of R~ch2rtD Brandtzaeg and
Q ""0· 'n l 11"\ &.1 J' ~Aju \\~) 0 The r~sults obtained by this means ara shown by the so1id curves
'~': ..
-17-
Reiniu5 noted that at high ccmpress;ve stre55es~ tha theor~ticaj
ere much less than th~ corresponding test results. He reasoned
di ff~renc~ ~;ias due to the fact that sane cal'lpr~sslon cryst.a is
Sjnc~ rod 3 ~:s the most highly-stressed cQ"TIpr~ssion rod in the
ass)..T:l~d that it r--::!duced in area at the sam<~ rate as ths t-el1S i on
1e the remaining ccmpression rods remained unch~ns~d. The results
lculations are given in Table 3, and the derived stress-strain
e the brok~n curves shown in Fig. 2.9. These curves agre'E! quite ..
-with test results. ~". ,. ~- -=:-". ~:.: . _ 7'_:
fXDlanation of Observed Phencmzn3
Using the model and fai lure theory outlined abova, Reinlus
several properties of concrete which have bezn observed in test
For th~ ~03t part these explanaticDs ~sre q~alitat~ve.
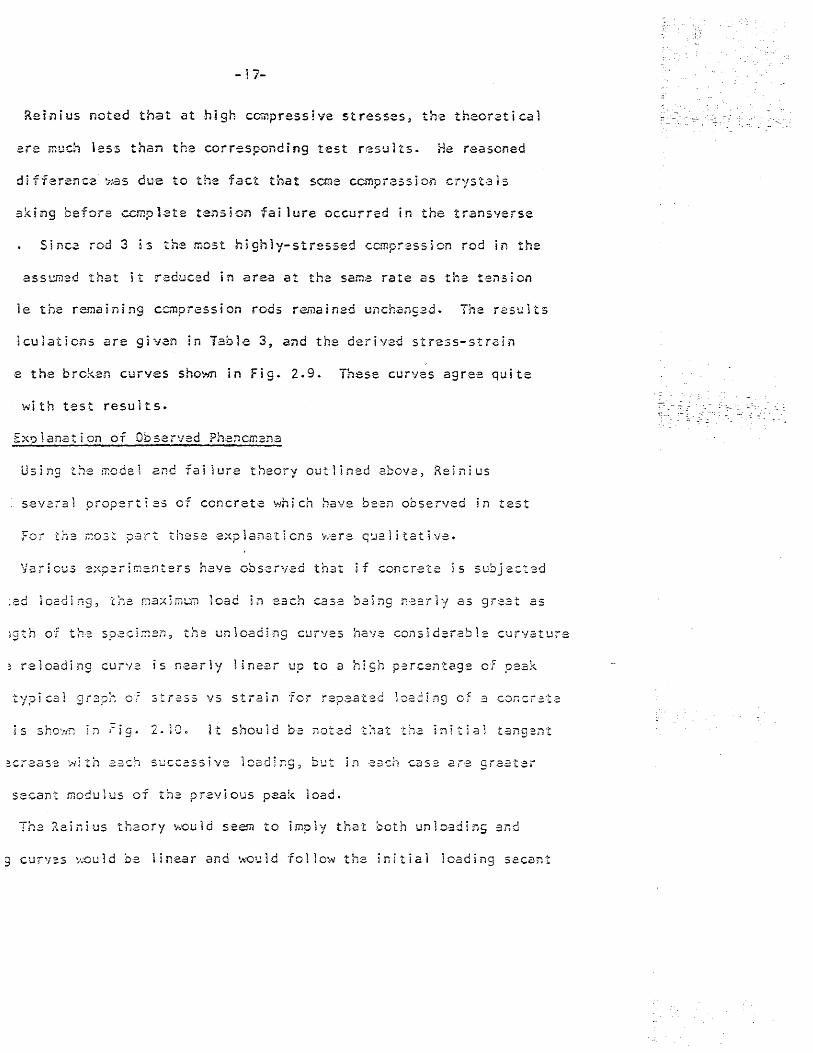
Various 2xparimenters have observed that if concrete is subjected
:ed l02di ng, t;"1:e ma;dmu-n load 311 eBch cas-: b.eing n-.:!3rly as great as
19th of th~ s?~ci~~n~ the unloading curves have considerable curvature
~ reloading curve is naarly linear up to a high p~rczntage of peak
typical gr3ph of stress V5 strain for repaated loading of 3 concr~ta
2. 10. It should . 0·8 noted t~at the initial tangent
acraas~ with ~3ch but in ~3ch caS3 are greatar
secant modulus of tha previous p~ak load.
Th:= ?einius thaory 'h'Ould s,eem to jm~ly that both unl0,3dsng :and
9 cur'Jes ».;Ouid be linear and '.-.lQuld -follow the initial loading secant

-18-
modulus line. However, Reinius explained the observed effect by postulating
that during unloading, crystals which had previously broken in ccmpression
now carry tension, with a resulting nonlinear unloading curve. Upon reloading,
less crystals are effective than in the initial curve, hence the modulus of
elasticity is less. The linear reloading curve is due to the fact that the
m,ajority of the effective crystals are those which '.f.oere not broken during
the in i t j a 1 j oad i n9 .
Another concrete property explained by Reinlus is the occurrence
of oblique fracture surfaces during ccmpression tests. Reinius suggested
that these fai lure surfaces initiate at a cavity on the lateral surface.
lhe presence of the cavity causes the horizontal tension members to begin
breaking in a diagonal line through the spec~men.
Heinius also made tests en 51 ~risms loaded to fal lure whi le lateral
diraction only. He found that the increase in strength was on the order of
thz magnitude of lateral pressure. The explanation given for this strength
i nCf;;CJS2 ~'1as :h~t 3 rearrangement of the rod st resses taxes place in th:8 mode 1.
Reinlus tabulat2~ rod stresses for a model with P = 0.5 P , and P = O. He y z x
that besic:;s ::~2 ~;~::2cted reduction in stress fer the horizontai members in
in a 5;~i l~: m2nn~r, the fact that concrete under three-dlmens;onal
ccrnpression has S:'2ater strength than l .. mder one-dimensional compression C2n

-19-
be explained by the resulting reduction in tensi le stresses. ~n spiral
colcmns, for example, if the spiral reinforcement is sufficiently strong,
'rai 1ure in lateral t'Bnsicn CEJfl b~ prevented cC[r,pletely. Rupture thus
results frem a failure of the ccmpression crystals.
Reinjus made another series of tests on concrete cubes which had
a preccmpreSSiCfl applied in the y-direction. After removal of this stress,
the cubzs were loaded to fai lure in the z-dlrecticn. He found that the
modtdus oJ elasticity for th,=s'~ CUD,es ... JaS lolf,'er than for simi lar cubeS !>nith
no pre loading. Also € was less, and € was greater than the transverse x y
deformation of cub,zs ~ith no lateral preccmpr,ession.
g,e in i U 5 ~ explanation for these results ~.as that 7'Jhen
mora fai ]UTZ5 take place in the y-direction than 1n the x- and z-directions.
Hance, the sffective area is less in the y-direction, giving greater ':::''j
':lallje~.
(d) O~SBrvations Concsrning the Reiniu5 Theorv
Re~n~us has ~2de an im?OTtant contribut~c~ to plain and rslnforced
ccncr~!3 technoloSj· Hls modal 2nd fai lure theory ara b33ed on observations
of the structure and beh3vior of concrete and provide an explanation for
Unjort~n3tely, the Re~~3u5 theory p03sasses scme li~itat!ons. ~n
t h ~ 'F j is t ? j ,::; C 3 t h 2 re 1 5 d Jl inc 0 n :5 j s ten eyre 93 r din 9 the fa i 1 u re t h 8 0 r y 0 'f
the rods break with 1 ' Joa~,
ccntage of? is transferr',ed to the three ciasonal cCr.l))rcssion mernb:ers, z

-20-
particularly rod AC. Thus, these three rods carry a greater proportion of
a greater load; however, the fai lure theory assumes that these rods do not
break.
Tests of plain concrete have shown that at strains beyond maximum
load there is a gradual decrease in load with considerable increase in
strain. However, the Reinius theory ~~uld produce only the increasing
portion of the load-strain curve, with no explanation for the behavior
beyond maximum load.
Another limitation of the Reinius theory is in its explanation of
the effect of confining pressure on the strength and deformation of concrete.
in tests by Richart, Brandtzaeg and BTo~n (3), for example, strains as high
as 0.06 and stresses as great as 24,600 psi were obtained fer confined
concrete.
!n attempting to explain thz effect of confining pressure by means
of the Rzinius model, it is more convenient to consider strain as the inde-
pendent variable rather than load. Since the struts an~ assurned to have
constant modulu3 of elasticity, t~e relation of strut area to magnitudB of
load could also De considered as .a relation bet'treen strut area .and 5traln~
10 obt.ain the load-strain curve for unconfined concrete, Reirdu5 assumed
that th::: aT.i:!3 of the v2rt i ca 1 struts (rods 3) ',<.'23 a lmost zero at maximc ... "'11
load and that the maxirru..!.-n load occurred at a vertica1 strain, Ez ' of
approximate1y 0.002. Hence, in order to be consistent, the same reduction
in area must be assumed at thls strain regardless of the magnitude of con-
fining pr~s5ure. It is obvious, therefore, that these vertical struts are
ccmpletelY inBffectual at the high strains obtained in tests of confined
concrete.

-21-
A simi lar observation can be made with respect to increase ~n
strength due to confinement. The vertical pressure is the st:m of the
stres5~S in th~ vzrtical struts and the vertica1 ccmponznt o'f th~ str'ess.es
in the dlagon.al struts. As has already bz,en pointed out, sinc3 tb:e Y:crtic.~d
struts are virtually ineffective at high stra~ns, the total Icad must there-
fore be carrLed by the diagcnal struts.
Th<; on l 'I \;1'ay these d iff i ell 1 ties can DZ reso 1 vzd us j Tlg t;'lZ R~ i n ii..15
modeJ is by assooing that the diagonal struts .ar~ c.:;Jpab12 of l;,dth5ta~diTl9
alrr:ost limitless strain and almost infinite stress. ~1o~;ev·er7 this eAplan.3-
ticn is inconS2stent with the assw-nptions made ccncern3ng th·e behavaor of
ths vertical struts.
j 5 ShO'Nfl in F is' 2. 11 •.
. . :rJ.~
pressure Inoucss t~n5icn in the mortar, psrpendicu13r to th~ dir~ct}cn of tha
.as a r'eS1J~t 0-[ the applied prcssurz p. Ma'31ber Be is 5tr'~$s~d in 'tension to

-22-
maintain equi librium, and accordingly represents the tensi le stress in the
mortar. The vertical shortening of the model induces compression in member
AD, analogous to the dir'ect compressive stresses in mortar.
The modulus of elasticity of the rings is assumed to be greater
than that of the mortar, since the former are ccmposed to a large extent
of densely-packed aggregate, more or less in contact.
8aker suggested that .lattices simi 1ar to that shown in fig. 2.11
may be developed on a s~11er scale, owing to transfer of pressure betwe;n
sand grains, and that microscopic lattices may also be "formed by the particles
of cement grout. However, he concluded that the governing influence in
concrete as a !?mola must be th:c stresses developed by pressur~ spanning the
voids between the stones, and that the ccmpressive strength of concTzt:e is
primari Jy a function of thz teDsi 12 strength of th~ mortar.
Baker investigated the b2havior of an elastic mod~l sim~ lar to
th2 dia9r~m sno'hn in fig. 2.1 L Tha model ~;as constructed of draper's
elastic, and the areas o'f t~je diagcn:=d memD'ers b"iere half that of the hori
zontal and 'Y8rtjc-el membBrs. Th~ Lattice ~Jas giver. an initial pr'Estress,
to pr9YBnt :any m.zmbers fran b:eccmifl9 ccmpressed during t·ests.
The model was subjected to.loads equivalznt to extern3l pressure
in concr8~:B, and ~h3 affect of 'end rBstraint on th'e behavior of th:e m~l1bers
w.as st 1Jci;:;,j. 3n addition, a study 'Was mad:e of the formation or cracks in
concrete, and their influ2nc~ en the force distribution among th2 lattice
members. This model investigation supported the previous conclusion that
tensi 1e forces are of primary importance in the compressive strength of
concrete.

-23-
3. DEVELOPMENT OF A NEW FAilURE THEORY
-3. 1 } n t roductory Rema rk s
The development of a theory to describe the behavio~ of concrete
under various conditions of loading is described in this chapter. The
basic concept of the Reinius model, that is, a lattice of struts representing
the oeedle-li ke crystals of the cement gel, seemed to be a i09ic~1 basis on
which to formulate a fai lure theory, since this concept agrees favorably with
the observed structure bf concrete.
Ona of the disadvantages of the Reinius model is that it is rather
ccmp 1 i cated to \"1ork ~Ji tn, /beCa~Js·e of the ccmp lex airangCii.ent of to'.: di ogona i
struts. Also, the model provides very little resistance to torsion in
ccmparison to its direct shear resjst~lnce. AccordIng!y, scm:e modjiica~ion
to the Reinius ~odsl is dzsirablz. ;n addition, fa i ! ure • l' 5n{)Ll~a
rn~tchin9 of test rasults in ordar to determina tha rod areas under various
loading c00dltlons~
-;:. , j 1 n3 l
crystals of tha cement 9?I. The rods are assumed to b~ attach2d to th2
spheres by pinnad connections.

-24-
In the following discussion of the preliminary models, only the ..: -
-_. final results of the relationship among the strut areas wi 11 be given. A
description of the method used to calculate these area relations is outlined
in Section 3.3, and the calcu1ations for each model are given in Appendix 8.
3.2 Preliminary Models
(a) Tetrahedron
Since a tetrahedron is the simplest stable three-dimensiona1
structure which can be constructed from pin-connected struts, it seemed to
be a good choice for a fai lure model. The tetrahedral model is shown in
Fi 9. 3.1.
In order to produce a structure with the same behavior in at 1 three
principal di rections, the areas of all struts must be equal. This is also
logical whan one considers that the strut lengths are al I equal, and so the
crystals IHhich Ilgro~li b'e'twe'en cemant grains should prcduc2cqu-ili areas.
The value of Poisson's ratio for this model is 0.22. Although this
valuz is sCJn2wnat hig:)) it is within the rans: of test results. nO'Ne'Jer, the
fact that tha same value of Poisson;s ratio is obtained, regardless of the
cholcE of strut areas, is a limitation, since valuss of v as lo~ as 0.1 have
bean obtained frcm tests of concrete.
Another dis3dvantagB of the model is its shape. In the first placE,
the j'!:OdBi is not conduciv2 tOU1= use of CartBsian cooidinat·es, which WOUld
be Y~ry d~5ir3ble, particularly when applied to rectangular members. in
addition, if a number of single tetrahedrons is stacked togather, they tend
-25-
to produce structures which are also tetrahedral in shape. For thls reason
it is not possible to subdiv;de a rectangular structure into a n~mber of
t-etrahedral units, wnlcss'tnz reiative size of th~ units is 50 small -diat
the analysis -of the resulting nzt~{)r!<. of stn..lt5 beCC.ffic5 extrem.ely laborious.
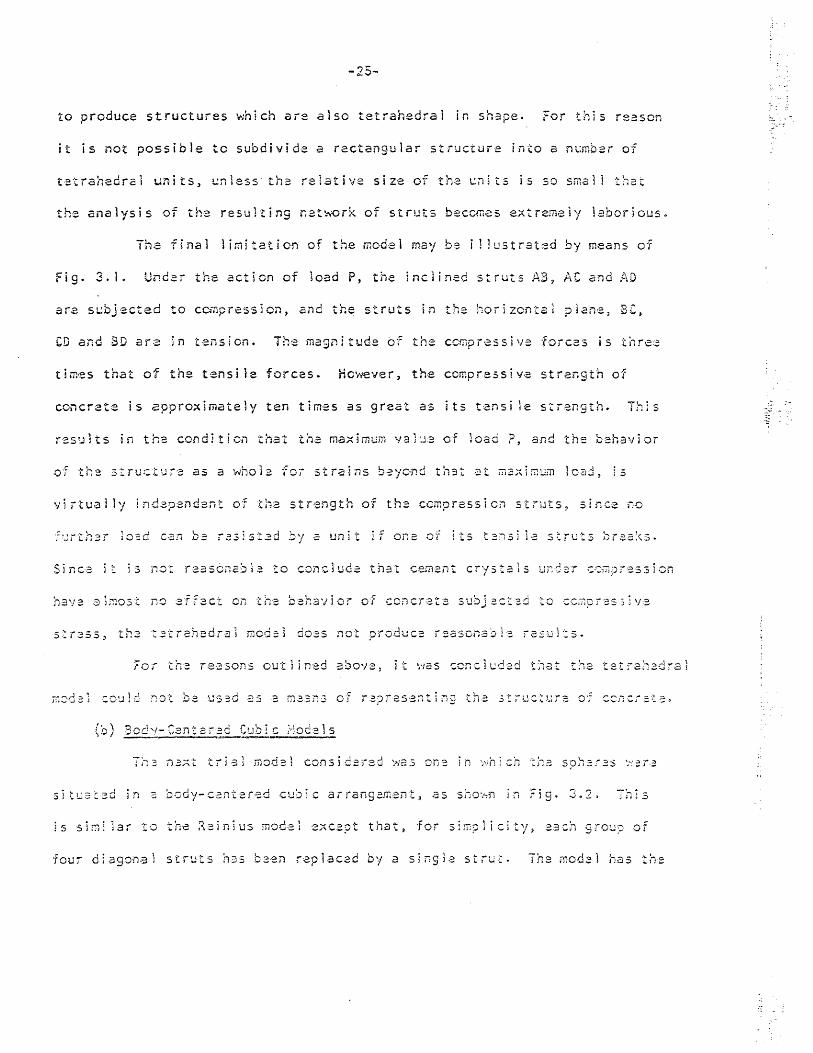
The final limitation of the model may be i J lustrated by means of
fig. 3.1. Under the action of load P, the inclined struts A3 g At and AD
are slJbJected to ccrl1pression, and the struts in the horizontal pian'e, Be,
CD and ED arz in t·ellsion. Tn~ magnitlJde of the cCii1pressiv= forces is -c{)re:;;
tim,es that of the tens!}~ forces. Hc~'€ver, the ccmpressiv,e strength of
concrete is approximately ten times as great as its tensi le strength. This .... .;-
resu1ts in the condition that the max;mum va]~3 of load 2, and the behavior
of the structuT9 as a whol~ for strains b~yond th3t ~t ~3Xlmum load, is
vlrtuaj 1y indz?sndant of tha strength of ths ccmpressicn struts, sinC2 no
ha~a almost no 8ffact on the behavior of concrete subjected to ccmpra5~lva
5~re5s, the t3trahedrsl mcd~] doss not produce rsasonabl~ Tesu!Zs.
For the rS3sons outlined aboy~, it ~as concluded t~at the tstrah~dra~
is simi lar to th2 Re~n1us model ZXC~?t that, for simplicity, each group of
four diagonal struts has been replacad by a singls strut. The mod~l has th~

-26-
disadvantage that it possesses no resistance to torsion, but it was thought
that if it produced reasonable results for other types of loading, it could
be modified to provide torsional resistance.
The notation used is simi lar to that employed by Reinius: The
areas of struts in the x, y and z directions are A1
, A2 and A3 respectively
and their lengths are LJ
; the inclined or diagona1 struts have length L4
and area A4
· In order that the model wi 11 behave simi larly if subjected to
unrestrained loading in any of the three directions, x, y or z, the areas AI'
A2 and A3 must be equal. As was pointed out in the discussion of the
tetrahedral model, this conclusion is also logical on the basis of crystal
growth.
As a first approximation, the diameters of the spheres were assumed
to be negligible with respect to their center-to-center spacing. Hence
ratio of O. It> under unrestrained compression. The result of this ca}cu~ation
the concept of crystal growth, that A4 should be greater than A1, Accordingly
the model does not produce a fEdsonable result, and must be discarded.
The f'lcx·t approach wh i ch was fo 1 lowed ::Nas to assume tna t the sph;er'~s
were of finite diarnetar. This produces tha result that the ratio L4/Ll is
llnkno~'m, but less than .[3/2, sjnce the spheres a-;e al! of equa; dia;-;;eter.
Again assuming that Poisson's ratio is 0.15 for 'Jnrestrain:ed ccr:lprBssion 1 the
'~l L4 quantity A4 -c;- can be sho,,", to be equal to 1.55. If L4/L] <.[3/2 then
.:-:;--,
- .

-27-
Aj/A4> 1.81. As in the previous case this result is illogical in terms
of crystal growth.
3.3 The Cubic Model
The model which was finally adopted is shown in Fig. 3.3. This
model was formed by assuming a sphere at each corner of a cube, connected
by struts along each~dge of the cube, in the x, y, and z directions. In
addition, on each cube face the spheres are connected by int~r5~cti~9
diagonal struts. The sphere diameters are assumed to be negligible compared
with their spacing, so that the length of each strut is equal to the distance
bet~~en the centers of the spheres to which it is connected. All struts are
ass~ed to be honogzneou5 and 'e last j c, to have constant modu 1\,.15 of e 1·a:s-
ticlty E, and to have equal stress-strain prOp3fties in both tension and
ccmpres5 i C'~.
Struts in tha x, y, and z directions are n~mb~red 1. 2, and 3,
and j\ " , r ';:5 :;::; C t i v -e i 'l.J , '" 01 !
struts 1 ~ 2, and
and ?3' respEctively. Tha d!agonal struts in th2 vertical planas (pars11al
.~ i1 d t r -3;J.5;;) i t fcrc:~:5
'? ; 5·
"0 • J1 •
'"7
in the horizontal planz5
Sines ths spheres are a55~med to be arranged in a cube, tne
relations amen; the strut lengths are:
L1 :::s 1..2 :::s L3 )
~ :3 LS ~ 1"2 l .... ,~ :"'1 ~r
(3. i)

-28-
As was mentioned in Section 3.2a, the relation of the strut areas
must be such that the structure has the same behavior in all three principal
directions. Also, from a consideration of the concept of crystal 9ro~th,
struts of equal length should have equal areas. Accordingly, it follows
that:
(3.2)
The only remaining unknown is the relation between areas Al and
A4 . This was determined so as to produce an initial value of Poisson~s
ratio (before any crystals begin to break) of 0.15, under unrestrained
compression in th'e z direction. Since th~ mod~l is statically indeterminate,
the calculation of tha relation betwaen A) and A4 involves equations of
equ i l i br i l..!m and ccmpat i b iii ty) as 'Nell as CO?'lS i de rat ions of sy:r:met ry.
Each cube is considered to be a s'eparate unit or nbuilding b~OCX."
These units are stacked together in a dense, face-to-face arran9am~nt to
form the total structure. Thus, the total area of each strut in the interior
of the st ru::turc in the x, y, and z d i reet ions is 4A l' '",h i J e that of the
interior diagonal struts is 2A,.,. Because of syrrmetry, the behavior of the ~
whole structure under unrestrained ccmpression may be determined by a study
of a single cube. It is further assumed that the area of each race of thE
c~be is unity, so that a stress in the structure in the x, y, or z directions
may be represented by a single force of the same magnitude and direction,
applied to the exterior of the cube.
' ........

-29-
The notation used isas follo~s:
tensi 1e forces and deflections
compress i V·8. forces and def 1 ect ions
applied compressive stress P z
(a) Eoui librium Equ~tions
+ ve
- ve
- ve
Princi~les of equi librium require that E F ~ o. Therefore, x
P 1 + ~2 P 4+ ~2 P 5 ~ a
Frcm syrrmetry in the horizontal direction,
A 150, L f :::: 0, z
(b) Cc~p2ti~i lilv Eauations
P. L. 6. ~ ~ (i = 1,2, ... ,5)
J A~· J i-
(3.3)
(3.4)
{3,5)
;.-.~ ::2:;~cted position oJ the modei is sho l;':11 in Fig. 3.-L~. )t has
mination c·f th~ ~cmp2tlbi lity reiations. The assl;mptions '."hieh doa-ff~ct
th8 ccm;:;atibility relations are that the dcflzctions ar,c sufficj~nt1y smail

-30-
that they do not cause changes in geometry, and that the deflected positions
of struts 1,2, and 3 are parallel to their initial positions.
Frcm fig- 3.4 it can be seen that
6 :::: _1_ 6 + _1_ 6 5 .[2 1 ~2 2
(3. 7)
and
(3.8)
Using the relationship
6. €j ::: t, (i :::: 1,2, ... 5) (3.9)
I
Equations 3.7 and 3.8 can be rewritten in terms of strains by ccmbining tham
with Eqs. 3.1) 3.2, 3.4 1 and 3.6.
(3.10)
and
(3. 1 1 )
(c) Determination of Relation B~t1t.-e,en Al .and A4
The equl librium and ccmpatibi lity equations which have been
derived can be used to develop a ganeral expression for Poissonls ratio
in terms of AJ
and A4 and, accordingly, to ccmlJute the relation b~tw-een
A I and A4 •

-31-
Rewriting Eq. 3.8 by means of Eq. 3.6 and using the length and
area relations of Eqs. 3. j and 3.2, the force in strut 4 may be expressed as:
A" P
"T
(Pl + P3) :::;
4 2.;1 I
Simi lariy, fra11 Eq. 3.7 the force in strut 5 is given as:
Ccmbining Eqs. 3.3 and 3.13 the relation between PI and P4
.~l$o, by ccrnbining Eqs. 3.12 and 3.14, P3 may b~ express~cd in
of ? 1 L~ ,
The equation for Pojssonas ratio, v, is
-? • 1 :::l--
" '3
~] 0'"'1/ ) S Ll b s ~ i t u t j 11 9 E q s. 3. 14 .3 n d 3. lSi n E q. 3. 1 5 ,
A ,I -, 1,1 :::;
;:[2 A l + 3A 4
(3.12)
(3.13)
(3.14)
(3~ 15)
{3. 17)

-32-
Assuming v ;;: 0.15, the relation between Al and A4 beccmes
This result is reasonable fra~ a consideration of crystal growth, since Ll
is less than L~. '+
The model which has thus been determined is capable of withstanding
torsion and direct shear as well as external tension, compression, and b·end-
ing moments. These facts, together with its agreement with observations
concerning the structure and behavior of concrete, imply that the model
should produce a reasonable fai lure theory.
3.4 The Fai lure Th~ory
Observations described by Reinius (1) and others (14,15) hays
ccrnpleX net~'iOT!< of randcmly-oriented crystals of various sizes connect
c.z:rnBnt grains in all sta9~;;s of hydratjcn. There'fore, it see.ms probable
that tha crystals wi 11 exhibit a graat variation in strength, bacause of a
nt.:mber oT ·r.~:::to;5 such as th~jr size, strength oJ bond to the surrounding
elements, 2~d a~sle ci inclination to tha loading direction.
~,c.;:~ distributions such ·B5 th-a strength of cement cryst,31s
occur Y~r1 ofce~ i~ ~2tur~. Statisticians, in an effort to describe such
HnorJ~ .. a·I' cur\.,J~li (;: :'·~_~I.j.:.:.i • .a""'J' 1"urv·.,=,ll (OI17). Th-=> 9~n;::.ral eq''''''l-'on 0+ <l'n" l'S r""vo I'S • • _ -. - __ -' ... _...., ",-,._ '- ........... , I.. _ ... J • ;"..

-33-
- 2 (x - x)
2 0-2
(3.19)
and a piot of the curVe is shown in Fig. 3.5 for the particular values a 2 1,
x = 2. The quantity y~ the height of the curve at any point along the x-axis,
-is kno~1"'l as the "probability density" or "frequency densityll of the particular
value of x involved. x is the mean value of x for t~e distribution, and rr is
the "standard devictioti,ll a measure of the probabi lity of encountering values
of x diff,zrent frcm x.
lt appears reasonable to apply the normal distribution curve to the
proble'll of crystal strength variation. Accordingly, if tn,:;: curve is used to
rzlatz strain and the n'..1hb~r of crystals '.--iilich break under load, th~ variabie
~~ corr;~~poild5 to a function of strai:1, a:-:d y corresponds to the number of
Sinc~ tha struts of the fai lure model represent crystals in the
C3ment P33t2, crysta1 braakag3s are represented by a reduction in area in
thareforz, the ~ariable y must correspond to a strut area, whi le x corresponds
to 3tr~~n or a function Of strain.
~Gr usa ~lth th2 f3} lure medal, it is mora convenIent to ~ork w1th
th~ norm31 curve equation in the form
y ::g 50 -x e - 2 (x - x) (3.20)

-34-
The constant 50 is used because at x = x, 50 percent of the crystals are
assumed to have been broken. The percent strut area remaining, A, then
becci1es
A = 100 - y, x < x (3.21)
A ::: y x > x
The final derivation of the fai lure theory for the cement paste
now reduces to the determination of constants k and x and variabie x. Since
tests of concrete and cement paste have shown that their strength is co;r,sider-
ably less in tension than in ccmpression, it seems obvious that two equations
are required, one for t~nsion struts and ons for compression struts. This
conclusion does not produce any departure frcrn the logical derivation of the
fai lurB tnBory, even though the struts are assumed to have equal stress-strain
pJ"operti,cs in both tension and ccmpressicn. The strength of t·Bllsion crysta1s
is largely dependent on the effectiveness of their bonds to the surrounding
elements, -whi 1e t:lat of the ccmpression crystals has no such depend·ency.
In proeliminary attempts to derive th-e araa-strain equatiens for
the struts, it was assumed that x was proportional to tensi Ie or compressive
str3in. 7hz constants k and x ~ere then determined as described below.
As sho'h'Tl in Fig. 2.1? ~Jh2n concrete specimens ar·s load·ed under
ccmpre5sion to high str~ins {2), the load-carrying capacity is practically
zero at a strain of CoOL H:2Dce, in the area-strain equation "for compre5sion
struts, the value of A should ba nearly zero at E ~ 0.01. Also, before any
load is applied to the strut C£ ~ 0), it seems reasonabl·e to aSSw'1ie that A
should be approximately 100. Based en these upper and iO'N-er limits, Llc

-35-
value of x was assumed to be at E ~ 0~005. The choice of k then determines
the exact value of A at the upper and lower bounds.
The load in the strut is given by the equation ? __ ::3_0EE, where E
is assumed to be constant. Figure 3.6 sho~s the 'ccmpression strut 1000-
strain relation for a range in k frcm 0.05 to 0.5. It can be seen that the
maximum load occurs in the vic!nity of x 2 AO
As a first approximation, the value of k was assumed to be 0.1.
The relation between area and strain for the ccrnpression struts is thus
given by the equation '..! 2
-0. 1 \' x - 5) { Y = SOe3.22)
where x ::llI € x 103
A {%) :::z 100 - Y ..... < 5
A = 'I x > 5
S;nce the tcnsi 1e strength of ccncreta is approximately 10 percant
OT its ccm?ressi'Je str,.cngth, and sinc,e th~ maxLm.:rn load OCC1JTS3t approxifj1at.zly
X =: X, In order
to produce an area-strain or load-strain r~lation whic~ 15 simi 1ar :0 that
strut area-strain relation may b2 ex?ressad: ~
lhhzre x :l:I E ;~
A(%) = 100
A ::3 Y
103
- Y x
, X
<
>
-10(x y :::s 50z
0.5
0.5

-36-
These fai lure theories for tension and compression struts were
then appHzd to the model shown in fig. 3.3, for the condition of unrestrained
compression in the z-direction. The resulting load-strain curve is shown
in Fig. 3.7. The broken curve has been plotted by ass~~ing continuously
increasing horizontal strains (€ and € ) J and deriving the related vertical x y
strains (E ) and vertical stress (P). The solid curve represents the z z
corraspondjng load-strain relation for the condition of continuously increasing
v·~ rt i ca 1 s t ra in.
The unusual shape of the curve in the vicinity of € ~ 2 x 10- 3 is z
an inherent characteristic of the general area-strain equation, and is not
dependsnt on the particular choice of values for the constants k and;. These
const:lnts were assigned ,a wide range of values in th:.e equations rOi both the
tension a;'1d ccnpT2ssicn struts, but the r~51J1ts in each case were simi lar to
that 5ho~n in Fig. 3.7.
Tn; i'cason for this ph.encmenon can be i Iltlstrat2d by consid·zring
t;1e ccmpat ~bi 1i ty .and equj librh.:m equatIons for the rr:odai Sh0'l'511 in ;ig~ 3.3.
fn:::m Eq. 3.11,
€ ::;: 2E - E z 4 x
'.t"\jh~;e r C z
:::l strai n i n m:~l1b:er 3
cL~ :::0: 3t;ai n in )'7;z;;:b-e :~ 4
and th·c equi 1 jbii'l.:m eq'.J3ticn involving Pi and P4' obtained frcm Eqs. 3.14 and

-37-
As is described in Chapter 4) this relation between P1
and P4 is
constant for all strains, sinc~ it depends on the relation between Al and
AS' which vary at the same rate throughout the entire range of strain~.
The relation between P l and Ex is similar to that shO'~m for
ccmpression struts in fig- 305. Thus, for values of € below maximum load x
in strut 1, P1
increases with increasing € -X
To satisfy equi libriL~ P4
must increase at the serna rate, and this increase wi 11 be accompanied by an
increase in €4 and a decrease in A4 - HO~Never, for hor i ZOi1ta i st ra j ns b.eyond
the maxim·urn value of PI' P4 wi 11 begin decreasing whi Ie A4 remains constant.
Hence the relation between E4 = P4/A4 and €x in this region wi 11 be simi lar
The ccmpatibilityequation may be written in incremental form as:
jt can be seen, therefore, that for absolute increases in E z
(6£ < 0), the condition z-
must be satisfied. Ho~eyer, thz shape of the Pl V5. Ex curve In th~ region
beyond peak load is such that
6f 4 > 1/2
so that increases in € produce decreases in the absolute value of £ as x z'
shown in Fig. 3.7.
-38-
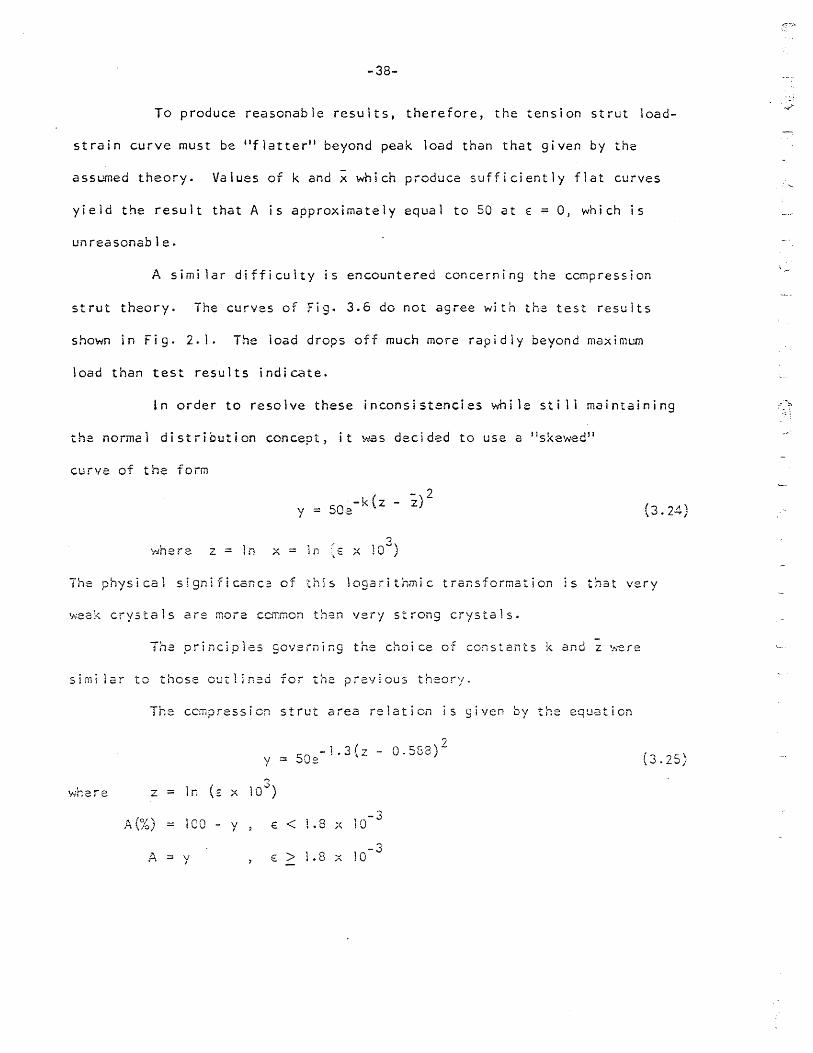
To produce reasonable results, therefore, the tension strut load-
strain curve must be "flatter" beyond peak load than that given by the
assumed theory. Values of k and x ~hich produce sufficiently flat curves
yield the result that A is approximately equal to 50 at E = OJ which is
unreasonable.
A simi lar difficulty is encountered concerning the ccmpression
strut theory. The curves of Fig. 3.6 do not agree with the test results
shown in Fig- 2- 1. The load drops off much more rapidly beyond maximum
load than test results indicate.
In order to resolve these inconsistencies whi le sti 11 maintaining
the normal distribution concept, it was decided to use a llskewed"
curve of the form
where Z = In x =
( -2 50
-k z - z) y = e (3.24)
The physical signlficanc~ of this logarithmic transformation 1s that very
Ir;eak crysta 1 s are more CD1:mOn tn3n very st rong crysta 1 s.
Ths principles governing the choice of constants k and z ~ere
simi lar to those outlinsd for the previous theory.
The ccmpression strut area relation is given by the equation
z =
A{%) =
A :::
?
y :: 50 e - I .3 (z
In (s x 103
)
O 5"Q)-- • Vv
100 Y € < L8 'V 10- 3 , A
v E > L8 .., 10- 3 I
A
(3.25)

-39-
The load-strain relation corresponding to this equation is shown
in Fig. 3.8. As can be seen: the shape of the curve for strains beyond
peak load agrees quite favorably with test results.
t~:he re
The area-strain equation for the tension struts is
z == In (E x
.0.(%) 100 - Y
A Y
y
'?
10'"')
E <
- >
? ~o -0.5(z + 1.61)_ e
0.2 x -~ 10 ....
0.2 -3
x 10
(3.26)
The resulting tensio!l :o&ci vs. strairl curve is 5ho\!~n in Fig. 3.9.

-4·0-
4. UNCONFINED CONCRETE
4. I ! n t r ad u c tor V R em ark 5
Using the model and rallure criteria described in Chapter 3, it
is possible to develop a theoretical load-strain relation for concrete 5ub-
j ected to unconfi ned co."1lpress ion. S i nee t:-e mode i is assumed to represent
cement paste, the relationships derived fro.l1 it \-\·i II be of necessity inde-
pendent of the qua 1 i ty of aggrega.te in the concrete. r-:ov<,cver, fa i I ure of
the model is dependent primari lyon the strength of the tensior members.
The only tension resistance in unconfined concrete ~s provided by the paste,
so th2t the sh2pe of the theoreticai load-deflection curve should agree
quite closely with the shape of measured curves.
A.s in the case of the Co 1 cu lat ions out 1 i ned in Chapter 3 to deter-
mine the strut area relation, the load-strain curves for the co~crete
structure as a whole can be developed by considering a single cube.
4-.2 Derivation of Theoretical Load-Strain Curves
;n determining the load-strain relations for the model, it was
ass~~ed that before any load is applied to the structure, struts 1, 2, and 3
have an area A. The corresponding initial area of struts 4 and 5. from
Eq. 3.18, is 0.769 A. As load is applied to the structure, Eqs. 3.2 and 3.18
ere no longer yalid~ since the struts wi 11 break at vary;ng rates. The strut
areas must therefore be computed from the area-strain relations given by
Eqs. 3.25 and 3.26.

-41-
Labore-tory tests of a co.'npresslon me.:nb:er are usual ~y conducted
by apply1r:g continuously increasing canpressive strains to the specimen r
2nd recording the corresponding loads. The difficulty in applying incre-
mental co,:npressive str2ins to the theoretical model, ho\.\<ever s is that for
2 give;l value of co:npressive strcin, the resulting forces in the struts
can~ot be determined di rectly. The force distribution among the struts
value of vertical strcln € = E_p the related strains [n Z oS
~n order;- to OVE.rCO::1e t!-:ls difflcuitYf it h'25 noted that test resu1ts of
~nconfined co~pression specimens indicate that continuously incre2s~ng
co.>lpressi ve ;·tra1ns induce increasing tensi ie strains in the di rection
perpendicular to the applied load. ft should therefore be p05s~ble to 2?PIY
lncremental horizontal tensi Ie stra~ns to the model and calculate the related
ve:rtic21 strains and ioads. By this method the proble.m can be solved directly
for each assu~eQ stro1n valwee
The first
noted that
The method of deriving the load-strain relations is described here.
IS to ass~~e a valce of € • x
= € ;:\
Then, from Eq. 3. to it mcy be
so that the ~El2tion of areas AI' A2 , and AS wi II be constant for any value
of € : x
(4. 1)

-42-
Equation 3.13 may now be rewritten
1\ r'lS A PI:=l 0.769 PI
1
Substituting Eq. 4.2 in Eq. 3.3
p '4
(.; '"l ) t ..... t. .:::
P4 may be obtained frC'n Eq. 4.3. Using Fig., 3.6 and the ccxn.p:.:ted valf..!c (Jf
P 4-' the qua n tit Y ~4 i s the n de t e rrrd n eo . Fin a ~ 1 Y. <:: :} i s de rive d f r (XII [q. 3. Ii 1
and p~ is then obtzined fr~ Fig~ 3.8~ j
Ali the unkno\,(,1 quantities have now been determined< z:nd the vertic.a:
stress Pis computed f ro:n Eq. 3,5. \-./hen t he above p rocedu re i s repea tee for z
succes5ive;y increasing values of E • x
the entire curves of loaa vs. deflection
and load vs. horizontal strain may be obtained.
The theoretical relatio~5hip between load and vertical 5tratn ~'S
shown in rig, 4.l t zf'ld that between load and horizontal strain is ShOw;1 i.n
fi 9' 4.2. The maxim~~ value of ? z
-3 is 5.37 AE x 10 '
4.3 Oiscussion of Theoretical Results
The theoretical load-deflection curve shown in Fig- 4. \ agrees
very favorably with test results. The ascending portion of the curve is
very nearly linear up to approximately 40 percent of maximu.m load. Beyond
this pOint. the slope of the curve decreases at an increasing rate unti 1 the
maximum load is reached. These properties are in agreement with observations

-43-
made by Rlchc.rt~ Srandt·zaeg and 8rOle>.71 (4). The ffiaX1mu.'TI load is reached at
c. vertical strain cf 0.0018, ~~tch is a1so \,<ell within the r2r.ge of test
resultse
The descending portion of the curve, at strains greater than
that at ffia;dmu:n load, is convex unt i i the lead has reduced to about 80 percent
or its max1mu:TI, and beyond this point it becanes concave. This pheno::isrEon
c.Iso 2sr~es ~[~h test result5~ as ~ay be illustrated by a co~part$o~ with :he
curves ShOh':""l in F i 9. 2. 1 .
The theoretical curve for load \!s. tr2nsverse stra[op $hCt"~ In
Fig. 4.2 r also agrees with the test results recorded by Richart f 6randtz2sg
2nd Erc\"::-1 (4';. The transverse tensi Ie strain [ncr-eases at a rather 5;0\\'
rate with lncreasing load unti 1 approxlmately 80 percent of maximum load has
b~en re&cnSQ. As the load is increas~d beyond th~s point, the transver~e
strains tncrease at an 2ccelerating rate up to ffiaxthl~T1 load. As vertical
co:npression is increc~ed beyond maXimtl.l1 load, the transverse strafn increcses
very rc:pidly. The value of the strain at maXimu.l1 load is about 0.Q009 8 w~i Ie
after only a 5 percent decrease in load it has reached a value of nearly 0.0023.
The ratio € /€ at ~~ximun load is about 0.5, which is sc~ewh2t loh~r x z
th2n the values observed by Richart, Brandtzaeg and Brown (4). However, this
fact does not suggest a limitation in the fai lure theory, since in the vicInity
of max[~~~ ioed, cracking caused by transverse strains ls extensive. For thi$
reason £t is almost impossible to obtain accurate measurements of the transverse
s.trains.

-44-
The f2i lure theory provides a very good insight into the behavior
of concrete under unconfined c~pression. The cQ~prcssive load P is z
resisted by co~pressive forces in meTobers 3 cnd 4. Forces P4 in turn • 1
i ri~wce
transverse tensions in members l~ p • z these
tension forces cause a reduction in areas AI' AZ' and A3 which is analogous
to fat lures in t~:e horizontal cement crystals of the prototype. fn the
v ~ c 1 n tty cf r.£x f r,~.\.rTI these tension ~trwts have reduced in area to such
an extent that further increases in strain produce a reduction in tensi Ie
forces PI' P2' and PS ' To maintain equi libriu~, there is a corresponding
reduction In P4' so that 2 greater proportro:1 of Pz
is resisted by the
vertical ~·truts. if vertical co:npressEon is continued, struts 3 wi 11 also
be strained beyond their maximu.-n capc;:cities, and beyond this point the value
of P wi 1 1 decrease very rapidly. z
The qUQntitative demo~stration described in th~$ chapter shows that
the observed behavior of unconfined concrete under axial canpression can be
simulated by the model developed in Chapte'r 3. ~hat is of significance in
the use of this model is that the shape of the load-deflection curve is pre-
dieted throughout the whole range of loading.
The effect of aggregate properties on the load-deflection curve
can be recognized by combining the known c~~pression-5train properties of
the cggregates w!th the response of the matrix. Ho~~ver~ it should be pointed
out that the use of different qualities of aggregate will not alter the general
shape of the curves in Figs. 4. i and 4.2. A useful device by which the effect
of the aggregate may be incorporated in the model itself is to assume that
-:

-4·5-
the strength ana modulus of elasticity of the aggregate is included in the
unkno\.'1:1 qU2ntittes A end E or the modeL Ho,<,t2ver, th§s devtce has the dis-
adv~ntase that the physical s!gnlficsnce of the model, 2S being representative
of ce::,.,;e.nt pa=te~ is destroyed. For this fe.cson p it is preferable to ass.ume
the ~ggresate properties to act in series ~ith the model.
The results of the model analysis 5u92eSt that the behavior of
<:::-e25 (;..~ 2nd K") at v2riou;,:) incre:nents or a;d21 s.tr2in E. , revea.ls titc:t at f v Z
[";'2;:': (r::Ui; i c? d r A, bc:.en rec(..tce:d to 16.2 percertt or its. .. \ or g 9l £":2 I ~
reduced by o~ly 50 percent. The load-strc.in relations fer
this . "-pOl ih. ere almClst entirety dictated by the beh~vtof' of the CO:TI-
ce.:-:-;ent cryste1s,. The close 2g.-eement of this descending portton of the 102.0-
stra:n c~rve ~1th test results is also an indication th2t the model describes
the actual behavior of concrete.

-46-
5. CONFINED CONCRETE
5.1 I nt roductory Remarks
The behavior of concrete under compressive stress and simultc'neous
lateral confining pressures is of considerable practical and theoretical
interest. Therefcre, it is desirable to extend the fci lure the·:)ry to this
loading condition.
Tests on concrete subjected to co~bined compressive stresses (3)
have sho\<r.'l that its strength ffi2Y be increased greatly by the action of COCl-
fining pressures. If the fai lure theory is to be of value in predicting the
behavior of concrete, it should. produce 0 corresponding strength increase.
!t is also particularly important to apply the theory to the case of concrete
confined by recti linear reinforcement, in order to interpret the results of
the test program described in Appendix A and the tests by Szulczynski (5).
Specificai ly, it should be possible, by means of the theory; to explain the
difference beth~en the effectiveness of rectangular and spiral transverse
reinforcement.
As has been described in Chapter 4, the strength of the model under
unconfined cQ~pression is largely dependent on the strength of the horizontal
struts, which are in tension. Since lateral confinement reduces the horizontal
tensi Ie strains and so increases the effectiveness of these struts, it shouEd
thereby cause an increase in the maxim~~ value of P . z
However, it is not possible by means of the theory as outlined in
Chapters 3 and 4 to explain the very 1arge increases in strength and deforma-
tion which have been observed in tests (3)~ From Eq. 3.5 it can be seen that

-4-7-
z is a function of forces P3 ~nd P4 only. The ma~imu~ v~lue of P3' as ?
determined by me~ns of Eq. 3.25~ end show:1 qualitatively in Fig. 3.8, i:
-3 -3 1.094 AE x 10 . Simi larly, the max~mum value of P4 1s 0.842 AE x 10 .
He.n ce ~ f ro:n Eq. 3.5, the maximu~ theoretical value of P is S. IS AE x iO-~. z
This represents an increase of only approximately 70 percent over the value
of P = 5.37 AE x lO-3 p derived in Chapter 4 for the case of unconfined co~z:
~resS"1on< As 5.hot·n in FiS. 2.2~ strength 1ncre2~es of much S'recter m2sn1tude
have been obtained in tests O~ confined co~crete.
Also, referring to Fig. 3.8 t it can be seen that the m2Ximu~ v~lue
-3-Ie. • ff E is incrc2sed z
beyond this vaiue, a reduction in P \1,:1 i 1 result. Kowever, in the tests by z
R1chart~ Brendtzaeg and 8,0\,,,-;1 (3), the ma~imum 102d was reached 2t strain::.
-3 ~~ h~Sh ES 60 x 10 •
The difficulties described above can be overco:ne by a cor:sldera:tic:-,
of the structure of concrete. The over-all structure is co:nposed of a sree:t
m2ny solid particies of aggregate and unhydrated cement grains, bonded together
by the cement paste. In the initial state, before any load is applied to the
structure, the spacing of these solid particles is extremely varied. S.ome
particles are contiguous, whi Ie in other parts of the structure the closest
spacing may be several particle diameters. As load is applied to the structure,
2nd the cement crystals begin breaking, an increasing number of particles wi 11
c~e in contact with each other, thus permitting a direct load transfer which
is dependent of the strength of the ce:Tlent crystals.

-48-
Since for unconfined ca~pressiont the strength appe~rs to be
mainly a function of horizontcl ter.si Ie forces, these gr2tn-to-grain
contc3cts are reiatively unirilportant. fn the case of confined co.-npress-ioi'i r
however, the large strains produced ~'111 cause a much greater incidence of
direct grain contact, so that the solid particles playa much grEater role
in the behavior of the concrete ffi2~S 2S 2 whole. In addition, the confining
pressures permit ioad to be carried by the structure even when no Cffii6nt
crystais are effectivc s thus cr6ating 2 condition \C:hich is independent of
the struts in the fai lure model.
In order to explain the behc:.vlor of confined concrete, it see.-ns
apparent that 2. study must first be made of the behavior of solid particles
under simi lar loading conditions.
5.2 8ehavior of Granular ~ledi2 Under Co:nbined Ca.npressive Stresses
A number of investigations heve been made of the behavior of an
array of granular particles in contact. Duffy and Mindlin (18) calculated
incremental stress-strain relations for a face-centered cubic arrangement of
elastic, identical spheres in contact. Thurston and Deresiewicz (19) enlarged
on these results and studied the problem of three-dimensional compression
applied to this model.
Thurston and Deresiewicz assumed the face-centered cubic model to
be subjected to equal confining pressures in the three principal directions,
fol lowing which uniaxial compression was applied to fai lure. They found that
fai lure occurred due to a "twinning!! process, in which one layer of spheres
was displaced through an adjacent paral leI layer, thereby forcing apart the

-49-
spher~s tn this adjacent layer. The fai lure stre~5 associated with th1s
loading co~dition is given by the equatio~
.f:: cr J6 + 8f 2
(0; = cr -../6 - ~·f
(5. !)
0
* (J tar lure stress Go
(J (0)
0 Initial isotrop1c p'ressure
f ~ coeff~ci~nt of frictioG of spheres
Thurston and Deresie~lcz also d~rived tota! lcad-stra1n relations
for the loading condition described 2bov~. 1n FIg.
,.. t_ .. h t.. I !.... .. (d .. .. \ ) ,,::1tC;; tS c. grap, relating 2GCltIOG2! ~mer.ston,ess stress and strain in the
direction of uniaxial cG.'7lpression. bn Fig. 5.1~ the fOllowing notation fS used:
c ~ addftfonal isotropic stress o
cr additional axial pressure cppl:ed in the z-direction a
(1"\' G ~J = initial isotropic pressure
o
For the particular case of (J = 0, the graph sho~:s the retation between axial o
and confining pressures.
Although the magnitudes of the pressures are ext-re.'11e\y sm2~i, it is
of interest to study the general shape of the curves in Fig. 5.1. It can be
seen that the stiffness of the structure increases with increasing strain. This
behavior is a result of the ideal n~ture of the model. The spheres are of equal
size, arranged in the densest manner possible, and are assumed to deform
elastically unti i the fai lure stress is reached.

-50-
Although the investigations of Thurston and Deresiewicz provide
an insight into the behavior of an ideal granular medium, their resuits
cannot be applied to reel aggregates such 2S occur in COrlcrete. In a materia!
such as sand, for exampie r the size and orientation of the particles may be
extremely far,dan. [n addition 1 unde"r the action of cOOipressLve stresses,
iocal and ger;eral f&i lures of the groins take place.
Sc:ne typical results of dra~ned triaxial tests on fine sand (20 t 2l)
c:re sho\<-:,) in Fig. 5.2. The curves in Fig. 5.2 show the relation bet ... :een
( () 1 - () 3 ) and a x i a 1 comp res s i ve s t r a in, .... :, ere
G, = axial pressure
cr3
= laterai confining or consolidation pressure.
As in the case of the results shown in Fig. 5.1, the magnitudes of the
pressures are smol 1. However~ the qualitative stress-strain relations are
of great importance in providing an understanding of the behavior of the
aggregate and cement grains in concrete. As can be seen, the stiffness
decreases with increasing strain. Also, as might be expected, dense sands
are much stiffer than loose sands.
Before the behavior of confined concrete can be interpreted, the
effect of confinement on the model must be investigated. The results of this
investigation, together with the observed stress-strain relations of aggregate
particles should then enable the desired c00clusions about the behavior to
be made.
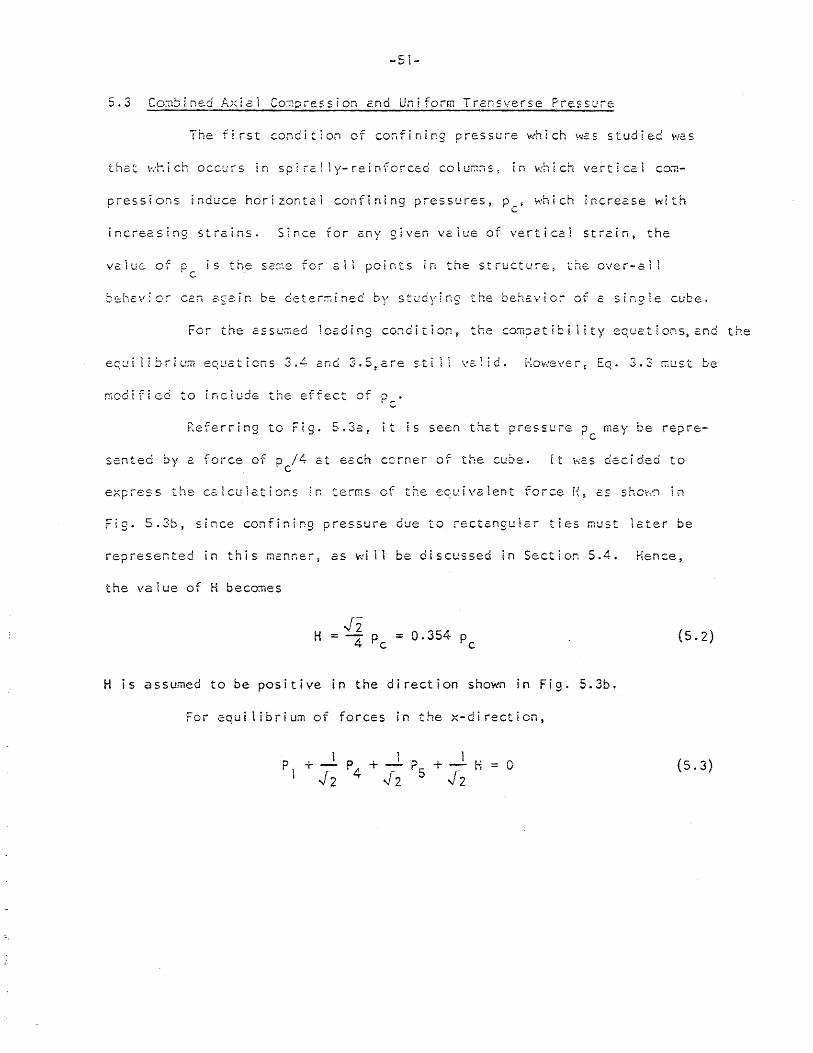
5.3 Co;nbine.d AXIal CO::1pression 2nd Uniform Transverse Pressure
The first condition of confining pressure ~hich was studied was
that h'hich occurs in spirally-reinforced colur:1:1s.~ in \<:;"ich verticai cO:TI-
pressions induce horizontal confining pre5sures~ Pc F which increase with
increasing strains. Since for any given value of vertical strain~ the
value of 0 is the same for al I points 1n the structure. the over-all 'c
b~h2vfor can 2gain be deter~ined by studying the behavior of 2 single cube.
For the o5su!i;ed loading condition, the co:npatibility equc:tions~2nd the
equi ilbr1um eq~2tIcns 3.4 and 3.5:2re sti Ii valid. However; Eq. 3.3 must be
modified to iGciude the effect of p • c
Referring to Fig. 5.33 t it is seen that pressure p may be reprec
sented by 2 force of D /4 at each cerner of the cube. (t was decided to 'c
express the calculations in terms of the equivalent force H~ 25 shc~~ in
Fig. 5.3b, since confining pressure due to rectangular ties must tater be
represented in this manner p as wi 11 be discussed in Section 5.4. Hence~
the value of K beccxnes
(5.2)
H is assumed to be positive in the direction shown in Fig. S.3b.
For equi librium of forces in the x-direction,
p + 1 P4
+ __ 1 P + __ 1 H = 0 1../2 .J 2 5 J-2
(5.3)

-52-
The method of determining the load-strain relations was simi tar
to that out lined in Chapter 4. It was again assumed that the independent
variable was E , which was increased in successive increments over the x
entire desi red ronge.
From Eqs. 5.3, 3.13, and 3.18
(5.4)
t n order to co;npute the va 1 ue of H tit was assumed that the sp ira l
steel had an ideal elasto-plastic stress-strain relation, and that its yield
5 t res 5 \<,12 S 50 I 000 psi. 3 I 6. 1 f Assuming E = 0 X 10 pSI, the va ue 0 strain at
-3 yield = 1.67 x 10 In accordance with these assumptions, the value of H
increases 1 inearly with €x' reaching its maximum value at Ex = 1.61 x 10⁻³
,
Beyond this strain, H remains constant.
Accordingly, the value of H is given by the equation
H =
H
H max
H max
x 1. 67 E
X
€ X
< 1.67 x 10- 3
> 1.67 x 10- 3
.. c.: 5) \ ..J •
Using Eqs. 5.4 and 5.5, together with the area-strain relations
given in Eqs. 3.25 and 3.26, the load-deflection relation can be determined.
The result of these calculations is shown in Fig. 5.4 for an assumed mnxi~um
-3 value of p of 0.1 f' = 0.537 AE x 10 . c c
The maximum -3 load is 6.7 AE x 10 • or
124.5 percent of the calculated maximum load for unconfined concrete If~ Chapter
4, and the value of H max
-5 in Eq. 5.5 is 19 AE x 10 .

-53-
5.4 CO:7lbined Axial ComDreSStOl1 2nd Concentr2tE:C Tr2G~\'erse Forces
The final confining pressure cond[t1on investig&ted was that which
occurs !n columns confined by rectangular ties. Since this type of tr2nsverse
reinforcement provides little lateral restraint along the sides of the column~
for ties of the size normally I •
usee in it ~2S assumed that the effect
of the ties could be represe~ted by 2 single hcrizon~21 force 2t each corner.
The value of? is no lo~ser co~st2nt over the cross sectfon s as c
sider2tlo;'"i5 of 2. singie cube. The ITdsthod of so;ut[o:-~ \-<hfch v,c:s rei iO\¢.'3d ~-':2S
to divide the cross section into successively finer grids~ ~~ich is equ[valent
to assumtng successively sma 1 ler cube s1zes with respect to the size of the
colu:-r;n. Ds~ot:n9 the nu:nber of cubes ~c1ons ~cch ~{CS of th~ Coh,t:7ir; by n~ the
IOed-deflection relation was determiGed for values of n ; lp a~ sho\~ in
Fig. n ; 2, 2S in Fig. n = 3, 25 in Fig. 5.6; and r. = 4, as tn
Fi g. 5.7.
For the sake of simplicity, the axial spacing of the ties was assumed
not to be a v~riabie. To achieve this condition, it "-las considered that the
force H was applied as a line load, of intensity 2H, over the entire length
of the specir..en. In all cases the cubes were assumed to have a dimension of
one un: t, \".j th the resu 1 t that the magn i tude of H \,,:2S i ncreas.ed 1 i near ly wi th
the value of n) in order to produce the same relative effect.
-54-
As cGn be seer., the shape of the cross section was not var!ed, the
only condition studied being thct of B square column.
tn order to COZlip&re the effect of $p:ral reinforcerner.t i-dth th2t of
rectangu!af ttes: it wc.s cssumed that the average stress 2crc~s, an axral
sect i 0::1 rerr.a E ned constant so tha.'t for n :;:: 1. the value of f. fn Eq. 5.5 is max _t:;.
19 AE x to -, and for n = 2,
(c:) n =
For the case of n = If the conditions ere identical to that for the
sp,ral1y reinforced COtUTtrl, as investigc:ted in Section 5.3. The resu1ting
los.c-deflcsction curve ls,thcrefore as show-:1 in F£g. 5.4,: ~rid the value of the
max£mum load is ~24.5 percent or the maximum load for unconfined concrete.
(b) n == 2
it is only necessary to study the beh2v~or of cube ABeD in order to determine
that of the whole structure.
-" The value of H in Eq. 5.5 is 38 AE x 10 -. mt;x
The notation used for the struts is indicated in Fig. 5.5. The
diagonal struts irl the vertical plsn,es containing A6 and AC are designated 4A,
and those in the vertic~l planes containing SO and CD are called 4B. All
vertical me~bers are denoted by the numeral 3.
For any stege of loading, it was assuTted that the value of € was z
'constant over the entire cross section. Under these conditions, for a given
value of € • there are only t~o unknown horizontal deflections: the deflection z
of B along a line connecting B and OJ and the deflection of A along a line
co~necting A and O.
-55·-
The equation ror equi iibrfu~ of forces i~ the z-direction is
p 4P ~ + 21"2 (p + p 'I .; 4-.A." 4-8 J
(5.6)
The equations of ccxnpatibi 1 ity and the remaining eC;L!11 ibriuITl
equ2tio!i~ relating mefilbers lAr 2A: 3; 4A 2nd 5,t:., C.re those which lilere :.!sed
in Section The corresponding equ.ations
(8 c.r::d 5S ere thes.e v.:h I ch \-'t'2:re use.d 1 n Chep ter 1.:. ror uncoGf i tied co:npre:ss.[ o:-~.
AccordinglYr it can be seen iOed-strain reteS-tions:. fer the 2 b)' 2
gr10 can be obtained by cc:r;bining the cas.e of unrestrC:1r1ed co:npres~ic':-i with
the case of cO:1'lpression plus h):'d~ostctic confinfr'9 pressure.
The p roce.du re fo 1 1 O\1'.~o "-;25 to firs t plat c graph of p vs. . (3
f r O:'il thE; res u Its c f C h 2 pte r 4" 2. n ci n ex t top tot a g r 2: ph 0 f P ~.A v S. E Z •
by following the procedure of Section 5.3 with H ; 38 AE n rr.2.:)~
E z:
-~ to
f.\o\'-:~ for an assumed value or E_ p the \,21we of p~ 1t-:2S obtained by means cf i- ...,
Eq. 3.25 2nd the: vaiues of P(A 2nd P48 were obtained fro:n the gf2phs referred
to 2.bove. Finally, P was determined frOOl Eq. 5.6. The load-deflection curve, z
sho\~ in Fig. 5.8, was determined by ~Qrking with successive increments of € • Z
The calculated value of the maxim~~ load is 115 percent of the
ffiaxi~um load for unconfined concrete.
(c) n ::t 3
A diagram of the 3 by 3 grid system is show~ in Fig. 5.6. As in
the case of the 2 by 2 grid$ because of s)~~etryp it is only necessary to
consider one quadrant of the structure. fo addition, the notation of the
horizontal struts in the y-direction was adopted as a result of conditions

-56-
of symmetry fC1 the horizontc::l pi2.ne. The dic:gorial struts in the vertical
respectively~ and ali vertical struts are denoted by ~.
The caiculc:tions inyolved in CO:11putEng the load-deflectiort relation
are g~ven in Appendix S. Only 0: generai descrfption of the method ~i 11 be
described In this section. For 2 given value of E , constant over the whole z
cros:.s $.ectfo,,~ thsr-e are fo~r wnknow:1 horizo;-[tat ceflect~on5. Usfng thes:e
deflectfons t it is pes.sible to dete.rr.oine four CO;"iip~t~bi lity equotfons invohr-
ing the eight struts lA to 10 and SA to SD. Also~ fro~ Eq. 3. It four additional
CC:7ipatibi t i ty eq·u€.tlons car. be derived relc:teng s·truts U:, to lD f. i,-A to 4D~ and
( V' F[naiiy, four equations of horfzontal equi librfurn can be written.
The equc;.tions were solved in the following manner: The four
the eisht co:npc:tibiHty equations ~x~re substituted into the equilibr1u:TI
equations ~n order to obtain four equations involvlng only the strains
€V:~.f € Rf E.{, and E""D as basic unknov-.-r1s, together \':ith the 12 unknoWii strut ........... x..... ),!".- "
areas. For each 2ss~11ed value of € , these four equations were then solved z
by a tri2l ~nd error procedure as described in the following paragraph.
The first step in the soiution of the equations was to assume
values for E ~ r E ~I E C' and € D" Next, from the cQ~patibi lity equations, x..... X~ x x
the rc;::ua[r.i~s eIS:'t unknol<!;t strains t't'ere determ;ned. Fran the area-strain
relations of Eqs. 3.25 and 3.26, the 12 related areas were determined. These
areas were inserted in the four equi librium equations, which ~~re then solved
to c~~pute values of ExA
, €xB' €xC' and €xo' If the resulting values did not

-57-
COO1pare ravorc.bly with the assumed values, the procedure was repeated unt: 1
convergence V{2.S obtained.
The main purpose in deterffi~ning the loao-deflection relations under
the cction of corner confining loads was to cO:ilpcre the resulting maximu~
load with that obtained for elspiraliy-reir.forced 't concrete. Accorciingly~ in
the 3 by 3 2nd 4 by 4 grids r the loads were not determined for E values z
gre2ter thc:tl that at £li2XllTiLL7i lead.
The load-deflection curve for the 3 by 3 grid is shot\'\t in Fig.
2nd the maximu."Tl value of? is 108.8 percent or the hIO;dm:..r:n load for t..:nconf[ned z
co;;crete.
Cd) r. =: 4
The notation used :n this system 15 shov·C\ in Fig. 5.7. The method
of solution is .2S outlined in Section S.4c except that six equations cf
horizontal equilibriu:TI are req:.dred~ 2S w~li as 12 co~:?~tibijity eql.:2tions.
These equ2tioGs, as \tveIl 2S the details of the sGlution~ are given in ApP511Qix
6, 2nd the resulting load-deflection curVE is $ho~n in Fig. 5.10.
The maximum value of P is 107.5 percent of the ma~imum load fer z
unconfined concrete.
5.5 General Discussion
The rei2tion between the maxlmu~ load carried by the model and thE
size of grid is shown in Flg. 5.11 for values or n from 1 to 4. The result
for n = I is that of the condition of spiral reinforcement. The shape of the

-58-
curve at n ~ 4 indicates that this value of n is sufficient to determine
the effect of rectangular reinforce~ent on the madei. The increase in the
theoretical max1m~m load cc:used by rectangulc:r retnfOrce11ent is approx.imate1y
7 percent.
(a) SDira1 Keinforc~oent
Spired reinforcernent produces an increase in the theoretical maxliT:l1.-:l
10c.d c:- 2.4·.5 percent over the ffiaximLL"Tl load or w:-iconflned concrete. The. co;-re-
sponding increa.se observed in tests (4) would be 4i percent for the assumed
value of Pc ; O. 1 f~f as can be seen fro~ Eq. 2.1. This difference is sho~
in Fig. 5.4~ in which the strength given by Eq. 2. I has been plotted as a
broken line. The lack of agreement between the model and test results is
not surprising since it was pointed out in Sectio~ 5.1 thot the upper bound
-'<' on the yalue of P for the model is 9.15 AE x 10 v~ or 70 percent greater
z
thaCl the unconfined strength. !t seems apparent that the gap bet ... :een the
model and test results becomes greater with increasing magnitude of pc.
it was further suggested in Section 5.1 that the difference between
the behavior of the model and that of concrete is attributable to direct load
transfer between the solid particles existing in concrete. The relatively
high strains which concrete must undergo in order to develop the strength of
the spiral cause most of the cement crystals to fracture, and force the solid
particles into contact. As the strains increase. these granular contacts
become increasingly important, and require the use of curves such as Fig. 5.2
to express the behavioi of concrete.

-59-
The explanation given above is not u~reali5tic. !ndeed t rt 15
inherent in the derivation of the model~ which is assumed to represent the
ciy~t21s of cement peste. As these crystals break at high strains, the
model must withdraw more 2nd more frQ~ participation in the over-all
behavior of the concrete.
tn the tests conducted by Richart~ Brandtzaeg and Erown (4)~ a
~;:;,lrelly-reinforced colu:;]:l \-',2S 5'U~:je.ct8d to severel rep-etitfoGs or mC/~ir.:ll..Ti
loading. The spiral was then re~oved 2nd the unreinforced core ~2S loaded
to its capaci ty. The st rength or the cere \':25 104-0 ps 1, or appro):irT,,s;te 1y
haL: the strer:qth or the plain colu:nn:: \-':hlch h'Sre tested in the S2r.<e serles.
The pheno7TIenon described ;n the prev;ous. paragraph is not inco~-
patible h'lth the modeL As the mode~ is subjE;cteci to axial co:npres-.seon, the
dl~gon&l struts in the plane para11el to the direction of lo~dins (struts 4)
do not f21 i cc:r:p1etc.ly. ine tOads c2:-ried by these struts are i imited by -c
the amount of horizontal force provided by the tens~on struts and transverse
reinforc8l-nent. Accordingiy, their reduction in area is limited to that
required to produce their ['i1c5ximu:n Ioed-carrying capacity, or approximately
40 percent of their original area. Under the action of the axial stra~nt
the 2 :es of these diagonal struts rotate into a position more nearly per-
pendicu!2.r to the loading direction. r:ence, when the ioad is reInoved r these
struts, which are sti 1 i bO:1ded to the adjacent cement particies, are c2pabte
of providing the tension resist3r.ce necessary to produce unconfined co~pression
strength.

Hanson (23) conducted a serres of tests on 16ghtwefght concrete
under cO;Tlbfined stres~,eso The tEst ~slde~ Gnc1uded spec[mens w~th norma 1
weight aggregate for comparisono The magnitucie of the lateral stress r2Gged
frG]? zero to one-third of the unco~fur:ed co~p[,"'eSStve strerrgth of the SpSCG~
mens. Hanson found that under the usual range of stresses found in structureS D
normal we~ght concrete hav~ng the same unconfined co~pressrve strength. At
the ieghtlNeE9ht concretes was 65 to SO percent of that of the cOuuesporGdnng
norma1 weight concreteo
The results of Hansones tests agree with the behavior of the model.
For low magn~tudes of confining pressureD a relatively small percentage of
particles are in direct contact v so that the strength is mainly
a functGoGl or the cement paste. At hIgher Values of combtGled co;npress!ve
stresseS n many more of the cggreg2te particles co~e ~reto contact p arud sfince
the strength of lightweight aggregate is less than that of normal weight
aggregate~ the concrete as a whole w~ l] show a snm~ lar decrease un strengtho
(b) Rectanqular Transverse Re~nforcement
The strength of the model restra~ned by means of rectangu]ar trans-
verse reenforcement os approxumately 7 percent greater than the theoretncal
strength of unconf~rced concreteD as can be seen fro~ fig. 5011. Thns strength
increase ~s only 28.5 percent of the corre5po~ding increase for sp~ral1y-
reonforced concreteD and demonstrates the lower efficiency of rectangular
reinforcement as a means of providing lateral confinement for concreteo
The reason for th[s reduced effocijency os thatv whereas spura]
rennforce~ent conrfines ai 1 the horfizontal tens~on members an the structure p

~61-
r'ectangutar reinforcernent prov1des little restraint fer those portIons of
the concrete remote fro:n the cor'rlers. Th! s explanatron car. be I ~ lustr2ted
by referring to Fig. 50129 which shows a plan view of the 4 by 4 gr!d. The
sol~d i !nes represent the deflected position of the model confined by rec-
tangular reinforcement~ at the point of maximum load (E : 000025)0 The z
broken 1!nes indncate the deflected pos1tion of the unconfined model~ at
ths same value of vertical str~1no ~\e original posltton of the model ~s
~t can be seen that a bulg~n9 of the structure has taken place
near the mrdd1e of each side of the columns wh! 1e the corners hEve been co~-
pressed horizontally with respect to the unconfined model. Since the broken
lines represent the cond(tion of the unconfined specimen at 2 vert~c21 strain
beyond that at its maximum load D the tension struts are almost co~pletely
ineffective at this pointo It fol1oW5 u therefore u that the structure of the
conf~ned model ~s also extremely disintegrated in the exterior portions mid-
way between the corners.
The above observations agree with the test results of Szulczynski (5)0
on ~'!h[ch at was observed that cons~derable surface spaliing of the concrete
took p]ace near maximum loado ~t was also noted in these tests that vertDca~
DOarches,GO were formed v whrch spanned between the tneso These arches cOQ..,dd atSio
be explained by means of the mcdel D in a manner simi lar to that described sboveo
The co~~rete between the t~es recefives ~~tt1e lateral conrinement 9 and the
res~ltDn9 hugh tenSt 1e strains cause a break-down In the structureo

-62-
6. TEST RESULTS
6.1 Outl ir.e of Tests
The variables considered in the test series were 2S follows:
(1) Spacing of tr2.nsverse reinforcerner:t~ which ranged in 2-1n.
inc rem e n t s f r 0:-:1 2 to 8 1;-,.
(2) Bending stiffness of transverse reifl¥orcernent. This \<{2.S
varied by using both No.2 and No.3 bars as ties.
(3) ~~ount of longitudinal reinforc~~ent. The longitudfnal
reinforce~ent r2tio~ plf ranged fro~ 0 to 1.8 percent.
(4) Bending stiffness or longitudinal reinforcemeilt~ \',hich \\'2S
a secondary variable because of the different tie spacings used.
A tota 1 of 60 test specimens ",,-ere cast; ex 11 specimens were 5 by
5 in. incross sect i on, and 25 in. long. The specimens ~:ere cast in groups
of fours each group being co.~posed of one plair. specimen; one specimen with
ties only; one specimen with t~es plus 4-~o. 2 longitudinal bars; and one
specimen with ties plus 4-No. 3 longitudinal bars. All the specimens with
ties in anyone group had identical tie arrangements. In ail cases the ties
were fabricated with outside dimensions of 5 by 5 in. The volumetric ratio
of the transverse reinforc511ent was 2 percent for all the specimens with ties.
,n order to maintain consistent concrete strengths, the aggregates
were oven-dried before each batch w2s mixed, and the amounts of aggregate,
cement, and water were carefully weighed. As a result, the variation in
strength throughout the test series was relatively small.
A de t ail e d des c rip t i on 0 f the ma t e ria is, a 5 Y'!'e 1 1 a s t he ca s tin 9 and
testing procedure, is given in Appendix A.

-63-
6.2 Behavior of Test Soecimens
The I02d-deflection relations obtained fro~ the tests are included
in Appendix A (Figs. A.4 to A.34). The general shape of the curves is simi lar
for c1 1 tied columns, being essentially linear up to a 102c of between 60 and
75 percent of m2xim~m load. 8eyond this point~ the slope of the curve decreases
with increasing deflection unti 1 maximum load is reached. The average over-a}!
speclmen length r renged fro:n 0.0027 to O.0053 t v-'fth 2pproximateiy 75 pe.rcent
of the values. being bet~:een 0.003 and 0.004.
The specimE.:rt;: behaved specimens
up to 2bout 75 percent of maximum load. KOIc!ever t the strains did not incre2se
as r2pidly with increases in load beyond this point. The average over-all
straln 2t maximu:i1 lo2d ranged bet\\<6en 0.0021 2.:'1d 0.002.7 ror the plain ~peCfmer1s.
Since the stiffness of the testing machine was not sufficient to absorb the
sudden release of energy at maximum loao in the plain specimens: a sudden
fracture occurred r and it was not possible to record strains beyond that at
maximum load.
The ioad in the tied specimens decreased rather rapidly with increas-
ing strains beyond maximum load. Rather extensive spal1ing occurred when the
load had reduced to about 50 percent of its maximum value. In the specimens of
Series I, which had No.2 ties at 2-in. spaclngp and the specimens of Series 2,
which had 2-No. 2 ties at 4-in. spacing, fracture of one of the ties occurred
after the load had reduced to about 30 percent of maximum. tn the reTiaining
specimens, fracture of the ties did not occur, end testing ~as discontinued at
about 10 percent of maxim~~ load.
-64-
Crushing in the specimens of Series 1 usually occurred over a
length of 4 to 5 in., and the zor.e of crushing was very nearly horizontal
In most cases. For the specimens of larger tie spacing, however J the zone
~ , . tIl .... 4~o 60° I • I ot crusn i ng USU2 l Y was inc I i ned at an ang e or :- to . to tne vert I C2',
2:ld for the majori ty of these specime.ns the rai fure zone extended frcxn the
middle of 2 tie space on one side of the specimen to the middle of an adjacent
spoce on the other side. Because of the inclined fai lure zone~ most of the
specimens with 4-, 6- f and 8-1n. tie spacings began to exhibit sliding along
this fai lure surface, producing relativelY large vertical deflections in
many cases.
The definition of strain as applied to reinforced concrete requires
some discussion. In general, strain is defined by the relation
strain ~ deformationilength.
However, the appropriate legnth to be used in applying this relation is not
always apparent. In the case of axially-loaded columns, the total shortening
is usually the most important deformation, and hence the critical strain would
appear to be the average strain throughout the length. If most of the crushing
takes place over a relatively small region, however, the values of average
strain at the same load level in simi lar columns of di fferent lengths wi 11 vary
considerably. For this reason, if the results of one condition are to be applied
to other conditions, it is necessary to c~~pute the local strain at the crushing
zone.
An important application of reinforced concrete columns is their
use in monolithic beam and column construction. To analyze this type of struc-
ture, it is important to know the strain at the beam-column connection,
particularly if the analysis is based on the principles of ultimate capacity.

-65-
F:-CY.Ti the above co=n.'"'Ilents p it C2;n be 5E:er. that it is very desir2ble
in tests of coiu~ns to obtain local strain values. In an effort to determine
the Str'2Zr. of the test SPeC!iYienS over the fed lure reg!o:l, GE:f~ection dta1S
were m()unte.d on the specimens over two continuous Z-ln. gage lengths. For
the specimens in which crushing occurred outside this 4-in. gage length, the
straIn 2t the Tai lure. zone W2S c0:nputed by subtrc.cting fro:TI thE: tOt2, 1 c'cflectio:1
the deflc:;cttor; of the. ~ncrushe.d portion d.lv(cing th·6 GI f-
ference by the hefght of the crushed region. The deflection of the uncrushe.d
port:on '.,,[3:5 co~.?uteci by calcutc.ting the str6:in cb~c;ir.e.d fro."TI the :7ict..m~ed di21$~
ar:d 2.SSlH"idng th2t this str2in t,,<2S const2nt over the totel 1et!sth of thE. specim~[1
outside the far lure zone. [n most case5~ the deflection dials wh~ch measured
deformations of the uncrushed p~rt of the specimen showed a decrease ~n strain
rec:chec. Tht s phebianenon \.'.BS du.e to the f2et thc:t the load on the f;:·ec~mc;n I.~~S
decreasing, and demonstrated that the total axial defo~r.~tion was occurring o~iy
in the crush~d region.
F1swres A.35 to A.57 show the relation beth~en load end str~in in the
crushsd rsqi~:l ror the columns ~ith ties. The strain in the zone of crushing when
the net loac had reduced to 50 percent of its maximum value for the specimens with
Ro. 2 t!es ct 2-in. spacing ranged from 0.017 to 0.042 w~th a mean of 0.032; for
the sr:ec!:7:z:'".$ \·:I:h 2-r~o. 2 ties at 4-in. spacing ranged frD:TI 0.015 to 0.027 tdth
a mean of 0.C20; for the specimens w;th No.3 ties at 4-in. sp2cing ranged fro.l1
0.015 to 0.023 with a mean of OgOt8; for the specimens with 3-~o. 2 ties at 6-in.
spaci~9 ranged from 0.013 to 0.023 with a mean of 0.Oi8; and for the specimens
with t,-~o. 2 ties at 8-in. spacing ranged fro.l1 0.005 to 0.Oi5 with a mean of 0.009.

-66-
6.3 Effect of Variables
(a) Amount of Transverse Rei nforcetnent
The effect of the amount of transverse reinforcement on the strength
and d u c til i ~ Y 0 f 2 X i all y 1 0 cd e d co 1 UtTI n sis iiI us t rat e din F i 9 s. 2. 3 and 2.4-,
!n each case, curve 1 shows the stress-strain relation for s plain concrete
specimen; curve 2 refers to 2 specirr,en with ko. 2 tIes at 2-in~ spacing; Slid
curve 3 refers to 2 spec~men with ~o. 3 ties 2t The stresses
used in plotting the curves are gross stresses f obtained by dividing the axial
load by the gross area of the cross section. The strains are average longi-
tudinal deformations~ based on the total shortening of the columns.
It can be seen frQ~ Figs. 2.3 and 2.4 that the use of ties did not
affect the gross strength of the specimens appreciably. However~ the ties
did produce considerable improvement in ducti lity. As can be seen fr<XYi the
9raphs~ at large strains, the larger the amount of transverse reinforcement,
the greater the percentage of maximum load which was mair.tdir.ed.
(b) T' ~ . , Ie :>paclng
The curves of Fig. 6. I show load-strain relations for tie spacings
of 2, 4, 6, and 8 in. In all cases the transverse reinforcement ratio was
equal to 2 percent and the cross-sectional dimensions of the columns were
5 by 5 in. The load used for the ordinate of the graph was the relative
gross strength, obtained by dividing the load on the specimen by the maximum
load of the plain specimen in the same series. The strains were the local
strains at the fai lure zone.

-57-
Figure 6.1 i llustictes th2t the cucti i tty decreased ~dth Iflcre2s;ing
tie sp2cing, 't-;'hen the trc.nsverse reinforce.ment rc:tic- ",,-2S kept const2nt.
(c) Lon9itucir.ai ~einfcrco"";!e.nt
Figure 6.2 shows the effect of longitudinal reinforcement. The
solid curves refer to specimens with longitudinal steel r2tio, pI, equal to
ct 2 PE;;-C(..~lt. The brc:~et' curves haVE:: be.en p lct::sd by s,t...:t:tt'ccting fro:;~ the
totel load-strain curves the load carried by the longitudinEI bars.
Lonsitudina1 reinfo;-cemef1t h'E.S iil.cluded in the spt.:'~Ctmens to seE: if
it helped co:-:f1ne the concrete in co;r;bi:-;2,ttOn L·lth the ties. Ho\-~'~ver. it h2d
riO signi ficant effect on concrete strength or ductl 1ity, This is illustrated
by the fact that the broken curves compare well fa r the ~pecimen
with no long~tudinal steel.
(d) Concrete St renqth
An examination of Figs. 2.3 a~d 2.4 reveals that concrete strength
has no marked influence on the strain at maximum load. However, for strains
beyond maximum load, the higher strength concrete results in a decrease in
ductility.
(e) Shape of Cross Section
The curves of Fig. 2.3 refer to 5 by 5 in. columns, and those of
Fig. 2.4 refer to 5 by 10 in. columns. 1n order to compare the behavior of
these t\>\'8 colulT;n sizes, it is necessary ,to co..llpare curves 2 of Fig. 2.3 v-·ith
curves 3 of Fig. 2.4, since these have very nearly equai values of the
volumetric ratio, pH. On the basis of this co:;;parison, the shape of cross
section appears to have no significant effect on either strength or ducti lity.

-68-
(f) Stiffness of Lonqitudin21 Reinforcement
The stiffness of the longitudinal reinforcement, as demonstrated
by the effectiveness or a given size of longitudinal bar at different tie
spacings~ had apparently no influence on the results. This was as expected!
since it ,.vas pointed O:Jt in Section 6.3c that longitudinal reinforcement had
little effect on strength or ductility in ~pecime".s with a 2-in. tie spacing.
(g) Stiffness of Ties
The specimens of Seri~s 2 had 2-No. 2 ties at 2 4-in. spacing, whi Ie
those or Series 3 had l-No. 3 tie at a 4-in. spacing. it was hoped that by a
cc~parison of these tWQ series: the effect of tie stiffness on the resuits
could be determined. However, the only difference which could be observed
was that in Series 2, fracture of one of the ties usually occurred at high
strains, whi Ie in no case did one of the No.3 ties break.
6.4 Discussion of Test Results
(~) Stienqth
The use of ties had no significant effect on the gross strength of
the test specimens. The maximum load of the tied specimens with no longitudinal
reinforcement was an average of 101 percent of the plain specimen strength,
with a range fro~ 97 to 107 percent. The maximum net load of the specimens
with No.2 vertical bars, co~puted by subtracting the load carried by the
bars fran the total load, was an average of 97 percent of the plain specimen
strength. The range in values for these specimens was from 90 to 102 percent.
The maximum net load of the specimens with No.3 vertical bars was 96 percent
of the plain specimen strength, with a range from 91 to 102 percent. The

-69-
latter averages do not include the results fro~ specir.1en 1232~ \a(hich fai led
by local fracture at the end.
The results su:rrr.arized in the previous paragraph illustrate that
the gross strength of the specimens, calculated on the basis of the total
cross-sectionai area, was not grec:tly 2ffected by the ties. The gross strength
is often thousht of 2S the useful strength~ since it ordinc:ri ly hE5 the r.10S~
signific2~CE: in practice. However r it is also of interest tc investigEte the
net strength, or the strength of the co~crete co~fined by the ties. ~t fs
only by 2G investigation on this basis that an accurate co~cept C2n be obtained
of the reai effect of ties on the behavior of concrete. [n additfon~ the net
strength is important in order to cO;:'ipare the results of various test progrc:rn£.
~n the tests carried out by Szulczynski (5), the net strength y~as
calculated by dividing the maximum load by the concrete area within the ties.
The increaSE: in unit strength, 6fc' y,~as ther. def~ned as the difference betwzen
the net strength end the strength of the plain $peci~en of the s~me set. The
relation between 6f and the effectiveness of the transverse reinforcement was c
expressed by means of an assumed lateral stress, f2
, defined as fol lows:
pll = vo 1 umet ric rat i 0 of the transverse re i nforcernent
fll = yield stress of the transverse reinforcement y
b E width of the enclosed section
h = depth of the enclosed section.
(6.1)

The equation
6f c
-70-
(6.2)
represented a reaso0able lower bound to the data of Szurczynski IS tests,
and the equ2tlcl
1.4 f 2 (6.3)
describE-d the lo~!er bound to all the results in the tests.
The results of the model analysis described in Chapter 5 can be
used to develop ar. equation simi lar to Eqs. 6.2 and 6.3. It was observed
in Section S.5b that the theoretical strength increase produced by rectangular
transverse reinforcement was only 28.5 percent of that produced by spiral
reinforcement. Although it ~'as pointed out that the absolute magnitude of
the theoretical strength increases did not agree with test results, it seems
reasonable to assume that the relative effects of the t~~ types of transverse
reinforcement are valid. The modification of the results in terms of granular
contacts applies to both the spiral and rectangular cases. On the basis of
this reasoning, it may be assumed that rectangular ties are approximately
30 percent as efficient as spiral reinforcement.
The strength increase caused by spiral reinforcement, as observed
in tests (4)~ and expressed in Eq. 2.1, is given by the relationship
.6f = 4.1 f2 .c
(6.4)
The corresponding strength increase caused by rectangular ties, obtained by
c~~bining the results of the model analysis with Eq. 6.4, may be expressed
(6.5)
'.i
j.,; ,';

-7i-
The increase in unit strength, 6f , observed In the test results c
described In this chapter, is piotted as c function of f2 CEq. 6.1) In
Figs. 6.3) 6.4 and 6.5. Broken lines corresponding to Eqs. 5.2 and 6.3,
ana 2 sol id line corresponding to Eq. 6.5~ have been shown on the same
graphs for ca~parison.
F~gure 6.3 shows the strength increases for the specimens with
ties and no longitudinal re i nrorce.7.e.nt. -l-i lie open circles refe~ to spec18e~s
veith [,~o. 2 bars as t'ies~ and the sol,d clrcles refer to specimens v,lith 1-:0.3
bars as ties. !t is seen that the strength increases for the test series
are iess than that in the tests by Szulczynski ~ since five of the results
fall below the line representing Eq. 6.3. The line representing Eq. 6.5
gives a lower bound to all the test results, and suggests that the results
of the model analysis of Chapter 5 are realistic.
The increases in strength for the specimens with No.2 and ~o. 3
longitudinal bars are indicated in Figs. 6.4 and 6.5 respectively. These
results are so~ewhat lower than those plotted in Fig. 6.3. A possible
explanation for this reduction in strength is that the load which ~s assumed
to be carried by the bars is greater than its correct value. Kowever, if this
is the case, the discrepancy cannot be due to buckling of the bars, since the
results of Fig. 6.5 are at least as low as those of Fig. 6.4. In addition,
the tWQ lowest results of Fig. 6.5 are for specimens i-'Jith tie spacings of
2 2nd 8 in.,_ which implies that the unsupported length of the bars is not a
c r i t i ca 1 fa c tor.

-72-
Another possible reason for the strength difference is that the bars reduce
the efficiency of the adjacent concrete. it seems likely that the concrete
at the corners of the specimen, outside the bars~ wi 11 spall off very easi 1y.
and this weakenIng effect may extend so:-ne dist2.r1ce fro:n the barso
(b) Deforma t l on
The most fmportant variables sffect~ng the deformation of the
spec[msns were the 200unt and spacfng of the tieso fncreasing the a~cuntD
or decreasfr.g the spa:cfng of the transverse reinforcement» whi Ie holdlng the
other variables constant, produced an Encrease in ductility. from the tests
of Szu1czynski (5)~ It appeared that lncre2::ing the concrete strength produced
so~e decrease in ducti lity beyond maximum load. The rema[ning variables -
shape of cross section, stiffness of transverse re1nforcement v and amount and
stiffness of longItudinal reinforcemer.t - had little or no effect on the
ductil[tyo
The tests have demonstrated that the use of rectangular ties can
lmprove the behavior of concrete in co~pression to a great extento Rn the
speclmens with tfies at 2-in. spacing v the average strain at fracturev based
on the total shortening of the specimen, ranged frQ~ 0.025 to 0.046~ with a
mean value of 00034.
605 Stress~Strain Relationship Obtained From Test Resu~ts
~n order to app1y the test results to geo~etrical and loading
conditions which are different from those in the test program v it is very
desirable to deffine the stress-strain relation in terms of the most nmportant
variableso A study of Figs. 6.1 and 602 reveals that the relation between the
stress or the concrete enclosed by the ties and the strain in the fai lure

-73-
region can be expressed conservatively by means of two straight iines v as
shown in Fig. 6.6. The position of line AS is ffxed v where B represents the
max1mum net £trength. which is equal to the unconfined compressive strength u
and occurs at a strain of 0.002. The slope of line SO varies l depending on
the amo~nt and spacing of the transverse reInforcement. and can be determ!ned
by studying the v2riat~on in strarn at point Cs the po[nt at ~htch the stress
has reduced to 50 percent of fts ~2Xrmum value.
~t was pointed cut In Section 6.4 that the main var[ables affecti~g
the ducti lity of the spec~mens were the amount and 5pac~ng of the transverse
reinforcemento Accordi~91y~ the value of E 50· the strain correspond~ng to
poInt C fn Fig. 606. wi 1 1 be expressed in terms of the parameters poc and s/hs
where pflO is the volumetr1c ratio of the transverse rei nforcement v defined 65
the ratio between the volume of the ties and the volume enclosed by the outside
dfimensnons of the ties; s is the center-to-center spacing of the ttes v 2nd h
~s the smaller value of the outside dimensions of the tieso
The relation between E~n and s/h for the test series is shown in ~V
Fogo 6070 ~t can be seen from Figo 607 that the equation
agrees very closely with the test datao
The influence of the volumetric ratio pI! on the variation of ESO
fis more d~ff~cuit to define accurate~YD since the amount of avanlabie data
re]at~ng these variables is rather limitedo A study of the tests by
Szulczynsk~ (5)8 the results of which are illustrated in Figs. 203 2nd 204 9
seems to indocate that the relation between E50 and pH is linearo Accordingiyv

-74-
St!1ce the results shown !n Fig" 507 correspond to a value of pH equal to Oo02 p
the stress-strain relationship for concrete confined by rectangular transverse
relGforcement may be expressed by the equatfon
= 0075 s

~75-
7.1 The Fai lure Theory
~n order to expiann SCffi,e aspects of the bahavilar of ccncr~teD a
fal lure theory was developed based on observat~ons of the structures of
concrete and c·ement pasteo Cement paste ~ S ccmpos:ed l.:yr a number of so ~ ~ d
particles interconnected by slender crystals D the cement gala Accordinglyv
an analogous model was derived in a manner simi lar to that introduced by
spheres g interconnected by elastic 5truts g as shown in figo 3030 The areas
of the struts wer·c proportaon·;;d so as to produce a va~lle of POHssonos ratuo
of Oo~5 in the initial stages of uniaxial ccmpre5s~o~ of the mc~slo
As concrete is loaded n the cement crysta~5 in both tension and
ccmpressicn begin breaking at various locations in the concrete masso
number of such crystal fractures incre~se5 with ~~creasing load unti 1
eventual ~y further increases in deformat~on resu)t ~n a decrease ~n loado
Sincs crystal fal lures in ~hs concrete mass are eq~1v31ent to a reduction
in the area of the appropriate strut in the model D ~quations relating araa
and strain were developed for the strutso i~z randc~ nature or th~ crysta1
strengths susg3sted the use of the norma] distr~butJon curve or Gaussian
curve to express thase area-strain relationso ~n order to produce reasonab~e
pression struts v which lmpl~es that extremely weak crystals are more ccmmon
than extremely strong crystalso

-76-
where z = In (e x 103
)
A (%) ::: 100 - 'I € < 1.8 x 10- 3
A = v € > 1.8 x 10- 3 I
and that for the tens i on struts was
(7.2)
where z =
A(%) ::: 100 - y, e < 0.2 x 10~3
A = Y € > 0.2 x 10- 3
7.2 Apclication of the Fa! lure Thaorv to Concrete Under Uniaxial Stresses
The model, together with the area-strain relations of its struts,
'has th~Jl used to explain th8 load-strain relations of concrete subject~d to
both llnconfinBd and confin,ad ccrnpression.The resulting load-defl-:ction
curv,~ for unconfined ccmpression (Fig. 4.1) agreed very favorably with curves
obtained frcm tests, and the behavior of th;3 model provided a basis for
exp I a in j ng the phencmenon of "fa i 1 ur,e in concrete under t his load i ng cond it j on.
A description of this fal lure process wi 11 ba givan in the fol lowing paragraph.
Und2r th';; action of gradua11y increasing vcitical ccmpr'cssi'J-e str-llin,
a plain concrete specimen which has no lat~ral r~straint wi 11 begin developing
horizontal tensi~ strains. These tensi 1e strains are caused by the action of
cement crystals which are inclined at an angle to the direction of compression,
and which create horizontal forces to maintain static equi librium. in the
absenCe of external horizontal ccmpression on the sp~cirnen, these induced
-77-
horizontal forces m~st be resisted by tensi Ie stresses in horizontal cement
crystals. The inc1dence of crystcl fractures accelerates with increasins
c~T.pressive struin unti 1 finally the tension crystals reach their maximum
load-carrying capacity. The maximu;Tl co:npressive load then occurs after 2.
small further increase in strain. For strains beyond that at which the
capacity of the tension crystals is ~e2ched, a greater proportion of the
applied co~pression is resisted by the v~rtical cryst21s~ and eventually the
nu~ber of co~pressfon fal lures is so extensive that the load decreases r2ther
rapidly with increasing strain.
7.3 Application of The Fa! lure Theory to Concrete Under Triaxial Stresses
An explanation of the behavior of conf~ned concrete depends on a
consideration of solid particles in the concrete, as well as the cement
crystals. Fro~ the preceding description or the fai lure of unconfined
concrete, it can be seen that the inittation of fai lure for this l02ding
condition is 2 function of the strength in tension of the horizo~t21 cement
crystals. For this reason, when concrete is subjected to lateral confining
pressures in addition to axial compression, the strength is increased, and is
more dependent on the ccopressive strength of the cement crystals.
The structure of concrete is composed of a number of solid p2rticles,
both unhydrated ce.lient grains and granules of aggregate. The spacing of these
particles varies considerably throughout the concrete, but as compression of
the concrete progresses, and the cement crystals break, an increasing number
of the soiid particles are forced into contact. At very high strains, in the
presence of sufficient confinement, virtually all the load wi 11 be carried by

- 78-
direct grain-to-grain contact. A description of the behavior of confined
concrete can accordingly be given by the derived model and fai lure theory
at lov-' strains, but 2S the strc.in increases, the beh2vior is more fie0r1y
2. function of the load-strain relations of confir.ed aggregate.
The f2~ lure theory was a Iso used to illustrate the di fference
bet\'-/een the strength and duct; litY of spirally-reinforced columns and of
columns wi th rectangular ties. The theoretical strength of spiral columns
\--'25 appreciably greater because all horizontal tension members were confined
by the action of the spi ral. In the case of tied columns, however, the
confining effect of the ties was produced by concentrated horizontal loads
at the corners of the column. Accordingly, many of the horizontal struts
remote fro.ll the corner received I ittle or no confining pressure.
7.4 Experimental Program
In order to coolpare the theoretical behavior of tied columns with
that occurring in practice, a test program was carried out on axially-loaded
columns wi th rectan~ular ties.
A total of 60 specimens were tested, all having dimensions of
5 by 5 by 25 in. The main variables considered in the test program were the
spacing and bending stiffness of the ties, and the amount and stiffness of
the longitudinal reinforcement. The results of these tests indicated that
the use of ties did not affect the gross strength of the columns appreciably,
but did produce considerable increase in ducti lity.
From a consideration of the test results of these 60 specimens,
together with the results of 30 specimens tested by Szulczynski (5), the

-79-
fol1o~ing conclusions can be made regardlng the behavior of axially-loaded
t~ed colu~n5: Rectangular ties have no signlftcaGt effect on the gross
strength or colurnns, but do produce a.n inCfE:2Se in deformation capacity.
The duct i 1 f t y of t i eo co 1 LCnrlS i nCre25,eS v,:i th i nCrE:2S i ng a:nount or decreas! ng
s.pacing of the ties, if the other vE.riables are kept CO:1stant. The ductiH-:.:y
1$ decreased S·C118\··c':-:at \dth Ir.cre2~es in co~crete $.trength. Other varlables t
~tiffr;ess of long!tudtric.l :-~:':nforcer:;ent~ and £h2pe of cross sect~c:1 h2ve 1itt!e
or no effect on the behavior.
An t CT, po r t 2 n tap p 1 i C2 t i 0:1 0 f r G c I: c. rt S u 12 r tie sis the i r L! s e 2. 5 so t i r r ups
in reinf~rced concrete beams. Sfnce the principles cf limit deslgn require
considerable ducti lity of the members concerned, &nd also since ducti lity 1s
eY- t rerlie i y [tttpor tan tin p rov i d i:1g rE:sl s: t2rtCe to dynam i c I cad i n9 9 f avorz:b le
defcrmation qual1tFes are very desirable in reinforced concrete. The results
of the theoreticcl 2nd experimental investigations outlined above imply that
sufficient d~cti lity can be obtained by using property-designed rectangular
ties.

-80-
REFERENCES
10 Re.~Gl~USD ErHngD fleA Theory of the Defcrmat~o[1 and the Fafilure of Concrete~~~ Cement and Concrete ASSOCfot!Orc v London v TransiatIon Noo 630 (Translated fro:n the: Swedish and reprinted fro:n O~&e.tong~uO 1955 9 Noo 10)
20 Ramcde.yv Do and ~L KcHenry~ DGStress-Stndrt Curves fer Conctete Str,;dneci 8eyo~d the U~t[mate load p
H Laboratory Report Noo SP-12v Uo $0 Bureau of Rsclsmatton p March IS470
30 tUehar-t v Fo E0 9 A.o Brc00tzaeg v ar:d Ro L.a 6rO\\';(9 SUA Study of the fa~ lure of Concrete Under CO:TlblE1ed Co:npressive Stresses li
no Uneversnty of ~ ][tnc;s Engineering Experiment Station Bulletin Noo 185 g 19280
40 Fdc.h2!it v Fo Eog Ao Br2!lotzoes!) 2nd Ro Lo BrOh'J1 9 6DThe f<BD illre of PL:dn and Spirally Reinforced Concrete £n Ccxnpressio01 g 0
6 Unh!ers!ty of ~]~8no~s Engineering Experiment St2ticn Bulletin Noo 190 9 19290
50 S,zldczynsks p Tadeusz a.no Mo Ao Soze:nl) o£load-Derormatoon Characteristics of Concrete Prisms with Rect!iinear Traru5vers.e Re[nforcement))C6 Un[vers!ty of ~ I1fnois Structural Research SerGes ~~oo 2249 September 19610
6 ° See ~ ¥ £) F 0 EL aU1ci J 0 00 Srrd th II OtP,"dv2rtCed Mechard cs of ~1ater fi a 1 S l) DO John ~iley and Sons p ~nc09 Second Edition v ppo 69-940
70 Gdffnthll Ao AOl) O!The Phenomena of Rupture and Fiow i"n SolDdsl)bB Ph61osoph~cal Tr~nsactflonsp Royal Soctety of London,9 Volo 2219 Serfies A~ 1820 g ppo 163-tg80 (See alsop Griffithl) Ao Aop oerne Theory of Rupture,9u Proceednngs p Farst ~nternat~onal Congress for Applted Mechanics)) Delft)) 19240}
80 von Karman p Tho)) DlFestigkeitsversrJcne unter al1seotigem Druck gDO ~dtten1ungen
uber Forschungsarbeiten auf dem Gebiete des ~ngenieurwesensv Volo i18!) i9120
90 Soker p Robe.rtp !DDie Mechanik deli blenbenden lFormanderuff1g Dn krestal1finnsch aufgebauten K,°orpern D as M [t te i 1 ungen uber lForschungsarbea ten auf dem Geb i ete des ~ ngerd eurwesens p \fO! 0 175 and ] 76 D 1915 °
100 wastlund D Go p BiNya r.on angaende betongens grundiaggande hal1fasthetsegenskapeuvuo Betong p VoL 229 Noo 3 9 i937 9 ppo 189-2050
1!0 Bel]amyv Co Jo p aOStrength of Concrete Under Cornbined StresspD! P.roceednngsp AC U D Vo i 0 58 D October 1961 0
120 Bresler v Bo and Ko So Pister p o8Failure of Plasn Concrete Under Combined Stresses p
DO Proceedijngs,9 ASCE v Volo 81p Separate Noo 674 p Apr~ 1 19550 (See 2150 9 Bres!er)) EL and Ko So Poster!) DOStrength of Concrete Under Combnned Stresses!)on F'roceednngs 9 ACi p Volo SSp September !9580)

t3,o Or2C1 v C~n2pv unTheode~) of Faflure vut Term P2per fer TheoliettCcd and
Appfied Mechanics Dsp2rtment Course Nco 427 v Unfver5~ty of ~ llino~sg 19570
140 t-~iGHe~r'Yg Do 2r1d Jo f~.arrd v CEStrertgth of CO!lc.rete U[tder Co;nbfined Tens[ Ie and CO[T'preS5~ve Stress:.:;C1 ProceeciGL1gs!l ACu D VoL 54v Aplin ~ ~S58o
!6o B·E:.[;",l1al~.L DOD Jo Vo Jh::fferyv arlQ Ho Fo ~!o Tay10u v OOGryst2!Iographfc Re.se.2rch o:;e the Hyc'r2t[O~I of Por'tfand Cement v
UC b'b2.gazur.e of COU1crete Ro.eS.::ec:rch g VoL 4v Loo II D 1:252.0
]70 /rl·akef" v Pto La Lo~ HAn Analysjt::, of De~formatuort and Fan 1ure Char·a.cter[st~cs, of CO:-l::C"E:te[,CG l~2qaZ.r:-(e of Concrete Researd~p VoL 1 ~v ~'~Oo 33 D ~S5So
]8" r;olme,~jD {WOO COD oilAn Out1i.ne of Pro:,2bfiHty and fits Uses vco Edwa.rds
B~othsrs9 ~ncOD Ann Arbor~ MichlS2no
I90 Duffy v Jo 2nd Ro Do tHndl~t1D C&Stre;ss-Stranr1 Relat.noU1s and Vfibratflons of a GrC3:G11J]a.r V"ed~u~~,n Jour'nat of App]ned Vtp::;:halilocs v Voto 249 19510
200 Thurstot1 D Co WO and Ho Deresrew~cz9 O~nalysi5 of a Compres5~on Test of c. hode [ of 2 G !lG~ U 1 e. r Vce:G [ W:1 p 0 v ,J)CU rGa ~ of A,pp 1 fi ed [-1ect,2l1 G C~ 9 Va 1 0 2.6 9
IS5,9 0
2 I 0 gJe!lL"'U::1 Q bo 9 So Krr~:g:~.tadD 2nd 00 Ku~~eL1ejev oOThe Shear Strength of a
FGr:e S,2r.d pn ffifth Cl1terUl2tEonal Conrerernce Olil Soo] Mechan~cs and
founda t t 0['1 Er.g G neer ( n9!i Va toe D 1 96 ~ 0
220 P~s:.kD ftc B0 9 Wo Eo ~anS0L19 and To WO Thornburun D oO~oL2Lldatnorl EngcIi1eernn9o uG
,J ob ~ W G ley 2 iii d Son s D ~ nco D i 954 D P P 0 68 - 9 5 0
2.30 11i2U1S0!i1 9 "»0 Aov OOStrength or Structuran Ughtwe~ght Concrete Under Combined S t res S DOl Jor..! rna i of the PeA Resea ueh and Deve 1 opmen t Labore tod es D \/0 ~ 0 59 No 0 1 9 Jarwa ry 19630

-82-
TABLE 1
ROD FORCES U~DER UNIAXIAL PRESSURE - REtNIUS MODEL
Pressure PI P2 P'2 PA~ PAC D
P AE ..J b 'AD
P -0.051 -0.051 0.35\ -0.013 0.057 0.022 0.022 z
P -0.051 0.351 -0.051 0.040 0.004 0.053 -0.009-Y
P 0.351 -0.051 -O.05i 0.040 0.004 -0.009 0.053 v r.
Values given are coefficients of P in the fi rst i i ne r of p In the second line, end of P In the thir5 1 j ne. y
x.
TA8LE 2
PRELIMINARY RE!N1US FAILURE THEORY
Effective Area Of : € - -
Rods J, 2, and AS PI P2 P3
x = € == E: E v = -In Re lat ion to x y Z E
Original Area z
,:,~
100 % -O.OSl P 0.351 P -0.051 K 0.351 K 0.14 z z
75 % -0.048 P 0.355 P -0.064 K 0.355 K l' 1"· oJ. IV
Z z
50 % -0.043 P 0.362 P -0.086 K 0.362 K 0.24 z z
25 %, -0.033 p 0.377 P -0.132 K 0.377 K 0.35 z z
10 % -0.020 P 0.399 P -0.195 K 0.399 K 0.50 z z
* K = P /AE, where A = original area of struts 1, ~ 3. J_ •
Z

-83-
Tp,BLE 3
FIJ'-.:.t,L REIN!US FAt LURE THEOF\Y
Effectfve Are2 of Rods 1 ? ..... And E
< x , p - ~ '" ~ Pl P p E E E V = -AS in Re 1 a t i 0:1 to 2 '3 x y Z €
Original Area z
":r 100 01 -0.051 ? 0.351 P -0.051 ,/ 0.35\ K 0.14 .0 ~,
z z
75 % -0.059 P 0.324 P -0.078 K 0.432 K 0.18 z z
50 % -0.067 P 0.284- P -0. i 35 K 0.568 K 0.24-z z
25 01 -0.075 P 0.217 P -0.305 K 0.867 K 0.35 fo z z
10 01 /0 -0.059 P 0.142 P -0.689 K i .416 K 0.49
z Z
* K =: P_/AE J where A =: cr1g:n21 area of struts 1 ~ 2, 3. L..

3000
.-~~
0..
.. 2000 Il'l 11"1 ()
o-J V'I
1000
o o
-84-
2 4 6
Strafn x 103
FIG. 2.1 STRESS-STRAfH CURVES KEASUREO FROM 3 BY 6-fN. CYlrNDERS (Reference 2)
l t f
8 10

rr. c..
x: <
20,000
15,000
10,000
5,000
o
15,000
10,000
o o
-85-
p ::; 4090 ~---,
p ::; 3010
! p ::; 2090
[ p == i510
p = 2010
p ;; 1090
p :: 550 ----
(b) f' ::; 3660 psi c
p = hydraulic confining pressure
0.0\ 0.02 0.03 0.04
Longitudinal Strain
FIG. 2.2 STRESS-STRA!N CURVES MEASURED FROM 4 BY 8-1H. CYLINDERS UNDER LATERAL HYDRAULIC PRESSURE (Reference 3)
0.05
I I r r t
t t' t
[

<rl tq Pot
~ orf ..., g (/)
t\1 ttl
~ g rg ~ m ttl
It rIl .,~
;g
:';,,"~ .. ~~1."i.. ... ,,; .:,."t 'd. ;;t2fi. !)..;;,;. • ... JOli.;. ·!~ ... u """,_':.1'" ,.f. .W......... . ...... '!J ....... _ ••. _~.':..tb!'Jt.J·.·.f!!!t~~...,ff.,I;'I",_.~ i.", ~ •• :', ,,~'-'
6000 - 1 1-
., .. - ........ ~ ...... '..,'.," .... ~.~
.. -=~~-~ .. ~. ~ .. ~~ ........ -~.,.--.-.. -- --. ·I-~"··· ····-1 I·· .. i I
)t-QOO I - --~ 1/ .~
2000 ~ ~~=~ ____ ~I~I~I ___________ ~ 2
o p X::WW:-. ".-1. _ .~~I_?" t;.t!. !~.,.,., . .,.,.,......,.....,.....
H_ ... ___ . __ .. ____ 1
U
2000 ~ '.,~ !~ \--___ -+
o ~L t:\~ o
_J~_~~~ ~~~. ~~.""'.,.,. .. =-~"~~...",J..'~.....,....,.,.... ....... ~....,.,.,.,...~..,...,'I
O~OOl~ . Ofloo8 0,,012 0 OeOO.J~ OgooG O~OJ2 o-~o16 A~8ge A.J.l1..t.\l Un:1.t DofQ!QlJ/;:t.'c.iQU .
, 0)
Ol I
fiG. 2.3 LOAD-DEFORMATION CURVES MEASURED FROM 5 BY- 5 BY 25~IN. PR!SMS (Reference 5). -=~:t."Z:to:r:C::.1.~X'V~"!:il'll~~"'B.'-J:"E·_.:o&1 ... "i:\.!,t.~'!atti!·~~dSS2!ii .. :.h"£i!.iJ .. ...;";'T""_ .""~iiJ-:.-9O!£S£\:;: •• , ..• _".,.hBiiZi& ... .t!¥t1!: ,:r&.U __ &.,itt:L_._.~._.~ ...... • ,.;.,:_( .. ' ._.~.,:! ...... 1:_ . :",1 '0," ,'" S¥: .f;:f ,-:::' .1!-;:~' .... "7-l-":.~,""":~~.n

'-~;"«U:--'Jzo.}!."!.':~\.·£n;:!:tJ!)L '3'!J)"?~,- ,_ilt!L .~.!1:>' ... ,:J!' r.~ ... .:·. z.I"'J" .• tJx .. :::::r;'J"!~:!!.:t<""J.'~J_'!I."'~.!.'t"~\.':l'.b'~_~ •.• .,. . ....,.~'"'T"-...,~~ -,-,...,.."""T.....,,-..-~~. ~~ .. .--:,...~T'r."T"_.
...-1 fQ
PI
r:l' o trl .. p ()
G.' (I)
{11 (I) o t!1 g ~ ~ tq t'l
~ til
+' orf
:9
-~~~-~..,...,..~.~~'="~ · .... T~·~· ~.,."..~. ~ .. ~::-:-'~-.. -~ ... .,..~.~ .. ,~-r---~~.~
4000 J t--- .-----.----+----.
I .. --~ .
2000 I--(-~--
~2
o ~ . (0.:2 I -~r.-~~~ .,...,~ .... ~~ ..
11000 I ¥'!- ~'nf----4-------I-----__il 3
2000 I~ ~~~_'L=.~--·~---------
o"oo)·~· 0.008 000J2 o oooo'~ o~oo8 O"OJ~ 0.0J.6
AV0'JNJP}.) }\:r:,j .. p.J. U'P.:t1~ J}:;f'oJ;mA,t1.Qp'
.FIG. 2.4 LOAD-DEFORMATION Cur~VE$ nE1\SUftED r-!lOn 5 Wi 10 gy ~;)-~Hl. rrUSf1S (Ilc.fcrcocc 5)
"H
I en ...... I
I ~
f ~ I: J
J
t.'I4.<.(."".i'.?''''\'~ZO'.'~!''''L.".,",., .?f: " .. ·.!.3~~~4'~~ .. ,_,~ .... ". ",', .•.. ,,_.... ",~ •• ~~,-~.~~ •.. ~~.~,..,,,...,.... "" ... ~.....",."'-. ~.~. ~~.."-,"='~ ....... .,....,""""'.,.,.-..,....,,..,....,....~'

p ... f:'5'A-14 .. P..d!t .• I ........ n.'9.:..G~:.G .. c:R·J._jt __ ~·~._t.. .. _.£ ... 4J:J ...... .t.jJ.-_ ... 1£'& .• iI;;. ;.iL.:·_·J .. :z."._Xi£i_~ .. LL-j.'.S:£'- .... · .. ~--.-.--..... ~ .• ~~.~ .. -.~;.~~~~.~~-.., ).. ....'.: '{-r
VI .Y.
\-4
50
40
30
20
10
0"" o
/
10 20 30 40
---~-.-~
.... -
-- ~-;::;
a > a2
::t 1 _
-~.----.
50 60 70 80
I (]:) (]:) ,
Confining Pressure, a2
a3J ksi
FI G. 2.5 ~10t-lR' SCI RCLE ENVELOPES - KARNAN AND
:t"'f!UT..'J~~ .!E9.r.dtafl?~'t_ ....... , ... C;; ... " :OP,-l:.LR!"q.ttf.".U Dt ..... ltlH;:Lb .L-f_:~ .. } .......... ::r. •• >.~~~~~.!. .... E '-~ __ \ .. ~ ... ,"-" '~~ •.. ,:i... ::--~';~~~~_
f 'l'!
f
BOKER TESTS (Reference 9) I ~:o~.,~.~~~~~=~,"",,','," ',L", '"~~

s..:.·;~~:~'::':T.'"~~~""T?"~~~'''l!?'r~~.~... ..r.:-:-.,~,--, ----.. !,"--~--,-__ '-~---'-.-'-~----'-'-. --.-.. ~~-,-.-.~~ .. ~ .. , r.-:-= ..... -~~-'~N
- 0 ~ ..........
ro ~
2.5 ---~~~l ,~ .. ~~~~.~,~.. '-~, ~< (a) Or~~lcr & Pistcr - linc~r
(b) Bre51cr ~ Pister - Quadratic
.. --,.....--..-.-~~~ .... ----r-..... ....,..........,....,--.-.~.~,~~-
//
o Series 2
2eO
/13 / I // x/
... --~X/
X Series 3A - Groups I & 2 //X
.,/' 6 Series 3A - Group 3
o Scr i cs 30
1.5
/ .",..,-~
~~ o ~ ... ,,.,~
~""""''-i
1.0 I ..y
0.5
o
o .-~-.....-o
o~~ .--- 0
L l-.. h .... , __ ~~~~,~~."'~~,,~.~"'.~~~I._~._~_~,~, ~_ ~~~~.!r.~~ •• _~~. ~~--'I~_~~~_~~
o 0.5 1.0 105 2.0
(J If 3 a c
2.5 3.0 3~5
FIG. 2.6 COMPARISON OF THE LINEAR AND QUADRrqlC FUNCTIONS pr~OrOSEO BY Br~ESLER f\ND PI5TEI\ HITH TEST OI\TA FROn R I CHAnT, Of\I\NDTZAEG, AND GROHN (References 3 nnd 12)
"'-·L~:t,:-.·.~·t,""1.s: •. : .J::_·r.~~~~·!..,_ •• __ ,!" .. , ,J. ,~i •• _ .... :....~ •• * ••.•. ~-~-~.'.'~~,...,.~.~~~~~~.~ •• :---:-",,"~.~~'.-:-~~-.-..--.... --:-:----.--~7'"'~' ,~., ~'~~_~,_.~~ __ ~~. _ ..... _~,_---.-..,.,.-,..........
4.0
, (.'(l
«'0 I
I

p x
-90-
p
1 y
~I FLAN
SECTION I
FIG. 2.7 REiNIUS' KODEl (Reference 1)
I

-91-
F
(2; )
(b)
FIG. 2.8 TWO-DIMENSIONAL KODEl
) t r r f
I t
I I I I I ! t
I l l
I r I I f'
t·

1!~·:!t.Jf:··.·ffi0.nE""r,_.t ·.¥.:"'-"L~,_h.:R;.·..c' ... '5."~·~I •• _;..~,d ...•.. ';"i4§!\;t."·I...o ... r.S',.· .. dA·~·~· ... ~ .. ·l'!I+!.·.!. ,\., ·~ . .!?"'"!lf.".'Et .. ;::J_·_._t·.':·_ .. i.,Li£l ,.' .... ~.,{ -'.,'4i ~.. ·~ .... ·~.~";""":-~ .. --~~~7.~-::- .L •. ·. .A~.~?:'r-:':: •.
III til (U
'..., (/')
p z r ~-. -~~~ .-.~T-~·-~, .. 1·~~·'~~·-~~-~,-~·~~-7 -=.~=. ~
__ ~ ____ ~ __ '- ___ ~ _.I _= ~ ____ I.
....,.-....----____ ~._ ,T· .. • .-- ----
Longitudini11 Str.nin~ E/:
Strain" ex
l I Volumotric Strain, € - 2u
z x
-~~ ... -~.~- · Pre 1 imi nary Fa i 1 uro Theory
~.~. ~.~. ~~ ,rinf.ll Fai luro Theory
'--~----------'~--~--------~~~----~--~~~~~~~~.~---. ---=~~~
Strain
FIG~ 2.9 STRESS-STRAIN CURVES" REINIUS~ THEORY (Referonce 1)
I ({.) N ,
J.:·;'"7"·'':'~''h:l#·. ~:r_ 1~'~\'': .:.'7.··j .~ ... 1.·.\;. ...... , ~.:......,' •• n .... ' .Li. d"k~· .• 3.4U. A~I; I.·'~ ~!:;--T,":'::'"'::'".L[( •. :' .' '.' ~.dEbJ£fb8S . ..c •• l' ..... Shy. ,~ a;:~.,,!:.:, :t. <;~" ,--~~.~~~~~:.:"-. .,, ... ,.,..",,,,.....,,..,,....,.,..,,,....~-.-......,..
.. '/

r,-
I
I I
t, f;
~ ~ ~ fj
-
-III Q..
... \Ii tt) ()
+-J V1
-- :; :.1 6 j-
-9:3-
4·000
3500 ! I I l.,/1 / /'
3000
!
I ! I I t
2500 t I ! 1
~
I t
I l ! t·
2000 I !
I r I t
1500 t
1 000 t-------1l-f-----I--+-----1~f_+___t---__t_---___j
500 ~~--H+--~~---~----__t_-----___j
o ~ __ ~~~~ __ ~ ______ ~ ______ ~ ______ ~
I.~.:.i.,.' FIG. 2.10 UNCONFINED CONCRETE UNDER REPEATED LOADING I l~==~==~~=-~==~~~~-=~========~~f
o 0.5 1.0 1.5 2.5
Strain x 10 3 2.0

L
-94-
/1" / "
-t--~ u c e C)
I.(-(l)
c:::: --UJ U -i-i-
S Vl--c:: w ~ < Q
--~
N
. Co!' -1.1..
r
r .. :

-95-
c·
Plan
p
A
B c o
Elevation
FIG. 3.1 TETRAHEDRAL MODEL
f ~ [ r
I t
I !
I t ~ I
!

I -96-
LJ
I~ '1 B. F r..
A~E r.
1 x:
-t ~
I r t
! I i
I A2
I I V A! ..J 2 Y
N ...J i
A I 4 I A
1
e,G ' f f{
P12n
! so:net ric
x
z
! E,G
E levat jon
FIG. 3.2 BODY-CENTERED CUBIC KODEl

f:::;:::::::;a:!~ ::a:ac:::s::cw: 1':
r -97-
l
! r- r
i
I Lj [
I~ ~ r
!-I
t I A r= A 8,F f
f ....
1 [' IX t
-----r-\
1 l f I : r
[ I A~ f I I
::t I /.: I I - \'
I f ...t A21 1"2 I
I 1\ I l ,
N t
I ...J I ! \:
I
Ai I I r _I_ I
C~G D,K l l Plan ! t
I~ Ll
~I A~C B,D jX
- Z ...J
e C"')
...J
f;
t:
I E,G F,H
f Elevation
~ ~i
~
FIG. 3.3a PROPOSED CUBIC MODEL
4

I~ -98-
t
z
.~ ..•
-
FIG. 3.3b ISOMETR!C OfAGRAM OF PROPOSED CUBiC KODEl

,-----.....,t:- x
-..!
t3
N -f.
! I r ~ I
T 6.,,/2 I
L Fien
z
Elevation
FIG. 3.4 DEFLECTION OF MODEL UNDER UNCONFINED COMPRESSION
f
t r
1·
-:.; ,:
7
1
~
~:' ~ 1
~

:
- N
~ I[
b X
-100-
f
I 10
~------4-------~--~~~--------+-------~~ . ~~ r
'-.i')
r-------~--7_--_+------~--------+_------~ N
0'
~------~-------~--------~--------+_------~ ~ t~
i !
r-----~--~--+_----_+------+_----~I~
~------~------_+----~~~------+_------~ 0 -
~------~-------+------~----~~+-------~ ~ o
~ ______ ~ ______ ~ ______ ~ ________ ~ __ ~ __ ~ 0
1..<")
o M
o N
o o .
o
1
r f r
I !
w r > ~: ~ -U I L_
0.
f-~ c --c::: ~ en ..... 0,;
-l
< ~ ? 0 "'-
1..'1> . M . C!iI -L:.. --

':1 ;'. ::'L!..f." .,.;:.~" ,i:-,d: ,L" .. _ -:;2 .. 3 ,1 •.• , ! •. _,i .. un i.,., T~_ 1\1,.... .ii~;'''' ... '! ~. . ~...,. ; .• _ .• ..: !'.V ,,:..rJ .. _t.: ,.~-,,- ". ! .
too
80
-0 CO
.3 60
5 e -x ro ~ IVI / 1 ~
§ 40 u L.. (1) n..
20
a o 1. 25 2.5
~",:,,<",",:o:-:-.-..q,·.--~-·--:;'-:-:-h
'~~~~-'~~~.~.~-.'=.~~-,
1\ \1 \1 0 ..... •
~.'~_",,,~,', __ ,~~.~--,~,-~-~~ 3.75 5.0
Longitudinal Strain, E
6.25
103
;t
7.5 fL 75 10.0
FIG. 3.6 l..OAD..,STRAIN RELATIONSlllPS FOR A SINGLE Cm1PRESSION STRUT BASED ON A NORHAL DISTRIOUTION Of EFfECTIVE ARJ:;/\ V$. STRAH-l
.~~~''::'?'I-:;~ .. r;~~r:~~~>:('"~. :.',- ••• ~. f •• , ..... ~ i ..'''-::-i. .. .1L .. , ".;. t.v.'5. . ).1 _ .~:-_:.q~~. · .. -'li!.. 't.:.; , ':r-::-:-,~-_ -.----~~7-. ~'.~~~~~--~_ ~ .. ::-~~~ . ~~~~~~,'~

.'?!;-';'.t:;::~"'~JUT:'.'-T"'.::4~,.1""'!"~;';·(~;T~~~~~"-"'t~·tt •. :1'~" -:...Jt:":':t:'&J, t! . .f1 .... '!$7:s~.:.'t1''T.·!;t, .·~~:j·,_}.::.>I..s?.'L~ .. f .. ? ... , '._._ '." '. .~~-..,.,..,.""".~.,.... ... /)--:--•. :, ,."~"!',, .".\ "'_#,.<~ .. _\ .. '4k,F::._ '::;;+;'. 1, :,'?'."!.f~, •
"0 (0 o
....J
~ E
X rg ~
+oJ C OJ CJ "OJ
f;\.
100r-- --, ~ I· r ~~~"~;::':::"~~'~~1~~"~---
/ ~ 80\ ~::j ~
Incrc~sing V0rtical StfDin
I 601 I ncrC;JS j 119 tlor i zont-n 1 St r;) j n
/ ~------ --=.--- I ._--,- ----~------1
/ /
/
40 r-------~_t--~-----t----------t----------~----------~---------I---------~-----
20. { ~
o • I!.. "~~~~~~=""'.~"_~'.~r.=. ~.~~ ... ...,~~~.~.~.~~~_
o 2 3 4 5 6
Longitudinal Strain, E x 103 - z
FIG~ 3.7 COt1PUTED lOAD·· STRA HJ nELI\TI0;~$HI P Of CW1! C t10DEL fiJ\SCD ON A NOfU1AL 01 STRIBUTION OF EFFECTIVE /\HEA VS. STI~1\Hl
7 8
o N I
'-~~~,,", ;-""""""'""~~~~ ... ,'G.,._,,,: ,I..' ~.' .>. ,~:, ... .r: .:~:r~{1
t:L:·

\ . I,.
"U m 0
..J
~ E -X ro ",: ...., c: OJ 0 ~ ~)
a..
100,....-.~--
-.,. . -- '.' '"'' .". ."=." - ,.,-" "'1
M~ximvm load for Strut 3 -5 n 109.4 AE x 10
~ t1nx i mlJm lo~d for St rMt 4 r.:
~ 04.2 AE x 10-~ 80 I ~--,,------{--+------.--t---- ,,-----1
'60
~r 1- ? ---~
~
40
~.----I ". __ 201---1
o ~~~-~~~-~ --...........-r-..)..,......-.-~,,~.~"':2..,~.J"!'.-.r...n\...-rt"Q"'"-r9'r..,.....~,~. -~~ .. ~.~~9'C..~....-.;r-:~=_~. ""-"~~""'~-!~T
o 2 3 4 5 6 7 {3
Longitudinal Strain x 103
FIG. 3.8 COHPUTED LOAD-STRAHl RI~ll\TIQ~;JSfHP FDa A SHlGU: CQtWR(SSIOt'! STRUT BASEU ON A S~a~HEI) DISTRIDUTHK! OF ErF~CTIVf.: ArU::1\ \/5. STRAHl !
1.;:;'·:'l. ... 2.},i. ,~~.i~: .. -:.tt~: .... $ .. ':',!-, ~.·t~ ·v:.ltld. it.1.:. .. i.;.{~._,1 ;:.:1.... . .j..,SlT. .. 'f't, .~' ... ~~, ;i •• X .. :,r--r----.-.-.-. ...,.... _ .. ~.~.~.~. '7'-.--.......-~.~~.-....,.,-.~,..-r-.---.--~. _~.,--;--,...,..~.~.~._ .. ~.~~ .. ~. ".,....~"~. ~.~.~ ..... ~,..... ~ ..... ~.""!~~.~ •• ~ . .,.,..

100
no
-0 tV 0 60 -'
!J a x n:J ~
~
c 40 (I) u "-0)
n..
20
o o
'. ~~~~'':'''1'!~:·'':.:7f,.~ '""r_I' 1 •.• ·,· •. ·/*, ~,.:~~. ,! .. i9~
~~~.~. ~.~~~ .. ~~~~,~~
t1m·dmvm Load for Struts 1 and 2
M 16.47 AE x 10 ~5
M~nimum land for Strut 5 . ~5
m 17..67 [\f, ;t< 10 --- -
.. ,--- _ ..
-~~
.~-~
~~- ~....,.,........~.--. ~. ~~~.
0.5 1.5 2 2.5 3
Longitudinal Strain x 103
FIG. 3.9 Cm1PUTED lOAO .... STRAIN REU\TJQNSHRP fOR A sumu;: TE~!SHX! snnn BASED ON A SKEWED DISTRIBUTION OF EFfgCTIVE AREA US. STRAIN
3.~ 4
o ~ ,
;2lt~:~~·~-\':'1!'"J!:t!i''':'1.'''',-;::I ... ~~f, __ ".T~~~~,:.7e.T .. 'b:f"r,r.::.'''~'f'i'~' :':;i¥'!'''' -;:";".;:;.'.~. ~. ~~~c._-.. -.-·~'~· -: """"'''''''~·~7',.,m .. ...., ......... '7'"l"'''''''''''''''~'''-'''''''''~~
';"-f.. ,. • ~; ~1: ,.

,:,t,.:T .-..• 3 ..... :;:\.1' ..... _l .... ·• ,: •. ,·.i9f.. , .. ·.: .. ,.4\.,£;1.... ..Ii. ...·,.'t .... f •• {·~,I'- .. -.,' r·~~~ .. ~·.'~.~""'.·~·~.7'""-. ~.~.~.~~~-.~.-~. -'-.~' ~ ...... ----.~~--. '-...,..--- ·;~~~~·..-·~~-·~~·-~·T"""·~~r
125 ~.
-0 ru 0
75 ..J
v .L
100
!J F.: x ru ~
...... h
50 (II U '-OJ
0..
25
/ o o
FIG. 4.1
'~T~ ~~~~r.~~.,~~--" __ .. ~~~ •. ~~~-~.~.,-~~~~.. -~ ... ~~---~ • __ " •.. _~ ... ~~.~'.~~~.,.....,....--- ... _._ •• ~_~ .• ~.~~
~ ~
"
~ ~ .~" .~
I~~
.c,.,.."...~~_~~_~~~~ -,~~·-~.~--~~ ... ~"=· •.. _-~_~<_._~~T ... ~~,_ .. ~,~_~~~ __ ~_.=. __ ~~. .~. . . 2 3 4 5 6
• 1 1 3 Longitudlna Strain, e x 0 z
PREDICTED LOAD VS. LOnr:ITUDH!!\L STHAIN rU-:'LATIOnStllP rOI~ UNCONF I NED CONCRETE OASED ON TUE elm Ie nOPEL
7 8
o tTl ,
r
1 • .J " (,. .• ,., ';, .~I o\.h' :.'.J}P~ .... .J. '. ,~.). o_ ... t j -.,": . \.-" ._,~.P.:t!"t. ,"'_.'''' . _ ':. . :~:-""":--~ .. ~.~~~:=-..---.....----~-.--..-:_.~"_ .. _._~ ___ --rr.-.... 'T>1" __ ~~,...."":'~~~. __ ~:--~._~ •• ~..---:-r.-<""..-...-:....-.-.M~-,~~.~~~.~-r:-- .... ___ .. _...-::--:--.~~

J~~!?'.~:':':-,:,\:.;-.v- !. •.. t!a;.!.~~_.C_~.l,.F_· ... r:::tdi·.L3L !...:~-.~.~.i ......... · .... ~~'_-:-n7':'":.~~:=-!~""''''''''''''.''_'''''' __ RdE .... ,
125
100
"'0 co 0
..J 75
~ E -X co ~
~
r.: Q)
50 u L-Q)
0..
25
o o 2
-~~---~-~
-------
345
Transverse Strain, e x 103
x
~~~~-.-
.~~~~~
6
FIG. 4.2 PREDICTED LOAD VS. TRANSVERSE STRAIN RELATIONSHIP FOR UNCONFINED CONCRETE BASED ON THE CUBIC MODEL
-------1--
--
~'-
1----I 7 8
a ()) I
"~.r2:l1.\'t.,f:.W,::r:e.t€tiJ! .. :i,#." .... _d':'i. ... : .·.t'fl .... ,.· .. 4iM <'4i'!Hl;·.srn.ffl.!.·~ .1..1.: •. ·.:..L~.Olhi r.L., MEliK!.!lw.Yli .... t .;~,\t_!/b.,. .~~~. " •. *5'5.6.

!~ 14
12
~ 10 I -0
f, 0 b 8
t- ..........
t
,-.... '0
b
+ 6 0
b
4
!
1- 2
0
I I 1-
107
-1 I I
I j I
I I YI f I I
V /1
I ,/
;~ . '\ Y I ~c"'\\ ~ ./
i 5r t I I I. I I I /v I ~,--
I I
IGo(o) ~r I I
I I
0 10 20 30 4-0 50
~ v i0
6 ,...
x i FIG. 5.1 STRESS-STRAn": RELA! t or~s OF SOD\,- CEf~TERED ,-
CUB ~ C A'KRA Y OF SPHERES (Ref~rence 2Q~ I
t 4 J r f
r
t r t ! Consolidation ~res.sure
(J3 = LO kg/an = 14.2 pS t t (I,edi um f; 3
t'J
n .......... O'l ~
2 M
Loose b
-b
I I
I :
0 y
0 4 8 12 16 20
St ra in in Di rection of rr 1 t Percent
FIG. 5.2 STRESS-STRA~N REL~T tor~s OF FINE SAND OBTAfNEO UNDER TR!AX!AL COMPRESS iON_ (Reference 21

I
! C!I:I:&:~.
-108-
P /4
I
P i4 c c
t '115
P /4 I P /4 c c
I 12 I !
I P /4 I P/4. c I '-c
I p /4 P /4
c c
(a)
K H
H
(b)
FIG. 5.3 PLAN OF CUBIC MODEL SUBJECTED TO CONFINING PRESSURE

}:-::~'J.'~uES.!¥J~~"-·,,,.'!"'_~<:·I"'!~, .... n..;;-t: .. :e....:.· .l,.,t, .• :~,.~l.,: (' .. :..,."!..,;"', :".' · • .!.a. __ ....f.u_.,,~\ ....... ,· •• i._~ ~-........... -~:-. .... ~. ~ . .,.,,-.. - . ....--,..,.----:---o-'---~'T"' . .,..,.....,..----.___._:-0
- U 4-
~
c: <U U 't\,)
0....
150 ___ ::r f ~ + ~~ f ~ "'_l~. 4 ~ -r ~ ~~ ." __ r---~~-~---"1~' ........
~----
120 ~ ~
90
K:~___ I----------t .- ~r=
~f-_______ _
60
30
o t'. t L ~,~ . ..,....."... . .,...,..~. ·., .. : .. -It.T",.",~.= .. ....-::~ ••. ~_~rr.",~ .. ~.~ __ ,,-,:o--).r'P'~"'''''''''_~_''''''''''''_~~ .. J"~-;-I~-:r7"""""--"---'-'-""'~~~_._ .. ~ .. ~.~.~_""""",, 3 4 5 G 7 8 o 2
Lon9itudinal-Strain~ € x 103 . 7.
FIG. 5.4 COnrUTED LOAD-STRAIN RELATIONSHIP r-Oi~ CONCRETE CONFINED BY SPIRAL REINFORCEMENT
(..) 1.0 ,
: .~r.·~~~t"-::'?:lj:.,~..:@~ ,t~''.- ••. -ro-~.~t~·:'''.! •• ~-i ·-_~~'f.~:'"?7._~~?""':~~"" .. ~ .. ""."L""'<""'"''''''''''' --~-.--"'------~.-~~~-~~-~-.-........,-.........,--,. :~.....---'"T'~-~. ~_ "",, .. -T.~' ~..".....-..,.....-.~'.

- t 10-H H
r
I
y
f
r I
FIG. 5.5 PLAN VIE\{ OF TKE 2 BY 2 GR!D
;:; .1
FIG. 5.6 PLAN VIEW OF THE 3 BY 3 GRID
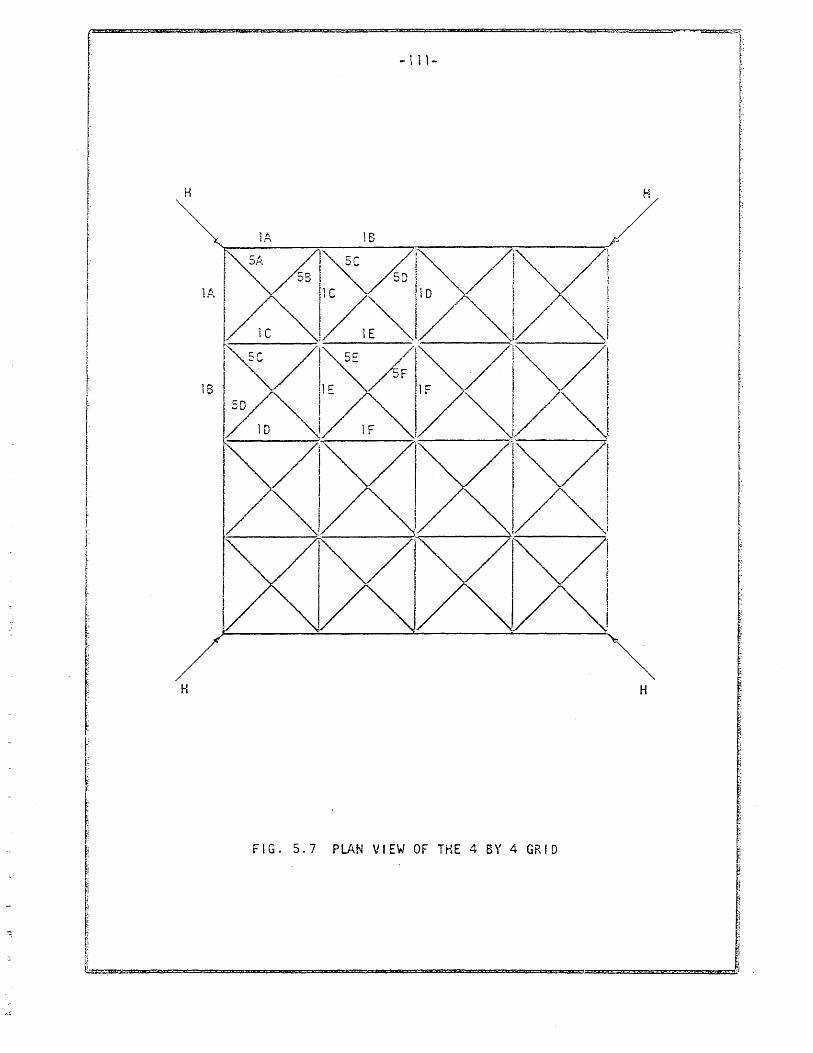
- i 11-
H H
I lA
l I
l
r
I I:
r ~. ~ t t ! I t l- t f l: f ! f r r
H H
FIG. 5.7 PLAN VIEW OF THE 4 BY 4 GRID l:~ ;,
j
! I i
~ J
~
J .

" __ ~Y._I..·.I.~'.:.;~~..?l3::~.:W~_J:-::'='''-';~'~'-:'::~::;;'!'?''~""2:::::-::~''1~~_ry~~'' .. ~}t:_ .. _ .. ,.: 1 __ Si_SJ .. ~€&.'5!l_~..:..i~~:a._, ..
125
100
75 -u 4-
..., c: Q) u "-OJ 0-
50
25
I o 0
/ I
/
1
~~ ~'-~'~'-"~'r-~'-"'~~'
V ~
I~
2
"-
.. -
~
3 4 . .. 5 -
Longitudinal Strain, € x 103 z
~~
b ..
FIG. 5.8 COMPUTED LOAD-STRAIN RELATIONSHIP FOR CONCRETE CONFINED BY RECTANGULAR RE I NFORCEt1ENT, 2 BY 2 GR I D .
~
I-----
'; t
N I
~..::.~~·:,~--,;r.::;..~ ... ~~.n&,"9Eau.§Zj ... M&i'3!LSfi'~.Jl"J.f ,5:._.·1..,_ .. t·. ~l. ...... ''; ... 1.'7', },! ..... " .. , ..J '"··~~~~f·.':~'~·:;:;:,Ii\.I:,~\'. if!.. .<.1.';< . .1.1 .. 3'\1..1 k ,.~.1

[ t
r
I
r
I r
I !
I
112.5
100
- u 75 .... +J
C () U !... Co) 50 0-
25
0
I I - I 13-
/' I
/ /
/ I
1/ ! I t I ~ !
II o
Longitudinal 2
Strain J E
I
3
A
< x 10"
4·
FIG. 5.9 CO!.,I.PUTED LOAD-STRAtr~ RELAT[m~SHiP FOR COI~CRETE
CONFir~ED BY RECTAf~GULAR REi!~FORCEMENT, 3 BY 3 GRID
i25
100
..... -/
/ 75 /
-u
/ ~
+J C OJ U ~
CJ CL
50
25 / I
0 o 234
Longitudinal Strain, € x 103
z
FIG. 5.10 COMPUTED LOAD-STRAIN RELATIONSHIP FOR CONCRETE CONFINED BY RECTANGULAR REINFORCEMENT, 4 BY 4 GRID

h li ~
P===============~============~========='======~f'"
[
I I·
I ~ r
I I
~. I I I [
f [. t L
f~
/ Ii
-115-
V t
___ Unconfined
-- Rectangular Ties
H
H
FIG. 5.12 DEFLECTED SHAPE AT MAXIMUM LOAD, 4 BY 4 GR~D Kagnification 100 x
! r f
I I
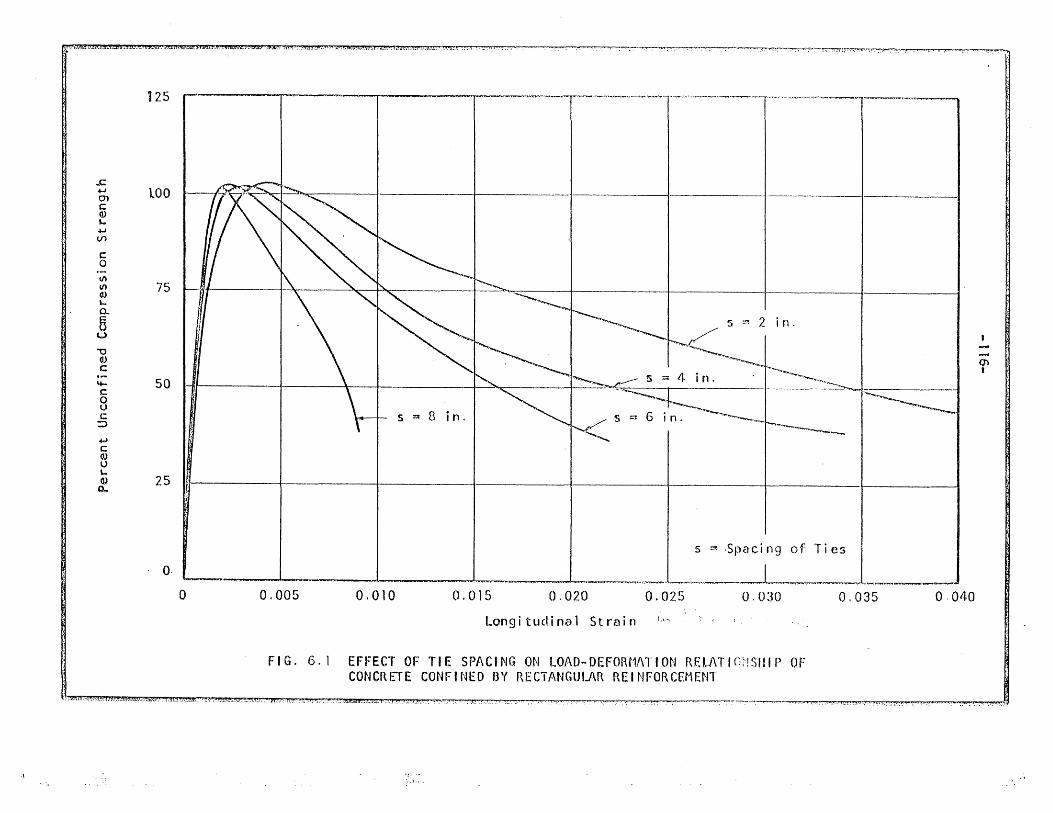
r.i"~-.'ht4-·.J .... F.#_ ..... t.!£iH~_.!'!iU .• _.t"''''_ •. '!.d"j;tt?;:a:e.«Y5'.J.,,:,{",.4 .. '.,.!8i!.~!!M-J .i-..J£.- fL.;, . • ·.'tdl5t,,4"<.~·.A:o..<J.' .. .<;J .... _t~ ..... r.Z!~.h.1E',· .. ,,~t ..... ,.L. "1.,. ...._ ~.~--.,..,....,,.....,..,............,.,~...,.-~~--,....~~~~~. ~:-t"71~'~~:;.'"":"~ .. ;:-:-.~ •. ~ .•. ,"",""""""""""'''''''''''''''''''~~'
125
..c. ~ lOO c OJ "+oJ V1
C o VI VI (1)
'-0..
o U
-0 Q) C
'+-C o U c
::::>
.f.J C OJ U I....
75
50
cf 25
O·
o
;·,-~'1:---;:t~u.':'r.;rJ".l'.:'!':!..7'1.~~v:..~·.1:'.~ .. ";':"';-"l'.1t2~·:·~'T{
~~'~'~"~'~'~~~='~~"-=~"~-~--~--r~-~~~~"';"
5 ~ 2 in.
~:..
5 ::t 8 in.
5 ~ ,Spaci n9 of Ti es
0.005 0.010 0.015 0.020 0.025 0.030 0,035
Longitudinal Strain !..t. ......
FIG. 6.1 EFFECT OF TIE SPACING ON L.OAD-DEFORt1ATION RELATlnrlStllP OF CONCRETE CONFINED BY RECTANGULAR REINFORCEMENT
0·040
Q) I
·~::-~~;~--;~h"_·:."" I ... :'L... .·3 .... ,.. ....-C-:-O·-~·~~+f., !'!"n,t .,~.~. "I~.~'':' . .< ,.,. ."';~

''f'-::\:~'~':.-:..~~:tr: __ !': __ .(_ • .!;!.~_ ~~~~~,~~, ':.. • • ,.~--"I~,'';''.~'T-r_ '~--~"~"""-'---""-.---'- r·"""'-~
..c .j.J
01 C Q)
'-.j.J
Vl
C 0
VI IJ"l (\) \... n. ~ u "0 Q) C
'+-,,'J c::
0 lJ C
:.:> .j..J
c: (I) U L.. 0) a..
125~ '~r"~~~--~~-
1001 I I~~
. 751-1--1
50
25,;,
'~~.~" ~.~.-T'7Yr""",,","""
1-
~. ~. .~." . ..,.,.~. -...-----.,---1~·· ~~.
p' = Area R~tio of longitudinal Reinforcement
-y J ... _"~~~~_ ~~Tr,""--=-~~."....--r"""""'~""~'--:="~.~:::I'!'T'ef.-I.~~~~"-,r_"",,-:-;--"~:-r.,..,..~,....~~. ~C-:!.-~~~"~_"
a 0.005 0.010 0.015 0.020 0.025 0.030 o 035
Lon9itudinal Strain
FIG. 6.2 EFFECT OF LONGITUDINAL REINFOI\CEt·1ENT ON LOAD .. O(FOR~1ATION RELATIONSHIP OF CONCRETE CONfiNED I3Y RECTANGULAR REINFORCEt1ENT
0.040
'~l·I!'i,t;;7~C~.:.~.{1'".f? ... -'i";';:;.:·"<:::;;:~-_.:·:~:r~ •. i.-~J.-'''~'~'~'!'''";':~._t'.·7.,.'';iC_\O;:.,.·.V'j~_!1..:t,;o: .... 11t: ... ' ...... :- ,1, ~ f:-. "~,~"-~~ .•• ---rr--;--'.-~-:"',---"-~ .. ~.~..., . .,--,.~".....,...,. ... ."......,.,....",.,.....,,-.-' .,.,..,."","",~..,....",",,,..""
. .,.,J [ . "

~""",,.:;P·.·-·3.RH..: . .:'~-'tbat.~-'_~,1fu,.. -W ... T ....... J!5'~:: -.. kif..:. s:::i .. Ei!¢.. ..... 5 ... '!i-::'-,.:~f... .. Tf:! _.'1.. , .... _;!L .... e:.·i<.s?-L 1.·J .. JE3ae:;.·.·:.:.o::.. ~;"" .fij •.. 5t'i;;4l' ,_,;::.( 1 .~K ," ...•• {~.; ~ ,.? ;¥. _.... t ..
2500
2000
,...... III)
0. - 1500 a.. . u .....
~f c a. < ft .000
0 \4-<1'
o No.2 Tics
~ No.3 Tics 6fC ~ t. 8f2 1 /~/
/
/ /
/
~7/ / ,,~
//0 / .
/' 0 o
/' /'
/'
I. 2f 2
500 I ~-41.~~~------~~--------~-------
..,~ ..A I. ~l"....~~~~_~~~_ ........ ~~ __ ...... "'""_,.,....9
200 400 600 800 1000 1200 1400 1600
f2 ffl pltf 11/2 (psi) - y
FIG. 6.3 COlut'1NS WITH TIES AND NO LOtJGITUDINAL ftEHtFOnCUH~NT
··-,,;f:'n'~~-f;.~_::7 .... 'lf·1.'":."1!:;}l'i.,.wr.;iOii-i..~1;' ;:: .. :U.:'.i);,·,',-;'..-...,;: C:~.-"'_. ~~'""'":':-~ ... ~. ~ .. p-:~·~~...-~~s : . ..-:' .h.,.I ......... ,' ....... r;T~-·_':...,.
/'.'
00 8

:' ~-i..';:a-::"~~~~;.-¥.
~ a. -
0.. u
\~
:J V)
4-V'I
~I c I « ;j
0..
II
U 4-<J
:':',1~~·~~:-··;:?~.!'ft.~ •.• lr.J~ •• ~·.Jl..:L ._tL"'4":~·' _I . • t ....... .. ?_ ..... ~_.:.t...! ,r:''!."'''·,.....,., ... _.,.....,,.''''., ...... .--~,,..-~~~....,,.~~-~~~..-..-,,..,.,.....-~-'-""-"'-'~~.~,,~.,. t:
r
2500 I r < _ [ - '--~I~' ~-~~~. . //1 o No. 2 TI C" 5 - 2. 4 I / I ./' ~ No.3 Ties
20001 0 S ::: 6
6 s ::r e
6f ::.1 1. 8f Af ~ 1. 4f 2 /"
1- c J27~C .~ / ,,/'
-- / /
1500
1000
500
~ ~ 1.2f ~.~ C
\ / // ,///1// /.~ /..../'-----"'~
/ ~ /-"./ /43//
/~~6o
~/
o~ ~~.". ~.~. ~. ,.,. ~. _~}'t-"""'--T-fI .. ~~ . ..., .. ,....·ro-~1~~. ~=. ~11~~~~......--. .... ~~~.,.!.''-~~~~~~~~.t...,...~~~~~
a 200 400 600 noo 1000 1200 1!l00 1600
f2 ~ r" f "/2 (psi) - y
FIG. 6.4 COLU~'NS HITH TIES AND 4-NO.2 I..ONGIT!.JDHlf\L OARS
(0 ,
·.:\It;:r;::.b:k.=-:I,;;t;·_ .. '!±L ... ,- .• L~,t:.·, .. ,,t~.-:.(.:e:a!>A!"?~:.~· .. A2'-1iQ ... :a:.z.··j ..... ::::.!.lt:~'""yt::1~~':.~ .. :..? .. u,'!... ·:~:c..I'jI)1 .. '¥ ... '!'±iJ.·": __ o:.CII"i'£~.<;... ..t .. ~~~,-- 'T~' __ :'<" __ '._'~' .~.=.~,-~;:-:-... --

f·1·tMt ... UfWtn\* ... i.l.S!'.7. La." .• o, ... . i.¥ , ... tJB!S ~ ..... ,4!fU 3t""f~!.J, .... !.~ •• f... ./ _" ;·liri_'..Ii!!~_: ... ') .. __ 2 .. '--'-'_}i.... '. '."'1 -'~-.~ .. ~. " .. ~ .. ~'.'.'.""'''''~
-If)
0. .........
a.. u
4-
" o "-<1
2500r---------~----~----r------·
o No.2 Ties, 5 ~ T' 4
o No.3 Ties
20001 B S = 6
6. s = £3
'-~T-~
~fc :ct 1.8f2
/
~=~ .-.~~~~-.~-~'~-~~--.-~_~ .. ~"'~/" .. r.
~
/' '7
// 16f"C =
//
15001 1 1 I. ·1////17/1:~ 1.2f21
/"
/ /
/
0n
I:AI e t------ -
5001 ]/ r 74' ] ... L-----t17J\~O-=---1----+-----l--
./ /b-
01/ 0--- 200 400 600 800 000 ~'~~l~OO ~~~~1400
f 2 =: p"f /'/2 (pa i)
FIG. 6.5 COLUHNS WITH TIES AND 4-NO. 3 LONGITUDINAL I1l\r~S
'00
N o I
1
j-·~~! .. r~S •. Ef',;J!Id!nH£ .• ,:cJItE~.A?;:::L"d!ii.'_::'.it!R"f'll'.Lh_'''1:.''''-.,: .... -t'!1[4t'.;" ._i, .30:: ",j!-.. ~tL·:j.i."'":.:,,.l£9r.J.liS]t>Ji_ ... !S~ •• :!~~!,b.,. !,Lfa · .• J?~" •. L.;\ I,t! r., ::r.. ..~. :-: .. ~~~. li.f . .'.11. ,;Fl!I .. ~:_,.}~".l

.f:. ...., en c; qJ '-...., II)
'-Q)
""0 c:
>-u
-u ~ c:
4-C 0 u c: ::l
'+--0
-4J c;; 0) 0 '-4) a.
125 '-r-"'-~---"
lOa
75
50
25
I I ~
1
"
I, I<~
'~I
A o r L--- L-__________ ~ __________ ~
o 0.001 Q.002, . 0.003 0.004 0.005 0.006 0.007 0.008
Strain in Fai lure Region
FIG. 6.6 TYPICAL STRESS-STRAIN RElATIO~j FOR CONCRETE CONFINED flY RECTANGULAR TIES
N

1) ro 0 -l
+J Q.) e: E :J e -X IU x: \t-0
4.J
r: ~) u "'" q) 0..
a U)
~ f1)
c: .-ro t... 4..J
Vl
.. 0 If)
w
0.05
I I
0.041
(1
L ~ --_\
----~--------~-.-- ---~-~ T--'--~
o No.2 Ties
h. No. 3 Tic~
~ 'j
0.03
0.02 -1----
0.01
A
o I....--....... ______ ~_
o 0.2 0.4 0.6 0.8 1.0 1.2 \.4 1.6
!l/h
FIG. 6.7 RELATION OET\~EEN STRAIN AT 50 PERCENT t1AXBH)l\ NET LOAD AND RELATIVE TIE SPP,CING
1.8
N N I

-123-
APPENDIX A
EXPERIMENTAL WORK
A.l Test Specimens
A total of 60 specimens were cast and tested in 15 groups of 4.
The specimens measured 5 by 5 by 25 in.
The n0:i11nal concrete co:npresslve strength \'laS 3000 psi and the
nQ~incl volumetric ratio of the transverse reinforcement was 0.02 for ali
sPecime.ns.
The va r i ab 1 es "','2 re:
el) Spacing of transverse reinforcement (2. 4, 6, 8 in.)
(2) Stiffness of transverse reinforcement (No.2 and No.3 bars)
(3) Amo~nt of longitudinal reinforce~ent (area ratio, pE: 0,
0.008, 0.Oi8)
(4) Stiffness of longitudinal reinforcement (a secondary variable
as a result of the different tie spacings)
Each specimen was assigned c designation consisting of four numerals
having the following significance: The specimens were grouped into different
series according to size and spacing of transverse reinforcement. The first
numeral indicated the test series to which the specimen belonged.
Ro. 2 ties at 2-in. spacing
2 2-No. 2 ties at 4-in. spacing
3 No. 3 ties at 4-in. spacing
4 3-No. 2 ties at 6-in. spacing
5 4-No. 2 ties at 8-in. spacing

-124-
The second numerzl was used to distinguish the specimens having
the same variables.
TC:D ~ eA. 1 •
The third nu~eral described the longitudinal reir.force~ent.
0 Ho longitudinal re:nforcement
2 4·-No. 2 longitudinal bars
3 4-!\0. 3 longitudinal bars
The fourth numeral indicated the size of ties.
2 !~o. 2 ties
3 t..:o. 3 ties
A su~ary of the properties of all the specImens is giver. in
A.2 Concrete
(2) CelTIent
Marquette brand type ~I I portiand cement was used for all specimens.
(b) Aggregates
The concrete was manufactured using Wabash River sand and gravel.
Because of the close tie spacing used, the maximum size of the gravel was
restricted to 3/8 in.
The absorption of the sand was 1.6 percent and that of the gravel was
2 percent by weight of surface-dry aggregate.
(c) Concrete Mix
All aggregates were oven-dried before each batch of concrete was
mixed in order to control the strength variation throughout the test series.
/

-125-
The no.~in21 mix proportions were 1:3.6:3.9 (cement:sand:gravel) by weight.
The water/ce~ent ratio was O.76~ corrected for absorbed water.
The cOT!pressive strength of the concrete was determined by testing
6 by 12-in. cylinders, and the tensi Ie strength was measured by splitting
tests on 6 by 6-in. cyl inders.
The properttes of each concrete mix are sum~erized in Table A. 1.
A.3 CastinG. Forms, Reinforcement
(a) CastinQ
Al i specim5ns v~re cast in a horizontal position, and the concrete
was pieced using a mechanical hand vibrator. Twenty-four hours after casting,
the specimens were r~~oved fro~ the forms 2nd stored for five days in a moist
roc~, maintained at iOO percent relative humidity and 74°F. They were then
placed in the laboratory for a minimum of 24 hours before testing.
(b) Forms
The forms were constructed of steel, and were manufactured with
extreme care so as to maintain the dimensions of the specimens within a
tolerance of 1/32 in. The bottom of each form consisted of a 7-in. steel
channel, and the sides and ends were 5-in. steel channels. The sides and
ends were bolted to the base to foci litate removal of the specimen.
(c) Reinforcement
Both No.2 and No.3 reinforcing bars were used for the ties and
longitudinal reinforcement. The No.2 bars were round. with a diameter of
1/4 in., and the No.3 bars were deformed, ~lith a nominal diameter of 3/8 in.
and a n~~ina1 area of 0.11 sq. in.

-126-
A 24-in. test sample was cut from each length of reinforcing bar,
and tes ted in tens i on to fa i 1 ure. The s t ra i ns dur i n9 each test \'.-ere deter
mined using a~ 8-in. sage length. A su.nmary of the properties of the rein
forcing bars is given in Table A.5, and typ.ical stress-strain curves for the
Ho. 2 and No.3 bars are sho~~ in Figs. A. I and A.2 respectively, ~~ addition f
~ histogram of the yield stresses for the ~o. 2 bars is given in Fig. A.3.
The ties were f2bricated by cold bending. The ends of the bar
\\'ere lapped a distance of approximately 2 in. and \"-"'Blded. The ties were
placed in the forms so that the laps occurred on two opposite faces of the
specimen only, and on each alternate tie on each face. In the specimens
with no longitudinal reinforcement, the ties ~ere held in position during
casting by connecting them with No. 14 gage annealed wire. The ties in the
specimens with longitudinal bars were positioned by fastening each corner
of the t,e to the longitudinal bar at that corner by me2ns of No. i9 gage
wi reo
Each specimen with longitudinal reinforcement contained four bars
extending throughout the length of the specimen, one at each corner inside
the ties.
A.4 Instrumentation
Since the tests conducted by Szulczynski (5) gave relations
between longitudinal and transverse strains, and indicated that yield strain
had been reached in the ties '.at maximum load; it was decided that only the
longitudinal strains would be measured during the tests.
The instru~entation which was used In the test program is shown in
Fig. A.S8.

- 127-
The over-all deflections of the specimens were determined by
measuring the shortening between the upper and lower loading plates of the
testing machine. This was accomplished by means of two O.OOl-in. diais
attached to extenso~eters and placed at the north and south faces of the
spec i men.
In order to measure local deformations of the specimen, and if
possible the deformation at the fai iure zone, the deflection of the speci
men h''sS also mec:sured o\!er t~K) continuous 2-in. gage lengths loc2~e.d near
the mid-height. For this purpose, three square frames with approximate
inside dimensions of 5 1/2 by 5 1/2 in. were constructed fro~ 1/4 by 1/2 in.
steel bars. The spacing between the frames was maintained by means of spacer
plates. The frames were attached to the specimen with pointed machine bolts
w~ich were threaded thr-ough the bars, and after they were in place the spacer
plates ~~re removed. The deflection between the frames was measured using
eight O.OOl-in. deflection dials~ one in each gage length on each face of
the specimen. By this means it was also possible to determine whether any
bending mQ~ent was applied to the specimen during testing.
A.5 Test Procedure
The specimens were tested with a 300,000 lb capacity screw-type
testing machine.
A particular effort was made to apply axial load to the specimen.
Accordingly,S by 5 by 1/2 in. steel plates were attached to each end of the
specimen with plaster of paris. The plates were instal led whi Ie the specimen
was in position on the loading platform of the testing machine, and a carpen
ter's level was used to ensure that the specimen was vertical and the plates

-128-
horizontal. The deflection dials h~re then positioned as described in
Section A.4, end the specimen was placed under the cer,ter of the loading
head. The position of the loading head was fixed, but the use of the
level plates at the ends of the specimen caused a geo;l1etricai lv-axial load
to be app 1 ted.
A l02d of approx1mateiy 10 tbs \;.~as appt1cQ to the. s.pecimeri t cfter
~:hich initial readings h'ere made on the dials. The ioc:.d was ~ncre2sed in
IO,OOO-lb increments up to the maXimu.l1. (t ""'25 necessary to discontinue
testing of the plain specimens when the maxffll.um load ~f2S reached, bec2use
the stiffness of the machine was insufficient to prevent complete fracture
at this point. fn the tes.ts of the tied specimens D incremental strains were
applied beyond maximum load such that the 102a decrements ¥.~re approximately
10~OOO lb. The tests were discontinued ~hen fracture of one of the ties hcd
taken place, or, if no fracture occurred, when the load had reduced to about
10 percent of its maximum value.
After each load incre~ent (or clecr~~ent)t readings of the 10 deflection
dials were recorded, as well as the time. The latter observation was made to
provide a measure of time-dependent effects during the test.
A.6 Measured Load-Deformation Charecteristics
The results of the tests on the specimens with ties and no longi-
tudinal reinforcement are summarized in Table A.2, and the test results on
the specimens with No.2 and No.3 longitudinal bars are summarized in Tables
A.3 and A.4 respectively. in Tables A.3 and A.4, the net maximum load of the
specimens is included. This has been computed by subtracting from the total
load the load carried by the longitudinal bars, in order to give a measure of
the effect of confinement on the concrete.

-12S-
Graphs of load vs. measured strains are given in Figs. A.4 to A.34.
In these graphs, curve gives values of average strain over the length of
the specimen, computed on the basis of the total shortening of the specimen;
curve 2 refers to the average strain over the upper 2-in. gage length of the
specimen, obtained as described in Section A.4; and curve 3 refers to the
average strain over the lower 2-in. gage length. !t should be noted th2t in
Figs. A.4 to A.34, curve 1 indic~tes an initial strain at zero load. This /
is caused by the fact that the p laster of ,Pari s at the ends of the specimen
compressed during the early stages of each test, after in:tial readings had
been recorded for the t~~ extensometers. Curve 1 has been plotted by extra-
polating the lower portion of the curve to intersect the zero load axis.
True values of the average over-a] 1 strain are therefore obtained by sub-
tract i ng the in it i a I st ra i n fro:n the va I ues represented in curve 1.
Figures A.35 to A.57 are graphs of load vs. strain in the fai lure
zone, for the specimens with ties. In cases for which fai lure occurred
within the tw~ 4-in. gage lengths on the specimen, the strain in the fai lure
region was obtained di rectly from the mounted dials. For the specimens in
which fai lure occurred outside this length, the shortening in the fai lure
zone was computed by subtracting frQ~ the total deflection the deflection of
the uncrushed portion of the specimens.

-130-
TABLE A. i
PROPERTIES OF SPECIMENS AND CO~CRETE
Hark Tie Size lO:1gitudinal Concrete Bar Si ze Slump Age a.t Co.l'lpressive Tens i Ie
" Test St rength-;" Streng t h'~'\
:.:-- 1 n. Days ps i ps i ---1102 Ho. ,-,.2:
L .--:
-.:... 1122 [~o . 2 !~o • 2'b" 2 1/2 10 3080 320 1132 1\0. 2 Ho. 3 (2) (3)
1202 No. 2 1222 No. 2 No. 2 2 i/2 8 2980 2S0
~
(4) (4) 1232 Ho. 2 No. 3
1302 Ro. 2 1322 No. 2 No. 2 2 1/2 9 3700 310 \332 No. 2 Ho. 3 (4) (4)
2102 No. 2 ~~ 2122 No. 2 Ho. 2 2 10 3480 350
2132 f-;:o. 2 Ho . .;. (4) (4. )
2202 f~o • 2 U 2222 No. 2 No. 2 3 8 3480 34·0
\ 2232 No. 2 I~o. 3 (4) (4)
2302 f\o. 2 \...:.... 2322 Ro. 2 No. 2 2 1/4 7 3370 340
2332 No. 2 No. 3 (4) (4)
3103 No. 3 ~/ 3123 No. 3 No. 2 2 1/2 7 3320 360
3133 No. 3 No. 3 {4} (4 )
3203 No. 3 I, 3223 No. 3 Ro. 2 2 1/2 7 3440 320 /,
(4 ) (4) ~~ 3233 [~o. 3 No. 3
3303 No. 3 ? i 3323 No. 3 No. 2 2 1/4 7 3390 340 L..j.-
l 3333 No. 3 No. -3 (4) (4)
-/( Based on 6 by 12-in. cylinders. Numeral in parentheses indicates number of cylinders tested.
-rr--:, Based on splitting tests of 6 by 6-in. cylinders. a Plain bar, 1/4-in. diameter b Deformed bar, Nominal Diameter: 3/8 in.
Nominal Area: O. 11 sq. in.

-131-
TABLE A. 1 (Cont'd)
Hark Tie Size Longitudinal Concrete Bar Size Slump Age at CCY.11pressive Tens i Ie
Test Strength* 5 t r en 9 t h~l~ in. Days psi psi
4-102 ~:o. 2 4122 No. 2 !~o • 2 2 1/2 7 3150 310
'......:7 4·132 1\0. 2 No. 3 (4) (4)
';·202 No. 2 4222 No. 2 !-!o. 2 3 1/4 7 3200 310 4·232 No. 2 !~o . 3 (4) ( 4.)
4302 f~o . 2 4·322 t,~o . 2 No. 2 3 i 3380 320
. ~ 4-332 No. 2 !~o . 3 (4) (4)
5102 Ho. 2 /. 5i22 No. 2 No. 2 2 1/2 7 3330 320 y~ ,_/
(4) (4 ) 5132 No. 2 No. 3
5202 1\0. 2 :..- 5222 Ro. 2 ~~o • 2 2 1/2 8 34!0 340
5232 f-!Q. 2 r~o. 3 (4) (4 )
5302 Re. 2 ...... ,...~ 5322 No. 2 1\0. 2 2 1/4- 7 3460 350 ~-""",/~
5332 No. 2 No. 3 (4 ) (4)
.. }\ Based on 6 by 12-in. cy I i nders. Numeral in parentheses indicates number of cy 1 i nders tested.
*"* Based on splitting tests of 6 by 6-in. cy 1 i nders. a PIa in bar, 1/4-in. di ameter b Deformed ba r, No:ninal Diameter: 3/8 in.
Naninal Area: o. 11 sq. in.

1 I02 1202 1302
2102 2202 2302
3103 3203 3303
4i02 4202 4302
5102 5202 5302
2
rl2ximu:n Load
p u
ki ps
90.0 89.0
102.0
86.0 93.8 89.5
90.0 86.0 91.7
85.0 85.0 85.0
85.0 85.5 90.0
-132-
TABLE A.2
TEST RESULTS: SPECIKENS WfTH TIES ONLY
3
Max i mt.ril Stress P fA u
PSt
3600 3560 4-080
344-0 3750
3600 3440 3670
3:(00 34·00 34·00
34·QO 34·20 3600
4
Cylinder Strength
f' c
ps i
3QE.O ZSSO 3700
3480 3480 3370
3320 3440 3390
3150 3200 3380
3330 34iO 3460
5
Prism* Strength
f cp
pst
3560 33Z0 4·200
34-00 3520 3680
3430 3480 3800
3,4·00 3360 34-00
3370 344-0 3400
6
p u
A fZ c
1. 17 1.20 1 • 10
o.gg 1.08 1.06
1.09 1.00 1.08
1.08 1.06 1.00
1.02 1.00 1.04
* 5 by 5 by 25-in. unreinforced specimen.
7
p u
A f cp
1.01 L07 0.97
1. 01 1.06 0.98
1.05 O.SS 0.97
1. 00 LOl 1.00
\. 0 t 1.00 1.06
8
0.034 2
0.0262
0.037
0.022 0.030 0.0!7
0.016 0.019 0.013
0.020 0.009 0.009
0.006 0.009 0.009
** Average strain at the time the resistance is reduced to 25 percent of maximum.
a Average strain at tie fracture.

-133-
TABLE A. 3
TEST RESULTS: SPECIKENS WITH T!ES ARD 4-RO. 2 LONGITUDINAL BARS
1122 1222 1322
2122 2222 2322
3123 3223 3323
4122 '4222 4322
5122 5222 5322
2
Maximum Load
p u
kips
95.0 94.5
108.6
98.8 99.4
95.0 94.5 96.7
90.0 90.0 90.0
90.0 95.0 89.0
3
Load Ca r r i ed By 8ars A f
S su kips
8.4 9.4 8.9
8.6 10.5 10.6
9.2 9.2
11.0
9.4 10.6 9.9
10.4 9.6
10.1
4
Net J-i,aximum
Load p .:.A f
U S s-kips
86.6 85.1 99.7
84.7 88.3 88.8
85.8 85.3 85.7
80.6 79.4 80. 1
79.6 85.4 78.9
5
P -A f u 5 su
A
psi
3450 34-00 3990
3390 3530 3550
3430 3410 3430
3220 3180 3200
3190 3410 3150
* 5 by 5 by 25-in. unreinforced specimen.
6
Pr i sm* Strength
r, cp
pS t
3560 3320 4200
3400 3520 3680
3430 3480 3800
3400 3360 3400
3370 3440 3400
7
P -A f u s su A f
cp
0.97 1. 02 0.95
LOO 1. 00 0.97
l.00 0.98 O.SO
0.95 0.95 0.94
0.95 1. 00 0.93
8
O.046a
a.02Sc
0.04203
0.024 0.025 0.026
0.019 0.034 0.015
0.014 0.018 0.013
0.006 0.009 0.007
~~ Average strain at the time the resistance is reduced to 25 percent of maximum.
a Average strain at tie fracture.

-134-
TABLE A.4
TEST RESULTS: SPECiMENS ~!i TH TIES AND 4-NO. 3 LONG i TUD ~ !\AL Bp,RS
2 3 4 5 6 7 ~;
r'ia rk Maximum lO2d r~et p -A f Pri sm;', ? -po f -r.,t-.,t, U 5 S!..! U S SU E
Load Carried r'ieX i mU:ll A Strength A f P
Bv Bars Load cp
I
P A c P -A f psi .:; I .
U S su u s su cp kips kips kips ps i
1132 1""0 a 20.8 88.2 3530 3550 0.99'· O.033a
1232 u ..... b
20.8 68.2 2730 3320 0.82 0.0356 89.0 1332 118.7 20.0 SS.7 3950 4200 0.94 0.025
c
2132 102.9 24.8 78. t 3120 3400 0.92 0.0392
2232 1\ 0.0 24.8 85.2 34·00 3520 0.g.7 0.028 2332 110.0 24.8 85.2 3400 3680 0.93 0.038
3133. 1 12. 1 24.8 87.3 3490 3430 1. 02 0.025 3233 108.0 2S.0 83.0 3320 3480 0.96 0.038 3333 1 14.0 25.2 88.8 3550 3800 0.94 0.047
4132 \05.0 25.2 79.8 3190 3400 0.94 0.014 4232 107.8 24.4. 83.4 334-0 3360 0.9S O.OiS 4332 106.9 24.4- 82.5 3300 3400 0.97 0.013
5132 101 • 7 25.2 76.5 3060 3370 0.S'1 0.009 5232 1 11 .3 25.2 86. 1 3440 3440 1.00 0.007 5332 106.9 24.4 82.5 3300 3400 0.97 0.007
:~.:. :.:.
-
* 5 by 5 by 25-in. unreinforced specimen. 1~~ Average strain at the time the resistance is reduced to 25 percent of
max i mu."'. a Aveiage strain at tie fracture. b Local fai lure at end of specimen.

-135-
TAB LE A. 5
PROPERTIES OF REt~FORC!NG BARS
Hark Si ze')'r Yield Maximum Location No. Stress Stress (PIC r k of Concrete Specimen)
f f' Ties Longitudinal sy 5
ks i ksi
2 51.1 79~S Ii 02 2 2 48.0 74.6 i 122 3 2 51.9 79.3 1132 4 2 ~·2.9 66.3 1122 5 3 47.3 69.8 i 132, 1232 6 2 54.0 76.3 1222 7 2 ~·6. 0 69.2 1202 8 2 48.0 70.6 1232 9 2 49.8 78.4 1302
10 2 4-5.5 68.8 1322 1 1 2 51.2 76.8 1332 12. 2 47.8 70.4 1222 13 3 4·5.5 71.1 1332 14 2 4-5.5 69.6 1322 15 2 4·7.4 69.5 2102 16 2 50.6 78.6 2122 17 2 53.6 78.6 2132 18 2 54.7 80.9 2202 19 2 50.6 77.2 2222 20 2 49.5 70.9 2232 21 2 49.0 71.6 2302 22 2 48.0 74.6 2322 23 2 44.1 67.4 2122 24 3 56.4 91.4 2132. 2232 25 2 53.7 79.4 2222 26 2 54.1 80.5 2322 27 2 44.9 67.4 2332 28 3 56.4 90.6 2332 p 3133 29 3 56.7 90.6 3103 30 3 55.3 87.0 3123 31 3 55.3 88.4 3133 32 2 47.1 68.4 3123 33 2 47.1 70.6 3223 34 3 56.7 90.7 3233 35 3 54.9 88.2 3203 36 3 56.4 91.0 3223, 3233 37 3 57.3 93.4 3303 38 3 56.6 91.2 3323, 3333
* No. 2 Plain Bar, \/4-in. diameter. t-lo. 3 Deformed Bar, Nominal Oi ameter: 3/8 in.
Nomi na 1 Area: 0.11 sq. in.

-136-
TABLE A.S (Cont'd)
Kark Si ze* Yteld t'iaximum Locat ion No. Stress Stress (Kark of Concrete Specimen)
T f C Ties Long it ud ina 1 sy 5
ksi ksi
.... 0 ~ ..... 2 55.9 81.1 3323 ~·O 3 57.3 93.7 3333~ 4-132 4·1 2 47.0 70.2 4102 42 2 49.2 76. 1 4122 43 2 49.8 79.0 4132 44- 2 48.0 69.6 4122 4·5 2 47.6 69.9 4202 ~,"6 2 4·8.8 75.9 4~222
47 2 46.0 69.3 4232 48 2 54.1 79.3 4222 49 3 55.5 88.5 4232, 4·332 50 2 49.0 79.9 4302 51 2 53.1 81.4 4322 52 2 46.8 69.9 4332 53 2 49.2 76.8 5102 54 2 48.8 71.S 5122 55 2 4·g .0 71.6 5132 56 2 48.2 75.9 5202 57 2 53.7 80.5 5222 58 2 52.0 78.8 5232 59 2 50.5 77.8 4322 50 2 49.9- 76.9 5302 61 2 50.6 77.4 5322 62 2 47.5 70.5 5332 63 2 52.9 79.4 5122
:.:";
64 3 57.3 91.8 5132, 5232 65 2 48.8 70.0 5222 66 2 51.5 76.5 5322 67 3 55.4 87.5 5332
* No. 2 Plain Bar, 1/4-in. diameter. No. 3 Deformed Ba r ~ f{om ina 1 Diameter: 3/8 in.
Nominal Area: o. 11 sq. in.

I
r
f I
I f
I I i I
I
o o
o ro
j' .•
I
\
- l37-
\ \
I I
o N
o
! I
~
I
o
o
o
o
o
o
~ o o
N o o
o.
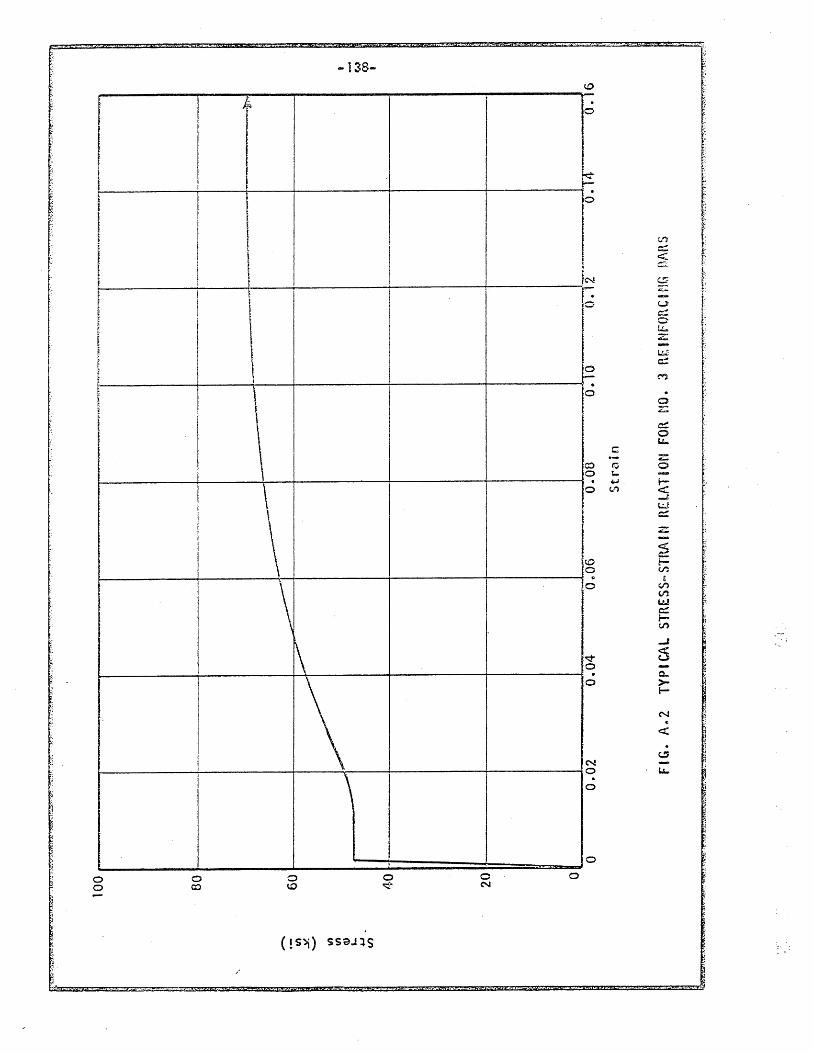
[ 1 l
i
I
o o
I
I ! I I
I
.. ~
{
I
/
-138-
\
\
\ ~
\
(!S'>l) ssaJ~S
o ~-
o N
o
· 0
~ ~
~
en c::: <:: c.
iN r.:; - ~ · 0 u c:::. 0 tk Z
I..l.C c::
0 I.- M ' . 0 .
0 Z;
c::: 0 L:...
c: z:
c:> ~ 0 0 t.. · ~. I-0 V"I <:
...t r..:J. c:: Z
~ ~ I-0 <.r.
$ E 0 V')
(J"l
L.t.J c: l-V')
....J
~ 5 0 . . 0-0 >-
l-
N . <:(
c:..:J N 0 LI.. · 0
0

.-.~~.,"" < ..... .o..t'lo., ........ tt/;.) n ... !X.~~·_.H_~ ... £.'JtO . ..::'S':! •• !!d.S22.";.." ,,:t .. -) .. :tt!"~~r)~ .. ,.:;sr~jttl': ...•. q:.z... '~" ."7'~~~:-~"""'~-"""",_,,""~_~_, __ ,--~_,....,~ __ _
Vl C Q)
E u (\) a.
(/')
u .... o "'. 0)
.t:l
3 z
I 0 r-- "., ~ ~~_~~~~~~~, _,
8
6 'it! Mean Yield Slress = 49.5 ksi
E' ~~=."'-"'=~'''. .'----.
::::::::::::::::::::::::-:=:::- -----=--=-==--====-=---==--==--==.-
~~~~=~&;~~i~~ Number of Tc;,ts =: 5\
Standard Deviation = 3.0 ksi
4
--.'-' -,----_.'-- .
2 -- -----_. __ .... _----
o L i~L~_ ~"' __ "~~'-'=-'-','_~~~.-::;;::- __ ,~.:::= 40 45 50 55
~
Y i e IdS t I' e ~) S t k s j
FIG. A.a HI~~TOGRAt1 FOR THE YIELD STRESS OF NO.2 R['NFOnCING BI\RS
60
(..,)
to ,
,.c.=" .. '"-r-.£.!C=""-,,-,,<"!tt-z; •..• .l.'.I!>',,(!. __ .--,, "~\~\ft"·.w .. I.U •. ,r:., .. , .. ,e, .1. ... D¥"I7'r, ..... '~"-=-"""."':".'" .~ ~'. ' ~~_~_~_ .. ----.-. ~~. ./:'

100
" I
75
f t, r t
r: [. 50 " t
25
VOl 0.. .-~
.. -0
0 co 0
...J
-m .-)(
<
75
50
25
o
-140-
I 2y~/l/~ 4- 3 '1 //
". . // v
II f II
I I II I ! , I I ! ' 1/ /
I //' V r
I; ,~ I I
if
/ I (a) Specimen 1100
I t I
I 3 ~~ / L~2
1 [001" VI
I;
/ I; /}
/1 ;I /
~ ,/ 'l
. ~ ;p
.f (b) Specimen 1200
o 0.001 0.002 0.003 0.004
Unit Axial Deformation
F!G. A·4 MEASURED LOAD-DEFORMATION RELATIONSHIPS . FOR SPEC I MENS 1100 AND 1200
,
t
f
I I t
I
0.005

[
r , 1«
r
r f
r
t f ~ I,
\:
I
i ~
~ L
I!"I a.. .-~ .. "'0 ru q
-c:;;
x: .:;:
100
75
50
25
0
75
50
25
o
;r;;;~-:-~-
I 3 __ ?i ;r ! //
/? I / I - I ~_1
L /' f I
/ /1 I I I !
I /
/ I I
I I l I I
! I I I ! I I
I /1 I
f I
! ! I
I
, I I 1/ (a) Specimen 1300 I !
1
l
./' / /" I
I I
// I
A.L-- 2,3
,/' ./ K #
I I /
I I I , ! V / / I
V (b) Specimen 2100 I
o 0.001 0.002 0.003 0.004
Unit Axial Deformation
FIG. A.S ~~EASURED LOAD-DEFORMATION RELATIONSHIPS FOR SPEC~MENS 1300 AND 2100
; I :1.-.
f
E
! t
t
I ! l ~ t t-
~ ! t [
I ~ ~ b
~ !
0.005
tt ]~ e t ,
t
f
I I f ~
f t t 1 t

\"1 c.. .-~
.. v ctl 0 -l
-Cti .-~ <
-14·2-
100
I I l
L' 2,3 75 ------~~--~~--------~------~------~
50
25
0
75
50
25
o o
;/ t
f / ! /1 / ! I I I
I / I ! /
I / I / I
/ I
I
;/ '{ i;
(a) Specimen 2200
f
~/ / ~/ /~/ j
2 I II I
'II :(3 1
1/ I I . I
V 1/ I;
1/ / I I
I I
1/ 1/
~f (b) Specimen 2300
0.001 0.002 0.003 0.004
Unit A~;zl Deformation
fiG. A.6 MEASURED LO~\D··DEFORH.ATION RELATIONSHIPS FOR SPECtMENS 2200 AND 2300
I i I r,
~
0.005

r
t f.
I fi
-ro
it, . a;;;;
:= -143-
100 I:
t
t
751 2 -Jj 17, 1~, i
1/;13 ' [I
t r--tl /1 t,
50 I I j / I
r 1/ / :1; II
I ,II 1/' I . r I ' I i
25 ' f i I i I I ~
/1 /.' ! r f
if ! t
/
1 f f I (a) Spec~men 3iOO I o~--~~------;------~----~I~----~I
t
I. // / 1// 75~ __ ~-4~-----+------~-----__ +-____ ~f Lil I
/I~ 3 1
II 50~~/~/~ .. __ ~ __ -+ ______ ~ ______ +-____ ~
/ I V I 1/1.:
25 i // /1 /1
1/ t (b) Specimen 3200 O~~ __ ~ ______ ~ ______ ~ ______ ~! ______ ~
o 0.001 0.002 0.003 0.004
Unit Axial Deformation
FIG. A.7 MEASURED LOAD-DEFORrATION RELATIONSHIPS FOR SPECfKENS 3100 AND 3Z00
0 .. 005 ,.' ..•..•. '.
f;
.,
I i

100
I f
75
~
I 50
~.
25
I,l~
0-.-~
.. v m
0 0 ...l
-cv .-x: <
75
so
25
a
- 144-
3 /// / ~~/ //
1A-2 / t
I I ~ I , ; t l
! I I I
I I V
I
I t I I I / /
/ . I I I
'I (a) Specimen 3300
,
/'
/ 2:3 /
..... /
/1 K I
1
/ I
/
/ V /
I /
/ / I /
/ (b) Specemen 4100 ,
o 0.001 0.002 0.003 0.004
Unit Axial Oefo~mation
FIG. A.8 MEASURED LOAD-DEFORMATION RELATIONSHIPS FOR SPECIMENS 3300 A~D 4100
i
I /,
i I t. ! t
f
I 0.005

f
I ! ! !:
r I
t I I:
.-~
-co .-x <
100~ ___ ~ _____ t~45_-___ ~ ____ -~~_"_""_'_·-__ t·~ I I
75~1 ______ ~~/--/-" ~~~------~------~!------~
o
/
2 ~ / ,.)~
I
I
0.001 0.002 0.003 0.004
Unit Axial"Oeformation
FiG. A.9 KEASURED LOAO-OEfORYATION RELATIONSH~PS FOR SPEC(ME~S 4200 AWD 4300
0.005

100
75
50
25
!IV c.. .-~ .. "0 m 0 0
...J
-r.i .-~ <
75
50
25
1 , o
-145-
/,/
V ~/ // t?/ 2 "I
~ 3 ""-- 1 ,
11 I I ;
. // ;I
V
I I \
(a) SpecimEn 5100
i ! (
/ V ! ;f/
.. /
107
3 ~ V
!; ~2 1
II /, f/ V ~ lj if
/1 /1
U ~ o
(b) Specimen 5200
0.001 0.002 0.003 0.004
Unit Axial Deformation
FIG. A.IO MEASURED LOAD-DEFORMATION RELATIONSHI PS FOR SPECIKENS 5100 AND 5200
l
I
0.005

too f ! !
75 I
In C-
o-
~
.. SO -0 ro 0
-1
CO .-X. <
25 I
/ o :/
o
- t47-
/ /" / /
2,:;j/ 1
/ I I
/. V I I
/ I /1 I
I I
0.001 0.002 0 .. 003 0.004
~~it Axial Deformation
FiG. A.ll KEASURED LOAD-OEFORHATlO~ RELAT[Of~SHe PS FOR SPEC~~EN 5300
0.005

lOO
I K
75
25
rr. C-.-~ .. -c;
0 cc 0
--L
-Q
~ <
75
50
25
0
- t48-
(al Specim8n 1102
tl· "I ~,~ I ~, "'- ........
I --- __ -=~ 2 "" f -- --, f , , ~ I i . f I I = . ~
------------~ ----
I (b) Specimen 1122
0 0.01 0.02 0.03 0.04
Unit Axial Deformation
FIG. A. \2 ·KEASURED LOAD-DEFORMAT;ON.RELAT;ONSHIPS FOR SPECIMENS 1102 AND 1122
0.05

I t
.. -0 .
cr.: o ..J;
120 r---___ -r-___ -1~4.-S----___r_1 ----.. ,""'"!"p '---"-' ~-I
30 ,t, I
r I
25~ - ___~, -
~
(b) Specimen 1202 o~!)------~--------~----------------------~ o 0.01 0.02 0.03 0.04
Unit Axial Oefonmation
F~G. A.13 MEASURED LOAD-OEFOR~ATiONRELAT'OWSHfPS FOR SPECa~E~S 1132 AND 1202
0.05

! [: ~
f I 1
l.:
((;,
~ -~ ..
u co 0
...l:
-Q .-~ <
-150-
too
11~~ I
.{ I \ .~ 75 ~f \ >,
ifi I ""' 'I \ ........ 3 tl . iii! ~ ..........
f: F
I [ f ~ I ? h ! t - ~ I I 50 f; t • I I I
~l: j t I
~l i
I ! t) f I !~ '"1l r 4
25
..
, .
(a) Sp~cfmen 1222 0
r.
~ (\ H 75 II "-
, r I
~~ I 2 p 3 , I vI
~ 50 f I I f , f
f 25 ig
I ,
!I (b) Specimen 1232 o~i/ ____ ~ ______ ~ ____ ~ __________ ~
o 0.01 0.02 0.03 0.04
Unit Axial Defonmation
FIG. A.14 MEASURED LOAD-OEFOR~~TION RELATIONSHIPS FOR SPECIMENS 1222 AND 1232
0 .. 05
f.

~ Q.. .-~
... v c::; q
-c;:; .-x <
-tSl-
100 if!i\:\" fi \ \ \ II \\\ 1\
75 t \ I \
Ii \\ 'I \
I: \~ '" {t I '"
50 r! 2-if\ ",,-:I ~,,~ ---V~ I, ___ '
.1 '''''~-=-~ ~L (' I -L I 25
0 t~ ____ ~, ______ ~!~.~~~~(_a_}_S_pe~'C_i~~t~_n_'_30_2 __ ~
I I
I
SO
60 I ~ "" k- ., r I 2 ............. /1 ~ __ ! -r
30. J+f'~ -----+-----+-----!-----!------1
1/· r.
O~·E ______ ~ ______ ~ ______ ~(_b_J_S_pe_c_im_en __ l_32_2 __ __
o 0.01 0.02 0.03 0.04
Unit Axial Deformation
FeG. A.IS MEASURED LOAO-DEFOR~TION RELATIONSHIPS FOR SPECIMENS 1302 AND lJ22
0.05
I

t"
.-~
-152-
120 :'\
/11 f I . I \
gO I ! J i\ i f I i
~I< I 1/' \ J! ~2 I
60 fJ I' i~\ \ I if" \ to ~ ~ tI"I,..
I( ~
I t : ~
d 30 f
(a) Specimen 1332
O~!--------~-------+----~--~------~--------~ i
(b) Specimen 2102
0.01 0.02 0.03 0.04
Un it A1d a i Defonnat i on
FIG. A.16 MEASURED LOAO-DEFOR~~TION RELATIONSHIPS FOR SPECIKE~S 1332 AND 2102

.-..::L
I i '5
-153·-
I I
I I i I~~L i I -J I I
2
-L_
(b) Specimen 2132 o~----~------~------~------~--------
o 0.01 0.02 0.03 0.04
Unit Axial Deformation
F~G. A.17 MEA?URED LOAO-OEFOR~4T'ON RELATIONSH!PS FOR SPEC~KE~S 2122 AND 2132
0.05

f:
t I ! I
~
a.. .-~ .. "'0 ro 0 -l
-0 .-x: <
-a·s
-154-
IOO~----~~------------~------~------~
75
so
25
(a) Specernen 2202 0
75
fl ~ ~2 so I \~'"i"-
-/ 3 1 - -- -~ ___ Ir ~ -25 ;1' _____
J
(b) Specimen 2222 o~----~------~~----~--------------~:
0' 0.01 0.02 0.03 0.04
Unit Axial Deformation
FIG. A.18 MEASURED LOAD-DEFORMATION RELATIONSHIPS FOR SPECiMENS 2202 AND 2222
0.05
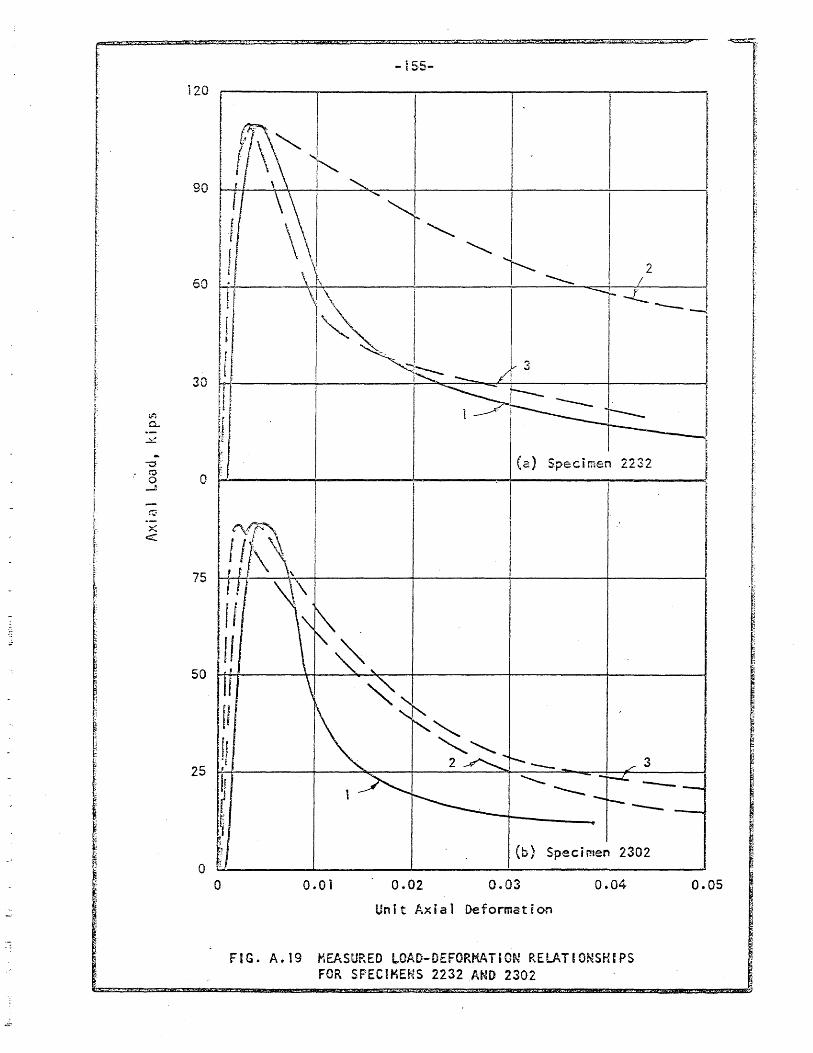
r
f
IA 0-.-
..:::.:.
~ .. -0 r:I 0
--.n
-~
x <:
-
-
~ ; ...
- ~55-
120 I
90
\ I" ~ \1 60 ! n ~ I
1/ ~
I
! ' ~ -;::---30 ~ I
q
2 I I ! r-L.. ----t
f
!
f-
L .. (a) Specimen 2232
0
75
50
__ 3 25 ~-r------+---~--~------~~--~~~~~,~----~
--r--------T -=-o
a
(b) Specimen 2302
0.01 0.02 0.03 0.04
Unit Axial Deformation
FIG. A" 19 MEASURED LOAO-OEFORMAi;ON RELATlONSHIPS FOR SPEC!KEWS 2232 AND 2302
0.05
i f f:
. ?

r t
t f.
I I
t·
l'" 0-.'-~
.., "0 (J Q
...J
-r.; ~
<
-155-
~oo~~----~------~--------~------~--------~
! : I I
75~1~--~~------~--------+---------------~
I \ Il~ II . II
-rJ, t ' \ ~v ,
, I f \
!Ii r ( r , 3 Z5 t,"_ -e
90
(a) Specimen 2322
60~ ______ ~ __ ~~~~~~ __ ~ ______ -+ ______ ~
·1
30~~ ______ ~ ______ ~ ____ ~~c= ______ -+ ______ ~
(b) Specimen 2332
o~------~------~--------~--------------~ o 0.01 0.02 0.03 0.04
Unit Axial Deformation
FtG. A.20 MEASURED LOAD-DEFORMATION RELATIONSHIPS FOR SPECIMENS 2322 AND 2332
0.05 .

100
75
50
~
C-o-
..:::!.. .. 0 "0
r.:: 0 -J.
-r:; .-x: <
75
! I 50 :
25
o
-157-
Th ~}\
{iff \ efrl ,
/f!\
l' I . (I ! I ht-H '
.III! 1 iq I
~! I
1" i
t..:f ~ ___ 3
I!/ i I I- (~) Specimen 3103 :f
r\~ I \ \ I \\ I 1\ I 1\ . ; " I
. " , , "
f
.. ~
I! ~---- ~2 f --r- ___
~ I I
~ ~3 I ---
(b) Specimen 3123
o 0.01 0.02 0.03 ·0.04
Unit Axial Deformation
FIG. A.21 MEASURED LOAO-DEFOR~~T~ON RELATIONSHIPS FOR SPECIMENS 3103 AND 3123
I !
I t I
! I
I
r
I t
- -
0.05

r
r
[ I
trI 0.. .-~
.. v ct'! 0 -l
-r..; .-:< <
... 158-
120
f: T\ f, : \
30
0
{/' \ 111 \ WY
1
I I
ill 'K fl· Ir; /."..- 2,3
I, I ,..- --1 I f
I -- p
;1
II I (a) Specimen 3133
60
75 r' r~ t. j '" " t J "" { I "'-
..........
f I \ ~ ..... ..........
I ~1 ~ 2
I ..........................
~ I
" 3 ...........................
f ............ /" -----. ............ ..........
I----I r--... ___ --
50
25
f ' ~ (b) Specimen 3203 ti o
o 0.01 0.02 0.03 0.04
Unit Axial Deformation
FIG. A.22 MEASURED LOAD-DEFORMATION RELATIONSHIPS .FOR SPECIMENS 3133 AND 3203
I
i (
! f
! E
!
I
I
----.. l
0.05

.-~
<:
." £
-159- :~ : too~------~----~~----~-------~------~ E
I r I f
I 75~~~~~ ____ ~~ ____ ~ ______ ~ ______ ~
so
60
30
o
-n .- ~ 1
f I 1 'r'
d
!f (a) Specimen 3223
t
/t\ lq
\ ' f"
I I • I r'\ ,
I ~ I I ~ I V 2 ,3 I---
, . I f -----r-------I ! o
(b) Specimen 3233
0.01 0.02 0.03 0.04
Unit Axial Deformation
FIG. A.23 MEASURED LOAD-DEFORMATION RELATIONSHIPS FOR SPECIMENS 3223 AND ,~233
0.05
, ~:,
'.

iDa i
f
r
I 75
~
r r [ 50 t \.
t ,. t I: 25
f
! ,,"'I a..
x ..
-0 0 Q
:f\ I T .'
\ I II f
I t
I ! \ I i \ . I I r
r f \ I f
If!r ~ I I · I it! \
I I ../ 2 t 3 .....- 1
f f .\ ;
I
l ~ .
(8) Specfmeo 3303 . .3 -co -)~
<
75
f [
\ f t., tl I II I 'I
50
, i f I \
1\ , i :
, , __ 2,3 ./ 1 \
f ~ I ~ ,.
25
~ (b) Specimen 3323 fj o
o 0.01 O~02 0.03 0.04 0.05
Unit Axial Deformation
-FIG. A.24' KEASURED LOAD-OEFOR~~TIOW RElp.TrONSH~ PS
FOR SPECIMENS 3303 AND 3323

~ Q... .-~
.. -0
r;:::
.5 -~
x: <
Ii I
t ~
30
0
75
50
I '\ '~
I -~,~
1-
I (~) Specimen 3333
'. ~.. ......... < 3 ""'- '<:: 2
l f --- ___ 25 I 1 -- r-- - ~
I i ~r----- r- ..::::::- -== i' . ------+---1---'
II o ~IU!~ ____ ~ ______ ~ ______ ~(~b~)_S~pe_C_im_en __ 4_10_2 __ ~
o 0.01 0.02 0.03 0.04
Unit Axial Deformation
F!G. A.2S MEASURED LOAD-DEFORMATION RELATIONSHiPS FOR SPECIMENS 3333 AND 4102
0.05

100
75
50
25
cF. a. -~
.. 0 -0 r:; 0. -'-
-0 .-..., <:
gO
60
30
o
-162-
f(\ '" ", I I I , \ '" I I !~
\ " ! II '" r;
t f "" I i l ~ .......... l11 \ -~I 1 d
l J-..-
~~J 1 I ""--- ............
II
"" f: , ~
! ~ f
I "'< ,r ~ r3 r-:
(a) Specimen 4122
I I
1'1\" I j. " I I~ " "'" I I " I I " , I "'-,
I I " 2 ....... \ . 1 r-.. --- --Z'" I --_I ---f f
~ 'f f
I~-"I
~ ~ o
1.- 3 1 .....-
I "'--~ (b) Specimen 4\32
0.01 0.02 0.03 0.04
Unit Axial Deformation
FIG. A.26 MEASURED LOAD-DEFORMATION RELATIONSHIPS FOR SPECIMENS 4122 AND-4J32
0.05

100
75
50
25
\n 0-
.:::t. .. ~ 0 m 0 -J
-l'tl
:1
~,
4-
:1 75 '·1 i j
·,1
\'j
:j 50
25
o
-171-
,
.L: ~ 1 .~
~ 1 .........
L
(a) Specim:en 1102
- ---~ ~ i
~
~ \
I I i 1
i
(b) Spec!men 1122
a 0.01 0.02 0.03 0.04
Unit AxJal Deformation in Fai lure Zone
fjG. A.35 RELATIONSHiPS OF LOAD VS. STRA1N lfJ FAlLURE ZONE FOR SPEC~HENS 1102 A~ 1 ?
-
i
1 i
I i I
~
I

en 0..
..:L
j . '"'0 'j Q
:'1 0
--I
J :lJ ,1 .-1 X 1 <I: I l i
... j
j :-j :j
'j
J 1 1 1
:1
1
I 1 )
L
-172-
120
o ~
751 (\
II \ 50 L \ il~.1 I I I I 11 I I - I 11 I, II~
25 Vr-------~I--------~.----------!~~---=~--r_--------1
1 I I i I 1 I I I 1 I I
o 1 i I (b) Speclmen 1202
o 0.01 0.02 0.03 0.04
Un it Axi a 1 Deformat i on j n Fa i 1 ure Zon:;;
fjG. A.35 RELAT]ONSn~PS OF LOAD VS. STRAiN ~N FAjLURE ZONE FOR SPEC1MENS 1132 A~D 1202
0.05

I I ;j ;
-r,; x -<
100
75
50
25
o
25
o
-173-
(a) Sp~cjmen 1222
I d I! H ;1
ij
J
I I
(b) Specimen 1232
o 0 .. 02 0.03 0.04
Unit Axial D~formatlcn in ?a~ lure ZonE
fJG. A.37 R~u\T~{)ijSH1?S OF LOAD VS. STRAl;.J B-1 FAlL)j~E
ZONE FOR SPEC1~ENS 1222 AND ]232
~ "
I "
r
0.05

~
0-
~ .. '""C ro 0
....l
-'" .....,.
j .... , «
1
I :1
i :l
-174-
100 --~~--~--~--------~--------__ ------~--------~ ('\ 75 i!-+---~~--*-----+---+---~ ---+------i
~ 50 ~ __ ----_4--------_+~--~~--~--------~------~1
"-r--------1"-------_.....;1
25 *--------4~------_+--------~--------4_------~
(a) Spscim~n 1302
O·~~--~II--~--~I--~ ;
9J0~ I
1/ ----- I . ~ I
60 [I I~~ ______ II ~ J .
11 J
I I I ~
30 I' i I I ; (b) Spec~men 1322 1 o ~ ______ ~ ________ ~ ________ ~ ________________ ~ij o
FIG. A.38
0.01 .0.02 0.03 0.04
Un!t Axial Deformation in Fa! lure Zone
RELAT~Oi~SH1?S OF LOAD VS. STAAB~ HI FA~LlJRE ZONE FOR SPEC~MENS 1302 AND 1322
0,05

! 120
- t 15-
I~I I I
I f
L
t f
l ~I Q...
t .-t
.x. ..
t ""0 m 0
r
-1.
-~
x <
I
I
90
I , ~
I r-----I ~
i ~ ~ ~
I I
I
f
50
30
i
!l I
{a} Specimen 1332 0 I , I
75 "'" \1 50 ~
" ~ r---------. ------25
(b) Specimen 2102 o
o 0.01 0.02 0.03 0.04
Unit Axial Deformation in Failure Zone
FIG. A.39 RELATIONSHIPS OF LOAD VS. STRAIN IN FAILURE ZONE FOR SPECIMENS 1332 AND' 2102
I I
~
f J r
I I
0.05
r
~
I ;

r= t
I r t
! t' ~ ,
r i-f ~
t·
[ \.'1
r 0.. .--
j': ..::,!.
...
r v ro
I 0 ...t
-f.:
co .-V'
t: <
lOO~ ____ ~ ______ -_i7~6 _______ ~; ______ ·_=~rn ____ ~ I '.
~.I------+---L.---+-_
50 1M-i I ----+--_~___+I-____t__________{ 1/
251 \'-4-1 ---+-----+----t-----t-------1
il o
if I
I I
I I I I (a) Specimen 2122 I
[
I~ I
I I 90
60 I ~
~, I i
I I
I 30
I I I
i
(b) Specimen 2132 o
o 0.01 0.02 0.03 0.04
Unit Axial Deformation in Fai lure Zone
FIG. A.40 RELATIONSHIPS OF LOAD VS. STRAlN IN FAILURE ZONE FOR SPECIMENS 2122 AND 2132
~
! I I ! t
I I
I
0.05

111 c... -oX.
.. ""0 r:; 0
...i
-0 .-x <
F:
I
-177-
100~------~--------~-------r--------'1-------'
I (I I i \
75~~!~----~------~--------~-------r------~ I ~ I
I ~ 5°1/ I ~
II I I I----r---- -25
0
75·
50
25
0
II I ~
Ca) Specimen 2202 !
!. ~------~--------~-------r------~r-------~r
!/
~ ;
:
0
\
t
I ! I
~r------r-----_~~~ I --
(b) Specimen 2222
0.01 0.02 0.03 0.04 0.05
Unit Axial Deformation in Fai lure Zone
FfG. A.41 RELAT:ONSHIPS OF LOAD VS. STRA~N 'N fAILURE ZONE FOR SPECrKENS 2202 AND 2222

{~
C-.-~
'"' -c:; a:; 0-
l -f. ~ , -r
I ~
- t K <
I t-t ~
l i l t
f
I 1 .. \: [ I ," I I I:
r
.--
t1Q~~--~~~------~~~---r--~----~------~
t I r II !.~ I I I 1"-
en l I I ~~~------~--~~--~------~--------r-------~
111 II I -u !'~ I,
60 ~;------i-----+-----r----~-~~:---------) 1/ I
U I'
r~ H I ~{li' ____ -+-___ ---t_--,--__ -+-___ ---+ ___ --j
1
0
75
50
t I I' L Ca} Spectmen 2232 ~
t ! l ! I I ~.
i (\ I t
! I
f \ I
I ~ 25
~ 1
~ ~
o "
I ----r-----I
~ (b) Specemen 2302 ~. I
o 0.01 0.02 0 .. 03 0.04
Unit AXtBl Deformation in Failure Zone
FtG. A.42 RELAT~OWSHfPS OF LOAD, VS. STRAfN IN FA~LURE ZOWE FOR SPECfKENS 2232 A~D 2302
j.t. 'he'if!! - "sI,1
I t ~
1 ~
I i ~
f h
J.
I
t r
I f
l ! ~ !
t
! j
I
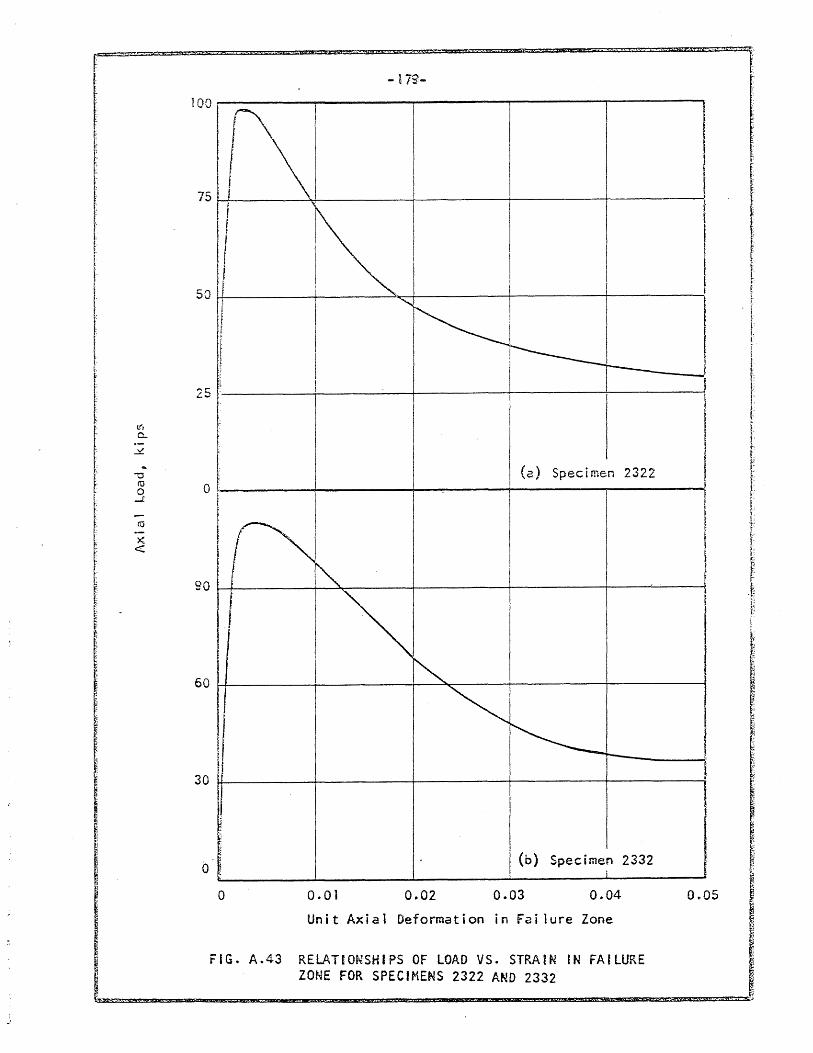
l-
-17S-
100
75
I
i f I
II "'-
I"---I I l --------------[ I I
[ I (a) Specimen 2322
t t
I
~ i f
i ! ~
~ ~ ~ ~
~
30
(b) Specimen 2332 i o
o 0.01 0.02 0.03 0.04
Unit Axial Deformation in Fai lure Zone
FIG. A.43 RELATIONSHIPS OF LOAD VS. STRAIN IN FAILURE ZONE FOR SPECIMENS 2322 AND 2332
I I ~
I
I ! ! I
I
0.05
I",' ~ f;
r-5* ( N-"

-t80-
lOa I 1,1 I
I \ i I f, \\ I ,t
7S t ,
r-f '\ I I ! t I
! I "'! I t f t ! j , , II
. f I f r I I
50 [/! I h I H i
! H I f Ii I ' If tr t .
if I i i t, i t
t· iJ I I .f 25 ~:!-. ----+------J-----+---~ ...... '= ______ ------1
ill ------I I ~ r I I I -c r (e:) SpecEmen 3: ,03 f 8 0 L. ____ ..!.--____ :w ____ ...J. _____ ,.-___ -:
! ~ I 11\. ;. it· ! 75 ~~--~-\-----~----..r------+-----{ f J I .
t {
f
r I t. t
f
r I i.
t II II: ..•.• ,:.. C:_,Q ~.I .... ,.::---I--~---!---+---+-------1l ~ [i - II I r il ~ l r.:;.: t; t
~ 25
1".. I
r . 11 f
~ ol~ ________ ~~ ____ ~ ________ ~(_b_)_S_p_ec_i_m_en __ 3_1_23 ____ ~ ~ f:· .... ~·.:., •.•. '::·. 0 0.'01 o. 02 0 .. 03 o. 04 O. 05 I." .. r •.•• l:,~.: ~ Unit Axial Deformation In Failure Zone ;
~.~.. FfG. A.44 RELAT~ONSHi?S OF LOAD VS. STR/dN nrf rA!LURE I,,~.~.:,' f ZONE FOR SPEC~ME~S 3103 AND 3123 . k ~'>~!Ei=-,.,--:sz~===, .... = __ lZl/lrm~.~Ii!.'!t:ZI:IS ___ 1m7!:l3I:IIrr:l.lW....,.,~=_::&;/l;·m: __ II!lI:!im:IllmJ"==="""""""'~!lQliI:5!i~==='~=~.""!2::~~' %1Il:il££W5f:::t:l· ~~~~:m:I1lll!:!:l*, .:s,0.-.

-i81~
120
30
60
~ '\
~ I
I
I 1
I ~I ' l
I~I--- I t,
I I
so
t."t C:..
.:::;. :
.. -0 0 ~
(a) Specimen 3133
0 ~
-Q
~ <
75 (\
~
~ ...........
~ I----,! r---
'j ~
50
25
E ~
') , i·
a (b) Specimen 3203
o 0.01 0.02 0.03 0.04 0.05
Unit Axial Deformation in Fai lure Zone

r~-=~!QO
1
-I82-
f
r
25
~ (a) Specimen 3223 -o~ 0 (;': o -i
-Q
90
60
o (b) Specimen 3233
o 0.01 0.02 0.03 0.04
Unit Axial Deformation in Failure Zone
F£G. A.46 RELATIONSHIPS OF LOAD VS. STP~tN EN FAt LURE ZONE FOR SPECIMENS 3223 AND 3233
V.i.;; •.• *5? .

100
75
50
I'
25
4.'"< 0..
..::!.
.. 0 ""0
('J
0 -t
-'it ..... " <:
75
50
25
o
-183-
I ~ ~
I L ~ I n ~
:
rr ~ I
tt
~ :
~. (a) Spec i men 3303 I
\ \
~ ~
~ I ;
~ ----r-------(b) Specimen 3323
o 0.01 0.02 0.03 0.04 0.05
Unit Axial Deformation in Fai lure Zone
FiG. A.47 RELATIONSHIPS OF LOAD VS. STRAIN !N FAILURE ZONE FOR SPECIMENS 3303 AND 3323

~.
I I I t
t
I ! !
I ~ 0-
0-
~
f
.. v f.;
l 0 ~ ...J.
I -rc: .-t
~
I < ~
t,
~ ..
I i
ti f: [j
,
~:
I l
~ ~ !
i I ~ ~,
~ ~,
120~----__ ~ ______ ~ ______ ~~ ______ ~ ______ ~
30
I I , I fr
I p I If I ~ I f: I
I I ..
I I
o (~ '\
0-1 Speccmen 3333 f I ~. r
f
i ~, 75
....
50
" ~ I
"
~ . ;
25 ~ -----
I (b) Specimen 4i02 I o o 0 .• 01 0.02 0.03 0.04
Unit Axial Deformation in Fai lure Zone
FiG. A.48 RELATIONSHIPS OF LOAD VS. STRAIN IN FAILURE ZONE FOR SPECIMENS 3333 A~D 4102
jS m!!!! \ .,
:
f
f t ~ R I ~
! I I
-
0.05
eg
t I
! t

100
l 75 I
so
25
tI'i 0..
X
.. V 0 co 0
...J
-cc: ... , ,... <
90
60
30
o
-185-
~
I~ ~ I
II ~
!----- I -----J f
I ,
t I ~
~
I ~
(a) Specimen 4122 i I
I ~ ~
~ ~
!----------- -i ;
, (b) Spectmen 4132
o 0.01 0.02 0.03 0.04 0.05
Unit Axial Deformation in failure Zone
FIG. A.49 RELATIONSHIPS OF LOAD VS •. STRAIN IN FAILURE ·ZONE FOR SPECIMENS 4122 AND 4132

I ~ t j I I [
f
I r i )
I f III I a..
I .:;!.
... l '"Oi r' ~
I-0
..J.
I -[ Q
f x
r <-
I' I. I,
i l
"
i f! .,
-tB6-
SOl ~ 1
; ~ 25 r----.f------1--~:____+_---_+_---_;.;
!. ~N
II (a) Specimen 4202 O~~ ______ ~ _______ ~~ ______ ~I ________ ~I ______ ~
1(\." I:
-:c (v~--~--~-----4-------+--------+------~
\ 50 ~--+-~~' '--+----t-----t---~
~
. ~r-----_ 25f--------~----~-----~------_r~~ _____ ~~
I o (b) Specimen 4222 I ~------~------~------~----.------------o 0.01 0.02 0.03 0.04
Unit Axial Deformatgon in Failure Zone
FIG. A.SO RELATIONSHIPS' OF LOAD VS. stRAI~ (~ FAILURE ZO~E FOR SPECfXENS 4202 AND 4222
0.05

~ ~'
i ~
1: r
! t I: !
t ~
[
I I
~ 0..
~
.. u m 0
-l:
-Ii:i
:>< <
-187-
120
I
90
60
~ I
I ~ ~> I I
! I
ij ~l .
~ . II r----1 I I , 30
r-
(a) Specimen 4232 I f: 0
(\
\ 75
"'" ~ ~'
!
50
25
o (b) Specimen 4302
o 0.01 0.02 0.03 0.04 0.05
Unit Axial Defonnation in fai lure Zone
FIG. A.51 RELATIONSHIPS OF LOAD VS. STRAIN IN FAILURE ZONE FOR SPECIMENS 4232 AND 4302

C}
0--.::L.
.. ""0 m
~. 0
! .J
l
l C';; o-
f
~ <
\ ..
fi
t r t1 ~j "
11
l~ t!
I ~ ~
-188-
100
25
75
~. I I
~ I
I I
J I ! I I I
II ~I
.~~ !
;
I·
50
I 0 F.
(a) Specimen 4322
i I I
£0 (\
., I
I
60
30
~ '. ... ; I
~
~ t,
~ "'-
-------r---'. '.
0 (b) .,Speci men 4332
o 0.01 0.02 0.03 0.04
Unit Axial Deformation in Failure Zone
FIG. A.52 RELATIONSHIPS OF LOAD VS. STRAIN IN FAILURE ZONE FOR SPECIMENS 4322 A~O 4332
I
r
~
I I I
I ~
-.
0.05
f .~

t
C'< c... ~
.. ""0 r.:: 0
-A
-'" x <:
-189-
100
75 (\
I \ I ! I I
! 1
50
25 \
~ 0
(a) Specimen 5102
75
If\ I
50
!
~ -------25
(b) Specimen 5122 o
o 0.01 0.02 0.03 0.04
Unit Axial Deformation in Fai lure Zone
FIG. A.53 RELATION~HIPS OF LOAD VS. STRAfN IN FAILURE ZONE FOR SPECIKE~S 5102 AND 5122
I
0.05

r' ........ ~·?-·
I
t r
I f I
! [
I.
I t, f
i r
I I'
~:
tl [i
~
~.' •• ~ ~ !~ 1 .. ,
~
a. .-~ .. v
t'tZ 0 ~
-C'i.1 .-x <
iSk
1 00 .---/:A----,.-------y----~:____---.,_---~
I I I I II 75 L----+~--------+_------~------_T------~ n II ! i d \~I \
50 f~f------~~----~----~------_T------~ r: II
\,
[I l
15
(a) Speclmen 5£32
75
50
25
(b) Specimen 5202 o L' ______ ~ _______ ~ ______ ~ ______________ ~
o 0.01 0.02 0.03 0.04
Un it Axi a 1 Deformat i on i'n Fa i 1 ure Zone
frG. A.54 RELATfONSHiPS OF LOAD ~SO STRAfN f~ FA[lURE ZOME FOR SPECIMENS 5132 A~D 5202
0.05

I,
f-r
I: fi
f ll'\ 0...
f 0-
~
I~ ..
I '"'0 1\1 0
...J
t ct'!
o-X
<:
!
-191-
100 I
75 I~
\ I
50
I \ I I
II 'I
25 f
r\.
r
(6) Specimen 5222 0
(\ gO I
60
\ 30 I ~ I
~ ~ ~ r---
o (b) Spec~ ,-.en 5232
o 0.01 0.02 0.03 0.04
Unit Axial Deformation in Failure Zone
FIG. A.55 RELATIONSHIPS OF LOAD VS. STRAIN IN FAlLURE ZONE FOR SPECIMENS 5222 AND 5232
I
I
I
I
I 1
0.05

r t l' ~ ,
~ l
I (.
I ! : I
[-
i i 1
t
1
I (
I
1 I I.~
l a. -i ~
! Go
I -0 Q
0 ....!
[ -(Q -K <
100
75
c:r: ~-'V
25
I I I !
I I
I {\ I l
I I ,
I i
I j
II I
I
I I I
! I d I ! I
i , I
i I f ! I '..J I
f I I I I
I
I t-l I ti I t I ,f. , I I
f: I ~I-----L ~
(a) Specimen 5302 ·0 r
I
75 {\ , I \
50 \
~ -
r \\,
I~ I---
25
o (b) Spe.ci men 5322
o 0.01 0.02 0.03 0.04
Unit Axial Deformation in Failure Zone
FtG. A.56 RELATIONSHIPS OF lOAO VS. STRA~N IW FAiLURE ZONE FOR SPEC I XE"'S 5302 Af~_O 5322
I
r t ~
i ~ t
i l
~
0.05

I
r II)
c.. .:x.
.. -0 IV 0
-1.
c;! .-x <
120 I
I I
I
so (\ l
60 I \ ~ 30 )
~ o o
------ -
0.01 0.02 0.03 0.04
Uni t Axial Deformation }n Fat lure Zone
FIG. A.57 REtATiONSHEP OF LOAD VS. STRAEN IN FA;LURE ZONE FOR SPECIMEN 5332
0.05


194
FIG. A.59 SPECIMENS OF SER!ES 1 AFTER TEST~NG
FIG. A.58 PHOTOGRAPH SHOWING INSTRUMENTATION


195
(2) SerieS 2
(b) Series 3
FIG. A.60 SPECIMENS OF SERIES 2 Af~D 3 AFTER TESTING


196
t' ~. '
(2) Se r i es L:~
;;.:
(b) Series 5
FIG. A.61 SPECIMENS OF SERiES 4 AND 5 AFTER TESTING


-197-
APPENDIX 8
DERIVATIONS
B. 1 Mode 1 s
(a) Tetrahedron
Referring to Fig. 3.1, it can be shown that the angle of inclina
tion of struts AS, AC, and AD with respect to plane BCD is 54.50. The assumed
notation is as fol lows:
Force in struts AS, AC, and AD P c
Force in struts BC. BO, and CD :; PT
Length of struts = L
Area of struts A
Modulus of elasticity of struts E
The direction of P indicated in Fig. 3. i is assumed to be vertical
Because of symlietry, the vertical cQ~ponent
Accordingly,
P c = ~ esc (54. 50
) = O. 408 P
of P must equal P/3 c
(B. 1)
The horizontal cQ~ponent of P is equal to Peas (54.5 0). To
c c
maintain static equi librium,
(B.2a)
Pr = 0.136 P (8 . 2b)
The axial deformation of struts AS, ACt and AD is given by the
equat ion
Pc L PL 6 c = AE :::: 0.408 AE (B. 3)

-lSS-
Since point A must move vertically under the action of force P, the vertical
co:nponent of 6 1 6 , can be expressed as c v
L sin
6 ; 6 csc (54. So} = 0.502 PL v c AE
The vertical distance frexil point A to plane
(5.~L5o) ~ so that the vertical strain, € ..,.J f s L.
E ~ ______ v ______ _
z: == 0.618 :E
The horizontal strafn, € , es x
PT
€ z: - = x AE p
0.136 AE
SCD is equal to
The value of PoissonEs ratio, v~ for the tetrahedron, frun
Eqs. B.5 and B.6, is
€ X
V == - == €
Z
(b) Body-Centered Cubic Model
o. 136 0.618 = 0.22
(8.4)
(B. 5)
(6.6)
(S.7)
The assumed notation for the body-centered cubic model is shown
in Fig. 3.2. The length of the diagonal struts, such as AM, is L4 , and the
cross-sectional area of each strut is A4 . The ~rea of each cube face is
assumed to be unity, and the following equations are derived for the condition
of unconfined compression in the z-direction, produced by the action of a
single force P applied to the exterior of the cube. z

-199-
The length and area relctions for the model may be su~arized as
follows:
Ll = L2 L3
L4 .. F3
L1 (S.8) :: -2
Al :: A2 A3
The forces in struts 1 f 2~ 3, and 4 are assumed to be PI' P2' P3
2nd P4' respectively.
Fro."i1 syrrmetry in the horizontal direction
(S .. 9)
Fro~ equi libriu~ or forces in the horizontal direction,
P, I
2 -13 P 4
(6. 10)
In order to determine the compatibi lity equations for the model, it
is assumed that the axial deformations of struts 1, 2, 3, and 4 are 6\,62,6
3,
and 64 respectively. In addition, it is assumed that strut 4 undergoes a
rotation dcp in a direction parallel to the z-a-xis. A positive value of dcp is
assumed to cause positive values of 6 1 and 62
and a negative value of 6 3
The relationship among 6 1, 64~ and dcp is given by the equation
G 1 1 6 1 ::: 2 - 6 + - dCPJ'
3 4 2:f2 (8. 11)

-200-
and the relationship among 63,6
4_ and dcp may be expressed
(8. 12)
By co:-nb i. n i n9 Eq s. 8. 1 1 and B. 12
(8. 13)
5y means of Eq. 3.6, Eq. 8.13 may be rewritten as follows
(B. \4)
Substituting Eqs. B.8 and B. 10 into Ey . B.14, the fol lowing
equation is obtained,
(S,.15)
The equation for Poisson's ratio, v, is
-p 1
III --
P3 (6. 16)
By substituting Eqs. B.I0 and B.15 into Eq. B.16, v may be
expressed in terms of A3 and A4
2A4 v =------
3 J3A3 + 4A4 (6. I 7)

-201-
For a value of v equal to O. IS r Eq. 8.17 yields the result
(s. 18)
If it is assumed that the spheres shown 1n Fig. 3.2 are of finite
diameter, the ratio l4/Lj is then unknow:l. in deriving an expression for v,
Eqs. 8.9, B.I0 and 8.13 are still valid, but the resulting equation relating
and the equation for.v is
v = -----3Al l4 ----+2
A4 l]
(8. I g)
(8.20)
Substituting the value v = 0.15 into Eq. B.20, the relation among
the lengths and areas of the struts is
1.56 (8.21)
B.2 Unconfined Compression
A description of the method used to compute the load-strain relations
for unconfined compression of the cubic model (Fig. 3.3) is given in Chapter 4.
The corresponding calculations are summarized in Table S. I

-202-
The C21cuic:tions show:. in To.ble S.c i were carried out in the
fa 11 ,~w~ ng order:
1. As.sume a value of € , the transverse strain (Colui'i1r1 i). x
2. Oetermcne the proportforl of effective area, AliA, fro:n
Eq. 3.26 (Column 2).
s. Determine the value of P./AE ccrrespondlng to E by mUltiplying I x
co I t.l':1ns ~ and 2 (Co 1 u:nn 3} Q
strut in the vertical plane (ColuMn 4).
5. Enter Fig. 3.8 with the qucnttty P4/AE expressed as a per-centage
of the maximu:n 10ad for the ci'2gor~ai strut (P4 %:: 84.2 AE x 10-5
)
to obtain €4 (Column 5). For values of € greater than that at x
~
~kdch the targest value of P4/AE is rec:cned,' determine €4 by
dtvidfng colu~n 4 by col~~n 6 (see step 6).
For values of e greater x
than that at which the largest value of P4/AE is reached, A4/A
remains constant.
7. Evaluate € from the compatibi lity condition expressed by Eq. 3.11 z
(Co 1 unm 7).
8. Compute A3/A from Eq. 3.25 (Column 8).
9. Determine the value of P3/AE corresponding to €z by multiplying
columns 7 and 8 (Column 9).
10. Calculate the axial load from the e~uilibrium condition expressed
by Eq.. 3. 5 ( Co 1 umn I 0) ..
11. Express the" values of colurnn to as a percentage of the maxfmum
value of P /AE (Col~~n 11). z

-203-
B.3 Sp,ral ReinforceTlent
The method used to cOO1pute t.he load-strain relations for axial
cQ~pression of the ~odel confined by spiral transverse reinforce~ent is
described in Section 5.3. The calculations are su~arized in Table B.2.
The cc!culations ShOW0 in Table 8.2 ~~re carr~ed out tn the
fo II owi ng order:
I. Assume a value of E , the transverse strain (Colu~n 1). x.
2. Determine the proportion of effective area f Al/A~ fro:n EC;. 3.26
3.
4.
(Column 2).
Determine the value of P}/AE correspono&ng to Ex. by multiplying
columns 1 and 2 (Column 3).
Using Eq. 5.S, and a vaiue -5 of H = 19 AE x to , max
value of H for the assumed value of € (ColUTio 4). x
determine the
5. Using Eq. 5.4, determine the value of P4/AE for the diago~al
strut in the vertical plane (Column 5).
5. Enter Fig. 3.8 with the quantity P4/AE expressed as a percentage
( -5 of the mexim~ load for the diagonal strut P4 = 84.2 AE x 10 )
to obtain €4 (Column 6). for values of € greater than that at x
which the largest value of P4/AE is reached, determine €4 by means
of the equation €4 = P4/ P4 R x t4' where P4$ is the largest value
of P4 D 2nd €4' is the correspo~ding value of €4'
7. Evaluate €z from the compatibi lity condition expressed by
Eq. 3. 1 1 (Co 1 umn 7).
8. Compute A3/A frQ~ Eq. 3.25 (Column 8).

-204--
9. Determine the value of F~/AE corresponding to € by multiplying ~ z
col~ns 7 and 8 (Column 2).
10. Calcuiote the axial load fr~Ti the equi libri~~ c~~dition expressed
by Eq. 3.5 (Column 10).
11. Express the values of column !O 2S a percentage of the maximum
value of P fAE for unconfined clM1pressior.: P == 537 AE x lO-5 z z
( r- 1 • » ... o.umn i I •
tt can be seer. thot the c2icut~tio~s required to determ~ne the
quc:ntitites in columns 4, 5 and 6 are the only ones which differ fro.it the
procedure followed in Table 6.1.
g .4· Rect&r1Qu 1 ar Transvers·e Re i nforcement ...
(2) n :s 2
The procedure whi ch was follo\ocea to determine the load-strain
re12tfons for the 2 by 2 gr~d is described in Section S.4b. This procedure
involved the relation betv.:een P4A and €z for the condition of spiral rein
forcement, with p = 0.2 fl. Accordingly, the calculations of the load-strain c c
relations for this condition are given in Table B.3. The quantities shown in
Table B.3 were derived by the same procedure that was followed to obtain Table
B.2. The only difference bet~een these two tables is that the value of H. sho~~
in col~Tln 4 of Table B.3, was determined by substituting the value H = 38 AE max -5
x 10 into Eq. 5.5. The relation between P4A and €zp obtained' from Table B.3,
is shown in Fig. B.l. The relation between P4S and €z for unconfined co;npression
of the model J obtained from Table B.1, is shown in Fig. B.2. The calculations of
the load-strain relations for the 2 by 2 grid are sUmMarized in Table 8.4. The
calculations shown in Table B~4 were carried out in the following order:
...
..
... ;

-205-
1. Assume a value of E , the longitudinal strain (Column 1). z
2. Determine the proportion of effective area, A~/A, fr~ ~
Eq. 3.25 (Column 2).
3. Determine the value of P3/AE corresponding to E z by multiplying
columns 1 and 2 (Column 3).
4. Enter Fig- B.l with the assumed value of E to obtain the z
quantity P4A/AE (Column 4).
5. Enter Fig. 8.2 with the assu~ed value of E to obtain the z
quantity P4S/AE (Column 5).
6. Compute the axial load fro~ the equi librium condition expressed
by Eq. 5.6 (Column 6).
7. Expre'ss the values of column 6 as a percentage or the ffiaximu~
value of P IAE for unconfined c~pression, P z z
(Column 7).
(b) n = 3
-5 = 537 AE x 10
A diagram of the 3 by 3 grid model is sho"~ in Fig. 5.6. A single
quadrant of the model is shown in Fig. B.3, including the assumed deflected
positions of points A, B, C, and O. The components of deflection, 6 1,62,63 ,
and 6 4 have been indicated in their positive directions.
tn determining the equi librium equations for the model, the portions
of the structure to the left of lines 1-1, 2-2, 3-3, and 4-4 in Fig. B.3 were
considered as free body diagrams, and the equations were determined for
equi librium of forces in the x-direction. The structure was assumed to be

-205-
one cube in height (in the z-direction), so that struts Ie, 10, 4C and 40
ere doubled because of the corresponding members of the adjoining cube.
For equi librium of forces to the left of line 1-1
_1 K+P ,1 p ,1 P =0 .. j 2 I A -;- '/2 4A"t" .J 2 SA
(8.22)
For equi librium of forces to the left of line 2-2,
_1 H PIB i
P4-B +~ i
2 P lD +2 P 0 + +- PS8 +- P5A + c::
.[2 .. f2 ·t2 .JZ .J2 4-D (B.23)
For eq u i 1 i b r 1 urn of forces to the left of 1 i ne 3-3,
_1 H + P , 1 P . 2 P + 2 P + 2 P . 1 P 0 IS T- 4B "t"- 5B Ie -, 4C .-,. 5C z:::
cJ2 "/2..[2 J2~' 2 (B.24)
The equation for equ, librium of forces to the left of line 4-4 was co~bined
with Eq. B.22, ~TIich is equivalent to considering equi librium of joint C in
the }~-d i reet i on
(8.25 )
For equi librium of forces in the z-direction
2.25 P gp +..i. 2 4 8 Z = 3 "2 P 4A + .,F2 P 4B + J 2 P 4C + .J 2 P 40
(B.26a)
(B. 26b)
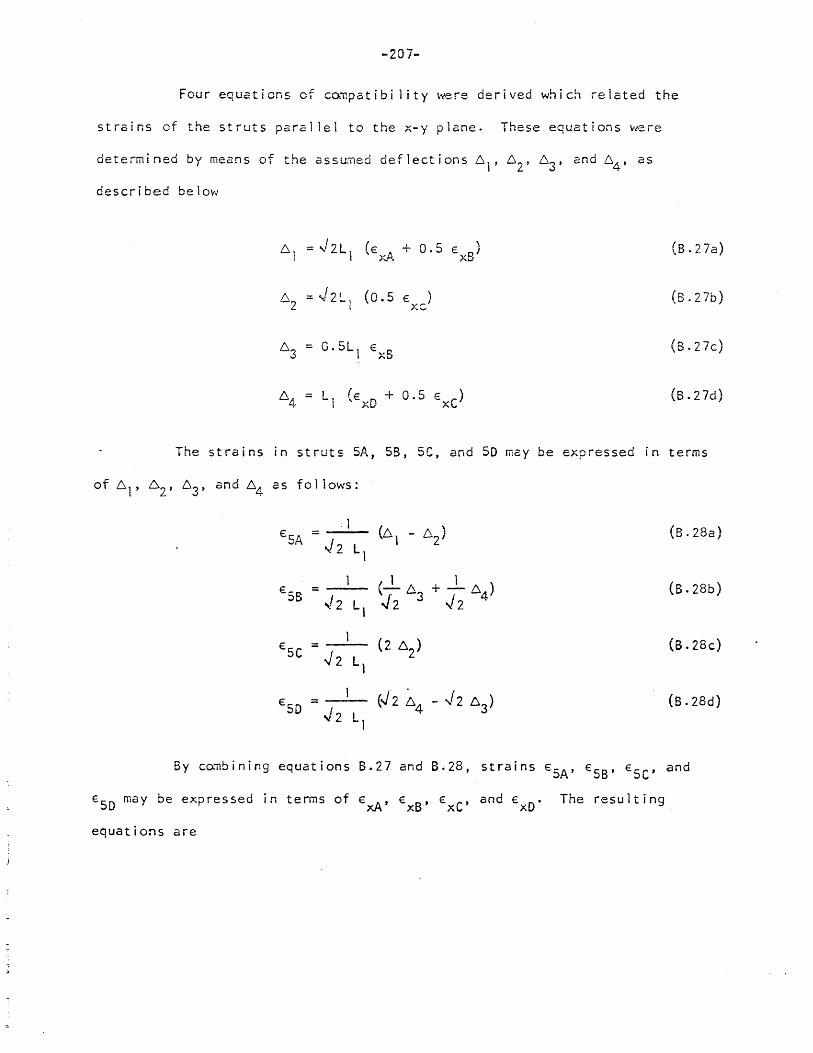
-207-
Four equations of co:npatibi 1 ity \"i€:re derived which related the
strains of the struts paral leI to the x-y plane. These equations were
determined by means of the assumed deflections 6 1,62,63 , and 64 , as
described below
6 1 = .J ZL 1 (E
xA + 0.5 EXS) (B.27a)
6 2 :: ~2l (0.5 E ) (8.27b)
I xc
6 3 O.5L1 ExB (B.27c)
6 4 Ll (E 0 + 0.5 E C) x x (6.27d)
The strains in struts SA, 58, SC, and 50 may be expressed in terms
ESA = (61 - 6 )
-J 2 L 2
1
(8.28a)
1 1 1 ESB = (-6 +-6)
oj 2 Ll "..Iz 3 ../2 4 (S.28b)
1 (2 6
2) ESC =
.j 2 Ll (B.28c)
1 (.JZ ~4 - .J 2 6 3 ) ESD =
oj 2 Ll (B.28d)
By cQ~bining equations B.27 and B.28, strains ESA ' ESB ' ESC' and
ESO may be expressed in terms of ExA , €xB' ExC' and ExO' The resulting
equations are

-208-
€5A = €xA + 0.5 (€xB - €xc) (B.29a)
€5B = 0.25 € + 0.25 €xC + 0.5 € (8.29b) xB xD
€C::'"' = € (S.2Sc) ..,l- xC
€SD = € + 0.5 (€xc - €xB) (B.2gd) xD
Four additional cu~patibi lity equations were determined in a manner
simi tar to the derivation of Eq. 3.11. These equations are as follows:
€4A = 0.5 (E: xA + '€z) (S.30a)
€4B ::: 0.5 (€xB + E ) z
(8.30b)
€4C = 0.5 (€ C + € ) X z
(B.30c)
€4D = 0.5 (€ 0 + E ) X Z
(B.30d)
The force in any strut may be expressed
p. ::: A.E.f I I I
(8.31 )
Using Eq. B.31, together with c~patibi lity Eqs. B.29 and 8.30, the
equi librium equations (B.22, B.Z3, B.24 and 8.25) were expressed in -terms of
ExA , €xs' €xc and ExD as independent unknowns. The resulting equations are

-209-
tI2 AlA + 0.5 A4A + A5A )ExA + (0.5 ASA)E xB - (O.5A 5A )E xC +
+ (0.5 A4A
)Ez
+ H = 0
(ASA)E xA + (J2 AlB + O.S A4B + O.S ASA + 0.5 ASS)ExB +
+ (0.5 ASS-O.5ASA)Exc + (212 A1D + A4D + ASB)€xD +
+ (0.5 A48 + A4D )EZ
+ H 0
(0.25 ASS - 0.5 A50 )ExB + (0.25 ASS + 0.5 ASO)ExC +
+ (Ll2 A1D + A4D + 0.5 ASS + ASD)E xD + (A4-D)E z = 0
The value of H, determined from Eq. 5.5, is
H = 22.6 €xA + 11.3 €xB
H max -5 :::; 57 AE x 10
(B.32a)
(B.32b)
(8.32c)
(B.32d)
(8.33 )
Equations 8.32 were then solved by the procedure described in
Section 5.4c. The resulting strains are given in Table B.5, and the corre
sponding strut areas, determined from Eqs. 3.25 and 3.26, are given in
Table B.6.

-210-
The value of P for each incremental vertical strain, € , was z z
co~puted by means of Eq. 6.26. The results of these calculations are
summarized in Table 6.7. The quantities given in Table 8.7 were derived
by the fol lowing procedure.
1 • Assume a value of axial strain, € , of the same magnitude z
2S that used in solving Eqs. 8.32, and indicated 1n Tables
S.5 and S.6 (Co 1 U:Tiil i).
2. Fro~ column 3 of Table B.4, obtain the value of ?3/AE
corresponding to Ez
. Multiply the value of P3/AE by 4
(Column 2).
3. Determine the quantity P4A/AE by multiplying the appropriate
values of E4A and A4A/A given in Tables 6.5 and B.6 respectively.
Kultiply this value of P4A/AE by 1.257 (Column 3).
4. Repeat the procedure fo} lowed in step 3 to determine the
appropriate multiples of P4B' P4C' and P4D shown in Table B.7
(Columns 4, 5, and 6, respectively).
5. Determine the value of P corresponding to the assumed value of z
E from the equi librium relation expressed by Eq. B.26 (Column 7) z
6. Express the values of column 7 as a percentage of the maximum
value of P IAE for unconfined compression, P z z
(Column 8).
(c) n ::: 4
-5 = 537 AE x 10
Figure 8.4 is a diagram of one quadrant of the 4 by 4 grid model.
The assumed deflection cQ~ponents of the horizontal deformations are 6 1,62,

-211-
6 3 , 6 4 , 6 5 , and 6 6 , The method of solution was simi lar to that described
in Section S.4b.
The relations among the forces in the struts were expressed by
means of six equi 11brium equations. These equations were derived by con-
sidering equi librium of joints L, M, N, P, and Q in the x and y directions.
For ZF ; 0 at joint L x
For Zf' x
For ZF y =
.[2 P + p + P + H xA 4A 5A
o at joint M
0 at joint M
o
2 ~2 P C + 2 P4C + PS8 + PSC ~~
For ZF = 0 at j oi nt N y
.[2 PxD +
For LF 0 at joint P x
For ZF ~ 0 at joint Q y
P4D + PSD
For equi librium in the z-direction
; 0
(B.34)
(B.3S)
; 0 (B.36)
(6.38 )
{B039}
(s .40)

-212-
The co;n pat i b i 1 i t y eq u at ion s reI a tin 9 the s t r a ins ins t rut 5 pa r all e 1
to the x-y p1ane were derived in a manner simi lar to that described in
Section 6.4b. The resulting equations are 2S fo 11 ows:
ESA :::::: E + E - E xE (6.412)
x.A. xB
ESB = E + E E .... (B.4ib) xC xE Xb
ESC 0.5 (ExB
+ ExC + E xE - ExF ) (B.41c)
ESD = 0.5 (ExD
+ ExF ) (B.4id)
ESE = E (B.41e) xE
€SF = E (B.41f) xF
In addition, six compatibi lity equations ~~re derived by means of
Eq. 3.11
E4A 0.5 (ExA
+ Ez
) (B.42a)
E4B :I: 0.5 (exB
+ E ) (B.42b) z
€4C = 0.5 (e C + € ) (6.42c) x z
€4D = 0.5 (€ 0 + e ) (B.42d) x z
ESE ::: 0.5 (E E + e ) (6.42e) x z
€xF = 0.5 (e F + € ) (8.42f) x z

-213-
The final equilibrium equations, expressed in terms of strut areas
and strain, are,
(6.43a)
( r:2f1 ..J...05A \ " h 1 A I • 4A j E xA
(B.43b)
(B.43e)
(B.43f)

-2i4-
The value of H is
H 22.6 E.II + 22.5 E B .>~ x
(B.44)
H = 76 AE x 10- 5 max
Equations 8.43 were solved by the trial and error procedure described
in Sectio:l S.Li·c. The resulting strai~s are surrrnarized in Table B.8, and the
corresponding areas are given in Table B.9. For the sake of simplicity, only
the results for struts I and 4 are given in Tables B.8 and 8.9. The strains
in struts 5 may be determined by Eqs. B.41, and the corresponding areas may be
obtained fr~~ Eq. 3.26.
The load-strain relations, calculated fr~~ Eq. B.40, and using a
procedure similar to that fol1o-wed in deriving the quantities in Table B.7,
are sum~arized in Table B. 10.

t:;.:
TABLE B.l
CALCULAT ION OF THEORET I CAL LOAD -STRA I N RELAT IONS FOR UNCONF I NED Cot1PRESS ION
(1 ) (2 ) (3 ) (4 ) (5) (6) (7) (8) (9) (10) (11 )
PI. 5 P4. 5 3 3 P3 5 P 3
AlIA A4/A A3 /A 7.. 5 Percent € xl0 AE:-x 10 A[xlO e: 4x l0 € xl0 -- x 10 AE x 10 x z AE '·1ax i mum
(%) sr:(l)x(2} t::-2. 18 (3) (%) =2(5)-(1) (%) r-(7»)«n) ~4(9)+5.66(4) Load
0.001 100 0.10 - 0.22 -0.003 76.9 -0.007 100 - 0.7 - 4 0.7 0.04 e6.4 3.46 - 7.54 -0.097 76.9 -0.234 98.0 - 23.1 ~135 25.2 0.08 67.0 5.36 ~ 11 • 7 -0. 152 76.9 -0.384 97.8 ~ 37.6 ~216 40.2 0.12 56. 1 6.73 ... 14.7 -0. 191 76.9 -0.502 94 ~ 47.2 -272 50.7 0.17 50.7 8.61 -18.75 -0.245 76.5 -0.660 86.5 - 57.1 -334 62.2 I
N
0.23 49.5 11 .4 -24.9 .,.0.328 75.9 ~O.886 74 .. 65.5 .. 403 75.1 (J1
0.30 46.0 13.8 -30.1 -0.402 74.8 -1.104 63.4 - 70.0 -450 83. D ,
0.40 39.4 15.75 ""34.4 -0.470 73.2 -1 .34 55.4 ~ 74.2 -491 91.5 0.57 28.9 16.5 -36.0 -0.499 72.2 ~1.568 51 .2 ~ eO.3 -525 97.8 0.90 16.2 14.6 -31 .8 -0.441 72.2 -1 . 782 50 ... 09.1 ~537 100 1.50 6.5 9.75 -21 .2 -0.294 72.2 -2.008 48.6 -103 -532 99. , 2.25 2.7 S.08 -13.2 -0. 183 72.2 -2.62 41.6 ~109 -511 95.2 3.0 1 .2 3.6 eo 7.85 -0.109 72.2 -3.22 32.2 ~ 103.8 -459 85.5 4.5 0.4 1 .8 - 3.93 -0.055 72.2 ~4.61 15.8 - 72.8 -313 58.3 6.0 O. 15 0.9 - 1.96 -0.027 72.2 -6.05 7.5 .. 15.4 -193 36.0 8.0 0.06 0.48 - 1.05 -0.015 72.7.. ~8.03 2.8 - 22.5 ~ 96 17.9

TABLE 13.2
CALCULATION OF THEORETICAL LOAD-STRAIN RELATIONS FOR MODEL CONFINED BY SPIRAL REINFORCEMENT (p c
O. 1 f') c
.~ .,"~~-~.
(t ) (2) (3 ) (4 ) (5) (6) (7) (0) (9) (10) (11 ) r.'~.~~""~"~~. ~._
3 P1 5 H 5 P4 5 3 3 P 3 5 P z 5 Pc rcen t € x)O AlIA AE xl 0 AE xl 0 AE x 10 £4x1O t xl0 A3 /A --><10 -~ )( 10 Unconfined x 7. AE f\E Compression
(%) rx:(I)x(2) ~11.4(1) 1':-[ (4)+2.18(3)] r-2(6)-(1) (%) n (7)x (8) r,,4(9)+S.66(5) ~1ax i mum Load --~-~
0.001 100 o. 10 0.01 - 0.23 -0.003 -0.007 100 - 0~7 - 4 0.75 O~04 86.4 3.46 0.45 8.0 -0.104 -0.24 99.8 .,. 24 ··141 26.3 0.08 67.0 5.36 0.9 12.6 -0.166 -0.41 97. 1 - 39.8 --230 42.8 O. 12 56. J 6.73 1.4 16. 1 ... 0.212 -0.54 92.4 - 50 -291 54.2 O. 17 50.7 8.61 1 .9 20.7 -0.27 ~0.71 83.8 ... 59.5 -355 66. 1
, N
0.30 46.0 13.8 3.4 33.4 -0.46 -1 .22 59.0, .,. 72 -477 88.8 (J)
0.40 39.4 15.75 4.6 38.9 -0.56 -1.52 51 .8 - 78.8 -535 99.6 I
0.57 28.9 16.45 6.5 42.3 -0.62 ~ 1 .81 50 .,. 90.5 ~601 112 0.90 16.2 14.6 10.2 42.0 -0.62 .,,2. 14 48. I .,.103 -650 121 1 .50 6.5 9.75 1 7 • 1 38.2 -0.56 -2.62 41 .6 ~109 .. 652 121.4 2.25 2.7 6.07 19.0 32.2 -0.47 -3.19 32.7 ~104"2 -599 111 .5 3.0 1 .2 3.6 19.0 26.8 -0.39 -3.78 24. 1 .,. 91 -516 96 4.5 0.4 1.8 19.0 22.9 -0.34 -5.18 11 * 6 .... 60 -370 69 6.0 ' O. 15 0.9 19~O 21.0 -0.31 -6.62 5.5 - 36.4 ~264 49 8.0 0.06 0.48 19.0 20.0 -0.29 -8.58 2. 1 ... 18.0 ~185 34.5
·'.t .;/',";:

TAOLE 0.3
CALCULATION OF THEORETICAL LOAD-STRAIN RELATIONS FOR t10DEL CONFINED BY SPIRAL REINFORCEMENT (p ~ 0.2 f') c c
( 1 ) (2) (3 ) (4 ) (5) (6) (7) (8) (9) (10) (11 ) .-~~.~
3 PI 5 !L 105 P4 5 3 3 r Pz 5 Percent
AlIA A3 /A 3 5 UnconfIned E xl0 AE x 10 AE x AE x 10 t4/10 E xlO ~. )( 10 . -x 10 x z AE AE Compression
(%) n(1)x(2) R022.S(1) =1[(4}+2.18(3}] r-:2(6}~(1} (%) ~(7)x(8) ::=4(9)+5.66(5) Naximum Load
0.001 100 0.10 0.02 - 0.24 0.003 0.007 100 0.7 4 0.7 0.04 86.4 3.46 0.91 8.46 o. 11 0.26 99.6 25.9 152 28.3 0.08 67.0 5.36 1 .8 13 .. 5 0.18 0.44 96.2 42.3 245 45.7 o. 12 56. 1 6.73 2.7 17.4 0.23 0.58 90.6 52.5 30n 57.4 0.17 50.7 8.61 3.9 22.7 0.30 0.77 80.5 62.0 377 70.2
, N
0.30 46.0 13.8 6.8 36.8 0.51 1.32 55.9 73.8 503 93.7 ...... 0.40 39.4 15.75 9.1 43.5 0.65 1. 70 50.2 85.3 587 109.3 I
0.57 28.9 16.45 13.0 48.9 0.82 2.21 47.3 104.8 694 129 0.90 16.2 14.6 20.5 52.3 0.97 2.84 38.3 109 732 136 1. 50 6.5 9.75 34.2 55.4 1. 20 3.90 23.1 90 673 125 2.25 2.7 6.07 38 51.2 1. 11 4.47 17.0 76 593 110 3.0 1 .2 3.6 38 45.9 1.00 5.00 12.9 64.5 518 96.5 4.5 0.4 1 .8 38 41.9 0.91 6.32 6.3 39.8 396 73.8 6.0 O. 15 0.9 38 39.9 0.87 7.74- 3.3 25.6 330 61.5 8.0 0.06 0.48 38 39.0 0.85 9.70 1.3 12.6 271 50.5

(i)
E xlO 3
z
-O.S -I .0 -I. 5 -200 -2.5 -300 -3" 5 -4.0 -5.0 -600 -B.O
-218-
TABLE 8.4
CALCULATION OF THEORETICAL LOAD-STRAIN RELATIONS FOR MODEL CONFINED BY RECTANGULAR TRANSVERSE REINFORCEMENT,
2 BY 2 GRID
(2) (3 ) (4 ) (5) (6)
A3 P3 5 P P Pz 5 (%) 4A 105 48 105
AE xl 0 AE x 10 A AE x AE x
=(1)x(2) =4 (3)+2.83 [(4)+ (5) j
94.1 - 47.0 -15.6 -15.3 -275 68.2 - 68.2 -28.8 -28.2 -434 52. 1 - 78. I -40.6 -35.5 -528 49.3 - 98.6 -47.3 -23.5 -594 43.4 -108.5 -51.0 -14.5 -619 35.5 -106.8 -53.3 - 9.3 -603 28,2 - 98.7 -55.0 - 6.2 -568 21.7 - 86.8 -55.2 - 5.0 -517 12.9 - 64.5 -45.9 - 3.4 -398 7.7 - 46.2 -42.7 - 2.0 -312 2.8 - 22.4 -39.5 - 1.2 -205
(7)
Percent Unconfined
Comp res s i 0:1
Maximum Load
51.3 80.8 98.5
110.5 1 t 5.0 i i 2 .. 3 105.8 96r3 74.2 5B.2 38.2

TABLE 0.5
STRAIN RELATIONS FOR MODEL CONFINED BY RECTANGULAR REINFORCEMENT 3 BY 3 GRID
-~~-~~~-~-
(1) (2 ) (3 ) (4 ) (5) (6) (7) (8) (9) (10) (1 1 ) (12) (13 ) (14 )
€ H 5 ExA E:4A E5A t xo E48 f: 50 E'xC E4C E 5C E:xD E:4D t: 50 z AE x 10 xl0
3 xl0
3 xl03 xl03 )( 103 xl03 xl03 xl0
3 xl03 xl03 xl03 xl0
3 xl0
3
-0.5 3.25 O~094 -0.203 0.087 0.100 ..,0.200 o. 11 3 0.114 -0. 193 O. 114 0.119 -0.191 0.126 -1 .0 7.28 0.212 -0.394 0.196 0.220 -0.340 0.251 0.253 -0.373 0.253 0.266 -0.367 0.282 -1.5 11.04 0.320 -0.590 0.256 0.338 -0.581 0 .. 452 0.465 <nO.518 0.465 0.502 -0.499 O. 592 ~ -2.0 17.53 0.579 -0.711 o. 139 0.393 -0.804 1.092 1.272 -0.364 1.272 1.353 -0.324 1 .798 LO
-2.5 25.03 0.914 -0.793 0.076 0.387 -1.057 1.664 2.062 ~O.219 2.062 2.105 -0.197 2.943 I
. -3.0 31 .24 1 • 132 -0.934 0.031 0.501 -1.249 2.170 2.702 -0.149 2.702 2.740 -0.130 3.841

TABLE B.8
STRAIN RELATIONS FOR MODEL CONFINED BY RECTANGULAR REINFORCEMENT 4 BY 4 GRID
:orr_~~~~~ ..... """.~ .......... ~ ........... ~ .... ..-, ................ ~r
(I ) (2) (3 ) (4 ) (5 ) (6) (7) (8) (9) (10) (11 ) (12) (13 ) (14 ) ,T~.~. ~_~~ ___ ~ ___
€ H 5 ~xA €4A ~xB 1:4B E;xC e4C t:xD ~4D (!xE E4E ~ }(F t4F z AEx 10
xl03 xl03 xl ~3 xl03 xlO3 x103 xl03 xl03 3 3 xl03 xl03 )(10 xlO
-1 .0 9.36 0 • .200 .... 0.400 0.214 -0.393 0~264 ... 0.368 0.264 -0.368 0.240 ~o. 3 76 0.258 -0.371 -1 .5 t 4. 13 0.315 -0.593 0.310 -0.595 0 .. 517 -0.491 0.504 -0.498 0.447 ~0.526 0.485 -0.508 -2.0 23.55 0.666 -0.667 0.376 -0.812 1 .345 ~O.328 1.335 -0.333 1 • J 01 ... 0.450 1.438 ~o. 281 -2.5 35.93 1 .245 -0.627 0.345 -1.077 2.063 -0.219 2. 115 -0.192 1.744 '''0.378 2.313 .... 0.094
I N N N ·1
TABLE 0.9
AREA RELATIONS FOR MODEL CONFINED BY RECTANGULAR REINFORCEMENT 4 BY 4 GRID
-~. -~. ~~-~-~~
(1 ) (2) (3 ) (4) (5) (6) (7 ) (8) (9) (10) (11 ) (12 ) (13 ) =~. --~.,">=.~. ~.~. --_ .....
€ z AIA/A A4A/A AlBIA A4B/A AIC/A A4C /A AlOiA A4,/A Al E/A A4E/A AlF/A A4F/A
xl03 (%) (%) rio) (%) (%) (%) (%) (%) (%) (%) (%) (%)
-1.0 50.0 74.9 49.8 74.8 48.0 75.4 48.0 75.4 48~7 75.3 48.2 75.4 -1 .5 45.0 69.2 45.5 69. 1 31.9 72~6 32.5 72.4 36.2 71.5 33~8 72.1 -2.0 24.0 66.3 41.0 60.0 8.15 72.6 8.25 72.4 11.4 71.5 7. 13 72.1 -2.5 9.5 67.9 41.0 49.7 3.25 72.6 3.10 72.4 4.72 71 .5 2.45 72. 1
'"). i

C; - -. - ,,-~.,
(1 )
€ z
x 103
-0.5 -1.0 -1 .5 -2.0 -2.5 -3.0
TAOlE B.7
LOAD-STRAIN RELATIONS FOR MODEL CONFINED BY RECTANGULAR REINFORCEMENT 3 BY 3 GRID
(2 ) (3 ) (4 ) (5) (6) (7)
4P3 5 P 1.257 x 0.628 x 1.257 x 2.514 x 7- 5
"AEx 10 AE x 10
P P4B 5 P 4C 5 P 4Q. x 105 ~(2)+(3)+(4) 4A 105 AE x AE xl 0 AE x JO AE + (5)+ (6)
-188 ... 19.6 - 9.7 -18.6 ~23 0 1 -259 -272.4 -37.2 -16.0 ... 35.3 ... 69.6 ... 431 -312.8 -51.4 -25.4 ... 46.9 -91.0 -528 -394.4 -57.6 -30.5 -32. 9 -59.0 ... 574 -434 -60.7 -33.5 ft·19.9 ~36. 0 ~584
-427.2 -64.6 -35.0 -13.4 "'23.6 .,,563
(8)
Percent Unconfined
Compress ion Maximum Load
, 48.3 . N
N 80.3 --I 98.5
107.0 100.8 105.0

( 1 ) (2 )
~ A1A/A z
xl03 (%)
-0.5 62.0 -1 .0 49.8 -1 .5 45.0 -2.0 28.2 -2.5 15.6 -3.0 11.0
TADLE 0.6
AREA RELATIONS FOR MODEL CONFINED BY RECTANGULAR REINFORCEMENT 3 BY 3 GRID
(3 ) (4 ) (5) (6) (7) (8) (9) (10) (1 1 )
A4A/A ASA/A AlBIA A48 /A AS8 /A A1C /A A4C /A A5C /A AID/A
(%) (%) (%) rio) (%) (%) (%) (%) (%)
76.9 49.6 60.5 76.9 44.2 57.2 76.9 44.0 56.5 75.0 38.S 49~7 75.0 37.3 48.5 75.4 37.1 47.9 69.4 37.0 43.5 69.7 27.5 35.0 72.0 27.0 33.0 64.4 37.0 39.8 60.4 8. 15 9. 1 72.0 7.0 8.05 60.9 37.0 39 0 8 50.4 3.73 3.6 72.0 2.53 3.13 55.0 37.0 32.5 44.6 2.23 1.68 72.0 1 .29 1.60
(12 ) (13 )
A4D/A ASO/A
(%) (%)
76.9 42.3 7S.5 36.2 , 72.5 23.1 N
N 72.5 3.42 0 , 72.5 1. 03 72.5 0.46

q t; i· ,', ·',1 t;',.
(1 ) (2)
4Pz 5 Ez
xl03 AE x 10
-1 .0 -272.4 -1 .5 -312.8 -2.0 -394.4 -2.5 -434.0
TAULE 0.10
LOAD-STRAIN RELATIONS FOR MODEL CONFINED BY RECTANGULAR REINFORCEMENT 4 OY 4 GRID
~-.-~ .. ~~-~.~---~--~"---, --~---,~~---~--~-(3 ) (4 ) (5) (6) (7) (8) (9) (10)
-~--,----_. P
0.707 x 0.707 x 1.414 x 0.707 x 1.414 x 0.707 x z 105 -"- )( AE
Percent Unconfined
P P P P Compression P4D 5 P 4F ' 5 ~ (2)+(3)+(4)+(5) 4A 105 4B 105 ~ 105 4£ 5 AE x AE x AE x i\Ex 10 AE x 10 ~~x 10 + (6)+ (7)+ (8) AE Max I mum L ODd ~)
-21 .2 -20.8 -39.3 -19.7 -29.0 -29. 1 -50.5 -25.5 -31.2 -34.4 -33.7 -17.0 -30. 1 -37.8 -22.5 -19.8
-40.0 -19.8 -53.2 -25.9 -45.5 --14.4 -38.2 - 4.8
__ ~,~~_'~ft~_ ~~~ __ _
-433.2 -526.0 -570.6 -577.2
80.6 97.8
106.1 107.5
,~~ ___ ~~~~~~~""""'~·~~~x~,~=.,,~~_ .. _~~~~_~.~ ___ .~~~~~~_~~~_..,.,.
N W t

-._~ZC-":l!"..Y!!'~_r~~~5 ..... ?.,:J.ij~-t\g!iIA_r&#· ..... t"~ .I,-.~ . .,.i. ,~·.·,~ __ R,ffil!titi""_-"Y~.;._?, WtQ: ;}(ii .}''.1
LO o
X
IJJ <t: '" o..-:J
75
60
45
30
15
o
:-<~~..----.-M~~.~~~~=,~. ~~=_ ~~
v--i"=====4-==---r-1 ----I
r .~..-'",-;-:~.~~~~'~~-:--T~;I:.:~r-=.-=-r""''IT"tr=-n'.r-r.''''-~''''-'_'_'''"",-,:";J~-:O-~=. ~=. ~~...".,-:-~~=-<~~,~,~~~._
o 2 3 4 5 6 7 8 .. 3
Longitudinal Strain, €z x 10
FIG. f). 1
I t-.) N ~ I
~ THEORETICAL RELATION (:lETHE~N P4A AND €z FOHAXIAl COMPRESSION WITH CONFINEMENT PROVIDED OY SPIRAL REINFORCEMENT (p ~ 0.2 fl)
~lSiUM?"'''..t;3!£P.',,,,.,iJlM!iO_J!ilI2clifJ!lNEj;'\t€W''iim·,,u,,,, . .,,,,.....(,ttlfhl,,\'ii'''.<,ffi.,, ,t.'! .... :!!I~t!, .. <'P.!iGW9'f(Mi!Hi,hL.M"":Y::Mtl!·h\'"!Jl"~'''''' (tl .. ,L~1.'l',. _, .. ",' '" p', r, '","'"'''' " ,.,. '. ,t, ,! C'. . C ",,' "",:'!.-.-,S"qn ,,"'n, ,J : •• ",' t .... C, C, '. ' .t., .• ;it" .:1
-..~
i'!i:';" ,

50
40
IJ') 30 0
>< w <l ........
0Cl "-t
0... 20
10
0 0 2 3 4 5 6
E x 103
z
FIG. 0.2 THEORETICAL RELATION BETWEEN P4B AND E z FOR UNCONFINED COHPRESSION
7 8
I N N Ul I

-226-
r ;CD T jiJ
I I / 1/ I /
/lA 1B ---A
/ ci lA
C· o 1D lC
C tl?-------~-;·~-------
13
/ I
0 I
/ It /
/ "- /" //1 "- 1/ "'-, " I I
~ cb A, B, C, D Original Positions
AJ ,B a ,C l ,D 3 : Ass~med Dsflected Positions
F2G. B.3 QUADRANT OF 3 BY 3 GRJD MODEL SHO~]NG ASSUMED DEfLECTiONS
jX y
\: .

)
-227-
N' c--y-
~ ________ l_A __________ ~~~ ______ ~~ ______ ~~ 6 5
1 C iE K ~".--------------------~~------------------~
1D
L, M, N, P, Q,
La ,~II ,NI.P' ,Q'
IF
Q
Original Positions
Assu~ed Deflected Positions
FIG. B.4 QUADRANT OF 4 BY 4 GRID MODEL SHOWiNG ASSUMED DEFLECTIONS
N
IF
R