Embed Size (px)
Citation preview

RESEARCH ARTICLE Open Access
A model for predicting utilization ofmHealth interventions in low-resourcesettings: case of maternal and newborncare in KenyaStephen Mburu* and Robert Oboko
Abstract
Background: In low-resource settings, there are numerous socioeconomic challenges such as poverty, inadequatefacilities, shortage of skilled health workers, illiteracy and cultural barriers that contribute to high maternal and newborndeaths. To address these challenges, there are several mHealth projects particularly in Sub-Sahara Africa seeking toexploit opportunities provided by over 90% rate of mobile penetration. However, most of these interventions havefailed to justify their value proposition to inspire utilization in low-resource settings.
Methods: This study proposes a theoretical model named Technology, Individual, Process-Fit (TIPFit) suitablefor user-centred evaluation of intervention designs to predict utilization of mHealth products in low-resourcesettings. To investigate the predictive power of TIPFit model, we operationalized its latent constructs intovariables used to predict utilization of an mHealth prototype called mamacare. The study employed single-group repeated measures quasi-experiment in which a random sample of 79 antenatal and postnatal patientswere recruited from a rural hospital. During the study conducted between May and October 2014, the treatment involvedsending and receiving SMS alerts on vital signs, appointments, safe delivery, danger signs, nutrition, preventive care andadherence to medication.
Results: Measurements taken during the study were cleaned and coded for analysis using statistical models like PartialLeast Squares (PLS), Repeated Measures Analysis of Variance (RM-ANOVA), and Bonferroni tests. After analyzing 73 pretestresponses, the model predicted 80.2% fit, and 63.9% likelihood of utilization. However, results obtained from initial post-test taken after three months demonstrated 69.1% fit, and utilization of 50.5%. The variation between prediction and theactual outcome necessitated improvement of mamacare based on feedback obtained from users. Three months later, weconducted the second post-test that recorded further drop in fit from 69.1 to 60.3% but utilization marginally improvedfrom 50.5 to 53.7%.
Conclusions: Despite variations between the pretest and post-test outcomes, the study demonstrates thatpredictive approach to user-centred design offers greater flexibility in aligning design attributes of an mHealthintervention to fulfill user needs and expectations. These findings provide a unique contribution for decisionmakers because it is possible to prioritize investments among competing digital health projects.
Keywords: Behaviour science, Design science, Fit, mHealth, Predictive modeling, Self-efficacy, Short messageservice (SMS), Structural equation modeling, Utilization
* Correspondence: [email protected] of Computing and Informatics, University of Nairobi, P.O. Box30197-00100, Nairobi, Kenya
© The Author(s). 2018 Open Access This article is distributed under the terms of the Creative Commons Attribution 4.0International License (http://creativecommons.org/licenses/by/4.0/), which permits unrestricted use, distribution, andreproduction in any medium, provided you give appropriate credit to the original author(s) and the source, provide a link tothe Creative Commons license, and indicate if changes were made. The Creative Commons Public Domain Dedication waiver(http://creativecommons.org/publicdomain/zero/1.0/) applies to the data made available in this article, unless otherwise stated.
Mburu and Oboko BMC Medical Informatics and Decision Making (2018) 18:67 https://doi.org/10.1186/s12911-018-0649-z

BackgroundTo exploit opportunities provided by mobile penetrationin developing countries, there is proliferation of technol-ogy innovations aimed at improving healthcare servicedelivery [1–4]. This is the motivation behind numerousmobile health (mHealth) interventions aimed at over-coming challenges like poor infrastructure, staff short-ages, and limited budgets that characterize low-resourcesettings [5–7]. Despite these initiatives, a global observa-tory survey conducted by World Health Organization(WHO) and International Telecommunication Union(ITU) revealed that majority of mHealth systems areweak platforms that have failed to transit to actual prac-tice [8]. Prior studies have also attributed failure ofmHealth interventions to misalignment to realistic needsand expectations of the target users [9–11]. Since mostmHealth initiatives in Sub-Sahara Africa are donor-fundedprojects, we argue that low utilization of most of theseinterventions may be due to poor understanding of users,tasks and technology context during design. Several casestudies have revealed that design of some of mHealthsystems is based on “perceived problems”, then “pushed”for adoption and use by consumers who were leastinvolved in designing the intervention [8, 12].To scale up utilization of mHealth innovations, there
is need for user-centred evaluation of design specifica-tions to predict usage behaviour after workplace imple-mentation. Some of the reviewed studies on technologyadoption have demonstrated how to predict utilizationbased on theoretical knowledge of causal connections[13–15]. For example, Davis and Venkatesh [14] used
Technology Acceptance Model (TAM) to predict accept-ance and use of a new system based on perceived useful-ness. The same approach was used by Bhattacherjee andPremkumar [15] to provide empirical evidence on pre-dictive approach to user acceptance testing. This studytherefore builds on similar approaches to predicting ac-ceptance and use of mHealth interventions inlow-resource settings. Due to gaps identified in thereviewed models and theories [16–22], we derived astructural model for predicting utilization of mHealthinterventions. The model called TIPFit comprises of pre-dictor variables X1 to X9 shown in Fig. 1; hypothesizedto influence fit and utilization of an mHealth interven-tion. TIPFit is an acronym derived from individual,process, technology, and fit constructs. Similar to stud-ies by Strong et al. [21] and Davis and Konsynski [22],fit is configured as a surrogate measure of user accept-ance to determine temporal changes toward usage ofmHealth artifacts. Justification and detailed reasoningregarding inclusion of each construct as a predictor vari-able is provided in the methods section.To validate the model, we conducted within-subjects
repeated measures quasi-experiment. The validationprocess was done in a practical scenario to investigatehow well user’s perceptions predicted utilization ofmamacare prototype. Mamacare is an integratedmobile and web-based application optimized to run onlow-cost smartphones because most health facilities inlow-resource settings have limited access to computers,power and broadband internet. Furthermore, WHO[10] recommends use of mobile phones to facilitate
Fig. 1 TIPFit model consisting of predictor variables (X1-X9) hypothesized to influence fit. Consequently, fit determines utilization of mHealth interventionsas depicted by P10
Mburu and Oboko BMC Medical Informatics and Decision Making (2018) 18:67 Page 2 of 16

timely delivery and access to healthcare services. Thereis no doubt that acceptance and use of mHealth inno-vations has the potential to achieve Sustainable Devel-opment Goals (SDGs) aimed at reversing maternal andnewborn deaths by 2030 [23].
MethodsTo build a strong case for the predictive methodemployed in this study, we first justify inclusion ofeleven TIPFit variables classified into five constructs:individual, process, technology, fit and utilization ofmHealth [14, 15, 23, 24].
Attitude (X1)Prior studies in behaviour science have shown that atti-tude influences one’s judgment on certain behaviour,subject or action [25–27]. Therefore, inclusion of atti-tude as a predictor variable was informed by ourpre-study experience, and empirical findings from stud-ies that are based on Theory of Planned Behaviour(TPB) [16, 26, 27]. In TIPFit model, attitude is crucial inmeasuring patients’ and caregivers’ perception beforeand after exposure to an intervention. We hypothesizedthat attitude changes over time as benefits of an inter-vention becomes more realistic due to continued use.
Self-efficacy (X2)Self-efficacy as a predictor variable was derived fromTechnology Acceptance Model (TAM) and ComputerSelf-Efficacy (CSE) [17, 20]. The variable is intended tomeasure one’s ability to use technology to access health-care services and information. In particular, we usedthis predictor to measure one’s ability to use mobilephones to access maternal care services and informa-tion in rural areas.
Sensory requirements (X3)Sensory requirements as a predictor variable was derivedfrom Process Virtualization Theory and Impact of IT(PVT-IT) [18, 22]. Overby and Konsynski [22, 28] dem-onstrated that sensory requirements of touch, smell,sight and taste makes it difficult to virtualize some phys-ical processes. Moreover, Overby [18] argues that if aprocess requires sensory experience of smell, taste ortouch, it would be more difficult to replicate thesesenses in a virtual (electronic) environment. Forexample, during routine maternal care visits, cliniciansuse medical devices to physically take clinical tests suchas temperature, blood pressure, blood sugar, and haemo-globin. Although some of these vital signs may be takenremotely using wireless sensors, it may be difficult orcostly to deploy such technologies in low-resourcesettings. This is why sensory requirements variable iscrucial in predicting the degree to which mobile phones
and point-of-care devices can be used to fulfil sensoryrequirements in maternal and newborn care.
Relationship (X4)Relationship as a predictor variable was derived fromPVT-IT [18, 22] to investigate the degree of interactionbetween caregivers and patients in remote areas. Weobserve that in clinical processes, relationship is import-ant because it builds mutual trust between patients andcaregivers.During physical encounter, verbal and non-verbal
communications convey vital information resulting tomutual trust and better inter-personal relationships [28].Although multimedia technology may be used to simu-late such interaction, limitations of cost and infrastruc-ture in low-resource settings make multimedia-basedinterventions unsustainable.
Identification and privacy (X5)Identification refers to proof of one’s identity while priv-acy refers to confidentiality of health information. Thisvariable derived from PVT-IT [18, 22] was largelyinformed by our pre-study experience during focusgroup discussions. We noted that prove of identity inclinical processes like diagnosis is essential if patientsand caregivers are to share sensitive information. For ex-ample, a HIV-positive patient may be reluctant toreceive reminders on adherence to antiretroviral (ARV)regimen through mobile phones. On the other hand, cli-nicians may be reluctant to perform diagnosis and pre-scription electronically to avoid compromising patient’sprivacy [1, 29].
Synchronism (X6)Synchronism as a predictor variable was derived fromPVT-IT to measure degree to which time-critical pro-cesses are completed with minimal delay [18, 22, 28]. Inmedical practice, synchronism is crucial in emergencycases like preeclampsia that require urgent clinical atten-tion. Our pre-study experience revealed that delays indetecting complications related to pregnancy and post-partum are some of the major causes of deaths in devel-oping countries [4, 5, 13]. Therefore, synchronizationwas included as a predictor variable to measure degreeto which use of mobile phones and point-of-care devicesreduce delays in executing clinical tasks.
Representation (X7)This variable was derived from PVT-IT [18, 22] andTask Technology-Fit (TTF) [19, 21, 22] to investigatecapabilities of technology to simulate or present infor-mation relevant to clinical processes [18, 22]. Forexample in telemedicine, mobile phones may be inte-grated with wireless sensors and multimedia tools to
Mburu and Oboko BMC Medical Informatics and Decision Making (2018) 18:67 Page 3 of 16
provide remote consultation between patients and doc-tors. However, due to poor connectivity, it becomes diffi-cult to provide such services in low-resource settings[28]. In this study, we used representation as a predictorvariable to measure degree to which mHealth artifactscould be used to simulate a clinical process likediagnosis.
Reach (X8)Inclusion of reach as a predictor variable was informedby empirical findings relating to PVT-IT [18, 22]. Thevariable is a measure of technology capability to providesufficient access to maternal care services at reducedcost and time. In reviewed studies, it is evident thatmost mHealth interventions fail to provide adequateaccess to maternal care services and information due tolong distances, inadequate health facilities, and culturalbarriers [5–7, 28]. Therefore, we used reach to investi-gate how mobile phones and point-of-care devices couldprovide sufficient reach by reducing time and cost ofaccessing maternal care services and information.
Monitoring (X9)This variable was adapted from PVT-IT [18] to measurecapability of technology to monitor patient’s health sta-tus. During antenatal and postnatal care, mothers arerequired to make at least four visits to monitor theirprogress. However, in remote areas, most patients fail tohonour such visits hence resulting to complications likestillbirth and haemorrhage. To provide sufficient patientmonitoring in such places, mobile-based interventionsthat use wireless body sensors may be considered.Nevertheless, such interventions may not be feasibledue to limitations relating to poor infrastructure, cost,privacy and cultural beliefs. In this study, we used thevariable to predict degree to which mobile devicescould be used to provide sufficient patient follow-upin low-resource settings.
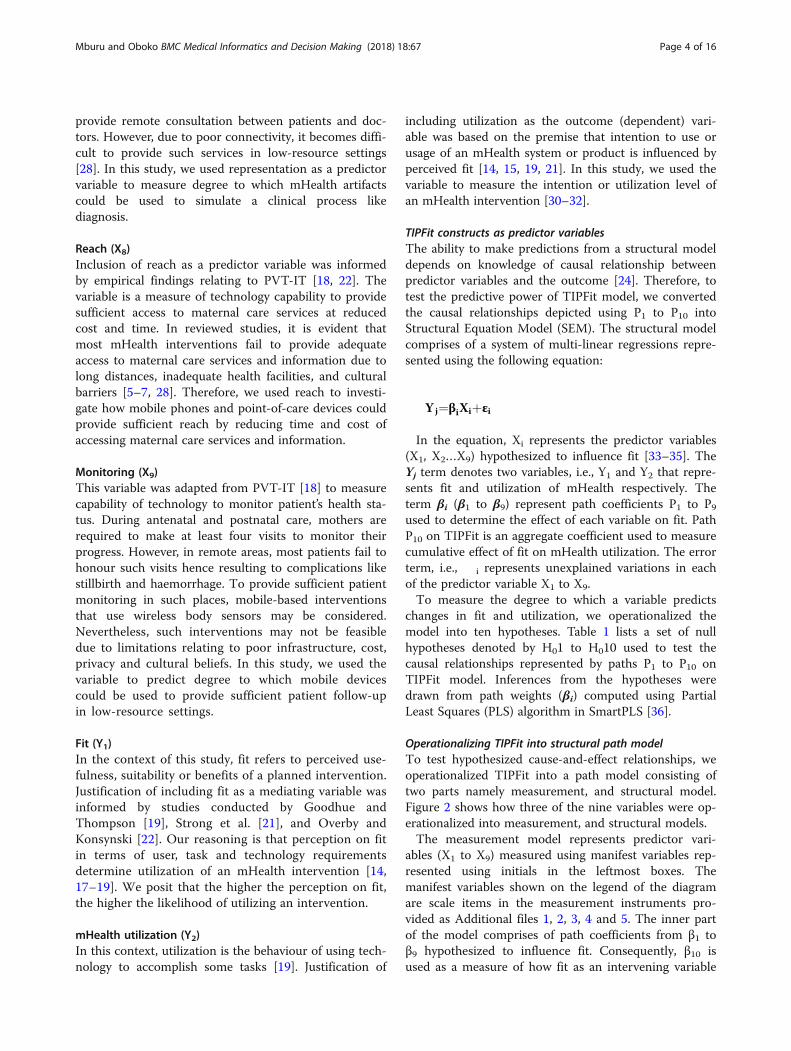
Fit (Y1)In the context of this study, fit refers to perceived use-fulness, suitability or benefits of a planned intervention.Justification of including fit as a mediating variable wasinformed by studies conducted by Goodhue andThompson [19], Strong et al. [21], and Overby andKonsynski [22]. Our reasoning is that perception on fitin terms of user, task and technology requirementsdetermine utilization of an mHealth intervention [14,17–19]. We posit that the higher the perception on fit,the higher the likelihood of utilizing an intervention.
mHealth utilization (Y2)In this context, utilization is the behaviour of using tech-nology to accomplish some tasks [19]. Justification of
including utilization as the outcome (dependent) vari-able was based on the premise that intention to use orusage of an mHealth system or product is influenced byperceived fit [14, 15, 19, 21]. In this study, we used thevariable to measure the intention or utilization level ofan mHealth intervention [30–32].
TIPFit constructs as predictor variablesThe ability to make predictions from a structural modeldepends on knowledge of causal relationship betweenpredictor variables and the outcome [24]. Therefore, totest the predictive power of TIPFit model, we convertedthe causal relationships depicted using P1 to P10 intoStructural Equation Model (SEM). The structural modelcomprises of a system of multi-linear regressions repre-sented using the following equation:
Yj¼βiXiþεi
In the equation, Xi represents the predictor variables(X1, X2…X9) hypothesized to influence fit [33–35]. TheYj term denotes two variables, i.e., Y1 and Y2 that repre-sents fit and utilization of mHealth respectively. Theterm βi (β1 to β9) represent path coefficients P1 to P9used to determine the effect of each variable on fit. PathP10 on TIPFit is an aggregate coefficient used to measurecumulative effect of fit on mHealth utilization. The errorterm, i.e., i represents unexplained variations in eachof the predictor variable X1 to X9.To measure the degree to which a variable predicts
changes in fit and utilization, we operationalized themodel into ten hypotheses. Table 1 lists a set of nullhypotheses denoted by H01 to H010 used to test thecausal relationships represented by paths P1 to P10 onTIPFit model. Inferences from the hypotheses weredrawn from path weights (βi) computed using PartialLeast Squares (PLS) algorithm in SmartPLS [36].
Operationalizing TIPFit into structural path modelTo test hypothesized cause-and-effect relationships, weoperationalized TIPFit into a path model consisting oftwo parts namely measurement, and structural model.Figure 2 shows how three of the nine variables were op-erationalized into measurement, and structural models.The measurement model represents predictor vari-
ables (X1 to X9) measured using manifest variables rep-resented using initials in the leftmost boxes. Themanifest variables shown on the legend of the diagramare scale items in the measurement instruments pro-vided as Additional files 1, 2, 3, 4 and 5. The inner partof the model comprises of path coefficients from β1 toβ9 hypothesized to influence fit. Consequently, β10 isused as a measure of how fit as an intervening variable
Mburu and Oboko BMC Medical Informatics and Decision Making (2018) 18:67 Page 4 of 16
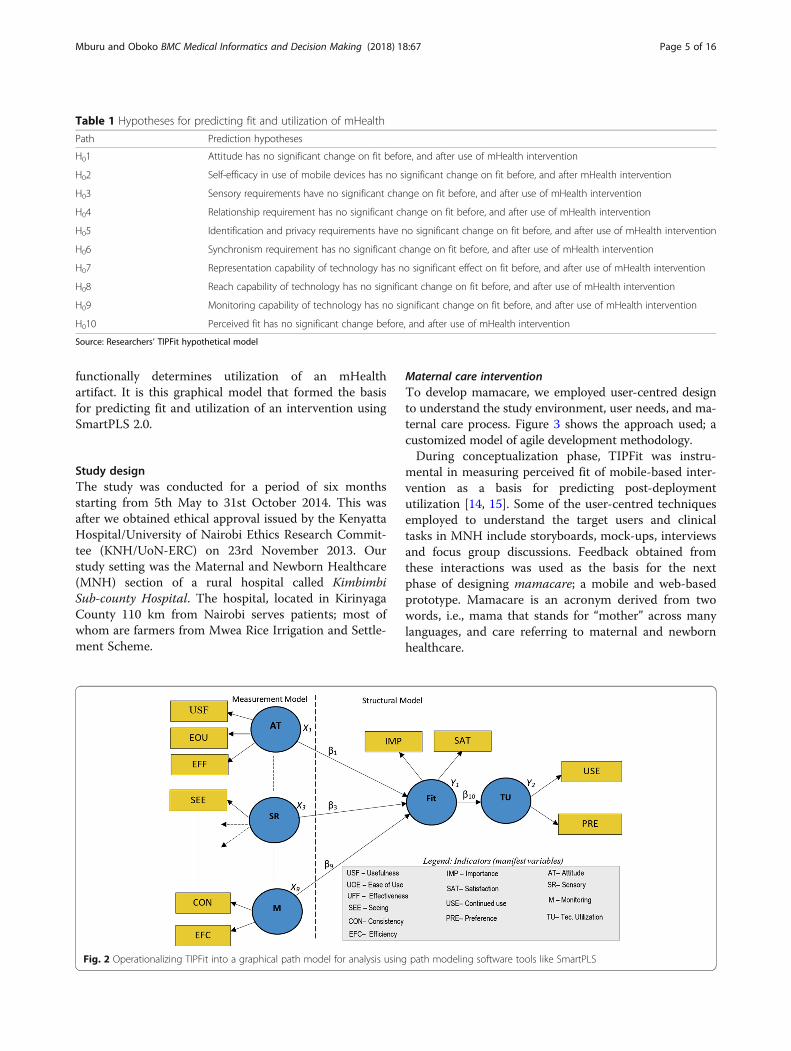
functionally determines utilization of an mHealthartifact. It is this graphical model that formed the basisfor predicting fit and utilization of an intervention usingSmartPLS 2.0.
Study designThe study was conducted for a period of six monthsstarting from 5th May to 31st October 2014. This wasafter we obtained ethical approval issued by the KenyattaHospital/University of Nairobi Ethics Research Commit-tee (KNH/UoN-ERC) on 23rd November 2013. Ourstudy setting was the Maternal and Newborn Healthcare(MNH) section of a rural hospital called KimbimbiSub-county Hospital. The hospital, located in KirinyagaCounty 110 km from Nairobi serves patients; most ofwhom are farmers from Mwea Rice Irrigation and Settle-ment Scheme.
Maternal care interventionTo develop mamacare, we employed user-centred designto understand the study environment, user needs, and ma-ternal care process. Figure 3 shows the approach used; acustomized model of agile development methodology.During conceptualization phase, TIPFit was instru-
mental in measuring perceived fit of mobile-based inter-vention as a basis for predicting post-deploymentutilization [14, 15]. Some of the user-centred techniquesemployed to understand the target users and clinicaltasks in MNH include storyboards, mock-ups, interviewsand focus group discussions. Feedback obtained fromthese interactions was used as the basis for the nextphase of designing mamacare; a mobile and web-basedprototype. Mamacare is an acronym derived from twowords, i.e., mama that stands for “mother” across manylanguages, and care referring to maternal and newbornhealthcare.
Fig. 2 Operationalizing TIPFit into a graphical path model for analysis using path modeling software tools like SmartPLS
Table 1 Hypotheses for predicting fit and utilization of mHealth
Path Prediction hypotheses
H01 Attitude has no significant change on fit before, and after use of mHealth intervention
H02 Self-efficacy in use of mobile devices has no significant change on fit before, and after mHealth intervention
H03 Sensory requirements have no significant change on fit before, and after use of mHealth intervention
H04 Relationship requirement has no significant change on fit before, and after use of mHealth intervention
H05 Identification and privacy requirements have no significant change on fit before, and after use of mHealth intervention
H06 Synchronism requirement has no significant change on fit before, and after use of mHealth intervention
H07 Representation capability of technology has no significant effect on fit before, and after use of mHealth intervention
H08 Reach capability of technology has no significant change on fit before, and after use of mHealth intervention
H09 Monitoring capability of technology has no significant change on fit before, and after use of mHealth intervention
H010 Perceived fit has no significant change before, and after use of mHealth intervention
Source: Researchers’ TIPFit hypothetical model
Mburu and Oboko BMC Medical Informatics and Decision Making (2018) 18:67 Page 5 of 16

In design phase, we used unified modeling language(UML) tools to align the planned intervention to userrequirements identified during conceptualization.Figure 4 is a sample use case diagram that depicts inter-action between mamacare and clinicians (caregivers) thatwere involved in the study.To improve access to maternal care services and infor-
mation through mobile, Fig. 5 shows a sample use casediagram depicting interaction between mamacare andpatients.During the build phase, we used web development tools
like HTML5, CSS3 and JavaScript to implement the webportal used by caregivers to process and manage patients’health records. The Short Message Service (SMS) modulewas implemented using open source SMS Server Tools3while the back-end was implemented using MySQL, Apa-che web server and PHP. Figure 6 depicts the architectureused to deploy mamacare in the study setting. The pri-mary database server was installed in the hospital while abackup server was hosted at University of Nairobi for re-dundancy and security purpose.
To enhance user experience, the web interface was de-signed to adapt to multiple device profiles depending onthe screen size and orientation. Figure 7 shows how thesame web portal appears on desktop computer and mo-bile phone. This responsive behaviour makes mamacaresuitable for use in places with limited access tocomputers.Before mamacare was deployed, we agreed with
the hospital management that the system was com-plementary to standard procedure for managingantenatal and postnatal patients. The complementarymechanism involved sending SMS messages on ap-pointments, danger signs, safe delivery, nutrition andpreventive care to registered patients. Mamacare alsoreceives vital signs for temperature, blood pressure,and blood sugar to enhance monitoring of mothersand their children. Figure 8(a) shows vital signs re-ceived via SMS while Fig. 8(b) shows a sample SMSreminder on clinic appointment otherwise referredto as “To Come Again (TCA)” in maternal carecontext.
Fig. 3 Approach employed in the development of mamacare prototype that was used to support maternal and newborn care
Fig. 4 Use case model depicting the interaction between mamacare system and caregivers
Mburu and Oboko BMC Medical Informatics and Decision Making (2018) 18:67 Page 6 of 16

Design of repeated measures quasi-experimentTo measure the predictive power of TIPFit model, weused quasi-experiment to repeatedly measure responsesfrom the same group of respondents before, and afterintervention. Despite shortcomings of quasi-experimentsin terms of internal and external validity, single-grouprepeated measures design is desirable in clinical environ-ment where randomization may raise political, ethical orlegal issues. In this regard, our study protocol approvedby KNH/UoN-ERC required use of study designs thatwould not deny subjects benefits of the planned inter-vention. This was the main reason that influenced choice
of single-group (within-subjects) repeated measuresdesign. In this design, each subject served as her ownexperimental control hence making it possible to detectthe effect of predictor variables on fit and utilization ofmamacare. Figure 9 shows how the three measures weretaken before, and after exposure to mamacare interven-tion for a period of six months.Before the intervention, a pretest (T0) was used to
measure perceptions based on benefits of mamacarecommunicated to participants during health educationsessions organized by the hospital. Three months afterthe subjects were exposed to intervention, we conducted
Fig. 5 Use case model depicting the interaction between mamacare system and registered patients
Fig. 6 Mamacare deployment architecture. The clinicians and admin staff have controlled access to integrated web and mobile interface; whilepatients can only receive or send SMS messages via their own mobile phones
Mburu and Oboko BMC Medical Informatics and Decision Making (2018) 18:67 Page 7 of 16

the first post-test (T1) to compare with predicted out-come. To compare the initial post-test outcome withreactions after prolonged use, we conducted the secondpost-test (T2) using the same tools employed in the ini-tial post-test evaluation.
Sampling and inclusion of study populationDuring the inception stage of this study, we visited theMaternal and Newborn Healthcare (MNH) section ofKimbimbi Sub-county hospital to review the antenataland postnatal registers. The reviewed registers had atotal of 226 women most of whom were receiving eitherantenatal or postnatal care services. To get a representa-tive proportion from this population, we used simplerandom sampling with age, education, gestation, resi-dence, and ownership of mobile phone as inclusioncriteria. Empirical findings from related studies haveshown that factors like age, environment, and educationinfluence individual’s attitude and ability to use technol-ogy [16, 17, 26, 27]. The gestation factor was consideredbecause during pregnancy, women tend to change their
attitude and ability to perform tasks. The ownership ofmobile phone was also important because the purposeof the present study was to investigate utilization ofmobile devices in maternal and newborn care. Therefore,to get an optimal sample from the population of 226registered patients, we used the following formula to de-termine the optimal sample size:
n ¼ z2xpxqxNe2 N‐1ð Þ þ z2xpxq
In the equation, n represents the sample size; z = crit-ical value at 5% significance level; p = sample proportion(degree of variability) set as conservative value of 50%; Nis size of finite population; e is the level of precision setat ±5%; and q = 1 – p. By taking N = 226; z = ±1.96 basedon 5% significance level; p as 50% (0.5); e = 0.05; and q =0.5 (1–0.5) we obtained our sample size as follows:
n ¼ 1:962 � 0:5� 0:5� 226
0:052 226−1ð Þ þ 1:962 � 0:5� 0:5¼ 143
This implies that a sample of at least 143 subjects wasrequired for the study. After contacting these subjectsthrough mobile calls and SMS, only 95 women acceptedto attend a formal training session organized throughthe hospital. During the two-hour training, benefits andlimitations of using mobile phones were communicatedto the participants. Based on this information, 79 partici-pants were recruited after they agreed to participate inthe study by signing consent forms. The other 16 partici-pants refused to participate due to issues relating tofinancial constraints, attitude and privacy.Although the number of participants recruited was
half of the expected, it was sufficient to get reliable infer-ences. Goodhue et al. [37] demonstrated that a sampleof 40 subjects is sufficient to achieve reliable results inPLS. Furthermore, Overby and Konsynski demonstrated
Fig. 7 Mamacare web portal on computer on the left; and mobile phone interface inset on the right. a Vital signs SMS. b SMS-based TCA reminder(Esther is a pseudonym)
Fig. 8 a The screen image on the left shows vital signs sent asSMS message to mamacare backend system. b on theright shows a sample SMS reminder generated based onmaternal profile; and sent to a pseudonym (Esther) thatrepresents an actual patient receiving mamacare services
Mburu and Oboko BMC Medical Informatics and Decision Making (2018) 18:67 Page 8 of 16

that a sample of 60 subjects is sufficient to detect smalland medium effect [22, 38, 39].
MeasurementsThe study used three measures at different points intime to investigate the predictive power of a hypotheticalmodel. The measurement instruments used before andafter intervention were based on indicators derived fromTIPFit model.Before mamacare was deployed, we conducted a pre-
test as a baseline for predicting post-deploymentutilization based on perceived benefits. The measure-ment instruments included basic demographic scaleitems such as age, education and gestation assumed toinfluence attitude and ability to use technology. Sincethe same subjects were involved in the entire study, thepost-test scale items comprised of closed andopen-ended Likert-type questions on a scale of 1 to 5.Samples of the pretest and post-test questionnaires usedare provided as Additional files 1, 2, 3, 4 and 5.To take care of participants with low literacy level, two
research assistants were recruited from the local com-munity to guide the respondents through the question-naires in local languages.To validate the data collection instruments, we used
composite reliability, and Cronbach’s alpha (α) to test in-ternal consistency. We also analyzed validity of thestructural model using convergence and discriminantvalidity. Given our relatively small sample, we performedthese tests using PLS algorithm in SmartPLS [36]. Table 2gives a summary of composite reliability, and Cronbach’sα values generated from the pretest (T0), and post-test(T1 and T2) datasets.The table shows that composite reliability for all the
variables were above the recommended 0.70. However,the four values highlighted in Cronbach’s alpha columnwere slightly less than 0.70. Despite these minor varia-tions, the results indicate good internal consistency ofthe pretest and post-test scale items.The results also indicated that Average Variable
Extracted (AVE) for all the constructs were above
0.50. According to Chin and Newstead [38], proof ofconvergent and discriminant validity requires the AVEscore for each construct to be above 0.50 (50%). Ana-lysis from the three datasets indicates that each ofthe eleven constructs has an AVE score above 0.50;hence indicating that TIPFit model has good conver-gence, and discriminant validity. This confidence inthe reliability and validity of the structure of themodel was a greenlight to path analysis and hypoth-esis testing.
Data analysisTo analyze the pretest and post-test datasets collectedduring the experiment, incomplete and wrongly filledquestionnaires were eliminated. The valid responseswere coded into numerical values and keyed intoStatistical Package for Social Scientists (SPSS) to de-termine the frequency, percentage, and statisticalmean of each demographic item.Regarding predictive modeling, the responses were
entered into Microsoft Excel spreadsheet andexported into SmartPLS workspace for analysis using
Fig. 9 Repeated measures quasi-experiment to predict fi and utilization of mHealth interventions in low-resource settings
Table 2 Reliability test using composite, and Cronbach’s alpha
Predictorvariable
Composite reliability Cronbach alpha
T0 T1 T2 T0 T1 T2
Attitude 0.85 0.91 0.92 0.73 0.86 0.88
Efficacy 0.84 0.88 0.92 0.77 0.80 0.88
Sensory 0.85 0.89 0.81 0.75 0.81 0.67
Relation 0.88 0.85 0.86 0.80 0.73 0.75
Privacy 0.90 0.86 0.86 0.83 0.76 0.76
Synch 0.85 0.84 0.91 0.66 0.62 0.80
Represent 0.83 0.86 0.89 0.71 0.76 0.82
Reach 0.82 0.88 0.86 0.68 0.80 0.75
Monitor 0.92 0.91 0.91 0.82 0.79 0.80
Fit 0.94 0.93 0.93 0.88 0.84 0.85
Utilization 0.88 0.90 0.94 0.74 0.79 0.86
Source: Primary Data. [NB: The italicized values under Cronbach's alpha fallsbelow the recommended threshhold of 0.70]
Mburu and Oboko BMC Medical Informatics and Decision Making (2018) 18:67 Page 9 of 16

PLS [36–38]. In addition to path analysis, we usedRepeated Measures Analysis of Variance (RM-A-NOVA), and Bonferroni post hoc test to draw reliableconclusions from the study.
ResultsBasic demographic characteristicsMost adoption studies have shown that demographic at-tributes such as gender, age and education influenceone’s belief, attitude and ability to perform tasks usingtechnology [9, 14, 15, 17, 21, 22]. In this study, we ana-lyzed these attributes to gain insight on characteristics ofthe subjects that influence acceptance and use of theplanned mHealth intervention. From 79 participantswho participated in the pretest conducted before theintervention, we obtained 73 valid questionnaires. Thesix questionnaires that were disregarded were eitherincomplete or wrongly filled. Analysis of age distributionusing SPSS showed that majority of the respondentswere aged between 20 and 25. Table 3 shows the age dis-tribution of 73 valid responses; demonstrating that mostof the subjects were within the reproductive age between20 and 35 years.Analysis on education revealed that 34.2% of the sub-
jects have studied up to primary school level (Grade 8),and 47.9% up to secondary (Grade 12) as shown inFig. 10. The pie chart also indicates that 15.1% havestudied up to college while only 2.7% have studied up touniversity. This is a clear reflection that majority of thesubjects have low literacy skills that could have been abarrier to effective use of mobile and point-of-care tech-nologies [14–16].
Path analysisTo determine the ability of TIPFit in predicting fitand utilization, we used SmartPLS to analyze pathweights of the structural model. This is because PLSis variance-based structural equation models that doesnot impose restrictions on sample size and normalityof distribution [37, 38]. Figure 11 shows the structuralmodel generated from the pretest dataset using scaleitems as reflective indicators of their correspondingpredictor variables. The path weights represent
coefficients β1 to β10 in the equation model, and P1to P10 on TIPFit model.The coefficient of determination (R2) values of 0.802
and 0.639 indicate that the pretest model has high pre-dictive power of 80.2% on fit, and 63.9% likelihood ofutilization. This assumption is based on Overby andKonsynski [22] assertion that a structural model withR2 > 0.25 is considered to have good predictive power.After the subjects were exposed to an intervention,
dataset collected during the first post-test was cleanedand analyzed using SmartPLS. Figure 12 shows the pathweights; R2 of 69.1% on fit, and 50.5% of actualutilization. The observed variations between the pretestpredictions and actual outcome necessitated improve-ment of mamacare to address issues raised by the usersduring the first post-test evaluation.Three months later, we conducted the second
post-test as a follow-up measure. However, due tovoluntary exit of six subjects, 73 out of 79 initial par-ticipants filled the questionnaires. The post-test2questionnaire was similar to that used in post-test1but with additional questions for measuring usersatisfaction from enhanced mamacare. The enhance-ments were mostly on the user interface, languageused to send messages, and SMS module for receivingvital signs such as blood pressure, temperature,haemoglobin and blood sugar. The vital signs wereused by caregivers to monitor health trends usingdynamic charts. This made it easier for caregivers inMNH to easily detect pregnancy and postpartumcomplications that require urgent attention.Figure 13 shows the model path weights and coeffi-
cients of determination after modeling post-test2 dataset
Table 3 Distribution of participants by age categories
Age category Frequency Percent (%) Valid Percent
Valid 15–19 8 11.0 11.0
20–25 39 53.4 53.4
26–30 16 21.9 21.9
30–35 10 13.7 13.7
Total 73 100.0 100.0
Source: Primary data
Fig. 10 Distribution of participants by education level
Mburu and Oboko BMC Medical Informatics and Decision Making (2018) 18:67 Page 10 of 16

using SmartPLS. The results indicate marginal drop onfit from 69.1% recorded in the first post-test to 60.3%.Conversely, the results revealed slight improvement onutilization of mamacare from 50.5% recorded in the firstpost-test to 53.7%.In summary, Table 4 shows structural model path
weights generated from the pretest and two post-testdatasets.The table shows that attitude towards fit was positive
before and after intervention. However, Self-efficacy wasinitially negative but marginally improved after pro-longed use of mamacare. We also observe that pathweights obtained from sensory requirements were con-sistently negative before and after the intervention. Thecumulative path weights between fit and mHealthutilization shows high positive scores; indicating that fithas strong influence on utilization before, and afterintervention.
Comparative analysisDue to some inconsistencies observed from the struc-tural path models, we used alternative methods in order
to draw reliable conclusions. First, we ran bootstrappingalgorithm available in SmartPLS to determine signifi-cance of path weights. Table 5 gives a summary of tvalues after bootstrapping the three path models at 5%significance level.Physical inspection on each column indicates temporal
changes in hypothesized causation. For example, attitudewas consistently positive and significant because its t valueswere greater than the critical value of 1.96 (t > 1.96). Sen-sory requirements variable consistently returned negativeoutcomes.These observations may be interpreted to mean that
attitude towards mobile use in maternal care was posi-tive but may not sufficiently address sensory require-ments. However, due to inconsistences observed insynchronism, representation and monitoring, we optedto use parametric tests as an alternative to structuralpath modeling.
Bonferroni post hoc testTo analyze changes in usage behaviour before and afterintervention, we used Bonferroni post hoc test available
Fig. 11 Pretest (prediction) model generated from pretest dataset showing coefficient of determination (R2) and path weights. The yellow boxesrepresent reflective indicators (manifest variables)
Mburu and Oboko BMC Medical Informatics and Decision Making (2018) 18:67 Page 11 of 16

in SPSS. This test is suitable in studies that seek toestablish effect of experimental treatment. Table 6 showssummary of pairwise comparison between the pretestand post-test1 (T0-T1); post-test1 and post-test2 (T1-T2);and pretest and post-test2 (T0-T2).The table shows that there is significant differences
between the pretest and post-test1 in sensory require-ments, identification and privacy, synchronism, moni-toring, fit and utilization of mHealth. However,comparison between T1 and T2 shows significant dif-ferences in self-efficacy, and monitoring variables.These findings suggest that reactions before the inter-vention had better predictions after stable use ofmamacare. We therefore assume that after improve-ment of mamacare, usage behaviour almost matchedpretest predictions on utilization of mamacare. To in-vestigate these variations, we further analyzed thethree datasets using Repeated Measures ANOVA(RM-ANOVA).
Repeated measures ANOVAThree essential requirements for using RM-ANOVAare inspection of underlying data for normality ofdistribution, outliers and sphericity. Although the re-sults from these tests showed the three datasets
satisfied the first two requirements, there were someviolations of sphericity. Table 7 shows a summary ofRM-ANOVA statistics after correcting violations ofsphericity in six variables that have p values lessthan 0.05.Visual inspection on RM-ANOVA column indicates
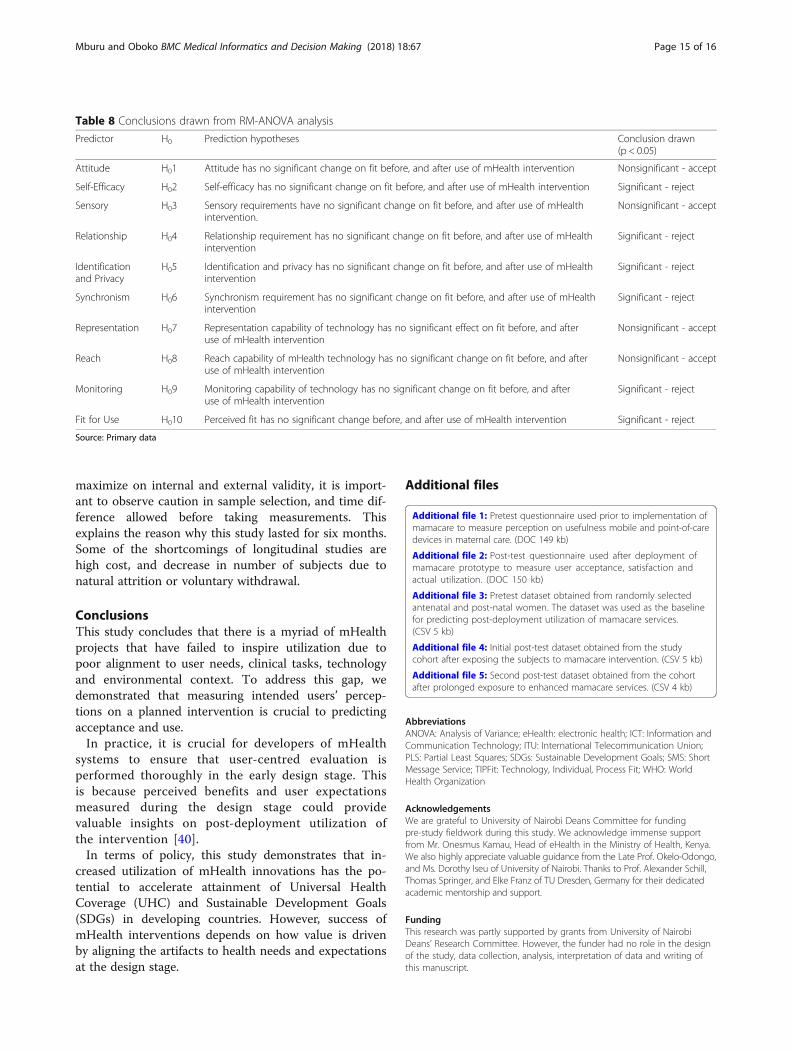
that there is no significant differences in four variableswith p values less than 0.05. These are attitude, sensoryrequirements, representation, and reach. This inferenceimplies that mamacare intervention did not change par-ticipants’ perception on these predictor variables. Insummary, Table 8 shows conclusions drawn from Re-peated Measures ANOVA results to either support orreject hypothesized relationships.From these inferences, we conclude that attitude, sen-
sory requirements, representation and reach variablesestimated actual outcome observed after exposing thestudy cohort to mamacare intervention.By comparing these results with those drawn from
structural path models, we observe similarities and someinconsistences. Despite these variations, conclusionsdrawn from both structural modeling and parametricanalyses demonstrate that TIPFit model is capable ofpredicting utilization of mHealth interventions in theearly design stage.
Fig. 12 Post-test model generated from initial post-test evaluation showing the coefficients of determination and path weights
Mburu and Oboko BMC Medical Informatics and Decision Making (2018) 18:67 Page 12 of 16

DiscussionsThis study used repeated measures quasi-experiment ona single group to measure the power of TIPFit model inpredicting utilization of mHealth interventions. To valid-ate the model, a pretest was administered on a studycohort of 79 subjects before exposure to mamacareintervention. The intervention involved sending andreceiving SMS alerts and reminders on maternal careservices through mobile phones.
Predictive power of TIPFit modelThe study findings revealed interesting trends beforeand after exposing the study subjects to mamacare
intervention. Inferences on the pretest and post-teststructural path models revealed that user’s perception onfit constantly dropped after exposing the subjects to theintervention. Moreover, results from RM-ANOVArevealed the intervention had significant change onseven predictor variables. These are self-efficacy, rela-tionship, identification and privacy, synchronism, moni-toring, fit and mamacare utilization.These results are a confirmation to Davis and Venkatesh
assertion that; evaluating user acceptance during designcan be used to predict post-implementation acceptanceand use of a new system [40]. Furthermore, the studyshows some similarities to the findings by Bhattacherjeeand Premkumar [15] in their study on predicting usage
Table 5 Significance test results for the bootstrapped path weights
Test Att Self Sens Rel Prv Sync Rep Reac Mon Fit
T0 2.38 −1.71 −1.79 5.07 0.75 2.28 1.43 −0.37 2.73 20.48
T1 2.96 −0.83 −3.53 1.09 3.40 1.30 3.91 5.09 0.30 19.52
T2 3.16 0.08 −3.65 −0.59 2.14 − 0.25 1.94 3.64 3.86 20.39
Source: Primary Data
Table 4 Summary of path weights from pretest and post-testsmodels
Test Atti. Self Sense Rela Priv Syn Rep Reach Mo Fit.
T0 0.19 −0.11 −0.08 0.54 0.07 0.17 0.12 −0.03 0.38 0.79
T1 0.21 −0.06 −0.15 0.08 0.20 0.13 0.31 0.24 0.02 0.71
T2 0.22 0.01 −0.18 − 0.04 0.19 − 0.02 0.15 0.29 0.26 0.73
Source: Primary Data. [NB. The italicized entries in the Fit column indicatesthat the values are cummulative path weights from the 9 predictor variablesX1 to X9]
Fig. 13 Post-test model generated from the second post-test showing R2 and path weights. The model indicates a marginal improvement onutilization of mamacare
Mburu and Oboko BMC Medical Informatics and Decision Making (2018) 18:67 Page 13 of 16

from belief and attitude. Therefore, the findings from thisstudy confirms that predictive approach to user accept-ance testing at the design stage can be used to estimatepost-deployment utilization [11, 14, 15].
Strengths of the studyOne of the strengths of this study is emphasis on use ofopen source software to implement mamacare that runson low-end mobile devices. Mamacare back-end wasimplemented using Apache web server, MySQL data-base, PHP, and SMS Tools3 gateway. To make thefront-end adaptive to multiple device profiles, we usedTwitter bootstrap; a framework that supports HTML5,CSS3 and JavaScript. This makes mamacare a low-costdigital health solution for supporting maternal and new-born care in low-resource settings.
Another strength of the study is the predictive ap-proach used to develop and evaluate mamacare proto-type. This approach is a unique contribution torequirements engineering and user-centred system de-velopment methodology. The study also demonstrateshow to apply structural equation modeling to predictutilization based on the understanding of user’s behav-iour, healthcare processes, and technology contexts.
Study limitationsTheoretical models focusing on fit do not give sufficientattention to the fact that system artifacts must be uti-lized before they deliver performance impacts [19].Moreover, there is no evidence that quality of anmHealth system leads to increased voluntary utilization.In our pre-study [13], we observed poor systems beingutilized extensively in low-income settings due to donorfunding, social benefits, ignorance, and availability. Forthis reason, we argue that increased utilization ofmHealth innovations in low-resource settings may notnecessarily result to improved quality of health out-comes. This is because there are other socioeconomicand technical factors that influence delivery of health-care services such as the cost of care, infrastructure, gov-ernance, culture, and skilled workforce. Unfortunately,TIPFit model does not consider these factors but onlyfocuses on the three elements of people, process andtechnology used to evaluate success of informationsystems.Another limitation of this study was on the design
used to predict utilization. Although single-grouprepeated measures design used is closer to randomizedexperiments, the datasets collected from the same sub-jects may have had likelihood of reporting bias. To
Table 7 Test of overall treatment effect using RM-ANOVA
Sphericity RM-ANOVA: Effect Remarks
Predictor χ2 p-value F ratio p-value Eta2 p < 0.05
Attitude 0.534 0.766 2.595 0.078 0.036 Not sign.
Self-Efficacy 3.432 0.180 3.258 0.041 0.045 Significant
Sensory 5.109 0.078 1.233 0.295 0.018 Not sign.
Relationship 22.076 < 0.001 4.038 0.029 0.055 GG: Sign.
ID and Privacy 9.980 0.007 7.462 0.001 0.098 GG: Sign.
Synchronism 13.683 0.001 8.022 0.001 0.104 GG: Sign.
Representation 10.664 0.005 2.373 0.105 0.033 GG: Not Sign
Reach 5.034 0.081 1.117 0.330 0.016 Not sign.
Monitoring 20.082 < 0.001 13.384 < 0.001 0.162 GG: Sign.
Fit 8.516 0.014* 10.144 < 0.001 0.128 GG: Sign.
mHealth use 1.350 0.509 4.152 0.018 0.057 Sign.
Source: Primary Data
Table 6 Comparison of sample means using Bonferroni post-hoc test
PredictorVariable
Pretest Post-test1 Post-test2 Mean differences (p-value)
x̄ =μ SE x̄=μ SE x̄=μ SE T0 - T1 T1-T2 T0 –T2
Attitude 1.56 0.06 1.39 0.06 1.54 0.06 0.11 0.17 0.99
Efficacy 1.55 0.07 1.35 0.06 1.55 0.06 0.10 0.04 1.00
Sensory 2.23 0.12 1.98 0.12 2.11 0.08 0.05 0.21 0.39
Relation 1.81 0.09 1.53 0.06 1.66 0.06 0.11 0.17 0.99
ID. & Privacy 1.89 0.09 1.51 0.07 1.58 0.06 0.01 0.86 0.01
Synchronism 1.84 0.10 1.43 0.07 1.61 0.06 0.00 0.09 0.09
Representation 1.63 0.07 1.47 0.06 1.52 0.05 0.11 0.83 0.48
Reach 1.74 0.07 1.59 0.08 1.65 0.06 0.47 0.93 0.64
Monitor 1.66 0.08 2.00 0.00 1.60 0.06 0.00 0.00 0.92
Fit 1.77 0.09 1.36 0.06 1.54 0.06 0.00 0.06 0.06
mHealth Use 1.69 0.08 1.43 0.07 1.51 0.06 0.02 0.74 0.18
Source: Primary Data
Mburu and Oboko BMC Medical Informatics and Decision Making (2018) 18:67 Page 14 of 16
maximize on internal and external validity, it is import-ant to observe caution in sample selection, and time dif-ference allowed before taking measurements. Thisexplains the reason why this study lasted for six months.Some of the shortcomings of longitudinal studies arehigh cost, and decrease in number of subjects due tonatural attrition or voluntary withdrawal.
ConclusionsThis study concludes that there is a myriad of mHealthprojects that have failed to inspire utilization due topoor alignment to user needs, clinical tasks, technologyand environmental context. To address this gap, wedemonstrated that measuring intended users’ percep-tions on a planned intervention is crucial to predictingacceptance and use.In practice, it is crucial for developers of mHealth
systems to ensure that user-centred evaluation isperformed thoroughly in the early design stage. Thisis because perceived benefits and user expectationsmeasured during the design stage could providevaluable insights on post-deployment utilization ofthe intervention [40].In terms of policy, this study demonstrates that in-
creased utilization of mHealth innovations has the po-tential to accelerate attainment of Universal HealthCoverage (UHC) and Sustainable Development Goals(SDGs) in developing countries. However, success ofmHealth interventions depends on how value is drivenby aligning the artifacts to health needs and expectationsat the design stage.
Additional files
Additional file 1: Pretest questionnaire used prior to implementation ofmamacare to measure perception on usefulness mobile and point-of-caredevices in maternal care. (DOC 149 kb)
Additional file 2: Post-test questionnaire used after deployment ofmamacare prototype to measure user acceptance, satisfaction andactual utilization. (DOC 150 kb)
Additional file 3: Pretest dataset obtained from randomly selectedantenatal and post-natal women. The dataset was used as the baselinefor predicting post-deployment utilization of mamacare services.(CSV 5 kb)
Additional file 4: Initial post-test dataset obtained from the studycohort after exposing the subjects to mamacare intervention. (CSV 5 kb)
Additional file 5: Second post-test dataset obtained from the cohortafter prolonged exposure to enhanced mamacare services. (CSV 4 kb)
AbbreviationsANOVA: Analysis of Variance; eHealth: electronic health; ICT: Information andCommunication Technology; ITU: International Telecommunication Union;PLS: Partial Least Squares; SDGs: Sustainable Development Goals; SMS: ShortMessage Service; TIPFit: Technology, Individual, Process Fit; WHO: WorldHealth Organization
AcknowledgementsWe are grateful to University of Nairobi Deans Committee for fundingpre-study fieldwork during this study. We acknowledge immense supportfrom Mr. Onesmus Kamau, Head of eHealth in the Ministry of Health, Kenya.We also highly appreciate valuable guidance from the Late Prof. Okelo-Odongo,and Ms. Dorothy Iseu of University of Nairobi. Thanks to Prof. Alexander Schill,Thomas Springer, and Elke Franz of TU Dresden, Germany for their dedicatedacademic mentorship and support.
FundingThis research was partly supported by grants from University of NairobiDeans’ Research Committee. However, the funder had no role in the designof the study, data collection, analysis, interpretation of data and writing ofthis manuscript.
Table 8 Conclusions drawn from RM-ANOVA analysis
Predictor H0 Prediction hypotheses Conclusion drawn(p < 0.05)
Attitude H01 Attitude has no significant change on fit before, and after use of mHealth intervention Nonsignificant - accept
Self-Efficacy H02 Self-efficacy has no significant change on fit before, and after use of mHealth intervention Significant - reject
Sensory H03 Sensory requirements have no significant change on fit before, and after use of mHealthintervention.
Nonsignificant - accept
Relationship H04 Relationship requirement has no significant change on fit before, and after use of mHealthintervention
Significant - reject
Identificationand Privacy
H05 Identification and privacy has no significant change on fit before, and after use of mHealthintervention
Significant - reject
Synchronism H06 Synchronism requirement has no significant change on fit before, and after use of mHealthintervention
Significant - reject
Representation H07 Representation capability of technology has no significant effect on fit before, and afteruse of mHealth intervention
Nonsignificant - accept
Reach H08 Reach capability of mHealth technology has no significant change on fit before, and afteruse of mHealth intervention
Nonsignificant - accept
Monitoring H09 Monitoring capability of technology has no significant change on fit before, and afteruse of mHealth intervention
Significant - reject
Fit for Use H010 Perceived fit has no significant change before, and after use of mHealth intervention Significant - reject
Source: Primary data
Mburu and Oboko BMC Medical Informatics and Decision Making (2018) 18:67 Page 15 of 16

Availability of data and materialsThe datasets and instruments supporting conclusions drawn from this studyare included within the article and its Additional files 1, 2, 3, 4 and 5.
Authors’ contributionsSM and RO designed TIPFit model and data collection tools. SM collecteddata and wrote the manuscript. All the authors proofread, edited andapproved the revised manuscript.
Ethics approval and consent to participateThe research protocol Ref. KNH-ERC/A/375 to conduct this study in clinicalsetup was approved by Kenyatta National Hospital/University of NairobiEthics Research Committee (KNH/UoN-ERC). The approval period was between26th November 2013 and 25th November 2014. The protocol required writtenconsent from participants because data was obtained from clinical setting. Theconsent to participate was obtained from each subject through signing ofinformed consent forms. For minors under 16 years of age, written consent wasobtained from their parents or next of kin in order to participate as passive oractive respondents.
Consent for publicationNot applicable.
Competing interestsThe authors declare that they have no competing interests.
Publisher’s NoteSpringer Nature remains neutral with regard to jurisdictional claims inpublished maps and institutional affiliations.
Received: 13 April 2017 Accepted: 4 July 2018
References1. Njoroge M, et al. Assessing the feasibility of eHealth and mHealth: a
systematic review and analysis of initiatives implemented in Kenya.Medical Informatics and Decision Making. 2017;10(90):1–11.
2. Omachonu VK, Einspruch NG. Innovation in healthcare delivery systems: aconceptual framework. The Innovation Journal: The Public Sector InnovationJournal. 2010;15(2):1–20.
3. Breen G, Matusitz J. An evolutionary examination of telemedicine: a healthand computer-mediated communication. Perspective Soc Work PublicHealth. 2010;25:59–71.
4. WHO: mHealth New horizons for health through mobile technologies:second global survey on eHealth 2011.
5. Mechael P, et al. Barriers and gaps affecting mHealth in low and middleincome countries: Policy White Paper. Columbia: Academic: Center forGlobal Health and economic development earth institute; 2010.
6. Yu P, Wu MX, Yu H, Xiao GQ. The challenges for the adoption of m-health.Shanghai: IEEE Int. Conf. on Service Operations and Logistics andInformatics; 2006. p. 181–6.
7. International Telecommunication Union (ITU): Mobile eHealth fordeveloping countries. ITU-telecommunication development bureau 2010.
8. WHO, ITU. eHealth and innovation in women’s and children’s health: abaseline review: based on the findings of the 2013 survey of CoIA countriesby the WHO global observatory for eHealth. Geneva; 2014.
9. Breen G, Wan TTH, Ortiz J. Information technology adoption in rural healthclinics: a theoretical analysis. Journal of Information Technology Impact.2010;10(1):1–14.
10. Huang, et al. Effects of and satisfaction with short message servicereminders for patient medication adherence: a randomized controlledstudy. BMC Med Inform Decis Mak. 2013;13:127.
11. Mburu S. Application of structural equation modelling to predictacceptance and use of mHealth interventions at the design stage. Journalof Health Informatics in Developing Countries. 2017;11:1–17.
12. Omary Z, Lupiana D, Mtenzi F, Wu B. Analysis of the challenges affecting E-healthcare adoption in developing countries: a case of Tanzania.International Journal of Information Studies. 2010;2:38–50.
13. Mburu S, Franz E, Springer T. A conceptual framework for designing mHealthsolutions for developing countries. In: in MobileHealth Proceedings of the 3rdACM MobiHoc workshop on Pervasive wireless healthcare; 2013. p. 31–6.
14. Davis FD, Venkatesh V. Toward pre-prototype user acceptance testing ofnew information systems: implications for software Project Management.IEEE Trans on Engineering Management. 2004;51:31–46.
15. Bhattacherjee A, Premkumar G. Understanding changes in belief andattitude toward information technology usage: a theoretical model andlongitudinal test. MIS Q. 2004;28(2):229–54.
16. Ajzen I. The theory of planned behavior. Organ Behav Hum Decis Process.1999;50:179–211.
17. Davis FD. Perceived usefulness, perceived ease of use, and user acceptanceof information technology. MIS Q. 1989;13:319–40.
18. Overby EM. Process virtualization theory and the impact of informationtechnology. Organ Sci. 2008;19:277–91.
19. Goodhue DL, Thompson RL. Task-technology fit and individual performance.MIS Q. 1995;19:213–36.
20. Compeau DR, Higgins CR. Computer self-efficacy: development of measureand initial test. MIS Q. 1995;19:189–211.
21. Strong DM, Dishaw MT, Bandy DB. Extending task technology fit withcomputer self-efficacy. The DATA BASE for Advances in InformationSystems. 2006;37(2 & 3):96–107.
22. Overby EM, Konsynski B. Task-technology fit and process virtualizationtheory: an integrated model and empirical test. Res Pap. 2010:10–96.
23. United Nations. Progress towards the sustainable development goals.Economic and Social Council. 2016:5–7.
24. Gregor S. The nature of theory in IS. MIS Q. 2006;30(3):612–42.25. Hevner AR, March ST, Park J, Ram S. Design science in information systems
research. MIS Q. 2004;28:75–105.26. Armitage CJ, Conner M. Efficacy of the theory of planned behaviour: a
meta-analytic review. Br J Soc Psychol. 2001;40:471–99.27. Hagger MS, Chatzisarantis NLD, Biddle SJH. A meta-analytic review of theories
of reasoned action and planned behavior in physical activity: predictive validityand contribution of additional variables. J Sport Exerc Psychol. 2002;24:3–32.
28. Overby EN, Slaughter SA, Konsynski B. The design, use, andconsequences of virtual processes. Information Systems Research,INFORMS. 2010;21:700–10.
29. Oluoch T, Katana A, Ssempijja V, et al. Electronic medical record systems areassociated with appropriate placement of HIV patients on antiretroviraltherapy in rural health facilities in Kenya: a retrospective pre-post study. JAm Med Inform Assoc. 2014;21:1009–14.
30. Ammenwerth E, Iller C, Mahler C. IT-adoption and the interaction of task,technology and individuals: a fit framework and case study. BMC MedInform Decis Mak. 2006;6(3):1–13.
31. Yusof MM, Kuljis J, Papazafeiropoulou A, Stergioulas LK. An evaluationframework for health information systems: human, organization andtechnology fit factors (HOT-fit). Int J Med Inform. 2008;77:386–98.
32. Becker MH, Maiman LA, Kirscht JP, Haefner DP, Drachman RH. The healthbelief model and prediction of dietary compliance: a field experiment. JHealth Soc Behav. 1977;18:348–66.
33. Henseler J, Ringle CM, Sinkovics RR. The use of partial least squares ininternational marketing. New Challenges to International Marketing, Advancesin Int Marketing. 2009;20:277–319.
34. Fornell C, Larcker DF. Evaluating structural equation models withunobservable variables and measurement error. J Mark Res. 1981;18:39–50.
35. Bagozzi RP, Yi Y. On the evaluation of structural equation models. AcadMarket Sci J Acad Mark Sci. 1998;16:74–94.
36. Wong KK. Partial least squares structural equation modeling (PLS-SEM)techniques using SmartPLS, Marketing Bulletin. Technical Note. 2013:1.
37. Goodhue DL, et al. PLS, Small Sample Size, and Statistical Power. Proceedingsof the 39th Int. Conf. on System Sciences, Hawaii: MIS Research; 2006. p. 1–10.
38. Chin WW, Newsted PR. Structural Equation Modelling analysis with SmallSamples using Partial Least Squares, Statistical Strategies for Small SampleResearch, Sage Publications; 1999. p. 307–41.
39. Cohen J. Quantitative methods in psychology: a power primer. AmericanPsychological Association Bulletin. 1992;112:155–9.
40. DeLone WH, McLean ER. The DeLone and Mclean model of informationsystem success: a ten-year update. J Manag Inf Syst. 2003;19(4):9–30.
Mburu and Oboko BMC Medical Informatics and Decision Making (2018) 18:67 Page 16 of 16