Embed Size (px)
Citation preview

Philipp Kogelnik
A Mobile Augmented Reality App forHiking Maps
Bachelor’s thesis
Graz University of Technology
Institute for Computer Graphics and VisionHead: Univ.-Prof. Dipl.-Ing. Dr.techn. Dieter Schmalstieg
Supervisor: Dipl.-Ing. Jens Grubert
Graz, December 2014

This document is set in Palatino, compiled with pdfLATEX2e and Biber.
The LATEX template from Karl Voit is based on KOMA script and can befound online: https://github.com/novoid/LaTeX-KOMA-template

Statutory Declaration
I declare that I have authored this thesis independently, that I have not usedother than the declared sources/resources, and that I have explicitly markedall material which has been quoted either literally or by content from theused sources.
Graz,
Date Signature
Eidesstattliche Erklarung1
Ich erklare an Eides statt, dass ich die vorliegende Arbeit selbststandigverfasst, andere als die angegebenen Quellen/Hilfsmittel nicht benutzt, unddie den benutzten Quellen wortlich und inhaltlich entnommenen Stellen alssolche kenntlich gemacht habe.
Graz, am
Datum Unterschrift
1Beschluss der Curricula-Kommission fur Bachelor-, Master- und Diplomstudien vom10.11.2008; Genehmigung des Senates am 1.12.2008
iii

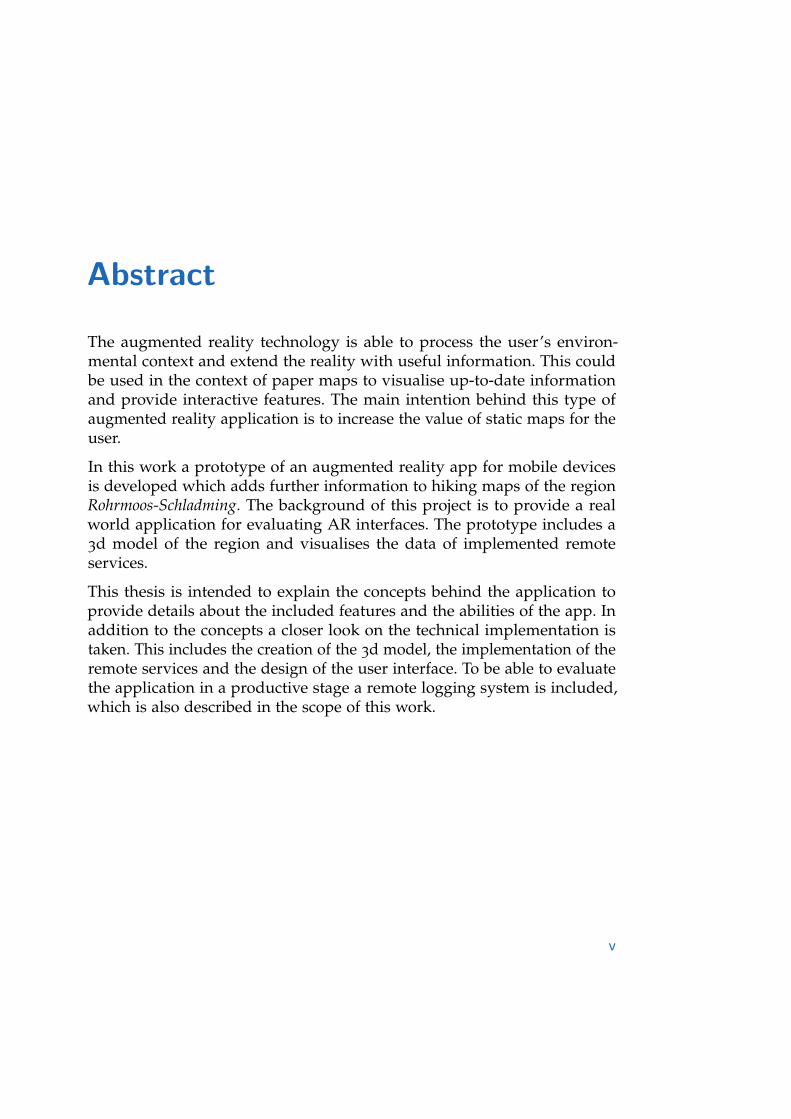
Abstract
The augmented reality technology is able to process the user’s environ-mental context and extend the reality with useful information. This couldbe used in the context of paper maps to visualise up-to-date informationand provide interactive features. The main intention behind this type ofaugmented reality application is to increase the value of static maps for theuser.
In this work a prototype of an augmented reality app for mobile devicesis developed which adds further information to hiking maps of the regionRohrmoos-Schladming. The background of this project is to provide a realworld application for evaluating AR interfaces. The prototype includes a3d model of the region and visualises the data of implemented remoteservices.
This thesis is intended to explain the concepts behind the application toprovide details about the included features and the abilities of the app. Inaddition to the concepts a closer look on the technical implementation istaken. This includes the creation of the 3d model, the implementation of theremote services and the design of the user interface. To be able to evaluatethe application in a productive stage a remote logging system is included,which is also described in the scope of this work.
v


Contents
Abstract v
1 Introduction 11.1 Motivation . . . . . . . . . . . . . . . . . . . . . . . . . . . . . . 1
1.2 Contribution . . . . . . . . . . . . . . . . . . . . . . . . . . . . . 2
1.3 Limitations . . . . . . . . . . . . . . . . . . . . . . . . . . . . . . 3
2 Related Work 52.1 Augmented Reality Applications . . . . . . . . . . . . . . . . . 5
2.2 Augmented Reality Evaluation in the wild . . . . . . . . . . . 7
2.3 Hiking Apps . . . . . . . . . . . . . . . . . . . . . . . . . . . . . 8
2.4 Augmented Reality Frameworks . . . . . . . . . . . . . . . . . 9
3 Concepts 113.1 Features . . . . . . . . . . . . . . . . . . . . . . . . . . . . . . . 11
3.1.1 3D model . . . . . . . . . . . . . . . . . . . . . . . . . . 12
3.2 Landscape Data Aggregation . . . . . . . . . . . . . . . . . . . 13
3.2.1 Data sources . . . . . . . . . . . . . . . . . . . . . . . . . 13
3.3 User Interface . . . . . . . . . . . . . . . . . . . . . . . . . . . . 14
3.3.1 Augmented Reality Interface . . . . . . . . . . . . . . . 15
3.3.2 Virtual Reality Interface . . . . . . . . . . . . . . . . . . 15
3.4 Remote Logging . . . . . . . . . . . . . . . . . . . . . . . . . . . 16
4 Implementation 194.1 Tools . . . . . . . . . . . . . . . . . . . . . . . . . . . . . . . . . 19
4.2 Textured Digital Elevation Model . . . . . . . . . . . . . . . . . 21
4.2.1 Coordinate Systems . . . . . . . . . . . . . . . . . . . . 21
4.2.2 Parsing and Downsampling of Elevation Data . . . . . 22
4.2.3 3D Modelling . . . . . . . . . . . . . . . . . . . . . . . . 23
vii

Contents
4.2.4 Texturing . . . . . . . . . . . . . . . . . . . . . . . . . . 24
4.3 Augmented Reality Scene . . . . . . . . . . . . . . . . . . . . . 25
4.3.1 Calculation of Coordinates . . . . . . . . . . . . . . . . 27
4.4 Implementation of Online Services . . . . . . . . . . . . . . . . 28
4.4.1 Weather layer . . . . . . . . . . . . . . . . . . . . . . . . 29
4.4.2 Tracks layer . . . . . . . . . . . . . . . . . . . . . . . . . 30
4.5 Virtual Reality Interface . . . . . . . . . . . . . . . . . . . . . . 32
4.6 Remote Logging . . . . . . . . . . . . . . . . . . . . . . . . . . . 33
4.6.1 Tracked Data . . . . . . . . . . . . . . . . . . . . . . . . 33
4.6.2 Reports . . . . . . . . . . . . . . . . . . . . . . . . . . . . 34
5 Results 375.1 Performance . . . . . . . . . . . . . . . . . . . . . . . . . . . . . 37
5.1.1 Comparison Lowpoly/Highpoly Meshes . . . . . . . . 38
5.1.2 Static batching . . . . . . . . . . . . . . . . . . . . . . . 38
5.2 Expert Evaluation . . . . . . . . . . . . . . . . . . . . . . . . . . 39
5.3 Challenges . . . . . . . . . . . . . . . . . . . . . . . . . . . . . . 40
6 Conclusion and Further Work 41
Bibliography 43
viii

List of Figures
3.1 Concepts image of the weather layer workflow . . . . . . . . . 14
4.1 WGS84 coordinate system [34] . . . . . . . . . . . . . . . . . . 22
4.2 UTM raster for Europe [37] . . . . . . . . . . . . . . . . . . . . 22
4.3 QGIS measurement of map rotation . . . . . . . . . . . . . . . 25
4.4 Explanation of model offset . . . . . . . . . . . . . . . . . . . . 27
4.5 Screenshot of the weather layer . . . . . . . . . . . . . . . . . . 30
4.6 Screenshot of the hiking tracks layer . . . . . . . . . . . . . . . 31
4.7 Screenshot of a custom Google Analytics report . . . . . . . . 35
4.8 Screenshot of the Google Analytics world view . . . . . . . . 35
ix


List of Tables
2.1 Hiking app overview . . . . . . . . . . . . . . . . . . . . . . . . 8
2.2 AR framework overview . . . . . . . . . . . . . . . . . . . . . . 10
3.1 Possible features divided in categories . . . . . . . . . . . . . . 12
4.1 Used tools . . . . . . . . . . . . . . . . . . . . . . . . . . . . . . 20
4.2 Paper map corner coordinates (UTM) . . . . . . . . . . . . . . 23
4.3 Supported touch gestures . . . . . . . . . . . . . . . . . . . . . 32
4.4 Google analytics event data . . . . . . . . . . . . . . . . . . . . 34
5.1 Lowpoly performance . . . . . . . . . . . . . . . . . . . . . . . 38
5.2 Batching performance . . . . . . . . . . . . . . . . . . . . . . . 39
xi


1 Introduction
Augmented Reality has become a popular application domain for consumeroriented mobile applications (apps) [1]. It is a subdivision of Mixed Reality(MR) - the mixing of computer generated content into real world [2]. Partlythis development comes from the fact, that nowadays smartphones arewidely-used and fast enough for real time image tracking. Many companieshave already discovered the benefits of AR and use it in different applicationareas, like showing additional information in books or playing games in thereal world [3].
This chapter gives an overview of the project’s scope and shows the motiva-tion behind this thesis.
1.1 Motivation
Because this technology is relatively new, much research is done in this areato find new applications and interface types for increasing the benefits ofAugmented Reality. Schladming-Dachstein Tourism Marketing tries to increasethe value of their region and wants to use new technologies to achieve thisgoal.
At the moment there are paper maps of the region Schladming-Rohrmooswhich are positions at selected tourist spots. The maps should give thehikers and bikers an overview of the whole area, so they can plan theirtrails. But there are some problems with paper maps. One of them is thatthe content of the map is static, so the information on the map cannot beupdated and new data cannot be added. So a way must be found to combineup-to-date information with the maps of the region. AR can be used to
1

1 Introduction
make the maps interactive and combine them with additional information[4].
Moreover the paper maps only provides geographic data. But the aimshould be to provide information about different topics which are importantfor hikers like weather forecasts and predefined hiking tracks. Anotherinteresting feature is the integration of social data like finding nearby usersor sharing the walked route.
As one can see in these lines, AR is a field which can work closely togetherwith many other areas of research. So the usage of this technology is veryinteresting but can also be very challenging.
1.2 Contribution
The aim of this bachelor thesis is to create an application for mobile devicesto add additional information to paper maps. The app contains an AR inter-face to work with the maps positioned in the region Schladming-Rohrmoosand moreover a Virtual Reality (VR) interface to use it when there is nopaper map nearby. The higher level target behind this project is to discoverthe benefits of VR and AR interfaces for this kind of application and evaluatethem in a real world environment.
An important feature for hikers is to know about the structure of thelandscape like height the area or difficulty of hiking trails. Therefore a 3Dmodel if the landscape can be projected on the maps. To add additional data,some services are included which can provide important data for hikers.The evaluation of useful and necessary features is done in 3.1.
To evaluate the usage of AR and VR in productive applications, a remotelogging system is implemented. This system tracks all activities which areperformed in the app, without influencing the user experience [5]. With thisinformation, a detailed conclusion can be given about the time spent ARand VR modes and which actions are used very often.
2

1.3 Limitations
1.3 Limitations
Due to the limited time of the project, only a prototype of the app canbe provided. This means that only a limited set of example data servicesare included in the current version of this bachelor thesis. To save timefor more important features not all services are implemented in their finalform, like using offline data instead of a real online service. Moreover theappearance of the app is only rudimentary designed and not ready forrelease. Summing up this is only a prototypical implementation to showSchladming-Dachstein Tourism Marketing the benefits of AR and how a finalproduct can look like.
Moreover user studies which are comparing the AR and the Virtual Realityinterface of this application are not performed because of the limited time.Therefore the interface of the app should be evaluated at a later stage.However, a first usability evaluation has been carried out by a remote expertof the University of Oulu which can be found in 5.2.
Another important topic which is not covered is testing the app on differentplatforms and systems. Because of a limited repertoire of devices, tests canonly be performed on the available smartphones and tablets. AlthoughUnity 3D [6] is used to provided support for different mobile operatingsystems, it cannot be guaranteed to work. The same can be said aboutdifferent screen resolutions, because there is a variety of resolutions whichare used on mobile devices, especially on Android phones [7].
3


2 Related Work
This chapter shows related work in the field of Augmented Reality (AR) toget basic knowledge about the applications of this technology. Furthermoresome results of AR interface evaluations and the comparison to traditionalinterfaces is provided.
2.1 Augmented Reality Applications
Augmented reality is a technique for extending the real world with someadditional virtual information like sound or 3d models. In the last yearsmany different applications have been identified and nowadays it is widelyused. Well-known examples are so-called AR browsers, which make useof labels to visualize points of interest in context of the user’s real worldenvironment on top of the device’s video feed [8]. There are also many otherusages like applications to assist surgeries, educational software or mobilegames [3].
A subcategory of AR is the field of Mobile Augmented Reality (MAR) [9],which covers applications on mobile devices like smartphones or head-mounted displays (HMD). The app which is developed as a part of thisthesis belongs to this category. Like the general AR technique, MAR couldalso be used in a variety of application contexts. As mentioned before, somemobile games already take advantage of this technology and become verypopular. MAR can also be used in education as an extension to traditionalbooks for adding some additional information collected in the web orprovided by the publisher [9]. Another useful category is software, whichprovides extended data to physical maps. This is the research field which
5

2 Related Work
is covered in this work. Therefore some related workings in this scope arepresented in this section.
Tunnel Vision App [10]. This app provides data from a variety of sourcesand presents it on the Metropolitan Transportation Authority subway mapwhich is ubiquitous throughout New York. A big advantage of this appis the distribution of the map in the whole city, which leads to a widepotential user base. So people waiting for busses or subways can use it getsome interesting facts about the area where they are located. The displayeddata includes up-to-date information about the subway and US census data(average income, average rent etc.).
Paper Map Visualization [11]. Adithya et al provide in their paper a solutionfor displaying a 3D digital elevation model (DEM) on a physical map. Theapproach of this paper is similar to the concepts used in the hiking mapprototype described the next chapters, but the contextual focus is on militarymaps for operation plans. According to Adithya et al paper maps do notalways provide the needed level of detail and realism of the area. Thereforea DEM is used to enhance the map with clearer height information. Themap is split into several parts to provide the ability of showing only a partof the map in 3D. To show the DEM of a specific region, a marker has to bemoved on the chosen area of the map and subsequently the model is shownabove the marker.
MapLens. This is an application for phones with Symbian OS by Morrison etal [12] which is used to evaluate the usage of AR in combination with maps.Due to the academic background of this app it only provides the featureof displaying location-references images on the map, because this action isused in the evaluation.
Augmented transit maps [13]. Stroila et al show a way to augment the userexperience in public transport locations and vehicles. The transit maps areextended with the ability to select stations and the ability to calculate theremaining time until the arrival at the destination. According to them thisapp could also be used as an advertising platform.
Time-wARpXplorer [14]. This location based AR game by Lochrie et al isdeveloped to raise awareness of historic sites in Lancaster. Standing in frontof a site the user can augment the reality with some historic photographs.
6

2.2 Augmented Reality Evaluation in the wild
Moreover an achievement for the visited location is unlocked and the playcan take and upload their own photos. The app is not only designed forlocals, but also for visitors to explore the city.
2.2 Augmented Reality Evaluation in the wild
There are some papers which evaluate AR interfaces and compare themto traditional user interfaces like simple zoom able views. The result ofthem is that the AR mode is used to get a short overview of the setting andgain additional information which depends on the context of the user. Fordisplaying detailed data and static data, which does not necessary need thecontext information, traditional interfaces are preferred by many users.
Grubert, Grasset and Reitmayr showed in their evaluation of an AR app forevent posters, that people feel uncomfortable when the AR interface is usedfor an extended period of time. In their second case study, which evaluatesthe usability of an AR interface in a gaming context, more participantsused the AR interface. However, this behaviour could occur because of thenovelty of the technology. There are two main reasons for switching fromAR to VR mode. Firstly the users get impatient and switch modes if thetracking of game poster does not work. And a second reason is, that someusers do not want to walk closer to the poster to identify small icons. [15].
In a detailed evaluation paper of AR interfaces in combination with gameposters, error rate and task completion time of AR and VR mode are com-pared. The result is, that there are no significant differences in performance.The slightly higher time to complete in AR mode can be due to trackingissues which also explains the higher standard deviation. Moreover thereactions of people walking by are logged and evaluated. The findings ofthe recordings are that 68% of them are not noticing the participants, theposter and the recording equipment at all. [16]
As already mentioned before Morrison et al evaluated the AR interface ofthe app MapLens which is developed by themselves. The app is developedfor Nokia feature phones running on Symbian OS S60 which implies thatthese phones do not provide any touch interaction. A second application
7

2 Related Work
named DigiMap was developed which provides a digital map (VR) with thesame information as MapLens. The participants of the evaluation were askedto take part in a treasure hunt game with different predefined instructionswhere they had to take and upload photos of themselves performing thetasks. When comparing the pictures taken with in VR and AR apps, theVR users uploaded more non-task-related photos which indicates thatthey are more oriented to their surrounding environment. The analysisof the results also shows more accurate reports from the AR users. Ifaggregating the results into one statement, the AR interface leads to a betterconcentration onto the game tasks. By contrast the digital map invites toa higher environmental awareness. This states that the purpose of the appshould be considered when choosing an interface type. [12]
2.3 Hiking Apps
In this section some popular mobile hiking apps are shown to get knowledgeabout the features provided by similar apps. All of them are available inthe Google Play Store and the rating is based on the value of July 2014.The following table lists only a representative part of all evaluated apps,but enough for presenting the most common feature in the field of hikingapplications.
App Rating Price[e]alpenvereinaktiv.com [17] 4.3 freeMaverick Pro [18] 4.3 4.99
Wanderkarte Osterreich [19] 3.0 freeAlpineQuest GPS Hiking [20] 4.6 6.99
apemap Outdoor und Wander- Navigation [21] 4.2 free (Pro: 19.99)
Table 2.1: Hiking app overview
alpenvereinaktiv.com provides different types of tracks like skiing-, hiking-and climbing-tracks including elevation profile. According to user feedbackthe interface is well-structured and has a very high usability. The high-light of this app is the integrated navigation which is only provided byalpenvereinaktiv.com.
8

2.4 Augmented Reality Frameworks
Maverick Pro is an app which includes map from many different sourceslike Open Street Maps, Bing and some regional data sources. The mapsare automatically cached for offline usage so it can also be used in realhiking situations with unstable network connections. Key features are trackrecording and the possibility to create way points and export them.
The app Wanderkarte Osterreich is mainly used to record tracks and showsome statistical data like speed, duration and distance. The rating is averagebecause of the missing zoom functionality for maps.
AlpineQuest GPS Hiking is the best rated app in the provided list. Moreoverit provides the largest amount of features and can be used for a variety ofoutdoor activities. Like in Maverick Pro different map sources are integratedand they support extending them with different layers (POI, tracks etc.).Own tracks can be recorded and shared with friends. The app is highlyrated because there are hardly ever crashed and the interface is easy touse.
apemap Outdoor und Wander- Navigation is the only app with a 3d view ofthe maps. Many tracks (mainly located in Austria, Germany and Switzer-land) are available for downloading. A desktop application can be used tocreate custom tracks and transfer offline maps to the smartphone. Points ofcriticism are the high price for fee-based maps and the complexity of theuser interface.
2.4 Augmented Reality Frameworks
The aim of this section is to give a short overview of AR frameworks whichsupport mobile devices. Due to the large number of frameworks only someimportant ones are presented.
ARToolkit supports two different licenses. Older versions are available underthe GPL license and the newer ones can only be used with a commerciallicense. The core is written in C and C++, but there are several 3rd partywrappers to use ARToolkit with other programming languages.
9

2 Related Work
Framework Platforms LicenseARToolkit [22] iOS, Android, Unity
Cross Platformfree, commercial op-tion
DroidAR [23] Android GPLv3
Metaio SDK [24] iOS, Android, Unity,Web
free, commercial op-tion
Qualcomm Vuforia [25] iOS, Android, UnityCross Platform
free, commercial op-tion
Total Immersion AR Engine [26] iOS, Android, Web commercialWikitude SDK [27] iOS, Android, Smart
Glassesfree, commercial op-tion
Table 2.2: AR framework overview
DroidAR. This framework is only designed for being used in Android apps,therefore the area of application is very limited. But the source code of thewhole project is available, so the functionality can be reviewed, bugs areable to be fixed and new features can be implemented. Marker-based andlocation-based AR are supported.
Metaio SDK supports a broad range of platforms including HMDs and theWeb. It integrates very well into Unity 3D and provides an easy to use SDK.This framework is able to track 2D and 3D targets and QR codes.
Qualcomm Vuforia provides support for many different platforms due tothe very good integration into Unity 3D. This framework also includes theability to track some different types of targets like image targets, cubictargets, or frame markers.
Total Immersion AR Engine. This is the only framework in the list which exclu-sively provides a commercial license. It provides support for many platformsnative applications for mobile devices and desktops or web applications.
Wikitude SDK supports apps for iOS, Android and Smart Glasses. Two bigadvantages of Wikitude are the big number of developers working with thistool and the easiness to use. Due to these reasons many tutorials exist andpeople new to it have a relatively steep learning curve.
10

3 Concepts
In this chapter a closer look is given the features which are included in theprototype and how they are planned to be implemented.
3.1 Features
To create an app which provides additional benefit to physical maps, someresearch has to be done to identify useful features. There is only one featurethat is explicitly asked by Schladming, which is the paper map augmentationwith the 3D model of the region. The landscape model itself does mostlyprovide geographic data to hikers, so there should be additional serviceswhich are helpful prior to and during hiking trips.
There are several ways to get ideas for possible functionality in an appli-cation. In this work two of them are used to get feature suggestions. Thefeatures are then classified into three areas - public data, personal data andsocial data.
First of all an informal survey within friends and relatives has been done.This process provided some interesting suggestions which are collected anddivided into the three categories. Afterwards ideas which are technicallynot possible to implement or do not correlate with the planned way the appis working are sorted out.
In the second step the list of suggested features is compared with function-ality which is provided by popular similar apps. To get this informationdifferent popular hiking apps in the Google Play Store are examined theget a look over highly rated features based on the used comments. Aftercombining all ideas there is an array of possible features, which can be used
11

3 Concepts
in development. A subset with very helpful suggestions can be found intable 3.1.
Public data Personal data Social dataWeather warnings Current location Share visited places
on social mediaCurrent weather Track recording See other people in
current areaShow images of area Mark visited loca-
tionsSunrise and sunsettimesHiking tracksHiking hutsNames of mountains,lakes and cities on topof 3D model
Table 3.1: Possible features divided in categories
Due to the prototype approach of this application only a limited set offeatures should be included within the scope of this work. Therefore thelist of possible features is mainly called into action in further work afterfinishing the prototype.
Social and personal data are excluded from being implemented in thisversion, because they mostly need some infrastructure to store the datawhich is generated when using the app. And these implementations wouldexceed the scope of this work. The decision on which public data features toinclude in the prototype fell on the current weather and the hiking tracks.
3.1.1 3D model
The only feature that was already planned when the work was started isthe 3D model overlay. This should give the user a plastic presentation ofthe region. Due to the usage on mobile devices there are a few special
12

3.2 Landscape Data Aggregation
requirements and limitations that are important in the implementationprocess.
First of all the resolution of the model cannot be very high because of thelower computing power compared to desktop computers. Therefore somedownsampling of the data has to be done before using it in a 3D scene. AsKlein et al showed in their work [28] the number of mesh polygons can oftenbe reduced at a high percentage without losing very much information.
Another point to consider is that the paper maps are deployed vertically,which implicates that the 3D model is mostly seen from the top. In sucha view vertical model features are hardly visible. To overcome this issuevertical exaggeration can be done. This means that the vertical features arehighlighted by stretching the model in the z-axis. [29, Chapter 2]
3.2 Landscape Data Aggregation
The creation of the 3D landscape model, which is described in the previouschapter, is a very complex task. The biggest challenge is the unification ofdifferent data formats, coordinate systems and reference units. A very goodintroduction into the landscape model creation is given by Petersen et al inthe book Fundamentals of Physical Geography[29].
According to them the creation process of the model consists of threetasks. First of all an digital elevation model (DEM) of the region has to begenerated. The second task is to get some georeferenced satellite imageswhich can be layed over the model. And the last step is combining these twoto get a textured 3D landscape model of the region Rohrmoos-Schladming.
3.2.1 Data sources
The required data is not accessible for all regions in the world. But in manycountries there are some governmental institutions or geographic instututeswhich do the measuring of the regions. For the region of this work theresponsible institute is GIS Steiermark, which does airborne laser scanning
13

3 Concepts
Figure 3.1: Concepts image of the weather layer workflow
(ALS) measurements for the whole state of Styria. Moreover they providehigh resolution orthographic images which are usable by this application.
3.3 User Interface
The user interface is a very important part in the development process of amobile app. In most cases the first impression is essential for the decisionif a user starts the app a second time, because workflow issues or a badusability are far worse than missing features.
To provide a useful interface a layered approach is chosen. This means thateach feature can be enabled in a separate layer and does not effect otherfeatures. When considering the previous concepts we get a total of threelayers - landscape model layer, weather layer and tracks layer. A conceptionallayer can be found on figure 3.1.
The big advantage of the separate layer for each feature is the independenceof work. If one layer produces an error or does accidentally effect otherlayers this part can be deactivated easily. This way the workflow could beinterrupted for a few seconds, but there is an easy way to continue withoutthe earlier problems.
14

3.3 User Interface
3.3.1 Augmented Reality Interface
The AR interface should be the default user interface when starting theapplication. It is supposed to give additional value to the paper maps whenstanding directly in front of them. The biggest advantage of this type ofinterface compared to a VR interface is the ability to point the device toa map location and the app immediately shows content of the selectedlocation.
If the paper map gets tracked on the video feed of the device, the 3dlandscape model should be displayed above the map. So the user can betterdecide, which hiking tracks are suitable to his skills.
The additional layers which are mentioned in 3.1 should be shown eitherabove the landscape model if it is enabled or directly on the map otherwise.If the 3d is disabled a tracking border should be displayed around the papermap to make clear if the map is tracked at the moment.
3.3.2 Virtual Reality Interface
The AR interface is a great addition to the paper maps which are deployedat public places in the region Rohrmoos-Schladming. But what if the userwants to get information and there is no map nearby? Or what if the user isin front of the map, but it is already dark and the map cannot be tracked?For this case there has to be another interface which can be used everywhereand everytime. To overcome this issue a VR mode of the interface should beimplemented.
This mode should implement the same functionality as the AR mode. Theaim is that the VR view could be navigated by touch gestures, becausesmartphone users are used to this type of input. According to Yee [30] amain target when implementing touch gestures is, that the learning curveshould be minimized. Especially older users, who are not always familiarwith touch input, should be able to use the specified with ease. Moreoverthe gestures have to be easily distinctable, because very similar interactioncannot be recognised with a high accuracy. This means that similar gestureslead to a higher failure rate.
15

3 Concepts
After considering these limitations dragging, pinching and swiping gesturesare used. To keep them easy there are not more than two fingers which haveto be used.
In outdoor scenarios touch gestures are not always very intuitive in usage.Especially when fingers are stiff and cold the navigation is not as easyas it should be. To avoid such cases a secondary navigation interface isimplemented, which do not use touch gestures. In a comparison betweensoft buttons and touch gestures Bragdon et al [31] figured out, that thereare no big differences in performance and accuracy.
To provide an interface with the same abilities as the touch gestures, thereare buttons enable the same functionality as dragging, pinching and swiping.Additionally a button which resets the camera to the default view is addedto the interface.
3.4 Remote Logging
In order to have a view on the feature usage after the app release, a remotelogging system should be implemented. This means that different actionsare tracked and sent to a tracking provider, which aggregates the data.
The biggest advantage of logging event data is the possibility to identifythe popularity of features. This could help improving the user interface orextending the functionality of the app in later versions.
To track events even if the network connection is interrupted an offline cacheshould be implemented. If the network is not available the data is stored ina temporary cache file. At the next app startup each event in the cache isresent and is included in the next data analysis.
To provide the previously mentioned information some data has to berecorded and sent to the tracking provider. A detailed list of which datashould be able to figured out with logging is provided in the followinglist.
• Time spent in application• Time spent in AR/VR
16

3.4 Remote Logging
• Time spent with features activated• Number of application startups• Number of AR/VR mode switches
In order to get these information an event must be sent at every activa-tion/deactivation of a feature. Moreover the switch between AR and VRmode should be logged. Each event does not only include the new stateof the mode or feature, it also contains the time spent since the last corre-sponding event.
17


4 Implementation
One of the main topics of this work is the implementation of the prototype.This chapter covers the complete process starting with the finding of theright tools to work and ending with the programming of the features.
Some information is given about the conversion, interpolation and pro-cessing of the geographic data. The implementation of different services isshown by the examples of weather and hiking tracks. Due to the reason thatthe paper maps are not always available when using the app, a VR interfaceis added to use the software also during hiking trips. To evaluate the usageof the app, a remote logging system is included. This enables the possibilityto create reports about time spend in different modes and the number ofperformed tasks.
4.1 Tools
To start with the implementation of the app the right tools have to be found.This section provides a small overview of all used tools and how whichfeature they are providing.
3DEM. This tool is able to visualise terrains out of a variety of data formats.On the other side the 3D images can be exported in different file formats,so it can be used to convert geographic data files. Sadly the development isnot continued any more, but the author has given his permission to releasethe tool for free.
QGIS. With this software maps with many layers can be created and viewed.The layers can consist of raster or vector data in different formats. More-
19

4 Implementation
Tool Category3DEM [32] Terrain VisualisationQGIS Geographic Information SystemMeshLab Mesh Processing3DS Max 3D Computer GraphicsUnity3D Game Creation SystemVisual Studio 2013 Development EnvironmentPaint.net Raster Graphics Editor
Table 4.1: Used tools
over it is possible to do measurements of the maps to get the geographiccoordinates of points on the map.
With MeshLab it is possible to create 3D meshes out of files in many differentdata formats. Exporting is also possible in a variety of common formats. Sothis tool is suitable to create the models out of data files and export them todo the processing in 3DS Max.
3DS Max. This software is able to do professional 3D modelling, animations,simulations and rendering.
Unity3D is a commercial game creation software. It can be used to createcomplex game scenes and provides some integrated assets like lights orsimple primitive meshes. Furthermore this software is particularly suitablefor creating AR application because of the good integration of QualcommVuforia.
Visual Studio 2013 is a commercial integrated development environmentto create applications in different programming languages (mainly basedon the .NET framework). It comes with extensive debugging abilities andsupports the inclusion of plug-ins.
Paint.NET is an open source tool for creating and editing raster images. Dueto the big community, there are many plug-ins which extend the softwarewith new features and image filters. So Paint.NET is a really powerful toolto do simple image processing.
20

4.2 Textured Digital Elevation Model
4.2 Textured Digital Elevation Model
The first feature which is included in the app is the ability to project a 3Dmodel of the landscape onto the paper map. This gives hikers the informa-tion to plan hiking trails which are not to difficult but hard enough for theirskills. Traditional maps can also give rudimentary height information, butthe are less intuitive than 3D models. The readers of 3D maps can easilyvisualise elevation differences and topographic features [33].
To create a 3D model of the given elevation data, there are some processingsteps which are described in the next subsections.
4.2.1 Coordinate Systems
There are many common coordinate systems which can be used to georefer-ence 3D models. In this work two different system are used for creating themodels, get data from webservices and create the connections between 3Dand 2D map.
World Geodetic System of 1984 (WGS84). WGS84 is a geodetic datum, whichdescribes a set of constants for calculating coordinates of points on the earth.This system is the reference system for GPS positioning information. For thisreason it is the most widely used global reference system. The position isdescribed in degrees, minutes and seconds for longitude (east-west position)and latitude (north-south position) [34]. How the world is divided intodegrees can be seen on figure 4.1.
Universal Transverse Mercator (UTM). In contrast with WGS84 the UTMsystem is a plane, rectangular coordinate system. It covers the area from 84
degrees north to 80 degrees south and divides it into 60 zones, each with asize of 6 degrees longitude [35]. An example of the raster used for UTM canbe found on figure 4.2.
In prototype developed for this work, UTM is used as the reference system,because the elevation data in processed in this way. But due to the reasonthat other data is referenced in WGS84 coordinates, a conversion betweenthem is necessary. The steps which have to be done to translate WGS84 to
21

4 Implementation
UTM and vice versa is shown by Rino Ciancaglini [36]. When convertingWGS84 longitude/latitude coordinates to UTM the first step is to calculatethe zone of the location, which is divided in a longitude and a latitudepart (e. g. 33N). The final step is the calculation of the northing and eastingvalues, which provide the location within the zone borders.
Figure 4.1: WGS84 coordinatesystem [34] Figure 4.2: UTM raster for Eu-
rope [37]
4.2.2 Parsing and Downsampling of Elevation Data
The edge coordinates of the provided map of Schladming-Rohrmoos arelocated in zone 33 of the UTM system. So the data of this area is neededto create the 3D model of the landscape. The data which is made availableby GIS-Steiermark has a resolution of one data point per meter and can bedownloaded as in HGT format. The HGT format includes binary encodedelevation data of a specified area. To convert the data into a plain text file,the tool 3DEM can be used.
For doing the conversion the HGT-File has to be imported into 3DEM.Then the topology of the area is visualised. Then the visualisation can beexported into a plain text elevation data file. In addition a HDR metadatafile is generated which includes the coordinate system (which is UTM inthis case), the coordinates of the map corners, the number of rows andcolumns and some more information. Due to the fact that the TXT file only
22

4.2 Textured Digital Elevation Model
contains height values, a parser is written to convert the data into a XYZpoint cloud.
For each point which is processed, the parser determines if the point isinside the bounds of the paper map. The coordinates of the map cornerscan be found in table 4.2. To test if a point is inside the bounds, checks areperformed if the coordinates are on the correct side of every edge. The checkfunction uses the following formula which takes advantage of vector crossproducts where v1 is the vector from corner c1 to corner c2, vi the cornerfrom c1 to a point inside the map bounds and vt the vector from c1 to thepoint to test [38].
~v1 × ~vi ∗ ~v1 × ~vt ≥ 0 (4.1)
If the condition returns true for each edge, the point is inside our region ofinterest.
The resulting xyz file has about 350000 data points, which is too detailedfor a mobile app. To get a proper resolution, some data points are removed.This results in a file with about 30000 points, which is a shrinkage of over90%.
Corner Easting NorthingTop Left 412367 5234801
Top Right 392928 5235122
Bottom Left 412613 5251347
Bottom Right 393229 5251668
Table 4.2: Paper map corner coordinates (UTM)
4.2.3 3D Modelling
At this point the data is processed in a way to easily generate a 3D modelout of the xyz file. As a first step the tool MeshLab is used to create the mesh.After replacing the ending of the xyz file by .asc, it can be imported intothe tool. The given xyz data is not organised, which means that there is noindication of which side is the outside of the surface. Therefore normalshave to be calculated to get a first approximation of the surface [39]. This
23

4 Implementation
calculation can be done with MeshLab (Filters -¿ Normals, Curvatures andOrientation -¿ Compute normals for point sets).
The next step is the reconstruction of the surface based on the estimationcalculated in the step before. The algorithm used in this work is the ball-pivot [40], which delivers good results in this case. No manual calculationshave to be done, because ball-pivot is a built-in algorithm in MeshLab. Afterthis step the raw digital elevation model can be exported as a Collada fileand is ready for usage in a 3D scene.
4.2.4 Texturing
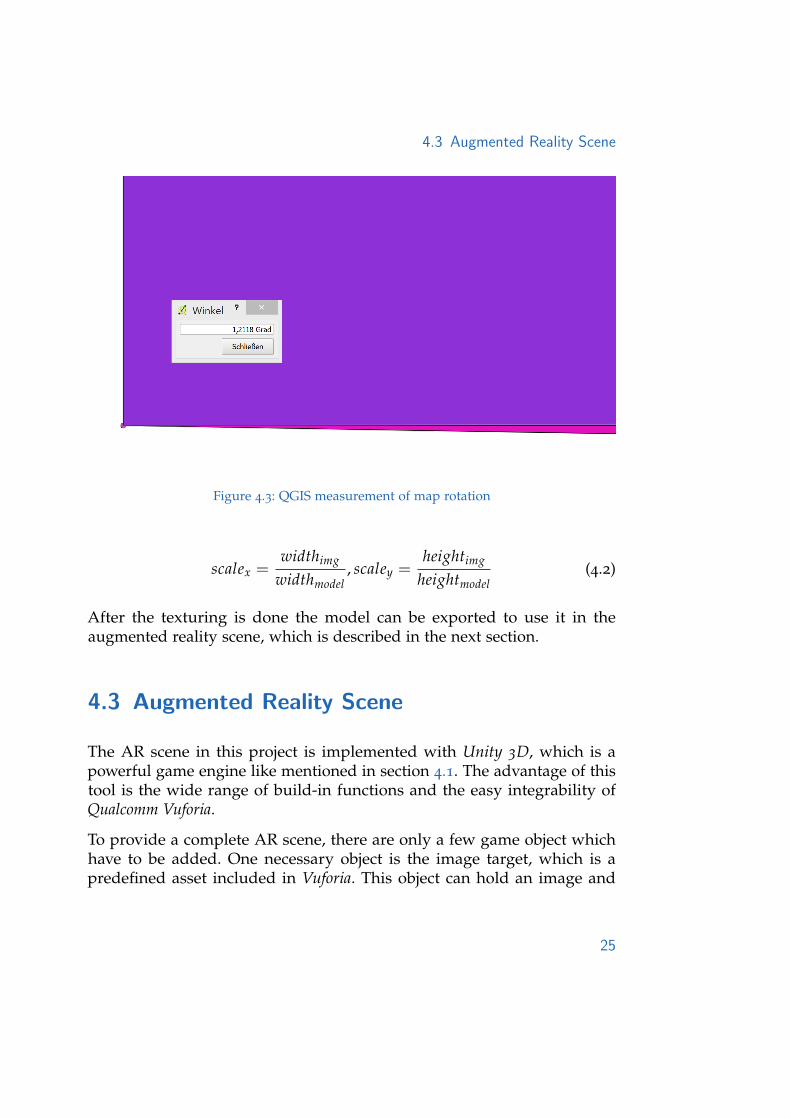
To create a more realistic model of the landscape the mesh has to be textured.This is done with orthographic images (orthophotos) of the region, whichcan be obtained from GIS-Steiermark. The WGS84 coordinates of the aredelivered with the images, so they can be cut to fit the region of the papermap. Now the bounds of the images correlate with the model bounds, butthere is an inconsistency in the rotation, because of the different referencecoordinates systems of images and elevation data. To correct them therotation of the images to the model has to be measured. The tool QGIScan provide this information. Two raster layers have to be created, the firstone with the coordinates of the model and the second one with the imagecoordinates. In QGIS there is a function to manually measure angles betweentwo shapes. This leads to a value of 1.2118 degrees.
The texturing itself is done with 3DS Max, a tool for 3D modelling. Thenext step to perform this task is to import the created Collada file. Theimported model now has to be linked with the orthographic images, this isdone with an UV map. [41, Chapter 3] Before the linking can be done, thescaling, rotation and offset of the texture has to be set. For the rotation the1.217 degrees, which has been measured in the last step, can be used. Thescaling values are needed, because of the different sizes of the texture andthe model in the internal coordinate system of 3DS Max. Following formulais used for calculation:
24
4.3 Augmented Reality Scene
Figure 4.3: QGIS measurement of map rotation
scalex =widthimg
widthmodel, scaley =
heightimg
heightmodel(4.2)
After the texturing is done the model can be exported to use it in theaugmented reality scene, which is described in the next section.
4.3 Augmented Reality Scene
The AR scene in this project is implemented with Unity 3D, which is apowerful game engine like mentioned in section 4.1. The advantage of thistool is the wide range of build-in functions and the easy integrability ofQualcomm Vuforia.
To provide a complete AR scene, there are only a few game object whichhave to be added. One necessary object is the image target, which is apredefined asset included in Vuforia. This object can hold an image and
25

4 Implementation
raises events if the defined image is found or lost on the camera view. Somescripts are created to handle those events and show or hide the objectsin the AR scene. In this project all general purpose scripts like static datastorages or scripts for showing the menu are attached to this game object,because this object is supposed to be active during the whole applicationlife cycle. Only scripts of active objects are executed automatically [42]. Thesecond mandatory game object for AR scenes out of the Vuforia packageis the AR camera. This object replaces the default camera and handles theimage tracking.
To create a natural look of the landscape a directional light is used toilluminate the scene. This kind of light acts like the sun which means that itradiates in parallel lines in the given direction [43].
The last game object which has to be included is the 3d model itself. It isadded as a child of the image target, because if the target gets tracked allchildren are shown and the other way round.
There are also some UI elements which are drawn on the screen. In the basicview four buttons on the left side of the screen are implemented to interactwith the application. At first there is a button to switch between AR and VRmode. The process of the switching is explained in section 4.5. The threeremaining buttons enable or disable the layers 3D (show/hide 3D model),weather and GPS tracks.
To build a generic solutions which easily allows to add extensions which aretriggered on button clicks the design pattern Observer [44] is implemented.A subject class contains properties with the boolean values indicating thecurrent state of the layers. Observer classes are able to register to these eventsand get notified if a value changes. If a new action should be performed onbutton click, only a new observer class has to be created which executes thefunctions.
The functionality to disable the 3D model is an important feature to geta short overview of the data point locations. This is especially importantfor the GPS track layer where the exact positions has to be known. Thisinformation is hardly available on the 3d mesh.
26

4.3 Augmented Reality Scene
Figure 4.4: Explanation of model offset
4.3.1 Calculation of Coordinates
The placement of the directional light in (0,0) is very easy, because if thelighting properties are set properly small deviations do not affect the resultin a noticeable way. In contrast the calculation of the image target and 3dmodel coordinates is slightly more complicated.
The left upper corner of the map has to be at (0,0) because the whole ARscene is aligned to this point. Moving a model without any rotation into thecoordinate origin is easy because the x and y movement is just the half sidelength of the model. But the model in this case is rotated by 1.12 degrees, sosome angle calculations have to be done.
Figure 4.4 explains the setup and it shows why the scene would be inaccuratewithout the calculations. To get the correct movement following steps haveto be performed:
β = cotan(yx) (4.3)
First of all the β angle must be calculated because we do have a rectangle
27

4 Implementation
rather than a square where the angle would be 45 degrees.
r =√
x2 ∗ y2
2(4.4)
x′ = r ∗ cos(α + β) (4.5)
y′ = r ∗ sin(α + β) (4.6)
After these calculations the movement can be obtained by A′ = (x′|y′).
4.4 Implementation of Online Services
The feature which provides the most information to the users is the integra-tion of several online services. Like explained in section 3.1 there are manydifferent kinds of services which can be included. To show the abilities ofthis feature, two of them are included in the current version of the prototype.First of all an additional layer with weather information is added which canbe enabled or disabled. The second one is the integration of GPS tracks. Thislayer is only a stub for a later integration of real online data. The details ofthe implementation are provided in the section of this service.
As mentioned in the previous section the GUI is based on an Observer [44]model. This makes it easy to extend UI actions by only registering newhandlers to them.
A big problem when developing for mobile devices is the unstable networkconnection. In the specific case of this thesis this problem becomes even moreserious because network interruptions occur more often in mountainousregions like Schladming. For this reason extended error handling has to bedone to prevent crashes.
An important aspect of modern mobile applications is a good interactionperformance. If this point is not considered in development users do notcome back and use this app because competition might be only a few clicksaway.[45] This means that the interface should not get stuck after triggeringa time consuming action. Network interaction can be a very time consuming
28

4.4 Implementation of Online Services
action, especially when there is a slow network connection like it can occurin Schladming. To load the data from the providing servers a concurrentapproach is used. Networking actions are started in a separate task whichruns outside the GUI task. The data is not shown until the whole loadingprocess is done.
4.4.1 Weather layer
An important service for hikers is gathering the current weather data in thehiking area. With this information users can decide early if the weather isgood enough to start their trip.
This feature is implemented by adding an additional layer with the dataprovided by the forecast.io API. This provider aggregates data gather fromdifferent weather source around the world. Moreover forecast.io [46] is able todo forecasts for specific locations. Several other weather services like ZAMGwere tried but they deliver the same data for the whole area of Schladming.forecast.io is able to provide different data for different location because theyinterpolate between their data points. This is necessary because more thanone distributed weather point should be displayed on the layer.
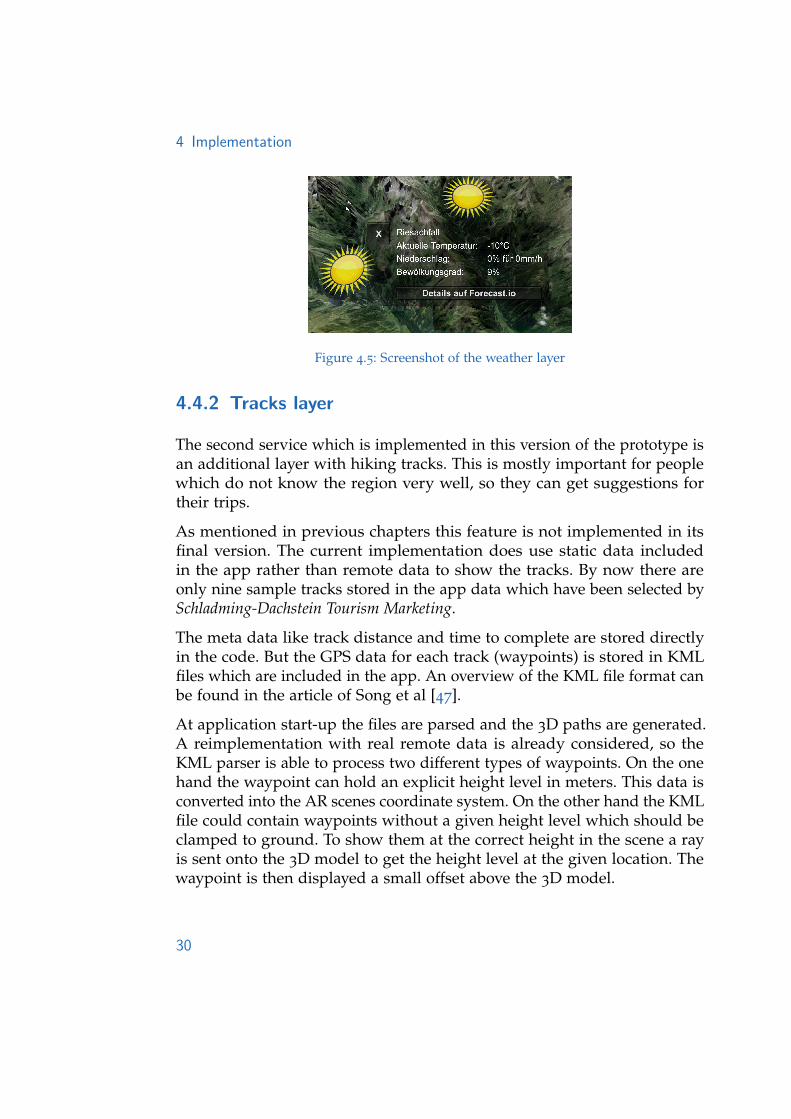
In order to provide evenly distributed locations three popular places werechosen - Schladming, Eschachalm and Riesachfall. Weather icons are shown atthese three positions some pixels beyond the 3D model. The icon appearancechanges depending on the incoming data and can show sunny, rainy, snowyand cloudy weather.
When touching the weather icons a windows appears and displays thecurrent weather situation at the given location. This includes temperature,precipitation and cloudage. If someone is interested in a forecast there isa link to forecast.io where future data can be obtained. An example of theweather layer is provided in figure 4.5
29
4 Implementation
Figure 4.5: Screenshot of the weather layer
4.4.2 Tracks layer
The second service which is implemented in this version of the prototype isan additional layer with hiking tracks. This is mostly important for peoplewhich do not know the region very well, so they can get suggestions fortheir trips.
As mentioned in previous chapters this feature is not implemented in itsfinal version. The current implementation does use static data includedin the app rather than remote data to show the tracks. By now there areonly nine sample tracks stored in the app data which have been selected bySchladming-Dachstein Tourism Marketing.
The meta data like track distance and time to complete are stored directlyin the code. But the GPS data for each track (waypoints) is stored in KMLfiles which are included in the app. An overview of the KML file format canbe found in the article of Song et al [47].
At application start-up the files are parsed and the 3D paths are generated.A reimplementation with real remote data is already considered, so theKML parser is able to process two different types of waypoints. On the onehand the waypoint can hold an explicit height level in meters. This data isconverted into the AR scenes coordinate system. On the other hand the KMLfile could contain waypoints without a given height level which should beclamped to ground. To show them at the correct height in the scene a rayis sent onto the 3D model to get the height level at the given location. Thewaypoint is then displayed a small offset above the 3D model.
30

4.4 Implementation of Online Services
Figure 4.6: Screenshot of the hiking tracks layer
A very challenging part with Unity3D is the creation of clickable pathsbecause there is no built in game object to represent such elements. To get aclickable path in the AR scene the track consists of cubes which are stretchedand rotation to fit the directions of the way.
The tracks are classified into three categories - easy, medium and heavytracks. Each category can be enabled and disabled in an expandable GUImenu.
To keep performance high there are two optimisation which are done duringthe loading process. Firstly the number of waypoints in a track is limitedto 100 points. If there are more points included in the KML file, points areskipped to meet the limit.
The other optimisation is static batching, which is done during the creationof the game objects. Static batching means that game objects with the sametexture can be treated as one object. Due to the reason that all cubes ina track have the same texture they can be combined to one. This reducesthe number of drawing calls per cycle from about 100 to one. An extendedperformance evaluation is done in section 5.1.2.
Like on the weather layer the tracks implement an event handler for touchinteraction. When clicking them a detail window is displayed and showsdetailed information about the selected track. The information includes thename of the track, the stored meta information and a button which links tomore details on the website of Schladming. An example of the tracks layercan be found on figure 4.6.
31

4 Implementation
4.5 Virtual Reality Interface
A very important point for mobile application is the availability everytimeand everywhere. This issue cannot be solved with only providing an ARinterface. Therefore a VR interface is included which has the same abilitiesas the AR scene.
In the GUI a button is display to switch between the two interfaces. Afterswitching additional elements are displayed in the upper right area of thescreen. There are buttons for moving, zooming, tilting and resetting theview.
But this interface also provides touch gestures for interaction. The gesturesare selected with as less as possible fingers needed, because the more fingersare used the more inaccurate it gets. [48] A list of supported touch gesturesis shown in table 4.3.
Interaction Type GesturePan One-finger movingZoom Two-finger pinchingTilt Two-finger dragging (up &
down)
Table 4.3: Supported touch gestures
The moving speed correlates with the current camera position. This meansthat the moving speed increases with the distance between camera and 3Dmodel.
distance f actor = zc/zd (4.7)
xm = δx ∗ speed f actor ∗ distance f actor (4.8)
ym = δy ∗ speed f actor ∗ distance f actor (4.9)
zc is the current z location of the camera and zd is the default location, whichleads to a moving speedup at higher distances. The speedfactor is set to 6
because it gives the most natural feeling with this value.
32

4.6 Remote Logging
The second gesture - zooming - is implemented by only changing the zposition of the VR camera. For tilting, which is the third gesture, the VRcamera is rotated around the x axis.
4.6 Remote Logging
An important aspect in app development is an evaluation of the featureusage. There are a few key question which have to be answered to get ameaningful result.
• How often are the features being used?• In which context are the features being used?• How long are the features being used?• In which way are the features being used?
Understanding these results helps to improve future versions of the app ina reasonable way. If interpreted right this data can help to focus on the mostpopular features and improve them for a better app experience. [49]
The necessary information cannot be obtained during development or whenevaluating the app with a few users. Therefore a logging system has to beimplemented to get the usage data of productive users. There are someremote logging providers which can be used for free. In this prototypeGoogle Analytics is used, because it provides an easy to access API and thereare already finished solutions for an integration into Unity3D.
To meet the requirements of an outdoor application an offline cache forlogging is implemented. If there is no network connection present, the logsare saved in a temporary cache file on the device. On the next startup theapp loops over the logs and tries to resend them. If there is no presentnetwork connection too, the logs stay in the cache file.
4.6.1 Tracked Data
The Google Analytics API consists of a HTTP service where the data has tobe passed in the request parameters. At every application start a unique
33

4 Implementation
identifier is generated. This identifier is used to relate each event to the sameapplication cycle. Due to the reason that the identifier is generated at everystartup there is no way to reconstruct the user which uses the application.Therefore no privacy issues can occur.
For storing the identifier the screen name is used, a predefined parameterwhich is not used otherwise in our application. It is used for purposes otherthan intended, but this way there was no need to define a custom parameterand rewrite the API class.
Google Analytics provides three different event parameters which are takento store the event data - event category, event action and event label. Table4.4 shows the usage of the three parameters. A small example can explainthe data in detail: A person uses the app in a session with id 1234 andhas the ”vr” mode turned on. Now the weather button is clicked whichenables the weather layer. This triggers the remote logging. In this examplethe screen name gets the value 1234, event category is vr because this modeis used at the moment. The parameter event action gets the value ”weather”because this action is triggered and the event label is ”on” due to enablingthe layer.
Parameter name Stored dataScreen name Session identifierEvent category current mode (AR/VR)Event action performed actionEvent label action parameter
Table 4.4: Google analytics event data
4.6.2 Reports
The most important task to interpret the logged data in the right way iscreating useful reports. Google Analytics makes it very easy to create customreports which are structured in a meaningful way.
To interpret the data for each feature separately four different reports arecreated - camera behaviour, weather behaviour, track behaviour and 3D
34

4.6 Remote Logging
Figure 4.7: Screenshot of a custom Google Analytics report
Figure 4.8: Screenshot of the Google Analytics world view
behaviour. Each report shows the total time in the specified mode, theaverage time and the number of events. The reports are divided in a generalview and a view per session, where the detailed sessions are shown. Anexample of the provided data in report can be found on figure 4.7.
Another big advantage of Google Analytics is the country view. This viewshows the number of logged events per country, which can be seen onfigure 4.8. This can be very interesting for the Schladming-Dachstein TourismMarketing, because it shows where people are interested in the region.
35


5 Results
In general results regarding the performance of the application can be foundin this chapter. Optimizations are examined for their effectivity and someinformation is given about the execution performance on an example mobiledevice. Additionally this chapter gives details of the resulting applicationlike needed memory, disk space and other system requirements.
Instead of a user study to evaluate the usability of the app, the prototypewas sent to usability experts at the University of Oulu. The feedback can befound in this chapter.
In a project like this, which aggregates some different technical areas, chal-lenges and difficulties can occur. The most important of them are also listedin section 5.3.
5.1 Performance
The performance of an application is very important for a good impressionafter starting it the first time. An aim for such applications should be toprovide a performance of more than 30 frames per second (FPS) at eachtime. According to Janzen and Teather [50] the interaction performancedrops significantly at a framerate below 30.
This is currently not reached in this version of the app as shown in thenext sections. But it should be possible to optimize it to meet this target onstate-of-the-art devices.
A big performance boost can be get if loading the 3D mesh asynchronously.This means that it is not loaded at startup, but at in a second thread when
37

5 Results
the application is already running. With this change the loading time of theapp can be improved dramatically.
The performance measurement is done by calculating the current and theaverage framerate since startup. The measurements are performed on aSamsung Galaxy Note 10.1 2012 device which provides a native resolution of2560x1600.
5.1.1 Comparison Lowpoly/Highpoly Meshes
The two different meshes in this measurements have the same shape, butthe file sizes are different because of a higher polygon count within the firstmesh. The reduced polygons lead to a dramatically improved performancewhich can be seen in table 5.1.
But this is not the only advantage of reducing the model details. Theapplication startup is much faster because the file size is also decreased bythe difference of lowpoly and highpoly mesh.
Displayed mesh Mesh filesize Average FPSLowpoly mesh 5MB 16.3 FPSHighpoly mesh 24MB 10.9 FPS
Table 5.1: Lowpoly performance
5.1.2 Static batching
Static batching merges multiple 3D elements to act like one game object.The only limitation is that the elements must have the same texture. Thisfeature reduces the number of drawing calls and increases the performanceif there are many similar game objects in the 3D scene.
In the scene of this application the parts of the hiking tracks can be batchedbecause they all have the same color and can be treated as one object. Thisreduces the number of drawing calls per track from about 200 to exactlyone. Due to the lack of a real remote track service there are only nine tracks
38

5.2 Expert Evaluation
which are manually defined. The performance gain is not very high due tothe limited number of tracks. But if it is reimplemented with remote datathis optimisation can have a noticeable effect on the scene.
Batching Drawing calls Average FPSActive 10 12.9 FPSInactive 1000 12.5 FPS
Table 5.2: Batching performance
5.2 Expert Evaluation
Although an extended user evaluation is not done within this work someexperts tested the app for usability errors. According to them there are someissues which are listed in this chapter.
The first issues is that the hiking tracks are drawn as a collection of stretchedcubes rather than a continuous path. This leads to a confusing view ifmoving closer to the paper map.
Another big problem with the application is the slow loading time. A splashscreen is recommended to provide a nicer view than the default Unity 3Dicon on black ground while waiting. But the loading time could also bereduced with loading the 3D model asynchronously. One the one handthis reduces the startup duration of the application but on the other handthe user has to wait a few seconds after startup until the model has beenloaded.
A third issues which is mentioned in the evaluation feedback is the visibilityof the GUI elements. It is stated that the buttons are not enough broughtout because of the semi-transparent color. Especially in outdoor scenariosthe buttons could be invisible for users.
39

5 Results
5.3 Challenges
Due to the interdisciplinarity of the project there are some challenges whichoccurred while working on the application.
The first, but also very big, challenge is the research for suitable landscapedata, orthographic images and online services for the region. In the bestcase they are georeferenced to use them without any modifications and theapplication. But high-resolution data are very expensive in some regions, sopublic data sources with mostly lower resolutions have to be used.
The next challenge is related to the previously mentioned one. The datasources might be georeferenced, but there can be differences in the usedcoordinate system. For this reason converters should be used, but in somecases the conversion is not a trivial task.
An important target which is not always easy to meet is a high usability. Themain problem in this case is that the app should also be used in outdoorscenarios, so the contrast should also be high enough. Moreover the UIelements should be big enough and easy to use for hiking trips.
The last big challenge in this work is the performance optimization. Aug-mented Reality needs a lot of resources, the 3D model need them too.Moreover a set of online services should be included. The task is to opti-mize it to get a sufficient performance on midrange mobile devices. Manyconsiderations have to be done regarding detail level of the 3D model, usageof Unity 3D built-in optimisation features and data loading performance.
40

6 Conclusion and Further Work
The main target of this work is to develop an app which provides additionalinformation to paper maps. The application should be used to evaluateaugmented reality in a real world environment. However, the evaluationitself is not part of the scope covered in this work.
The developed app is intended to be used in outdoor scenarios. This factimplies that there should be no usability issues and the UI elements shouldbe highly visible.
The integration of different online services is done with UI layers which canbe enabled separately. This is a good approach concerning failure tolerancebecause the layers are independent from each other.
To get an overview of the app usage after release a remote logging systemis implemented, which tracks every feature activity. In case of a missingnetwork connection the events are saved in an offline cache and they areresent at the next application start.
The application developed in this work is only a prototype which shouldgive a preview of the capabilities such an application can provide. Dueto that reason there are some potential improvements and enhancementswhich can be implemented.
First of all usability of the app is not evaluated properly. Therefore someissues and inconsistencies in the work flow can appear testing by peopleindependent from software development. This is the most important workwhich should be done prior to release, because usability problems are likelyto prevent users from using the app a second time.
In the current version of the app there are only two sample services included,the current weather and hiking tracks of the region. It should be mentioned
41
6 Conclusion and Further Work
that the hiking tracks service is not implemented in its final form, becausethe data is included statically in the application rather than be loaded fromthe web. The next step would be to load the tracks from the official site ofSchladming-Dachstein Tourism Marketing. This ensures a measure of actualityfor the provided data in the app.
Another topic which should be thought of before releasing the app is doingsome performance optimisation. At the moment the application is runningstable and works on many mobile devices. But the app startup takes at least30 seconds and the AR scene runs with at most 20 frames per second on ahigh end tablet. For a good user experience the performance is not goodenough at the moment.
The aim of a released version of this app should be to help hikers duringtheir outdoor activities. To meet this target some more information has tobe included. Helpful extensions can be found in section 3.1, where possiblefeatures are figured out.
42

Bibliography
[1] Tobias Langlotz, Jens Grubert, and Raphael Grasset. “AugmentedReality Browsers: Essential Products or Only Gadgets?” In: Commun.ACM 56.11 (Nov. 2013), pp. 34–36 (cit. on p. 1).
[2] O.I. Heimo et al. “Augmented reality - Towards an ethical fantasy?”In: Ethics in Science, Technology and Engineering, 2014 IEEE InternationalSymposium on. May 2014, pp. 1–7 (cit. on p. 1).
[3] Lee Yik Sheng. “Modelling learning from Ingress (Google’s augmentedreality social game).” In: Educational Media (ICEM), 2013 IEEE 63rdAnnual Conference International Council for. Oct. 2013, pp. 1–8 (cit. onpp. 1, 5).
[4] Jens Grubert et al. “The utility of Magic Lens interfaces on hand-held devices for touristic map navigation.” In: Pervasive and MobileComputing 18 (2015), pp. 88–103 (cit. on p. 2).
[5] A.A. Bagherzadeh et al. “A Multi-Agent Architecture for TrackingUser Interactions in Browser-based Games.” In: Digital Game and Intel-ligent Toy Enhanced Learning (DIGITEL), 2012 IEEE Fourth InternationalConference on. Mar. 2012, pp. 105–107 (cit. on p. 2).
[6] Unity 3D. Unity 3D. 2014. url: http://unity3d.com/ (cit. on p. 3).
[7] Bob McKay. Tablet & Smartphone Resolutions and Screen Sizes. 2014.url: http://bobmckay.com/web/tablet-smartphone-resolutions-screen-sizes (cit. on p. 3).
[8] R. Grasset et al. “Image-driven view management for augmentedreality browsers.” In: Mixed and Augmented Reality (ISMAR), 2012 IEEEInternational Symposium on. Nov. 2012, pp. 177–186 (cit. on p. 5).
43

Bibliography
[9] B. Parhizkar et al. “Android mobile augmented reality applicationbased on different learning theories for primary school children.” In:Multimedia Computing and Systems (ICMCS), 2012 International Confer-ence on. May 2012, pp. 404–408 (cit. on p. 5).
[10] Bill Lindmeier. Tunnel Vision. Dec. 2014. url: http://www.tunnelvisionapp.com/ (cit. on p. 6).
[11] C. Adithya et al. “Augmented reality approach for paper map visual-ization.” In: Communication and Computational Intelligence (INCOCCI),2010 International Conference on. Dec. 2010, pp. 352–356 (cit. on p. 6).
[12] Ann Morrison et al. “Like Bees Around the Hive: A ComparativeStudy of a Mobile Augmented Reality Map.” In: Proceedings of theSIGCHI Conference on Human Factors in Computing Systems. CHI ’09.Boston, MA, USA: ACM, 2009, pp. 1889–1898 (cit. on pp. 6, 8).
[13] M. Stroila et al. “Augmented transit maps.” In: Applications of ComputerVision (WACV), 2011 IEEE Workshop on. Jan. 2011, pp. 485–490 (cit. onp. 6).
[14] Mark Lochrie et al. “Designing Seamless Mobile Augmented RealityLocation Based Game Interfaces.” In: Proceedings of International Con-ference on Advances in Mobile Computing & Multimedia. MoMM ’13.Vienna, Austria: ACM, 2013, 412:412–412:415 (cit. on p. 6).
[15] Jens Grubert, Raphael Grasset, and Gerhard Reitmayr. “Exploringthe Design of Hybrid Interfaces for Augmented Posters in PublicSpaces.” In: Proceedings of the 7th Nordic Conference on Human-ComputerInteraction: Making Sense Through Design. NordiCHI ’12. Copenhagen,Denmark: ACM, 2012, pp. 238–246 (cit. on p. 7).
[16] Jens Grubert et al. “Playing It Real: Magic Lens and Static PeepholeInterfaces for Games in a Public Space.” In: Proceedings of the 14th In-ternational Conference on Human-computer Interaction with Mobile Devicesand Services. MobileHCI ’12. San Francisco, California, USA: ACM,2012, pp. 231–240 (cit. on p. 7).
[17] Play.google.com. alpenvereinaktiv.com. 2014. url: https://play.google.com/store/apps/details?id=de.alpstein.alpregio.AlpenvereinAktiv
(cit. on p. 8).
44

Bibliography
[18] Play.google.com. Maverick Pro. 2014. url: https://play.google.com/store/apps/details?id=com.codesector.maverick.full (cit. onp. 8).
[19] Play.google.com. Wanderkarte Osterreich. 2014. url: https://play.google.com/store/apps/details?id=sk.tekel.tmat (cit. on p. 8).
[20] Play.google.com. AlpineQuest GPS Hiking. 2014. url: https://play.google.com/store/apps/details?id=psyberia.alpinequest.full
(cit. on p. 8).
[21] Play.google.com. Outdoor und Wander- Navigation. 2014. url: https://play.google.com/store/apps/details?id=wmdev.apps.navBrowser
(cit. on p. 8).
[22] Artoolworks.com. ARToolworks. 2014. url: http://www.artoolworks.com/ (cit. on p. 10).
[23] GitHub. DroidAR. 2014. url: https://github.com/bitstars/droidar(cit. on p. 10).
[24] Metaio. Metaio SDK. 2015. url: http://www.metaio.com/products/sdk/ (cit. on p. 10).
[25] Qualcomm. Qualcomm Vuforia. 2014. url: https://www.qualcomm.com/products/vuforia (cit. on p. 10).
[26] Total Immersion. Total Immersion AR Engine. 2015. url: http://www.t-immersion.com/products/dfusion-suite (cit. on p. 10).
[27] Wikitude. Wikitude. 2014. url: http://www.wikitude.com/ (cit. onp. 10).
[28] R. Klein, G. Liebich, and W. Strasser. “Mesh reduction with errorcontrol.” In: Visualization ’96. Proceedings. Oct. 1996, pp. 311–318 (cit.on p. 13).
[29] J. Petersen, D. Sack, and R. Gabler. Fundamentals of Physical Geography.Cengage Learning, 2010 (cit. on p. 13).
[30] Wendy Yee. “Potential Limitations of Multi-touch Gesture Vocabulary:Differentiation, Adoption, Fatigue.” English. In: Human-Computer In-teraction. Novel Interaction Methods and Techniques. Ed. by JulieA. Jacko.Vol. 5611. Lecture Notes in Computer Science. Springer Berlin Heidel-berg, 2009, pp. 291–300 (cit. on p. 15).
45

Bibliography
[31] Andrew Bragdon et al. “Experimental Analysis of Touch-screen Ges-ture Designs in Mobile Environments.” In: Proceedings of the SIGCHIConference on Human Factors in Computing Systems. CHI ’11. Vancouver,BC, Canada: ACM, 2011, pp. 403–412 (cit. on p. 16).
[32] Richard Horne. 3DEM. 2014. url: http://freegeographytools.com/2009/3dem-website-is-gone-but-3dem-still-available-here
(cit. on p. 20).
[33] D. Schobesberger and T. Patterson. “Evaluating the effectiveness of2D vs. 3D Trailhead Maps.” In: Proceedings of the 6th ICA MountainCartography Workshop. ETH Zurich, Mar. 2008, pp. 201–205 (cit. onp. 21).
[34] J. Bossler and R. Snay. Manual of Geospatial Science and Technology,Second Edition. CRC Press, Mar. 2010 (cit. on pp. 21, 22).
[35] T. G. Grubb and W. L. Eakle. Recording wildlife locations with the Univer-sal Transverse Mercator (UTM) grid system. U.S. Department of Agricul-ture, Forest Service, Rocky Mountain Forest and Range ExperimentStation, 1988 (cit. on p. 21).
[36] Rino Ciancaglini. “CO-ORDINATES CONVERSION: FROM WGS84
TO UTM AND VICEVERSA.” In: PROCEEDINGS OF THE 7THWORLD CONGRESS ON INTELLIGENT SYSTEMS. 2000 (cit. on p. 22).
[37] Map of Europe, showing the latitude and longitude zones. 2014. url: http://upload.wikimedia.org/wikipedia/commons/9/9e/LA2-Europe-
UTM-zones.png (cit. on p. 22).
[38] A. J. Hanson. Visualizing Quaternions: Series in Interactive 3D Technology.Morgan Kaufman, 2006 (cit. on p. 23).
[39] Chao Zheng and Hui Zhang. “Implicit Surface Reconstruction Basedon Adaptive Clustering.” In: Computer-Aided Design and ComputerGraphics (CAD/Graphics), 2011 12th International Conference on. Sept.2011, pp. 509–515 (cit. on p. 23).
[40] F. Bernardini et al. “The ball-pivoting algorithm for surface reconstruc-tion.” In: Visualization and Computer Graphics, IEEE Transactions on 5.4(Oct. 1999), pp. 349–359 (cit. on p. 24).
[41] T. Mullen. Mastering Blender. Serious skills. Wiley, 2012 (cit. on p. 24).
46

Bibliography
[42] J. W. Murray. Game Development for iOS with Unity3D. CRC Press, 2013
(cit. on p. 26).
[43] Mike Geig. Unity Game Development in 24 Hours, Sams Teach Yourself.Sams Publishing, 2014 (cit. on p. 26).
[44] Erich Gamma et al. Design Patterns: Elements of Reusable Object-orientedSoftware. Boston, MA, USA: Addison-Wesley Longman Publishing Co.,Inc., 1995 (cit. on pp. 26, 28).
[45] M. Panwar. “Application Performance Management Emerging Trends.”In: Cloud Ubiquitous Computing Emerging Technologies (CUBE), 2013 In-ternational Conference on. Nov. 2013, pp. 178–182 (cit. on p. 28).
[46] forecast.io. 2014. url: http://forecast.io (cit. on p. 29).
[47] Soonyong Song et al. “An application to generate keyhole markuplanguage file format from GPS location data.” In: Consumer Electronics(ISCE 2014), The 18th IEEE International Symposium on. June 2014, pp. 1–2 (cit. on p. 30).
[48] Hao Lu and Yang Li. “Gesture Coder: A Tool for Programming Multi-touch Gestures by Demonstration.” In: Proceedings of the SIGCHI Con-ference on Human Factors in Computing Systems. CHI ’12. Austin, Texas,USA: ACM, 2012, pp. 2875–2884 (cit. on p. 32).
[49] J. Hughes. iPhone & iPad Apps Marketing: Secrets to Selling Your iPhoneand iPad Apps. Que Publishing, 2010 (cit. on p. 33).
[50] Benjamin F. Janzen and Robert J. Teather. “Is 60 FPS Better Than 30?:The Impact of Frame Rate and Latency on Moving Target Selection.”In: CHI ’14 Extended Abstracts on Human Factors in Computing Systems.CHI EA ’14. Toronto, Ontario, Canada: ACM, 2014, pp. 1477–1482
(cit. on p. 37).
47