Embed Size (px)
Citation preview

ACTA GEOTECHNICA SLOVENICA, 2009/2 31.
A MICROTREMOR HVSR STUDY OF THE SEISMIC SITE EFFECTS IN THE AREA OF THE TOWN OF BREŽICE (SE SLOVENIA)
ANDREJ GOSAR
About the author
Andrej GosarUniversity of Ljubljana,Faculty of Natural Sciences and Engineeringand Environmental Agency of Slovenia,Seismology and Geology OfficeDunajska 47, 1000 Ljubljana, SloveniaE-mail: [email protected]
Abstract
The wider region of Brežice is one of the most seismically active areas of Slovenia. The most damaging earthquake occurred in 1917, when Brežice was hit by an ML=5.7 earthquake that had an VIII MSK maximum intensity. Seismic site effects due to Quaternary sediments can be expected in the whole area of the town. Since there is a lack of boreholes and geophysical data to assess the site effects, the microtremor (ambient vibrations) horizontal-to-vertical spectral ratio (HVSR) method was applied at 113 free-field measuring points. In general, clear spectral peaks were obtained, but there were also examples of flat spectral ratios indicating a low impedance contrast between the sediments and the bedrock. A map of the sediment resonance frequency was drawn, which shows a frequency range of 1–15 Hz. In the southern part of the town higher frequencies correspond to the thin sediments (the Brežice terrace and the middle Sava terrace) and the high HVSR peak amplitudes indicate a great impedance contrast with the Sarmatian and Badenian bedrock. The northern part is characterized by very low frequencies, indicating thick sediments (Plio-Quaternary gravel) and a small impedance contrast with Pontian marl. The transition between the high and low frequencies is relatively steep. In addition, measure-ments were performed in 12 characteristic houses to assess the longitudinal and transverse building frequencies. The established building frequency range of 5–10 Hz indicates some areas in the southern part of the town where there is a potential danger of soil-structure resonance. Two buildings show direct evidence of a potential soil-structure resonance. According to this study, more pronounced seismic site effects are expected in the southern part of Brežice.
Keywords
ambient vibrations, microtremors, horizontal-to-vertical spectral ratio (HVSR), seismic site effects, soil-structure resonance
1 INTRODUCTION
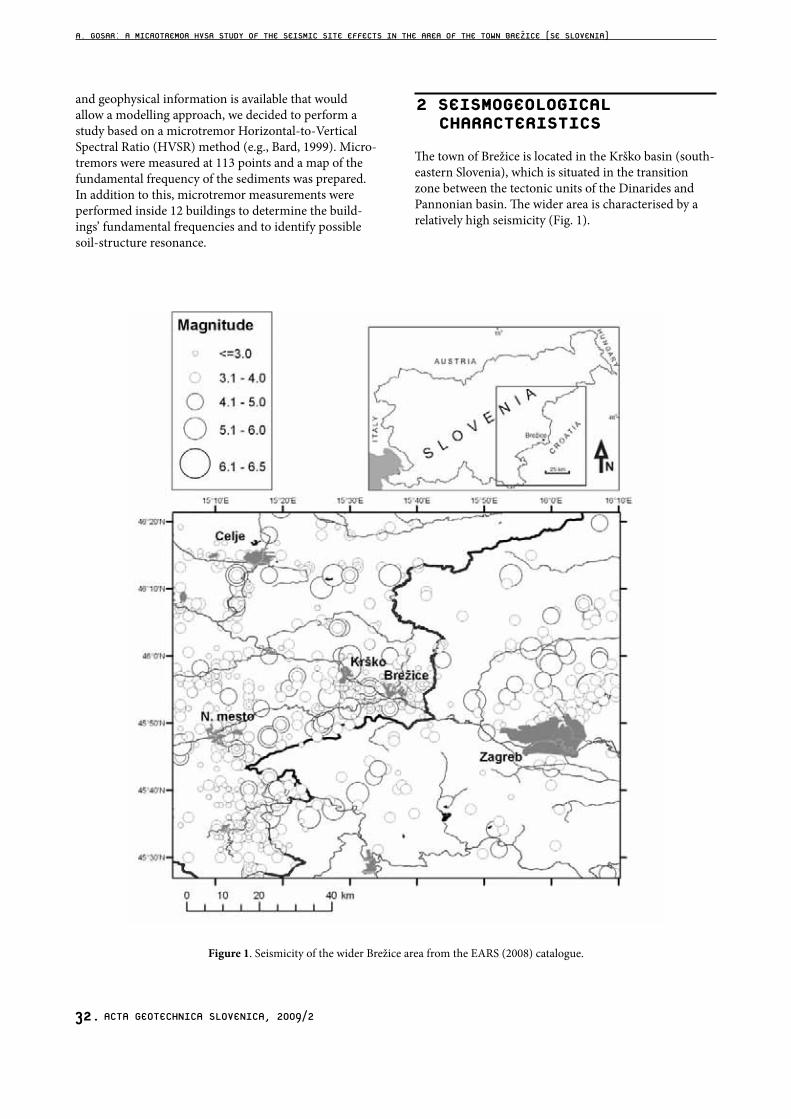
The wider region of Brežice is one of the most seismi-cally active areas of Slovenia (Fig. 1). The most damag-ing earthquake in the history of the town occurred on 29 January 1917, when Brežice was hit by an ML=5.7 earthquake that had an VIII MSK maximum intensity (Lapajne, 1990). According to the seismic hazard map of Slovenia for a 475-year return period (Lapajne et al., 2001), a relatively high design ground acceleration value of 0.225 g for a rock site is ascribed to the Brežice area. Most of the town of Brežice is built on a mid-Pleistocene terrace composed of sandy gravel. Such relatively soft sediments can considerably enhance the seismic ground motion in the case of an earthquake and thus enhance the damage to buildings. Situations when soil-structure resonance occurs are particularly dangerous.
The only existing microzonation of Brežice (Vidrih et al., 1991) was based on surface geological data, since no subsurface geological or geophysical information was available. It was prepared for use together with the old seismic hazard map of Slovenia for a 500-year return period showing the intensity on the MSK scale (Ribarič, 1987), in which Brežice is estimated to have an VIII MSK. This microzonation showed that the maximum expected intensity due to the effects of soft sediments could be increased by ½−¾ intensity grade. Today, the town of Brežice has around 5,000 inhabitants but, together with neighbouring villages, the population is more than 8,000. There are several important industrial and transport facilities in the area, which should be considered in any seismic risk-assessment study.
In order to study the site effects in more detail and in view of the fact that almost no subsurface geological
ACTA GEOTECHNICA SLOVENICA, 2009/232.
and geophysical information is available that would allow a modelling approach, we decided to perform a study based on a microtremor Horizontal-to-Vertical Spectral Ratio (HVSR) method (e.g., Bard, 1999). Micro-tremors were measured at 113 points and a map of the fundamental frequency of the sediments was prepared. In addition to this, microtremor measurements were performed inside 12 buildings to determine the build-ings’ fundamental frequencies and to identify possible soil-structure resonance.
2 SEISMOGEOLOGICAL CHARACTERISTICS
The town of Brežice is located in the Krško basin (south-eastern Slovenia), which is situated in the transition zone between the tectonic units of the Dinarides and Pannonian basin. The wider area is characterised by a relatively high seismicity (Fig. 1).
A. GOSAR: A MICROTREMOR HVSR STUDY OF THE SEISMIC SITE EFFECTS IN THE AREA OF THE TOWN BREZ̆ICE (SE SLOVENIA)
Figure 1. Seismicity of the wider Brežice area from the EARS (2008) catalogue.
ACTA GEOTECHNICA SLOVENICA, 2009/2 33.
softer and have a lower impedance contrast with the sediment cover. The Neogene sediments are overlain by a succession of Sava river glaciofluvial sandy gravel deposits and fine-grained sediments from local sources (Verbič, 2004). The thickness of the Plio-Quaternary deposits is highly variable. In a borehole in Šentlenart, north of Brežice, they are 80 m thick, but only 200 m to the south-west they are completely eroded. Almost the whole town of Brežice lies on the mid-Pleistocene Brežice terrace composed of sandy gravel, which is partly cemented in a conglomerate. The thickness of the Brežice terrace is 5–10 m. It is overlain by very thin (0.2–1 m) alluvium composed of sandy-silt sediments. The Brežice terrace is uplifted with respect to the surrounding Holocene surface for around 25 m (Verbič, 2004). The area around the Brežice terrace is covered with the lower and middle Sava terraces and alluvium (Holocene).
According to the described general geological setting the thickness and physical properties of the soft sediments under the town of Brežice can vary considerably. Both influence the fundamental frequency of the sediments and the amplification of the seismic ground motion. Due to a lack of boreholes and geophysical data the extent of these variations is not known. Also the physical properties (the shear-waves velocity and density) of the "seismological" bedrock are, according to the known lithology, highly variable. This significantly influences the impedance contrast at the sediments-bedrock boundary.
A. GOSAR: A MICROTREMOR HVSR STUDY OF THE SEISMIC SITE EFFECTS IN THE AREA OF THE TOWN BREZ̆ICE (SE SLOVENIA)
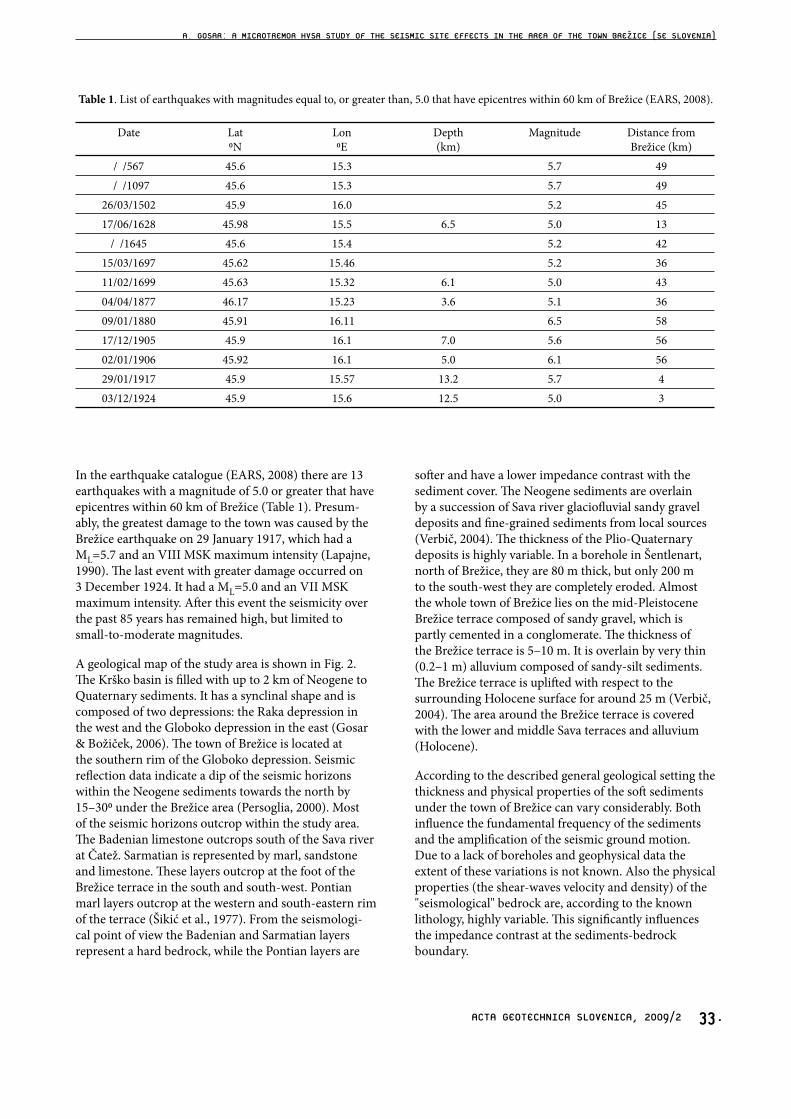
In the earthquake catalogue (EARS, 2008) there are 13 earthquakes with a magnitude of 5.0 or greater that have epicentres within 60 km of Brežice (Table 1). Presum-ably, the greatest damage to the town was caused by the Brežice earthquake on 29 January 1917, which had a ML=5.7 and an VIII MSK maximum intensity (Lapajne, 1990). The last event with greater damage occurred on 3 December 1924. It had a ML=5.0 and an VII MSK maximum intensity. After this event the seismicity over the past 85 years has remained high, but limited to small-to-moderate magnitudes.
A geological map of the study area is shown in Fig. 2. The Krško basin is filled with up to 2 km of Neogene to Quaternary sediments. It has a synclinal shape and is composed of two depressions: the Raka depression in the west and the Globoko depression in the east (Gosar & Božiček, 2006). The town of Brežice is located at the southern rim of the Globoko depression. Seismic reflection data indicate a dip of the seismic horizons within the Neogene sediments towards the north by 15–300 under the Brežice area (Persoglia, 2000). Most of the seismic horizons outcrop within the study area. The Badenian limestone outcrops south of the Sava river at Čatež. Sarmatian is represented by marl, sandstone and limestone. These layers outcrop at the foot of the Brežice terrace in the south and south-west. Pontian marl layers outcrop at the western and south-eastern rim of the terrace (Šikić et al., 1977). From the seismologi-cal point of view the Badenian and Sarmatian layers represent a hard bedrock, while the Pontian layers are
Table 1. List of earthquakes with magnitudes equal to, or greater than, 5.0 that have epicentres within 60 km of Brežice (EARS, 2008).
Date Lat0N
Lon0E
Depth(km)
Magnitude Distance from Brežice (km)
/ /567 45.6 15.3 5.7 49 / /1097 45.6 15.3 5.7 49
26/03/1502 45.9 16.0 5.2 4517/06/1628 45.98 15.5 6.5 5.0 13
/ /1645 45.6 15.4 5.2 4215/03/1697 45.62 15.46 5.2 3611/02/1699 45.63 15.32 6.1 5.0 4304/04/1877 46.17 15.23 3.6 5.1 3609/01/1880 45.91 16.11 6.5 5817/12/1905 45.9 16.1 7.0 5.6 5602/01/1906 45.92 16.1 5.0 6.1 5629/01/1917 45.9 15.57 13.2 5.7 403/12/1924 45.9 15.6 12.5 5.0 3

ACTA GEOTECHNICA SLOVENICA, 2009/234.
Figure 2. Geological map of the Brežice region, after Šikić et al. (1977). The transfer to GIS was made by the GeologicalSurvey of Slovenia. The red triangles indicate the points of the microtremor measurements, while the
labelled triangles are examples of the HVSR analyses shown in Fig. 3.
A. GOSAR: A MICROTREMOR HVSR STUDY OF THE SEISMIC SITE EFFECTS IN THE AREA OF THE TOWN BREZ̆ICE (SE SLOVENIA)
ACTA GEOTECHNICA SLOVENICA, 2009/2 35.
The existing microzonation of Brežice (Vidrih et al., 1991), which is based on surface geological data, ascribes two regions of different intensity increment due to soft sediments in the Brežice area. The whole Brežice terrace is classified as an VIII2 intensity, which means a ½ intensity grade increment with respect to an VIII MSK intensity from the seismic hazard map. All the remaining area covered with the middle and lower Sava terraces and alluvium (Holocene) is classified as an VIII3 intensity, which means a ¾ intensity grade increment.
3 METHODOLOGY
In the past ten years the microtremor HVSR method has been widely used for microzonation and site-effect stud-ies. Reviews of the method can be found in Bard (1999). However, the theoretical basis of the HVSR method is still debated, and different explanations have been given. Nakamura's (2000) "body-waves" explanation is based on the S-wave resonance in soft sediment layers with a minor or negligible influence of the surface waves. More widely accepted (Bard, 1999; Bonnefoy-Claudet et al., 2006) is the "surface-waves" explanation, in which HVSR is related to the ellipticity of the Rayleigh waves, which is frequency dependent. HVSR therefore exhibits a sharp peak at the fundamental frequency of the sediments, when there is a high impedance contrast between the sediments and the underlying bedrock. Criticism of the HVSR method is often related to the fact that there is no common practice for data acquisition and processing (Mucciarelli & Gallipoli, 2001). Attempts to provide standards have been made only recently (SESAME, 2004). Today, it is widely accepted that the frequency of the HVSR peak reflects the fundamental frequency of the sediments. Its amplitude depends mainly on the impedance contrast with the bedrock and cannot be used as site amplification. In addition, HVSR does not provide any estimate of the actual bandwidth over which the ground motion is amplified. The main advantages of the HVSR method are a direct estimate of the resonance frequency of sediments without knowing the geological and S-velocity structure of the underground, and simple, low-cost measurements. Using the microtremor method, a much denser grid of measurements is possible than with any other method based on earthquake recordings, geophysical investigations or drilling. Any knowledge about the thickness and/or velocity of the sediments and the comparison of HVSR results with other methods and with the observed earthquake damage can significantly improve the reliability of the results (Bard, 1999).
The use of microtremors was later extended to an identification of the fundamental frequencies of build-ings and soil-structure resonance (Mucciarelli et al., 2001; Gallipoli et al., 2004a). Damage enhancement and soil-structure resonance were recently studied using microtremors for the Umbria-Marche earthquake (Mucciarelli & Monachesi, 1998; Natale & Nunziata, 2004), the Thessaloniki earthquake (Panou et al., 2005) and the Molise earthquake (Gallipoli et al., 2004b). In Slovenia, examples of possible soil-structure resonance were found in the Bovec basin (Gosar, 2007), in Ilirska Bistrica (Gosar & Martinec, 2009) and in Ljubljana (Gosar et al., 2009).
4 MICROTREMOR MEASUREMENTS AND ANALYSES
In the Brežice area, measurements of the ambient vibrations were performed using portable Tromino seismographs (Micromed, 2005) composed of three orthogonal electrodynamic velocity sensors, a GPS receiver, a digitizer and a recording unit with a flash-memory card. All the parts are integrated in a common case to avoid electronic and mechanical noise, which can be introduced by wiring between the different parts of the equipment. In the frequency range 0.1–10 Hz, the self-noise of the seismograph is much lower than the standard seismic noise models of the Earth.
4.1 FREE-FIELD
An area of 4.7 km2 was surveyed over an approximate 200 m x 200 m grid (Fig. 2). Altogether, 113 free-field measurements were performed. On average, there were 24 measuring points per square kilometre. GIS was used for planning the measurements and later for drawing the maps. The measuring locations were carefully selected to avoid, as far as possible, the influence of trees, build-ings, underground structures and traffic. However, in the built-up urban environment this was not always possible. Good ground coupling on the soft soil was obtained by using long spikes mounted at the base of the seismograph. The sampling frequency was 128 Hz and the recording time was 20 minutes.
The HVSR analysis was performed in the following way. The recorded time series were visually inspected to identify any possible erroneous measurements and stronger transient noise. Each record was then split into 30-second-long non-overlapping windows, for which the amplitude spectra were computed using a triangular
A. GOSAR: A MICROTREMOR HVSR STUDY OF THE SEISMIC SITE EFFECTS IN THE AREA OF THE TOWN BREZ̆ICE (SE SLOVENIA)
ACTA GEOTECHNICA SLOVENICA, 2009/236.
window with 5% smoothing and corrected for the sensor-transfer function. The smoothing percentage determines the width of the mobile window centred at each frequency. The HVSR was computed as the average of both horizontal component spectra divided by the vertical spectrum for each window. From the colour-coded plot of the HVSR functions for all 40 windows, the windows including strong transient noise (the bypassing of a heavy truck or a train, for example), were identified in order to be excluded from further computation. Although the effect of transient seismic noise is still debated, this is a generally recommended procedure in HVSR analysis. Castellaro & Mulargia (2009), for example, have shown that a few windows with strong transient noise severely affect the average HVSR curve below 2 Hz. Also, in our experience, it is important to remove the stronger transient noise to improve the stability of the HVSR curve at low frequen-cies. On the other hand, Parolai and Galiana-Merino (2006) claimed that transients have little or no effect on the HVSR. Finally, the average HVSR function of all the windows, with a corresponding 95% confidence interval, was computed. In addition, a directional HVSR analysis was performed in 10° angular steps to identify possible directions of the noise sources.
4.2 MEASUREMENTS INSIDE BUILDINGS
Measurements were performed in 12 characteristic buildings to assess the main resonance frequencies. Two- and three-storey residential houses prevail in the area, together with some multi-dwelling buildings of up to five stories. Most houses are masonry with RC floors.
For measurements inside buildings, short spikes mounted at the bottom of the seismograph were used to enable precise levelling, but to avoid vibration of the unit. The recording time was 10 minutes. Two horizontal components were oriented in the longitudinal and transverse directions of the building. The measurements were usually performed on all the floors of the build-ing. The instrument was placed as close as possible to the mass centre of the building (to avoid the influence of torsion) and close to a wall. Outside each building, but far enough so as to avoid its influence, a free-field measurement was also performed.
Each record was split into 10-second-long non-overlapping windows, for which the amplitude spectra were computed using a triangular window with 3% smoothing. Windows including strong transient noise were excluded from further computation, although some investigations indicate that the influence of the transients is negligible (Yuen et al., 2002). For both hori-
zontal components the average amplitude spectra were computed for each floor. As proposed by Gallipoli et al. (2004a), a separate HVSR for each horizontal compo-nent to the vertical component was also computed. A directional analysis was performed in 10° angular steps for easier recognition of the two main frequencies in the longitudinal and transverse directions.
5 RESULTS AND INTERPRETATION
5.1 FREE-FIELD RESULTS AND A MAP OF THE SEDIMENT RESONANCE FREQUENCY
HVSR analyses of 113 free-field measurements taken on an approximate 200 m x 200 m grid showed that most of them (76 %) fulfil the criteria defined by the European SESAME project for a reliable curve and a clear peak (SESAME, 2004). Three of these criteria for a reliable HVSR curve are based on the relation of the peak frequency to the window length, the number of significant cycles and the standard deviation of the peak amplitude. The next six criteria for a clear peak are based on the relation of the peak amplitude to the level of the HVSR curve elsewhere, and standard deviations of the peak frequency and of its amplitude (the amplitude should decrease rapidly on each side). If all three criteria for a reliable curve and at least five criteria for a clear peak are fulfilled, the frequency of the peak is considered to be the fundamental frequency of the sediments down to the first strong impedance contrast. The main reasons for the failure of the above criteria are: a) the high level of indus-trial or traffic noise or b) the amplitude of the peak or flat spectral ratio being too small. The latter does not mean a failure of the measurement, but that the impedance contrast between the sediments and the bedrock is too small. On the other hand, this means that only small site effects can be expected in areas with flat spectral ratios.
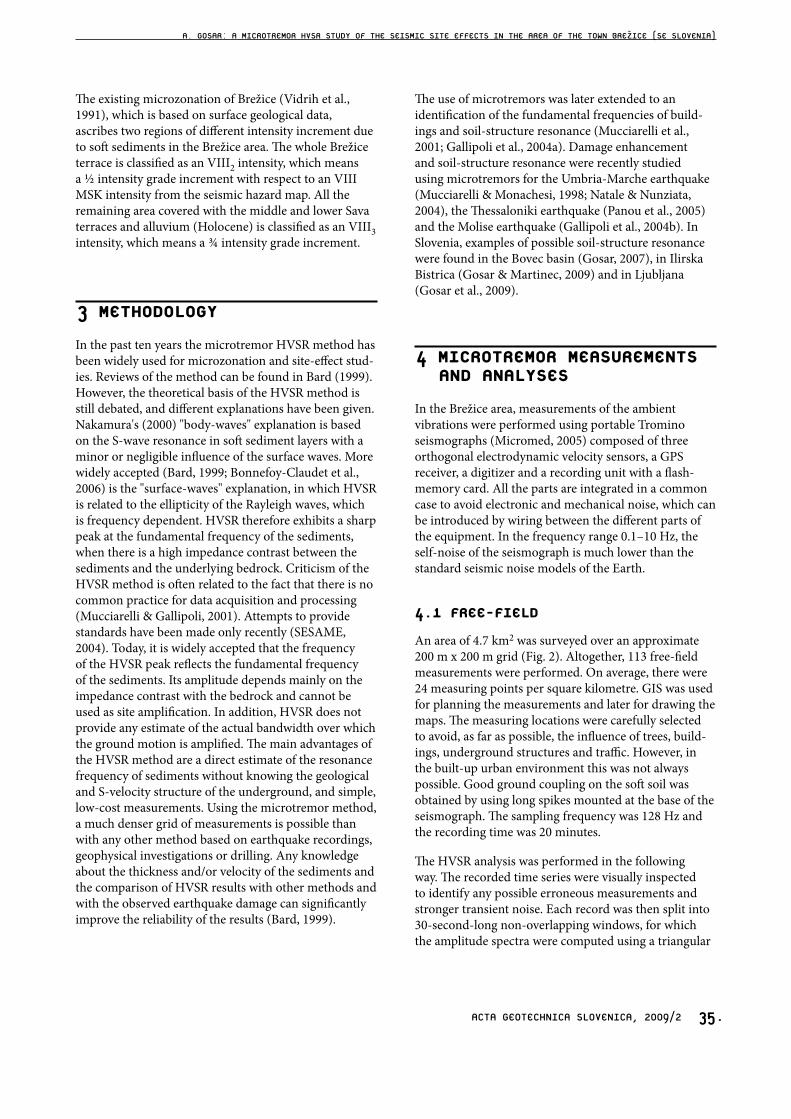
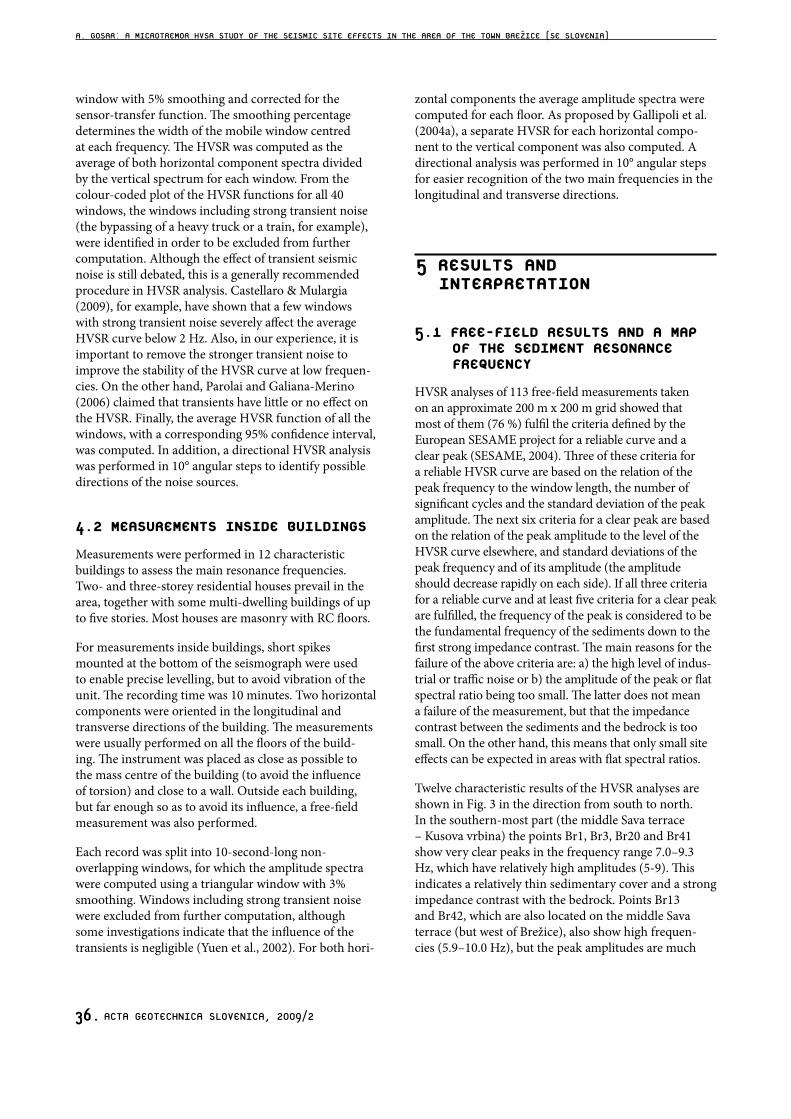
Twelve characteristic results of the HVSR analyses are shown in Fig. 3 in the direction from south to north. In the southern-most part (the middle Sava terrace – Kusova vrbina) the points Br1, Br3, Br20 and Br41 show very clear peaks in the frequency range 7.0–9.3 Hz, which have relatively high amplitudes (5-9). This indicates a relatively thin sedimentary cover and a strong impedance contrast with the bedrock. Points Br13 and Br42, which are also located on the middle Sava terrace (but west of Brežice), also show high frequen-cies (5.9–10.0 Hz), but the peak amplitudes are much
A. GOSAR: A MICROTREMOR HVSR STUDY OF THE SEISMIC SITE EFFECTS IN THE AREA OF THE TOWN BREZ̆ICE (SE SLOVENIA)

ACTA GEOTECHNICA SLOVENICA, 2009/2 37.
Br1
Br3
Br13
Br20
Figure 3 (part 1). Examples of microtremor HVSR curves. The locations of the measurements are shown in Fig. 2.The thin lines represent the 95% confidence interval.
Br33
A. GOSAR: A MICROTREMOR HVSR STUDY OF THE SEISMIC SITE EFFECTS IN THE AREA OF THE TOWN BREZ̆ICE (SE SLOVENIA)
ACTA GEOTECHNICA SLOVENICA, 2009/238.
Br41
Br42
Br63
Br68
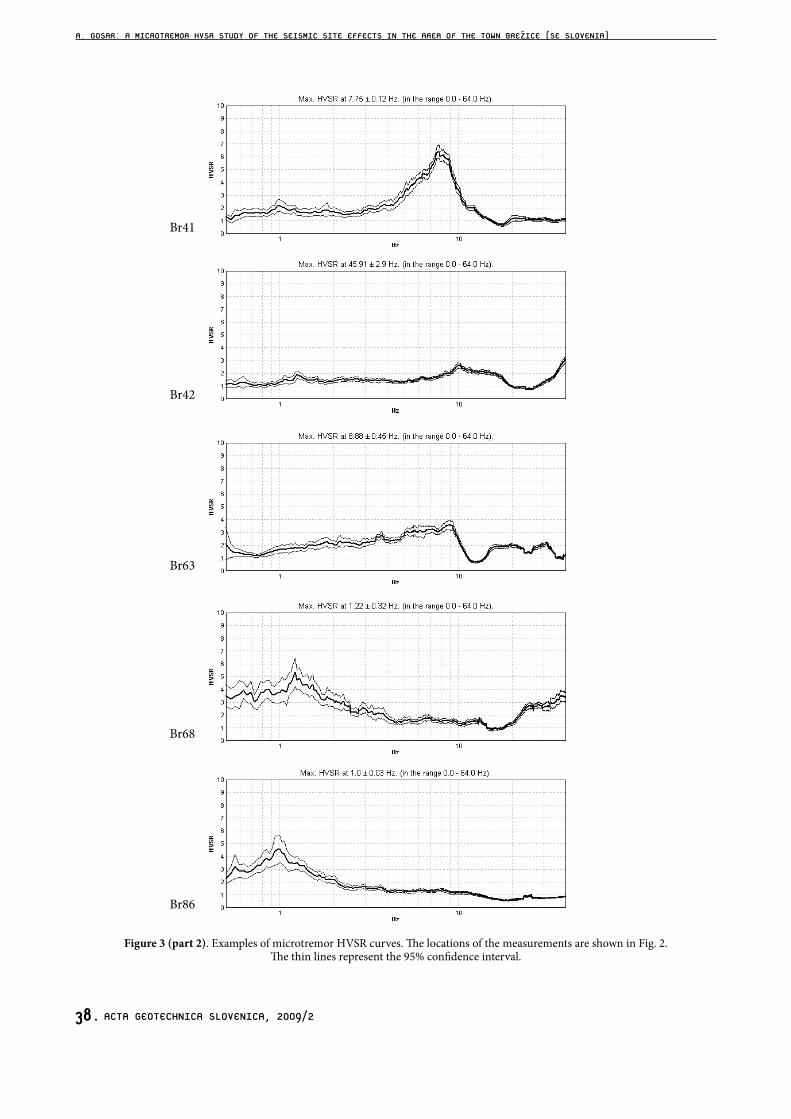
Figure 3 (part 2). Examples of microtremor HVSR curves. The locations of the measurements are shown in Fig. 2.The thin lines represent the 95% confidence interval.
Br86
A. GOSAR: A MICROTREMOR HVSR STUDY OF THE SEISMIC SITE EFFECTS IN THE AREA OF THE TOWN BREZ̆ICE (SE SLOVENIA)

ACTA GEOTECHNICA SLOVENICA, 2009/2 39.
Br126
Br127
Figure 3 (part 3). Examples of microtremor HVSR curves. The locations of the measurements are shown in Fig. 2.The thin lines represent the 95% confidence interval.
smaller. This indicates that in this part the impedance contrast between the sediments and the bedrock is smaller. Point Br63, which is located on the outcrop of Pontian marl, is characterized by a not-well-expressed peak at 8.9 Hz. For the narrow belt of Sarmatian lime-stone, sandstone and marl in the central southern part of the town, very high frequencies (above 13 Hz) are characteristic, indicating only a thin weathered layer on top. In the southern part of the Brežice terrace (Br33) the peaks in the frequency range 6.5–14.6 Hz prevail. They reflect a thin layer of sediments (Brežice terrace is only 5–10 m thick) underlain by Sarmatian limestone, sandstone and marl. Towards the north there is a steep transition to very low frequencies, which are character-istic for the whole northern part of the Brežice terrace. Most measurements in the northern part of the terrace (Br68 and Br86) are very similar. They are characterized by a broad low-frequency peak (1.0–1.8 Hz) and a small amplitude. This is an indication of a thick layer of sedi-ments and a small impedance contrast with the bedrock. This is in agreement with the known thickening of Plio-Quaternary gravel in the same direction from 0 m to 80 m (Verbič, 2004). Plio-Quaternary gravel is underlain by Pontian marl, indicating a small impedance contrast. A gradual increase of the impedance with depth inside the sedimentary layer due to compaction and the confining pressure is also probable. The lower signal-to-noise ratio in this area (Br68 and Br86) is reflected in a wider
95% confidence interval. The most northern part of the surveyed area (Šentlenart) lies on alluvium. The measurements in this area (Br126 and Br127) are char-acterized by slightly higher frequencies (2.5–3.8 Hz) and slightly better expressed peaks.
The frequencies of the HVSR peaks determined at 86 points were used to contour the iso-frequency map (Fig. 4), showing the resonance frequency of the sediments. The map shows the frequency distribution in a relatively large range of 1.0–15.1 Hz. For the southern-most part (Kusova vrbina), which lies on the middle Sava terrace, the frequency range 7.1–15.1 Hz is typical. This indicates a thin sedimentary cover, under which Badenian or Sarmatian limestone is expected. Also, the southern-most part of the Brežice terrace is characterized by high frequencies (6.5−14.1 Hz). These correspond to the known thickness of the Brežice terrace (5−10 m) and the Sarmatian limestone, sandstone and marl in the bedrock known from the outcrops at the foot of the terrace. Towards the north there is a steep transition to very low frequencies (1.0–1.8 Hz) that prevail in the whole north-ern part of the Brežice terrace, indicating the great thick-ness of unconsolidated sediments. There are two reasons for the lower frequencies and the lower amplitude of the HVSR peaks in this area. The first reason is the thicken-ing of the Plio-Quaternary sand and gravel towards the north (from 0 to 80 m); the second reason is the change
A. GOSAR: A MICROTREMOR HVSR STUDY OF THE SEISMIC SITE EFFECTS IN THE AREA OF THE TOWN BREZ̆ICE (SE SLOVENIA)

ACTA GEOTECHNICA SLOVENICA, 2009/240.
of the bedrock lithology from Sarmatian lithified layers to Pontian marl. The latter results, together with a prob-able gradual increase of the shear-waves velocity and the density inside the sand and gravel, in only a small impedance contrast between the sediments and bedrock. There are only two measurements in the central part
of the terrace that show a higher resonance frequency (3.6 Hz). In the most northern part of the surveyed area (Šentlenart), which lies on alluvium, the sediment frequency is in the range 1.6–3.8 Hz. Higher frequencies (2.7–4.0 Hz) were also observed west of the Brežice terrace at points measured on the middle Sava terrace.
Figure 4. Map of the sediments’ resonance frequency derived from free-field microtremor data. The red triangles indicate free-field measurements for which the resonance frequency can be determined; the red labels indicate the resonance frequency in Hz; and the blue
squares indicate the locations of measurements taken inside buildings.
A. GOSAR: A MICROTREMOR HVSR STUDY OF THE SEISMIC SITE EFFECTS IN THE AREA OF THE TOWN BREZ̆ICE (SE SLOVENIA)
ACTA GEOTECHNICA SLOVENICA, 2009/2 41.
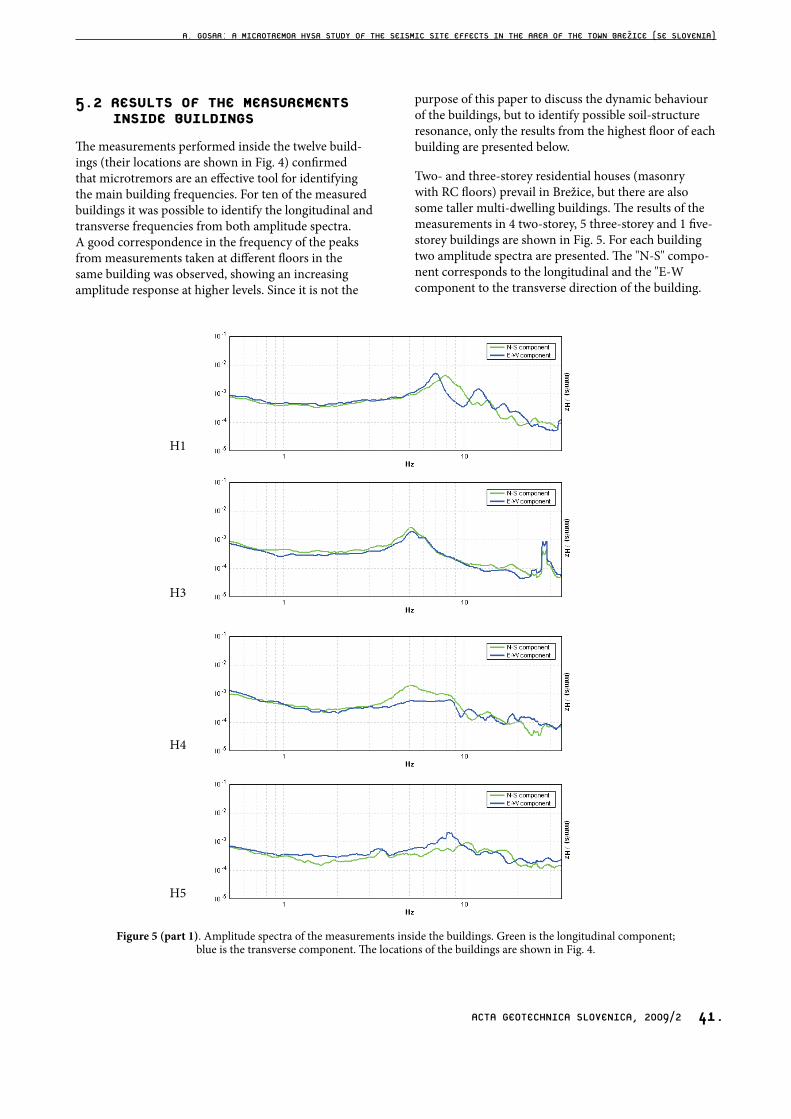
5.2 RESULTS OF THE MEASUREMENTS INSIDE BUILDINGS
The measurements performed inside the twelve build-ings (their locations are shown in Fig. 4) confirmed that microtremors are an effective tool for identifying the main building frequencies. For ten of the measured buildings it was possible to identify the longitudinal and transverse frequencies from both amplitude spectra. A good correspondence in the frequency of the peaks from measurements taken at different floors in the same building was observed, showing an increasing amplitude response at higher levels. Since it is not the
purpose of this paper to discuss the dynamic behaviour of the buildings, but to identify possible soil-structure resonance, only the results from the highest floor of each building are presented below.
Two- and three-storey residential houses (masonry with RC floors) prevail in Brežice, but there are also some taller multi-dwelling buildings. The results of the measurements in 4 two-storey, 5 three-storey and 1 five-storey buildings are shown in Fig. 5. For each building two amplitude spectra are presented. The "N-S" compo-nent corresponds to the longitudinal and the "E-W component to the transverse direction of the building.
Figure 5 (part 1). Amplitude spectra of the measurements inside the buildings. Green is the longitudinal component;blue is the transverse component. The locations of the buildings are shown in Fig. 4.
H1
H3
H4
H5
A. GOSAR: A MICROTREMOR HVSR STUDY OF THE SEISMIC SITE EFFECTS IN THE AREA OF THE TOWN BREZ̆ICE (SE SLOVENIA)

ACTA GEOTECHNICA SLOVENICA, 2009/242.
Figure 5 (part 2). Amplitude spectra of the measurements inside the buildings. Green is the longitudinal component;blue is the transverse component. The locations of the buildings are shown in Fig. 4.
H6
H7
H8
H9
H11
H12
A. GOSAR: A MICROTREMOR HVSR STUDY OF THE SEISMIC SITE EFFECTS IN THE AREA OF THE TOWN BREZ̆ICE (SE SLOVENIA)
ACTA GEOTECHNICA SLOVENICA, 2009/2 43.
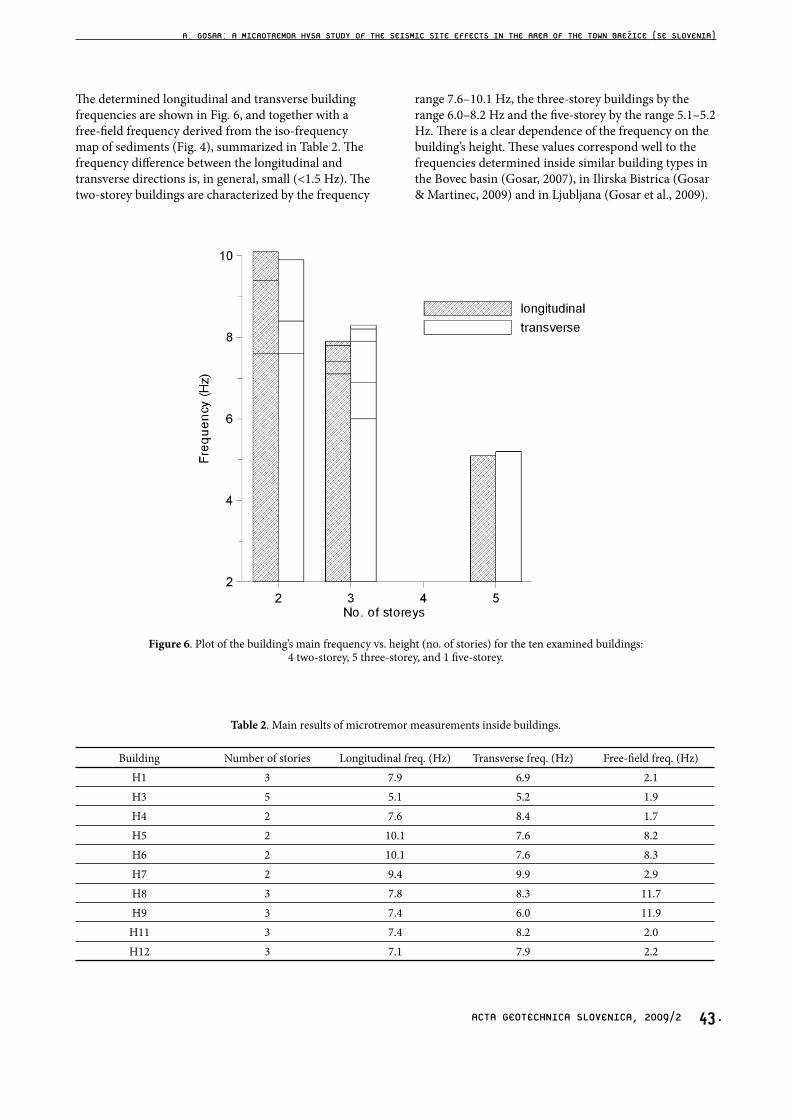
The determined longitudinal and transverse building frequencies are shown in Fig. 6, and together with a free-field frequency derived from the iso-frequency map of sediments (Fig. 4), summarized in Table 2. The frequency difference between the longitudinal and transverse directions is, in general, small (<1.5 Hz). The two-storey buildings are characterized by the frequency
range 7.6–10.1 Hz, the three-storey buildings by the range 6.0–8.2 Hz and the five-storey by the range 5.1–5.2 Hz. There is a clear dependence of the frequency on the building’s height. These values correspond well to the frequencies determined inside similar building types in the Bovec basin (Gosar, 2007), in Ilirska Bistrica (Gosar & Martinec, 2009) and in Ljubljana (Gosar et al., 2009).
Figure 6. Plot of the building’s main frequency vs. height (no. of stories) for the ten examined buildings:4 two-storey, 5 three-storey, and 1 five-storey.
Table 2. Main results of microtremor measurements inside buildings.
Building Number of stories Longitudinal freq. (Hz) Transverse freq. (Hz) Free-field freq. (Hz)H1 3 7.9 6.9 2.1H3 5 5.1 5.2 1.9H4 2 7.6 8.4 1.7H5 2 10.1 7.6 8.2H6 2 10.1 7.6 8.3H7 2 9.4 9.9 2.9H8 3 7.8 8.3 11.7H9 3 7.4 6.0 11.9
H11 3 7.4 8.2 2.0H12 3 7.1 7.9 2.2
A. GOSAR: A MICROTREMOR HVSR STUDY OF THE SEISMIC SITE EFFECTS IN THE AREA OF THE TOWN BREZ̆ICE (SE SLOVENIA)
ACTA GEOTECHNICA SLOVENICA, 2009/244.
Two buildings, which are practically identical and located one beside the other in the old town centre, show direct evidence of soil-structure resonance danger. Their longitudinal and transversal frequencies are 10.1 Hz and 7.6 Hz, respectively, and the free-field frequency at their location is 8.2–8.3 Hz. Both buildings are located in the transition zone for which a steep change of sedi-ment resonance frequency in the south-north direction is characteristic. Taking into account the whole range of the established buildings’ main frequencies, which is roughly 5.0–10.0 Hz, and by comparing this range with the iso-frequency map of sediments (Fig. 4), we can see that the possible areas of soil-structure resonance are relatively narrow and limited to the transition zone in the central part of the Brežice terrace. Similar values are also observed in the southern-most part of the surveyed area (Kusova vrbina on the middle Sava terrace). At the moment there are almost no buildings in this area. Since microtremor measurements also indicate a high imped-ance contrast with the bedrock in this area (the high amplitudes of the HVSR peaks), site effect should be considered in any future spatial planning in this region.
6 CONCLUSIONS
Since the geotechnical characteristics of sediments and their thickness are poorly known in the Brežice area, due to lack of borehole or geophysical data, microtremor investigations have proved to be an effective tool for assessing the fundamental frequency of these sediments. A large area can be surveyed with a dense grid of free-field measurements, and a sample of buildings can be measured in a reasonable time and with relatively low costs in order to detect the potential danger of soil-structure resonance.
A map of the fundamental frequencies of the sediments shows a distribution in a wide range 1.0–15.1 Hz. There is a good correlation of different frequency ranges with a known lithology and thickness of the Quaternary sedi-ments and lateral variations in the bedrock lithology. The high-frequency range is characteristic of the southern part of the town, where the sediments are thin (the Brežice terrace and the middle Sava terrace). The high amplitudes of the HVSR peaks indicate a great impedance contrast with the Sarmatian or Badenian bedrock. The northern part of the town is characterized by very low sediment frequencies, indicating thick Plio-Quaternary sediments. The low amplitude of the HVSR peaks indicates a low impedance contrast with Pontian marls in the bedrock or even a gradual increase of the shear-waves velocity and density with the depth within sediments due to compac-tion and the increasing confining pressure. The transition
between higher frequencies in the southern part and lower frequencies in the northern part is surprisingly steep.
The measurements inside buildings showed compa-rable longitudinal and transverse frequencies, as were obtained in similar building types in the Bovec basin (Gosar, 2007), Ilirska Bistrica (Gosar & Martinec, 2009) and Ljubljana (Gosar et al., 2009). There is a clear depen-dence of the main building frequencies on the building height. Since two- to five-storey buildings prevail in Brežice, the areas of potential danger for soil-structure resonance are limited to sediments in the frequency range 5–10 Hz. This frequency range was obtained in some areas of the southern part of the town. There are two direct observations of the potential soil-structure resonance among the surveyed buildings.
The only existing microzonation of Brežice (Vidrih et al., 1991) based on surface geological data does not distinguish significant variations in the sediment properties and thick-ness under the Brežice terrace revealed with this study, but classifies the whole Brežice terrace as the same VIII2 MSK category. According to our study there is a big difference in the expected site effects between the southern and northern parts of the town. The sediments in the northern part are characterized by a low seismic amplification at low frequencies, and thus a small danger of soil-structure resonance. On the other hand, the strong influence of sedi-ments on the seismic ground motion can be expected in the southern part of Brežice and on the middle Sava terrace (Kusova vrbina), which is not yet urbanised. In these areas the strong impedance contrast with the bedrock partly coincides with potential soil-structure resonance. Both can considerably enhance the damage in case of an earthquake.
To better understand the site effects in the Brežice area, additional geophysical measurements of the shear-waves velocity and the thickness of the sediments are recom-mended. In particular, the active and passive Multichan-nel Analysis of Surface Waves (MASW) method (Park et al., 2007) can provide valuable data on the shear-waves velocity at reasonable costs. On the other hand, knowl-edge of the soil-structure resonance can be enhanced with additional microtremor measurements inside buildings.
ACKNOWLEDGMENTS
The study was realized with the support of NATO SfP project 98057 "Assessment of seismic site amplification and seismic building vulnerability in FYR of Macedonia, Croatia and Slovenia" and research program P1-0011 financed by Slovenian Research Agency. The author is indebted to Jaka Žibrat and Pavel Osojnik for their help with the field measurements.
A. GOSAR: A MICROTREMOR HVSR STUDY OF THE SEISMIC SITE EFFECTS IN THE AREA OF THE TOWN BREZ̆ICE (SE SLOVENIA)
ACTA GEOTECHNICA SLOVENICA, 2009/2 45.
REFERENCES
Bard, P.Y. (1999). Microtremor measurements: a tool for site effect estimation? In: Irikura, K., Kudo. K., Okada, H., Sasatami, T. (eds.) The Effects of Surface Geology on Seismic Motion. Balkema, Rotterdam, pp. 1251-1279.
Bonnefoy-Claudet, S., Cornou, C., Bard. P.Y., Cotton, F., Moczo, P., Kristek. J., Fäh, D. (2006). H/V ratio: a tool for site effects evaluation. Results from 1-D noise simulations. Geophys. J. Int., 167, 827-837.
Castellaro, S., Mulargia, F. (2009). VS30 estimates using constrained H/V measurements. Bull. Seism. Soc. Am., 99/2A, 761-773.
EARS (2008). Earthquake catalogue for the years 567-2008. Environmental Agency of the Republic of Slovenia.
Gallipoli, M.R., Mucciarelli, M., Castro, R.R., Mochavesi, G., Contri, P. (2004a). Structure, soil-structure response and effects of damage based on observa-tions of horizontal-to-vertical spectral ratios of microtremors. Soil. Dyn. Earth. Eng., 24, 487-495.
Gallipoli, M.R., Mucciarelli, M., Eeri, M., Gallicchio, S., Tropeano, M., Lizza, C. (2004b). Horizontal to Vertical Spectral Ratio (HVSR) measurements in the area damaged by the 2002 Molise, Italy, earth-quake. Earthq. Spect., 20/1, 81-93.
Gosar, A., Božiček, B. (2006) Structural maps of seismic horizons in the Krško basin. RMZ - Materials and Geoenvironment, 53/3, 339-352.
Gosar, A. (2007). Microtremor HVSR study for assess-ing site effects in the Bovec basin (NW Slovenia) related to 1998 Mw5.6 and 2004 Mw5.2 earth-quakes. Eng. geol., 91, 178-193.
Gosar, A., Martinec, M. (2009). Microtremor HVSR study of site effects in the Ilirska Bistrica town area (S Slovenia). J. Earth. Eng., 13, 50-67.
Gosar, A., Rošer, J., Šket-Motnikar, B., Zupančič, P. (2009). Microtremor study of site effects and soil-structure resonance in the city of Ljubljana (central Slovenia). Bull. Earthq. Eng. (in press).
Lapajne, J. (1990) Veliki potresi na Slovenskem IV, Brežiški potres leta 1917. Ujma, 4, 72-75.
Lapajne, J., Šket-Motnikar, B., Zupančič, P. (2001). Design ground acceleration map of Slovenia. Potresi v letu 1999, 40-49.
Micromed (2005). Tromino user manual. Micromed, Treviso.
Mucciarelli, M., Monachesi, G. (1998). A quick survey of local amplifications and their correlation with damage observed during the Umbro-Marchesan (Italy) earthquake of September 26, 1997. J. Earth. Eng., 2/2, 325-337.
Mucciarelli, M., Gallipoli, M.R. (2001). A critical review
of 10 years of microtremor HVSR technique. Boll. Geof. Teor. Appl., 42, 255-266.
Mucciarelli, M., Contri, P., Mochavesi, G., Calvano, G., Gallipoli, M.R. (2001) An Empirical Method to Assess the Seismic Vulnerability of Existing Buildings Using the HVSR Technique. Pure. Appl. Geoph., 158, 2635-2647.
Nakamura, Y. (2000). Clear identification of funda-mental idea of Nakamura's technique and its applications. 12.Wprld Conference on Earthquake Engineering, Aucland.
Natale, M., Nunziata, C. (2004). Spectral amplification effects at Selllano, Central Italy, for the 1997-98 Umbria seismic sequence. Nat. Haz., 33, 365-378.
Park, C B, Miller, R D., Ryden, N. Xia, J., Ivanov, J. (2007). Multichannel analysis of surface waves (MASW)-active and passive method. The Leading Edge, 26/2, 303-308.
Panou, A.A., Theodulidis, N., Hatzidimitriou, P., Stylianidis, K., Papazachos, C.B. (2005). Ambi-ent noise horizontal-to-vertical spectral ratio for assessing site effects estimation and correlation with seismic damage distribution in urban envi-ronment: the case of city of Thessaloniki (Northern Greece). Soil. Dyn. Earth. Eng., 25/4, 261-274.
Parolai, S., Galiana-Merino, J.J. (2006). Effects of tran-sient seismic noise on estimates of H/V spectral ratios. Bull. Seism. Soc. Am., 96/1, 228-236.
Persoglia, S. (ed.) (2000). Geophysical research in the surroundings of the Krško NPP. Slovenian nuclear seismic administration, Ljubljana..
Ribarič, V. (1987). Seismological map of Slovenia for 500 years return period. Seismological survey of Slovenia, Ljubljana.
SESAME (2004). Guidelines for the implementation of the H/V spectral ratio technique on ambient vibrations: measurements, processing and inter-pretation. http://sesame-fp5.obs.ujf-grenoble.fr/Delivrables/Del-D23 HV_User_Guidelines.pdf.
Šikić, K., Basch, O., Šimunić, A. (1977). Osnovna geološka karta SFRJ 1:100.00, list Zagreb. Geologi-cal Survey of Sloveia, Ljubljana.
Yuen, K.V., Beck, J.L., Katafygiotis, L.S. (2002). Proba-bilistic approach for modal identification using non-stationary noisy response measurements only. Earth. Eng. Struct. Dyn., 31/4, 1007-1023.
Verbič, T. (2004) Stratigrafija kvartarja in neotektonika vzhodnega dela Krške kotline 1. del: stratigrafija. Razprave IV.raz SAZU, XLV-3, 171-225.
Vidrih, R., Godec, M., Lapajne, J. (1991). Potresna ogroženost Slovenije. Seismological Survey of Slovenia, Ljubljana.
A. GOSAR: A MICROTREMOR HVSR STUDY OF THE SEISMIC SITE EFFECTS IN THE AREA OF THE TOWN BREZ̆ICE (SE SLOVENIA)