Embed Size (px)
Citation preview

RP204
A METHOD OF MEASURING FRICTIONAL COEFFICIENTSOF WALK-WAY MATERIALS
By R. B. Hunter
ABSTRACT
This paper describes apparatus and methods for measuring coefficients of
friction of walk-way surface materials. Conditions of the surface which affect
the frictional coefficients of walk-way materials are examined, and data illustrat-
ing the precision obtainable by the methods described are given and discussed in
their relation to the slipping hazard in walk-ways.
CONTENTSPage
I. Introduction 329II. Purpose of the investigation 330
III. Materials investigated 330IV. Methods employed 330V. Preparation of worn surfaces 331
1. The wearing apparatus 3312. Wearing process 332
VI. Friction measurements 3331
.
Performance requirements of the apparatus 3332. Description of apparatus 3333. Friction test values 3334. Effect of smoothness of test surfaces 3345. Effect of area of contact and pressure between surfaces 334
VII. Standardization of surface conditions 3361. Smoothness of test soles 3362. Effect of different leathers 3373. Effect of humidity 3384. Temperature and humidity control 3405. Reproduction of test conditions 341
VIII. Simulated service conditions 3431. Friction measurements under simulated service conditions-- 3432. Test procedure on wet and oily surfaces 344
IX. Discussion of friction data 346X. Summary of conclusions 347
I. INTRODUCTION
Project A-22 of the American Standards Association deals with the
formulation of a safety code for walk-way surfaces. The sectional
committee, which was organized to prepare this code, found the avail-
able data on walk-way surfaces and materials to be inadequate for
the satisfactory formulation of a code, and appealed to the manufac-turers for assistance in this connection. In response to this request,
a manufacturers' subcommittee composed of a large group of manu-facturers and distributors of walk-way materials was formed, and
jjarrangements were made in July, 1924, for a research fellowship at
the National Bureau of Standards to conduct an experimental inves-
tigation of the frictional resistances of walk-way surface materials.
329

330 Bureau of Standards Journal of Research [voi.s
This investigation resulted in the development of an apparatus andprocess for preparing specimens of walk-way surface materials forfriction measurements and an apparatus and methods for measuringcoefficients of friction. A report of the investigation was submittedto the manufacturers' subcommittee in July, 1926.
Because of the incompleteness of the research it seemed advisablefor the Bureau of Standards to conduct a further independent investi-gation of the problem, which was made by the former research asso-ciate in 1928 and 1929.
II. PURPOSE OF THE INVESTIGATION
The purposes of the original investigation were to develop a satis-
factory method for measuring the frictional resistances of walk-waymaterials and to obtain data to aid the sectional committee in theformulation of a walk-ways safety code. The purposes of this paperare to describe the apparatus and methods developed in the earlier
research, to review after the lapse of considerable time the data andthe methods originally employed, and to examine these data as to
their usefulness as a basis of evaluating the effectiveness of variousmaterials in relation to the walk-ways safety problem.
III. MATERIALS INVESTIGATED
In the investigations of 1924-1926, friction measurements underdifferent conditions were made on 148 specimens of walk-way andflooring materials. Specimens of most of the materials extensively
used, as well as many less commonly employed in walk-way or floor
surfaces, were included in this list. Twenty-four specimens, coveringextreme ranges in hardness, smoothness, compressibility, absorptive
power, and other characteristics affecting the coefficient of friction
were chosen from these for the 1928-1929 investigation. In somecases two or more specimens of the same or of allied materials werechosen to afford a closer study of their coefficients of friction.
Each of the 24 specimens is designated in the tables by a letter.
These materials are roughly grouped according to their origin andphysical characteristics as follows: Specimens C, D, E, F, G, I, and Xare smooth-faced natural stone products, such as slate, marble, andtravertine, with the exception of one specimen of vitrified tile; speci-
mens Q, R, and S are wood, including smooth maple, larch, and yellowpine flooring; specimens T, W, P, and U are artificial stone products,
some containing hard abrasive in the mixture; specimens A, B, H, J,
and K are smooth-faced somewhat compressible manufactured prod-
ucts, such as rubber, cork carpet, and linoleum; specimens L, M, N,O, and V are metal products having ridged or otherwise roughenedsurfaces, some containing embedded hard abrasive and others present-
ing a clear metal surface.
IV. METHODS EMPLOYED
The safety or the slipping hazard offered by any given walk-waysurface at a given time depends among other factors on the friction
between the shoe sole and the walk-way surface at that time. Thecoefficient of friction is a direct measure of the resistance to slipping.
Hunter] Frictional Coefficients of Walk-Way Materials 331
The coefficient of friction is defined as the ratio of the force, F,
required to slide one surface on the other, to the force, Fr
,pressing the
two surfaces together, or F/F'. When F is the force required to start
the motion, F/F' is the static coefficient of friction ; and when F is
the force required to maintain a uniform motion, F/F' is the kinetic
or dynamic coefficient of friction. In general, the static friction is the
greater. The kinetic friction on some materials increases considerably
with the velocity and may be greater than the static friction.
The law of friction may be stated as follows: The coefficient of
friction between two given surfaces is a constant which is independent(within limits) of the area of contact and the force pressing the surfaces
together. It is to be understood, however, that this constant applies
only to two given surfaces. Another coefficient of friction may be
obtained with other surfaces of the same materials.
There are a number of variable conditions which affect the coefficient
of friction between a shoe sole and a walk-way surface—the smooth-ness of the shoe sole and the walk-way surface, the dryness of the twosurfaces, and the presence of other substances between the two sur-
faces, as dirt, water, oil, etc. It consequently seemed advisable to
measure the coefficients of friction of a variety of walk-way surface
materials (1) under a standard or controlled surface condition and(2) under surface conditions simulating as nearly as possible actual
service conditions, as a basis for determining the usefulness of friction
measurements under controlled conditions.
For this purpose coefficients of friction were measured as follows:
(1) Between clean, dry, oak-tanned leather soles and clean, dry, wornspecimens of the walk-way materials; (2) between clean, wet, oak-tanned leather soles and clean, wet, worn specimens of the walk waymaterials; (3) between dirty, wet, worn specimens of the walk-waymaterials and (a) dirty, wet, oak-tanned leather soles and (b) dirty,
wet, rubber soles; and (4) between oily, worn specimens of the walk-way materials and (a) oily, oak-tanned, leather soles and (6) oily
rubber soles.
V. PREPARATION OF WORN SURFACES
It became evident from an examination of the surfaces of both newand service-worn specimens that friction measurements on new orunworn specimens of walk-way materials would give little indicationof the relative antislip values of the materials in actual service. Somematerials become smoother and some rougher under footwear. Mea-surements on the worn surfaces are therefore essential.
The time required to secure service-worn specimens and the un-certainty regarding their definite identification if taken from an oldwalk way render any attempt to obtain service-worn specimens for
general tests impractical. An apparatus and process for producingaccelerated wear in the laboratory are therefore essential.
1. THE WEARING APPARATUS
The apparatus shown in Figure 1 was constructed after preliminary'tests with different abrasives and processes. It consists of a motor-driven reciprocating arm carrying two square frames into whichleather-soled, weighted shoes are loosely fitted. By means of a
332 Bureau of Standards Journal of Research [vol. s
ratchet the shoes are slowly rotated. The reciprocating arm makes34 transits per minute, and the shoes one complete revolution in 13transits. The resultant motion is a slide and twist with a slight
rocking motion of the shoe on the walk-way surface with each stroke.
Dry sand (50 to 100 mesh) is fed slowly through two holes in eachshoe, 4 inches apart. The rotation tends to keep the sand evenlydistributed and to prevent scoring. It will be observed that while50 to 100 mesh sand is fed continuously into the machine, the actualabrasive between the surfaces has somewhat different properties.
The sand remains between the wearing surfaces for a time, becomesworn and crushed in the process, and mixes with the particles wornfrom the surfaces. The actual abrasive in use at any time is amixture of fresh and crushed sand and dust from the sand, leather
sole, and the walk-way material. Owing to the dust formed, it is
advisable to have the abrasive machine inclosed in a dust-tightcompartment with the motor and reducing gear outside.
2. WEARING PROCESS
The wearing process to which the walk-way materials were sub-jected may be divided into three parts:
1. All specimens were subjected to periods of wear with the abra-sive described such that the surfaces were abraded by approximatelyequal amounts (about one-sixteenth inch in depth). Depending onthe resistance of the materials to abrasion, these periods of wearvaried from 10,000 to 80,000 transits of the shoe. Each specimen wasrotated through 180° in the middle of the process to insure moreuniform wear.
2. Following part 1, the sand feed was removed and the sandand dirt wiped from the specimen and the shoe. The specimenswere then subjected uniformly to 1,000 transits of the shoe withoutany abrasive. Each specimen was again rotated through 180° in themiddle of the process.
3. The specimens were then cleaned and finished by hand, as
follows: They were washed under running water, wiping alternately
with a wet cloth and the beveled edge of a picee of chrome-tannedsole leather to remove any embedded sand and encrusted dirt. Theywere then dried, and when thoroughly dry were dressed by rubbingfirst with a piece of No. IK sandpaper, then with a piece of No.sandpaper. About 25 strokes in each of two directions at right
angles with the sandpaper held on the open palm of the hand weregiven to each specimen with each kind of sandpaper. Finally,
immediately before the friction measurement the specimen wasrubbed in each of two directions with the beveled edge of a piece of
oak-tanned sole leather and wiped with a dry cloth.
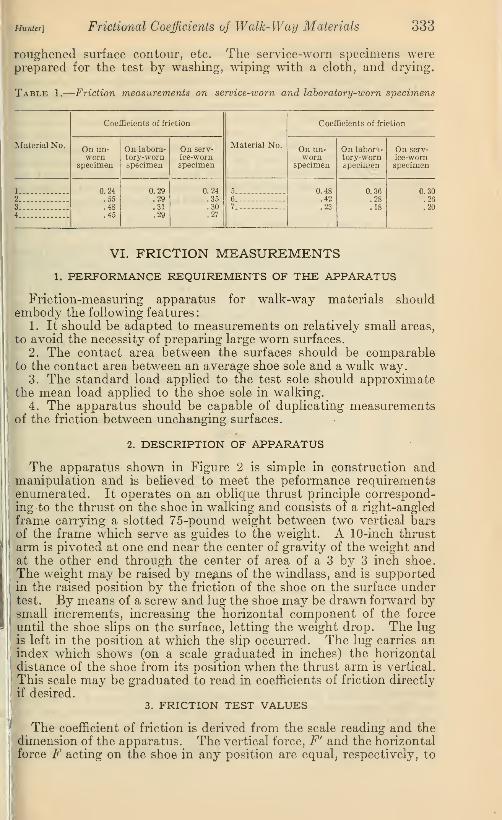
Trial specimens of several walk-way materials were prepared bythese processes and compared with service-worn specimens of thesame material by means of friction measurements. Some of these
friction measurements are given in Table 1. It will be observedthat when the coefficient of friction of the service-worn and labora-
tory-worn specimens are compared with that of the unworn specimenthe change is usually comparable in amount. This is believed to bethe criterion by which the suitableness of the process should bejudged. These seven materials cover extreme ranges in hardness,

B. S. Journal of Research, RP204
Figure 1.
—
Apparatus for preparing worn specimens
A and B, rubber tubes leading to sand hopper.
B. S. Journal of Research. RP204
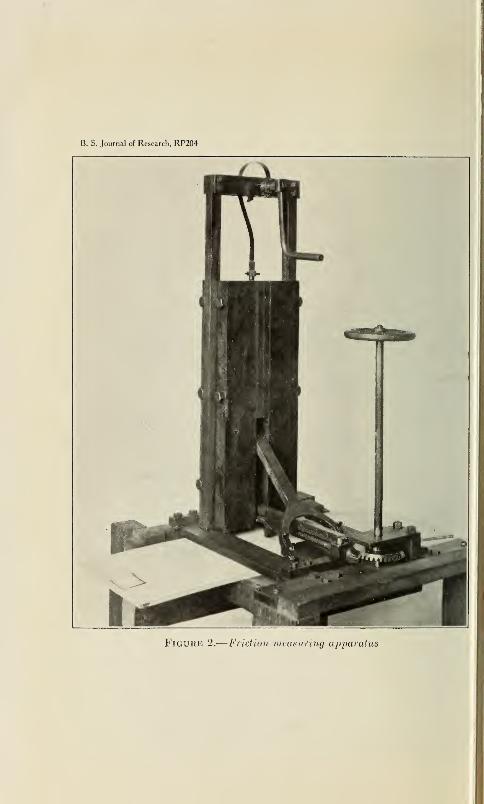
FIGURE 2.'
—
Friction measuring apparatus
Hunter] Frictional Coefficients of Walk-Way Materials 333
roughened surface contour, etc. The service-worn specimens wereprepared for the test by washing, wiping with a cloth, and drying.
Table 1.
—
Friction measurements on service-worn and laboratory-worn specimens
Coefficients of friction
Material No.
Coefficients of friction
Material No. On un-worn
specimen
On labora-tory-wornspecimen
On serv-ice-wornspecimen
On un-worn
specimen
On labora-tory-wornspecimen
On serv-ice-wornspecimen
1 0.24.55.48.45
0.29.29.31.29
0.24.35.30.27
5 0.48.42.23
0.36.28.18
0.302 .. 6 .263 7 .204
VI. FRICTION MEASUREMENTS1. PERFORMANCE REQUIREMENTS OF THE APPARATUS
Friction-measuring apparatus for walk-way materials shouldembody the following features
:
1. It should be adapted to measurements on relatively small areas,
to avoid the necessity of preparing large worn surfaces.
2. The contact area between the surfaces should be comparableto the contact area between an average shoe sole and a walk way.
3. The standard load applied to the test sole should approximatethe mean load applied to the shoe sole in walking.
4. The apparatus should be capable of duplicating measurementsof the friction between unchanging surfaces.
2. DESCRIPTION OF APPARATUS
The apparatus shown in Figure 2 is simple in construction andmanipulation and is believed to meet the peformance requirementsenumerated. It operates on an oblique thrust principle correspond-ing to the thrust on the shoe in walking and consists of a right-angled
frame carrying a slotted 75-pound weight between two vertical barsof the frame which serve as guides to the weight. A 10-inch thrust
arm is pivoted at one end near the center of gravity of the weight andat the other end through the center of area of a 3 by 3 inch shoe.
The weight may be raised by me#ns of the windlass, and is supportedin the raised position by the friction of the shoe on the surface undertest. By means of a screw and lug the shoe may be drawn forward bysmall increments, increasing the horizontal component of the force
until the shoe slips on the surface, letting the weight drop. The lugis left in the position at which the slip occurred. The lug carries anindex which shows (on a scale graduated in inches) the horizontal
distance of the shoe from its position when the thrust arm is vertical.
This scale may be graduated to read in coefficients of friction directly
if desired.3. FRICTION TEST VALUES
The coefficient of friction is derived from the scale reading and thedimension of the apparatus. The vertical force, F' and the horizontalforce F acting on the shoe in any position are equal, respectively, to

334 Bureau of Standards Journal of Research [Vol. 5
the vertical and horizontal components of the thrust transmitted to
the shoe. In this case the coefficient of friction, or the ratio F/F', is
equal to the tangent of the angle the thrust arm makes with the verti-
cal at the point of slipping. The sine of this angle is one-tenth of thescale reading in inches. The tangent of the angle—that is, the coeffi-
cient of friction—may be obtained from a table of natural sines andtangents, or a table giving the coefficient of friction corresponding to
any scale reading may be readily constructed. In making themeasurements which follow, the reading on the scale graduated in
0.05-inch divisions was taken to the nearest scale division, and thecorresponding natural tangent representing the coefficient of friction
was recorded to the nearest or 5 in the third decimal place.
4. EFFECT OF SMOOTHNESS OF THE TEST SURFACES
The data in Table 2 were obtained from specimens freshly dressedbut not rubbed with oak-tanned sole leather as previously describedfor the final dressing process. Twelve measurements were made oneach specimen without redressing either the walk-way specimen or the
test sole. It will be observed that when repeated measurements onthe same specimen are thus made there is a continuous and fairly
regular decrease in the coefficient of friction tending toward a constantiniriimum value. This decrease is evidently due to the smoothingof either the surface of the specimen or the surface of the test sole or
both. For this reason a final dressing of the walk-way surface withleather and a standard preparation of the test sole is advised beforebeginning the friction measurements.
Table 2.
—
Typical values for repeated measurements
Coefficients of friction
Measurement No.Leatheron leather
LeatheronC
Leatheron J
Leatheron L
Leatheron V
Initial _. - -_ - _. - 0.380.355.350.345
.335
.330
.330
# .325
.325
.320
.320
.320
0.270.220.200.190
.185
.180
.175
.170
.165
.165
.160
.160
0.480.425.405.385
.375
.365
.365
.360
.360
.360
.360
.360
0.195.170.160.155
.150
.145
.140
.140
.140
.140
.140
.140
0. 4052__. .3203 .2904 .285
5 .2806 . .. .2707 .2608 .260
9 . .25010 .25011 .25012 .250
5. EFFECT OF AREA OF CONTACT AND PRESSSURE BETWEENSURFACES
While the law of friction states that the coefficient of friction
between the same two surfaces is independent of the area of contactand the force pressing the surfaces together, some variation may beexpected if these factors vary widely, and marked compression orabrasion of the materials occurs. The data in Tables 3 and 4 showthat errors due to changes in area and load are negligible in comparison
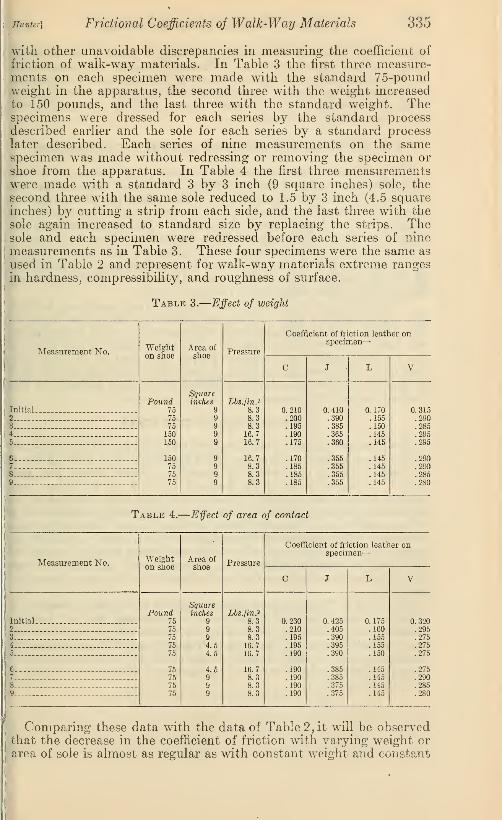
Hunter] Friction al Coefficients of Walk-Way Materials 335
with other unavoidable discrepancies in measuring the coefficient of
friction of walk-way materials. In Table 3 the first three measure-ments on each specimen were made with the standard 75-poundweight in the apparatus, the second three with the weight increased
to 150 pounds, and the last three with the standard weight. Thespecimens were dressed for each series by the standard processdescribed earlier and the sole for each series by a standard process
later described. Each series of nine measurements on the samespecimen was made without redressing or removing the specimen or
shoe from the apparatus. In Table 4 the first three measurementswere made with a standard 3 by 3 inch (9 square inches) sole, the
second three with the same sole reduced to 1.5 by 3 inch (4.5 squareinches) b}>' cutting a strip from each side, and the last three with the
sole again increased to standard size by replacing the strips. Thesole and each specimen were redressed before each series of ninemeasurements as in Table 3. These four specimens were the same as
used in Table 2 and represent for walk-way materials extreme rangesin hardness, compressibility, and roughness of surface.
Table 3.
—
Effect of weight
Measurement No.Weighton shoe
Area of
shoePressure
Coefficient of friction leather onspecimen
—
C J L V
i
Initial... ...
Pound75
7575
150150
15075
75
75
Squareinches
9
9
99
9
9
999
Lbs./in. 2
8.38.38.3
16.716.7
16.78.38.38.3
0.210.200.195.190.175
.170
.185
.185
.185
0.410.390.385.365.360
.355
.355
.355
.355
0. 170.155.150.145.145
.145
.145
.145
.145
0.3152 .2903 : .2854 .2955 .295
6 .2907 . .2908... .2859 .280
;ABLE 4.-—Effect of area of contact
Measurement No. Weighton shoe
Area of
shoePressure
Coefficient of friction leather onspecimen
—
C J L V
Initial..Pound
75
75
75
75
75
75
75
75
75
Squareinches
9
9
9
4.54.5
4.59
99
Lbs./in*8.38.38.316.716.7
16.78.38.38.3
0.230.210.195.195.190
.190
.190
.190
.190
0.425.405.390.395.390
.385
.385
.375
.375
0.175.160.155.155.150
.145
.145
.145
.145
0.3202 .2953 .2754 .2755 .275
1 .2757 .290
J 8 . .285- 9 .280
Comparing these data with the data of Table 2, it will be observed.that the decrease in the coefficient of friction with varying weight orarea of sole is almost as regular as with constant weight and constant

336 Bureau of Standards Journal of Research [voi.s
area of sole, and that if the initial readings in Table 2 are discardedthere is a fairly close agreement. The area of contact and the pressuredo have some effect on the coefficient of friction when compressionand abrasion are factors, but the effect is negligible in comparisonwith the variations due to other causes, such as the inability to
reproduce surface conditions.
VII. STANDARDIZATION OF SURFACE CONDITIONS
We have stated that smoothness, cleanness, and dryness are factorsthat affect the value of the coefficients of friction between two sur-
faces, and therefore it is necessary to standardize the test surfaces in
respect to these factors in order to obtain results reproducible at
another time with any degree of precision. This applies to both sur-
faces, the surface of the sole as well as the surface of the specimen.Smoothness is a relative term. It is difficult to define exact degrees
of smoothness and to reproduce them for standard tests. Coefficients
of friction measured on relatively smooth surfaces will be more con-sistent than those measured on rougher surfaces.
The process previously described for preparing specimens for fric-
tion measurements does not exactly reproduce the same degree of
smoothness even in the same walk-way material, but no better meanshas been discovered or proposed. The smoothness of the test sole
can be standardized to a greater degree than that of the walk-wayspecimen. The test sole may be dressed by a standard process until
it gives a selected standard coefficient of friction between it andanother surface of the same material as the test sole.
1. SMOOTHNESS OF TEST SOLES
The standard adopted for oak-tanned leather soles in these measure-ments was obtained by dressing the leather sole on a piece of No.sandpaper until a comparatively smooth, velvety surface was pre-
sented. Another piece of the leather, about 8 by 10 inches, wasdressed in the same manner. The test sole was then operated in the
friction-measuring apparatus until an approximately constant valueof the coefficient of friction, 0.310, between leather and leather wasobtained. The number of operations in the friction apparatus re-
quired to reach 0.310, the value of the coefficient of friction selected
as indicating standard smoothness, depends on the smoothness of the
initial dressing and apparently to some extent on the temperature andhumidity.The data in Table 5 give the coefficients of friction obtained in
successive operations in typical runs in reducing the test sole to
standard smoothness at different temperatures and relative humidi-ties. In addition to the data for individual runs, the average initial
readings and the average number of operations in the friction-measur-
ing apparatus required to reach standard smoothness in 10 dressings
of the sole are given.

Hunter] Frictional Coefficients of Walk-Way Materials 337
j
J
<
Initial.
2
Table 5.
—
Coefficients of friction leather on leather obtained in reducing test soles
to standard smoothness
Readings
Temperature, °F.
65 80 65 80 85
Relative humidity (per cent)
45 45 80 80 85
Humidity (in grams per cubic foot)
3.1 4.9 5.4 8.8 10.8
Coefficient of friction
0.375.355.345.335.330
.330
.325
.325
.320
.320
.320
.320
.315
.315
.315
.315
.315
.310
Oil
Average initial reading of 10 series
Average number operations to reach 0.310, 10series
.376
18.1
0.365.350.340.335.330
.330
.325
.325
.320
.320
.320
.315
.315
.315
.310
,372
16.1
0.360.345.335.330.325
.325
.320
.320
.315
.315
.315
.31»
.310
304
10.3
0.355.335.325.320.320
.315
.315
.315
.310
359
7.6
0.355.335.330.325.320
.320
.315
.318
.315
.310
.354
6.4
It is interesting to note that in these data the coefficient of friction
between leather and leather apparently decreases with increase in
absolute humidity. This is indicated both by the decrease in thecoefficient of friction in the initial operation and by the decrease in
the number of operations required to reach a value of 0.310, as theabsolute humidity increases. This is exactly opposite to the effect
of humidity on the coefficients of friction between leather and mostwalk-way materials.
The process just described was employed in all later measurementsunder dry conditions unless otherwise stated, and the test sole wasconsidered to have reached the standard condition of smoothnesswhen the first reading giving a value of 0.310 for the coefficient of
(friction of leather on leather was reached. While it does not insurejan absolute standard of smoothness it is the best method discovered.-t
2. EFFECT OF DIFFERENT LEATHERS
I' The data in Table 6 illustrate the variation in the standard sole
that may be expected due to the use of different test soles. Sole 4was a clear firm piece of oak-tanned sole leather in excellent condi-
i tion ; sole 1 was a firm, clear piece of oak-tanned sole leather worn in

338 Bureau of Standards Journal of Research [Vol. 6
tests until it showed a slightly hardened spot on one edge; sole 2 wasa firm, clear piece of oak-tanned sole leather which had been worn in
tests until it resisted the prescribed velvety finish; and sole 3 was a
clear piece of oak-tanned sole leather slightly flanky in appearanceand slightly worn in previous tests. These measurements were madeat 70 ±2° F. and a relative humidity of 65 ±2 per cent. The walk-way specimens had been stored in the laborator}^ for about tw^o yearsafter they had been dressed for the previous tests. They were washed,cleaned, and dried for these measurements, but their surfaces
were not redressed, and for this reason some of the specimens givecoefficients of friction higher or lower than obtained on the samespecimen when freshly dressed by the standard process. The soles
were freshly dressed and brought to standard smoothness for eachtest. The measurements were made on each specimen from left to
right as recorded, and only one measurement with each sole was madeon the same specimen in. order to avoid the smoothing effect of re-
peated measurements. For this reason the values are higher thanthe average when a series of several tests are made on the same speci-
men without redressing the specimen and sole.
Table 6.—Effect c/ different leathers
Specimen
Coefficients of friction with sole
No. 4 No. 1 No. 2 No. 3 No. 4
J 0.405.310.215.220.245
.295
.460
.450
.485
0.410.310.210.215.240
.285
.455
.505
.485
0.435.310.225.225.255
.325
.435
.475
.490
0.420.315.230.210.245
.290
.450
.460
.465
0.425.315A
C .225L„ .215
.245
.305
.460
.450
.465
G._-
PQ
U
The duplicate measurements made on the same specimen with the
same piece of leather (sole 4) differ from the mean by amounts vary-ing from to^about 5 per cent. Of the 27 measurements made withsoles 1, 2, an'd 3 only two measurements show a greater difference,
and these two were obtained with soles which had been previouslyrejected as standard because of obvious defects. It therefore seemsreasonable to assume that if the soles are carefully selected from firm,
clear pieces of leather the differences in the frictional properties of
oak-tanned sole leathers are negligible in comparison with the me-chanical differences in the smoothness of the surface obtainable by a
standard process of dressing.
3. EFFECT OF HUMIDITY
The effect of temperature and relative humidity or of absolutehumidity on the coefficient of friction has been pointed out. Thedata in Table 7 show the variation in the coefficient of friction whichmay occur on clean dry walk-way surfaces due to ordinary atmos-pheric changes in temperature and humidity in the interior of build-
These measurements were taken in the order of increasing

Hunter] Frictional Coefficients of Walk-Way Materials 339
absolute humidity without redressing the walk-way specimen. Thesole was redressed and brought to the standard value, 0.31 (leather
on leather) before each measurement.
Table Variation in coefficients o) friction with temperature and humidity
Specimen
Temperature (°F.)
65 80 65 80 85
Humidity (per cent)
45 45 80 80 85
Humidity (in grams per cubic foot)
3.1 4.9 5.4 8.8 10.8
Increase in moisture (per cent)
61 78 187 258
J.H.A.B.C.
D.E.F.X.I.
wp.0.ML.T.G_Q-
Coefficients of friction
0.445 0.450 0.485 0.435.325 .345 .355 .410.290 .315 .320 .355.305 .330 .345 .375.210 .215 .225 .240
.195 .205 .310 .225
.195 .200 .210 .265
.195 .200 .210 .230
.160 .165 .170 .195
.295 .315 .320 .320
.200 .215 .245 .265
.315 .285 .320 .340
.275 .260 .255 .310
.275 .260 .305 .315
.225 .235 .250 .285
.225 .245 . 255 .305
.235 .235 .2G0 .285
.295 .295 .320 .290
0.430.495.505.455
285290255230360
275390365340
315385315295
Of these specimens all except two show a marked increase in thecoefficients of friction with increase in the absolute humidity. Thetwo exceptions—one rubber tile and one wood flooring—show someindication of the opposite effect which, however, may be partly dueto the smoothing effect of repeated measurements.The measurements were made from left to right on each specimen
without redressing it, in order to avoid erratic changes. Table 8gives data for 5 specimens, 2 of rubber tile and 3 of wood, in whichthe measurements were made (a) from left to right as before in the
order of increasing humidity, and (b) from right to left in the orderof decreasing humidity, all without redressing the specimen. Themean of the two measurements at the same temperature and humidityshould at least partially eliminate or average the smoothing effect.
These rubber specimens were rubbed to a smoother finish than for
the previous measurements of Table 7 and for that reason the coeffi-
cients of friction in Table 8 are generally lower.
118793°—30 9

340 Bureau of Standards Journal of Research
Table 8.
—
Effect oj temperature and humidity
[Vol.
Temperature (°F.)
65 80 65 80 85
Specimen Humidity (per cent)
45 45 80 80 < 85
Coefficients of friction
J (a) 0.325.345
0.345.325
0.325.320
0.320.285
0.660J (6) .720
.335 .335 .322 .302 690
K (a) . .375.350
.3R5
.320.350.290
.335
.290425
K (6) 380
.362 .342 .320 .312 .402
Q (a) .295.290
.295
.285.320.280
.290
.285.295
Q (6) .295
.292 .290 .300 .287 295
R (a) .320.345
.345
.335.350.325
.350
.335.355
R (6) .350
.332 .340 .337 .342 .352
S (a) .290.295
.305
.280.320.270
.305
.280.295
S (fe) .295
.292 .292 .295 .292 .295
Judging from the data in Tables 7 and 8 there is no regular increase
or decrease in the coefficients of friction of such materials as rubberand wood with increasing humidity.
There is one marked difference in the data on rubber in Tables 7
and 8 which is worthy of note and comment. It will be observed in
Table 8 there is an abrupt rise in the coefficients of friction at 85° F.
and 85 per cent relative humidity, more marked on specimen J thanon specimen K, which is not shown in the data of Table 7. This is
probably due to a softening of the material under those conditions.
In fact, specimen J had a sticky feeling when the exceptionally highcoefficients of friction were obtained. Other measurements made onspecimens of rubber at the same and higher temperatures and humidi-ties gave the same kind of erratic results.
There is no apparent explanation for this change in friction withchange in humidity, and speculation regarding it seems to lead to nodefinite conclusion. Similar phenomena are observed in the behaviorof brake bands, belts, and such devices in which the efficiency of
operation depends on friction. The data show clearly, however, the
necessity of controlling the temperature and humidity within rathernarrow limits of variation, if reproducible values of the coefficient of
friction are to be obtained.
4. TEMPERATURE AND HUMIDITY CONTROL
The data in the preceding Tables 7 and 8 and in Tables 9 and 10
following were made in a chamber in which the temperature washeld constant within ±2° F. and the relative humidity within ±2

Hunter] Frictional Coefficients of Walk-Way Materials 341
per cent of the desired selected conditions. The walk-way speci-
mens and the test soles were stored under each selected condition
for at least four hours befoie the measurements were made. Noregular change was detected in the coefficients of friction of any-
material taken from relatively dry storage and stored for that length
of time under standard conditions, and four hours is believed to besufficient time in which to attain a fairly constant condition in the
surface layer.
5. REPRODUCTION OF TEST CONDITIONS
The data in Table 9 indicate the probable precision in friction
measurements attainable by the methods described. These measure-ments were made on specimens prepared by the standard process
previously desciibed. Each specimen was subjected to part 3 of the
process, hand dressing, immediately before starting each series of
measurements. The sole was redressed and brought to the selected
standard coefficient of friction of 0.31 on leather immediately before
each series. Five successive measurements were made in each series
without redressing the specimen or sole. All measurements weremade at 70° ± 2° F. and 65 ± 2 per cent relative humidity after thesole and specimen had been stored for at least four hours under thatcondition. The average for each series and the general average of
these for each material are given.
Table 9. -Friction measurements at 70°±2°F. and relative humidity of 65'+ 2-per cent
Specimen Reading
Coefficients of friction
Series 1 Series 2 Series 3 Series 4Generalaverage
X ... 1
2
3
4
0.205.170.165.160.160
0.195.170.160.155.155
0.195.165.155.150.150
0.205.180.165.165.160
X...XXX 5
Average ._ .172 .167 .163 .175 0.169
1C .205.170.160.155.150
.200
.165
.165
.165
.165
.205
.170
.160
.160
.160
.200
.170
.160
.160
.160
c 2
3
4
c_cc . 5:
Average .168 .172 .171 .169 .170
1
2
N..__ .190.160.140.135.135
.170
.135
.125
.125
.125
.140
.135
.130
.130
.130
.145
.135
.130
.130
.130
NN 3
N 4 ..
N 5...
Average .154 .136 .133 .134 139
L 1
2 . ..
.180
.155
.140
.135
.130
.175
.160
.155
.150
.140
.195
.160
.150
.145
.145
.175
.155
.145
.135
.130
L .
L 3
L 4
51 L1
Average .148 .156 .159 .148 . 153
Q 1 .265.245.240.235.235
.265
.245
.240
.240
.230
.265
.250
.250
.240
.235
.250
.245
.235
.230
.230
Q 2 ...k Q 3
4
5
Average .244 .245 .248 .238 .244

342 Bureau of Standards Journal of Research [Vol. 5
Table 9.
—
Friction measurements at 70° ±2° F. and relative humidity of 65+2per cent—Continued
Specimen Reading
Coefficient of friction
Series 1 Series 2 Series 3 Series 4Generalaverate
A._ 1
A 2
A 3
A 4
A 5
J_„ 1
J . 2
J 3
J 4
J 5
u 1
U 2
XT 3
XT 4
XT . 5
v.. 1
V 2
V 3
V 4
v. 5
Average
0.275.270.265.265.265
435405390385385
400
415380360360350
373
3402952S0270265
290
0.270.270.270.270.270
270
.440
.400
.380
.365
.365
450385365350345
379
385330300285275
317
0.280.270.270.270.270
272
.450
,405
.385
.375
,365
396
.450
,395
,370
,365,360
,360
,310
,290
,285,280
305
0.285.280
280
281
,425
,375
,355
,345
,335
.367
.440
.390
.360
.350
.345
377
.355
.310
.290
.270
.270
.300
0.273
,388
303
No attempt is made to predict from these data what precision canbe obtained in standardized commercial friction tests on walk-waysurface materials. Some indication of the agreement possible is
given by a comparison of the measxirements recorded in Table 9,
with measurements made on the same specimens in 1926. (See
Table 10.)
Specimens L and N are omitted from Table 10. The worn sur-
faces of these specimens were slightly coated with an oxidized film in
1926 which had been removed in redressing them for the 1928 meas-urements, and for this reason the surfaces are not considered com-parable. Since only three measurements were made on each of the
specimens in 1926, the averages given for the 1928 measurements in
Table 10 are for the first three measurements in each series.
Table 10.
—
1926 and 1928 friction measurements
Average coefficents of friction, 1928
Specimen
Series 1 Series 2 Series 3 Series 4
Grandaverage,
/ 1928
Average,1926
X... 0.180.178.250.270.410.385.305
6.175.174.250.270.407.400.338
0.173.178.255.273.413.405.320
0.183.183.243.283.385.397.318
0.178.181.250.274.403.397.320
0.163
C .167
Q. .220
A .297
J „ .408
XT .467
V .267

Hunter] Fractional Coefficients of Walk-Way Materials 343
While the averages of the 1926 and 1928 measurements are notstrictly comparable, since there was only one series of three measure-ments on each specimen in 1926 and four series of three measurementseach in 1928, they give the only information available as to whatagreement may be expected in the results of tests made at different
times. Considering that in commercial tests different specimens of
each material and different observers will be employed, as close anagreement can not be expected, unless the method is further devel-oped and standardized.
VIII. SIMULATED SERVICE CONDITIONS
There is no direct relation between the coefficients of friction onclean, dry surfaces and on the same materials under various actualservice conditions. Few, if any, walk-way materials are dangerouslyslippery when clean and dry, but walk-way surfaces in actual use are
not clean in the sense the term has been employed in this paper andare subject to ordinary atmospheric changes in humidity.
It is common experience that combinations of dirt and water orother fluids make some walk-way surfaces slippery. There is noevidence that any particular combination of dirt and water producesthe most slippery surface alike on all walk ways or even on thosemost easily affected by such conditions. Consequently, there seemsto be no possibility of selecting a single or even a limited number of
actual service conditions which would adequately represent the var-
ious possible conditions on walk-way surfaces and which could bedefined and accurately reproduced.The only practical procedure seems to be to produce simulated
service conditions by some selected or standard process and to measureand compare the coefficients of friction given by such surfaces.
1. FRICTION MEASUREMENTS UNDER SIMULATED SERVICE CONDI-TIONS
The measurements recorded in Tables 11 to 13, inclusive, wereobtained in 1926. These data are for specimens for which other dataare given in preceding tables, and were selected as covering extremeranges of roughness, hardness, and compressibility and as being fairly
representative of general results obtained for wet and oily surfaces.
For the measurements on clean, wet surfaces the worn part of the
specimen was wiped with a saturated cloth until a film of water stoodover the entire worn surface. The specimen was then clamped in
the apparatus and the friction measurement immediately made.For the measurements on dirty, wet surfaces the same worn spec-
imens were used and prepared as follows: A bag formed of four ply
of cheesecloth was filled with the dust worn from the walk-way mate-rials and leather in preparing the worn specimens, immersed in avessel of water and worked about until a distinct residue formed in
the bottom of the vessel. The worn part of the specimen and the
test sole were then treated with the saturated bag lifted from the
dirty water, as described for the clean, wet measurements.For measurements on oil surfaces the specimens and soles were
prepared in the same manner as for the measurements on clean, wetsurfaces except that oil (medium Polarine) was used in place of water.

344 Bureau of Standards Journal of Research [vol. 5
For all measurements the test soles were prepared in the samemanner as for measurements on dry surfaces up to the point of
applying the water or oil, as the case might be. Immediately beforethe measurement on the specimen the sole was saturated with wateror oil and passed over a piece of the same material as the sole, wetor oiled in the same manner as the test specimen and the sole.
The results of the friction measurements indicate that theseprocesses do not produce the same surface conditions, even on thesame specimens, but no better method has been discovered orsuggested.
2. TEST PROCEDURE ON WET AND OILY SURFACES
It was observed when the coefficients of friction on wet or oily
surfaces were measured that if the measurement was made as
specified for a dry surface, a much higher value of the coefficient of
friction would usually be obtained than on a clean, dry surface.
This is especially marked on smooth-faced plane surfaces. It is
less marked on ridged or otherwise roughened surfaces. A similar
effect may be observed in walking over some wet surfaces. Frequentlydifficulty is experienced in obtaining a foothold in walking over a wetsurface, but after firm contact between the shoe sole and the walk-waysurface is made there is less tendency to slip than on a dry surface of
the same material.
The apparently abnormally high values of coefficients of friction
under these conditions may not be due to an actual increase in fric-
tion. They may be explained on the assumption that perfect contactis made and that a seal is formed between the wet or oily surfaces
giving the effect of a partial vacuum under the shoe. If this is the
case, the load produced by the difference in pressure is added to thevertical component of the thrust on the shoe, while the horizontal
force remains equal to the horizontal component of the thrust.
The true coefficient of friction would then be given by the ratio
-
-p, , . p. in which F is the horizontal and Ff the vertical com-
ponent of the thrust due to the 75-pound weight, A is the area of
contact hi square inches, and P is the differential pressure in poundsper square inch. The apparent coefficient as measured is F/F'.There seems to be no way to avoid or definitely correct the error, as
there is no means of determining how perfect a seal is formed or
over what area perfect contact is made. However, if some means of
evaluating A and P, or the product A X P, can be discovered, thecorrected measurements and those on dry surfaces would have a sim-ilar significance, and they would have a much greater value in cor-
relating laboratory measurements with actual service conditions thanthe uncorrected measurements.Because of this obvious error, a double measurement was made on
all wet and oily surfaces
—
(a) An attempt to measure the difficulty
of obtaining a foothold, and (b) a measure of the coefficient of friction
in the usual manner as on a dry surface. Measurement (a) wasobtained by raising the weight by increments of about 0.05 of aninch on the horizontal scale and partially releasing it after eachincrement until a position was reached where the shoe would grip
the surface of the specimen and hold the weight. The lug was then

Hunter] Friclional Coefficients of Walk-Way Materials 345
moved to make contact with the shoe and its position recorded.
The weight was then fully raised and the measurement (6) taken.
Tables 11 to 13, inclusive, give data obtained in 1926 by the
methods just described. Table 14 is a comparison of results frommeasurements made in 1926 with measurements made on the samespecimens in 1929.
Table 11.
—
Coefficients of friction on clean, wet surface materials
Material
Coefficient of friction
1 2 3 Average
Q (a) - 0.780.790.350.640.560.740
.750
.820
.810
.855
0.770.770.220.625.560.720
.640
.790
.830
.880
0.760.695.230.630.590.750
.610
.770
.855
.865
0.770
q (b) .752"W (a) .267W (b) .632L (a) .570L (6) .737
p (a) . .667
P (6) .793
V (a) .832V (6) .867
Table 12.
—
Coefficients of friction on wet, dirty surfaces
Ceofficient of friction
Material With leather sole With rubber sole
1 2 3 Average 1 2 3 Average
Q (a) 0.475.525.325.475.545.590
.360
.460
.820
.845
0.430.485.325.450.525.585
.385
.505
.790
.820
0.375.490.330.460.530.585
.380
.525
.800
.810
0.427.500.327.462.533.587
.375
.497
.803
.825
0.355.570.340.560.660.995
.345
.585
.710
.750
0.355.640.385.625.650.995
.370
.585
.675
.770
0.475.660.325.585.635.995
.385
.585
.675
.750
0.395Q (6) .623W (a) .348W (o) . .590L (a) .648L (b) .995
P (c) .367P (6)— .585V (a) .687V(6) .757
Table 13.
—
Coefficients of friction on oily surfaces
Coefficients of friction
Material With leather sole With rubber sole
1 2 3 Average 1 2 3 Average
Q (a) 0.2O0.215.090.100.185.305
.090
.530
.385
.390
0.265.215.090.100.180.295
.265
.525
.360
.375
0.300.225.090.100.165.205
.380
.520
.385
.345
0.255.218.090.100.177.268
.248
.525
.377
.370
0.270.375.120.215.205.340
.165
.355
.325
.325
0.300.350.140.200.225.315
.205
.340
.320
.290
0.315.330.145.200.225.315
.185
.325
.280
.275
295Q (6) 352W(a) 135W (6)
L (a) 218L(6) 323
P (a) .185.340.308297
P (6)
V (a)
V(6)

346 Bureau of Standards Journal of Research [Vol. 5
Tabie 14.
—
Coefficients of friction measured at different times on clean wet surfaceswith leather soles
Coefficients of friction
Specimen Measured in 1926 Measured in 1929
1 2 3 Average 1 2 3 Average
A (a) 0.380.770.270.490.270.560
.560
.740
.750
.820
.780
.790
.810
.855
.350
.640
.215
.360
0.360.770.220.485.315.610
.560
.720
.640
.790
.770
.770
.830
.850
.220
.625
.200
.350
0.355.770.195.485.270.625
.590
.780
.610
.770
.760
.695
.855
.865
.230
.630
.205
.340
0.365.770.228.487.285.598
.570
.737
.667
.793
.770
.752
.833
.857
.267
.632
.207
.350
0.590.730.405.740.270.570
.510
.625
.750
.780
.580
.650
.615
.590
.585
.685
.485
.720
0.570.730.390.750.325.615
.490
.650
.760
.730
.570
.640
.635
.570
.585
.695
.470
.710
0.540.710.370.740.350.615
.485
.675
.750
.770
.590
.660
.660
.560
.585
.685
.425
.710
0.567A (6) .723C (a) .388C (6) .743J (a) .315J (6) .600
L (a) .495L (6) .650P (a) .753P (6) .760
Q (a) .580Q (6) .650V (a) .638V(6) .573
W (a) .585
W (6) .688X (a) - .460X (6) .713
IX. DISCUSSION OF FRICTION DATA
In interpreting the preceding data it is important that the relative
precision of the different measurements and the reasons for the lack
of precision in particular measurements be understood.The data in Tables 2 and 5 indicate that when constant surfaces
are presented the apparatus will duplicate measurements to the
nearest 0.005, which is equivalent to an error of ±0.5 per cent for a
coefficient of 0.5 or ±2.5 per cent for a coefficient of 0.1. Measure-ments made on clean, dry surfaces (Table 10) show departures fromthe original series of measurements ranging for different materials
from 0.5 to 9 per cent of the mean of the averages. Measurementson clean, wet surfaces (Table 14) show a wider divergence, rangingfor different materials from 0.2 to 38 per cent of the mean.The measurements on clean, dry surfaces show a reproducibility
which would justify the assumption that the coefficient of friction of
a material represents approximately its antislip value when the sur-
face is clean and dry. However, it should be noted that some walk-way materials tend to become slippery when the surfaces are dirty or
wet or oily and that this tendency bears no relation to the coefficients
of friction on clean, dry surfaces. For example, specimen J, a soft,
smoothfaced, nonabsorbent material has a higher coefficient whenthe surface is clean and dry than specimen V, a roughened metal withabrasive embedded in its surface, while measurements on wet andoily surfaces of these same specimens give values in exactly theopposite order. Though these data would enable a rough rating of
walk-way materials in respect to their antislip values under each of
the simulated service conditions, their direct application to a safety
provision for walk-way surfaces seems to be limited, unless the methodis further developed and the friction measurements are correlated
with the slipping hazard of walk ways in actual service.

Hunter] Frictional Coefficients of Walk-Way Materials 347
The spread in different determinations of the coefficient of frictionof the same material, and the possible error in determining the mini-mum coefficient needed for safety from the meager data available aretoo great in comparison with the total range in the coefficients offriction of available materials to admit of a strict rating withoutintroducing inconsistencies.A rough classification of walk-way materials in respect to their
safety values under different service conditions could be made fromdata obtainable by the methods described. This might be accom-plished by arranging the materials in the order of their coefficientsunder each of the simulated service conditions, clean and dry, cleanand wet, dirty and wet, and oily. It could be safely assumed thattwo materials having approximately the same coefficients on clean,dry surfaces will have approximately the same safety values in walkways with clean, dry surfaces. It could also be safely assumed thattwo materials showing approximately the same coefficients on clean,wet surfaces
_will have approximately the same safety values for
walk ways with surfaces in that condition, irrespective of what theircoefficients are for clean, dry surfaces, and similarly for other simu-lated or assumed service conditions. Some rule of interpretationembodying these principles is essential before any rational rating ofwalk-way materials in respect to their safety or antislip values underactual service conditions can be made.
X. SUMMARY OF CONCLUSIONS1. The apparatus developed for measuring coefficients of friction
on walk-way surface materials will duplicate or reproduce its measure-ment of a given constant coefficient of friction to the nearest 0.005.
2. The coefficient of friction between two materials is a constantonly when the condition of the two surfaces remains constant.
3. The coefficient of friction between a shoe sole and a walk-waysurface is a variable depending on the smoothness, cleanness, andmoisture content of the two surfaces.
4. The precision with which the coefficient of friction between thesame sole and the same walk-way material can be reproduced atdirterent times depends on the exactness with which the smoothness,
1
V*e cleanness, and the dryness can be reproduced, and it varies fordifferent materials.
5. Characteristic differences in frictional properties of walk-waymaterial are shown by their coefficients of friction, measured underdry, wet, and oily conditions, which indicate the tendencies of thematerials to become slippery under various service conditions.
Washington, March 26, 1929.