Embed Size (px)
Citation preview

DOI: 10.1007/s11099-018-0848-y PHOTOSYNTHETICA 56 (4): 1447-1452, 2018
1447
BRIEF COMMUNICATION
A method of a bicolor fast-Fourier pulse-amplitude modulation chlorophyll fluorometry V. LYSENKO*,+, D. LAZÁR**, and T. VARDUNY*
Botanical Garden, Academy of Biology and Biotechnology, Southern Federal University, Botanichesky spusk 7, 344041 Rostov-on-Don, Russia* Department of Biophysics, Centre of the Region Haná for Biotechnological and Agricultural Research, Faculty of Science, Palacký University, Šlechtitelů 27, 78371 Olomouc, Czech Republic** Abstract A simple method of a bicolor (multicolor), fast-Fourier, PAM chlorophyll fluorometry has been developed to obtain fluorescence induction curves. Quantum yields of PSII photochemistry were determined with blue and red simultaneously applied pulsed measuring lights for three subsequent 20-min periods of dark-, light-adaptation under actinic light and dark recovery. Measuring lights were cross-combined with blue and red actinic lights and saturation pulses. Coefficients of chromatic divergence were calculated as a ratio of the quantum yields obtained by red measuring light to that obtained by blue measuring light. Adaptation of Ficus benjamina and Hordeum vulgare leaves under blue (but not red) actinic light resulted in the sufficient increase of chromatic divergence. In addition, fraction of active, non(photo)inhibited, PSII centers was shown to be dependent on the color of measuring light. Thus, color of the light sources should be considered when reporting results of parameters evaluated from fluorescence induction curves. Additional key words: chromatic adaptation; greenhouse lighting; dual-wavelength PAM; multi-color PAM. Measurement of chlorophyll (Chl) fluorescence based on a pulse amplitude modulation (PAM) method is widely used in a great number of photosynthetic studies. PAM method implies separation of Chl fluorescence signal excited by the measuring flashes from continuous background (either under darkness or actinic or saturating light) signal (Schreiber 2004) by a way of their digital subtraction from each other or, more rarely, using analog hardware.
Most of commercially available PAM fluorometers use short (order of microseconds) measuring flashes of a relatively strong peak intensity but low frequency, thus obtaining a low [PPFD < 0.15 µmol(photon) m–2 s–1] average intensity of measuring light, which, in turn, allows
keeping reaction centers of PSII open in dark. In the case of open PSII centers of dark-adapted plants, the alternating fluorescence signal, excited by measuring light (measuring flashes), is referred as minimal fluorescence, F0. If a strong light pulse is applied, it saturates photosynthesis, turning all the reactions centers to the closed state. In this state the alternating fluorescence signal appears to be strongly increased and achieves its maximal level, Fm. Although many parameters describing photosynthetic functions can be evaluated from PAM fluorometry, the most often used parameter is the maximal quantum yield of PSII photo-chemistry in the dark-adapted state (Kitajama and Butker 1975; see also Schreiber 2004 and Lazár 2015), which is evaluated as (Fm – F0)/Fm = Fv/Fm, where Fv is a variable
———
Received 30 October 2017, accepted 26 February 2018, published as online-first 29 June 2018. +Corresponding author; e-mail: [email protected] Abbreviations: AB and AR – blue and red actinic lights; AL – actinic light; Ft – operating or effective Chl fluorescence level in the light-adapted state; F0 – minimal Chl fluorescence level in dark-adapted state; FFT – fast Fourier transform; Fm, Fm' – maximal Chl fluorescence level in dark-adapted and light-adapted state; Fm1'' and Fm2'' – maximal Chl fluorescence levels recovered at the beginning and at the end of the second dark period; Fv – variable Chl fluorescence; LED – light-emitting diode; MB and MR – blue and red measuring flashes; ML – measuring light; SP – saturating pulse; PAM – pulse amplitude modulation (fluorometry); SB and SR – blue and red saturating pulses; – chromatic divergence of quantum yields of PSII photochemistry. Acknowledgements: V.L. and T.V. were supported by Ministry of Education and Science of Russian Federatian by grant BCh0110-11/2017-25 and D.L. was supported by grant LO1204 from the National Program of Sustainability I, Ministry of Education, Youth and Sports, Czech Republic. The laboratory experiments and measurements were supported by grant BCh0110-11/2017-25 and performed with the equipment of Multiaccess center ‘‘Biotechnology, Biomedicine and Environmental Monitoring’’, Laboratory of Plant Physiology and Ecology of Academy of Biology and Biotechnology of Southern Federal University.
V. LYSENKO et al.
1448
Chl fluorescence. Operating or effective quantum yield of PSII photochemistry in the light-adapted state (Genty et al. 1989; see also Schreiber 2004 and Lazár 2015) can be evaluated as (Fm' – Ft)/Fm' = Fq'/Fm', where Fm' is the maximal Chl fluorescence in the light-adapted state and Ft is an operating or effective Chl fluorescence in the light-adapted state measured just before the saturating pulse.
Most of the standard PAM fluorometers use measuring light of one color: blue or white or, more frequently, red color (e.g., Figueroa et al. 2013). However, Pfündel (2009) has shown that Fv/Fm measured at ambient temperature depends on the wavelength of the exciting light in the range from 450 to 690 nm. The origin of this phenomenon was ascribed to the different excitation spectra for Chl fluorescence originated from PSI and PSII (Pfündel 2009). It follows that the values of the quantum yields of PSII photochemistry determined in studies carried out with different measuring colors (for example, red and blue: FvMR/FmMR and FvMB/FmMB) by different PAM-fluorometers may not be quite comparable between each other.
A color-addressed Fv/Fm evaluations are of interest in phytoplankton research in view of a larger diversity of photosynthetic pigments in algae and cyanobacteria (Jakob et al. 2005, Figueroa et al. 2013). Different colors of measuring light might be considered also with respect to a number of light wavelength-dependent physiological responses that are known to be induced by a long-time, selective illumination of plants by red or blue light, possibly related to stomata opening, phytochrom regu-lation or other effects (Hogewoning et al. 2010, Muneer et al. 2014). Evidently, all these tasks imply an independent application of measuring lights of different colors as well as saturating flashes of different colors.
MULTI-COLOR-PAM and PHYTO-PAM (Waltz, Effeltrich, Germany) belong among the few commercially manufactured multicolor PAM fluorometers. They are based on a LED array featuring a total of eight different colors, which serve for pulse-modulated measuring light, actinic light, far-red light, single-turnover pulses, and multiple turnover pulses, equivalent to saturation pulses. Schreiber and Klughammer (2013) used MULTI-COLOR-PAM to study the wavelength-dependent photodamage to
Chlorella. This device also was applied in studies on the
wavelength-specific effective absorption cross-section of
PSII photochemistry (Szabó et al. 2014). In addition, possibility for the multicolor excitation of Chl fluorescence
has been implemented in the fast repetition rate fluorometer
FastOcean (Chelsea Technologies Group, West Molesey, UK), which is used mainly for evaluation of photosynthetic
activity of phytoplankton (Suggett et al. 2015). Commercially manufactured multicolor fluorometers
cannot use bi- or multicolor measuring lights for simulta-neous measurement with one sample, allowing only a sequential switching from one color of measuring light to another (Schreiber et al. 2012), which, however, decreases convenience and reliability of the analysis.
Evidently, the possibility for simultaneous use of
measuring lights of different colors may be very important to detect small, weakly pronounced color-dependent effects in nonuniform samples. In opposite case, extensive statistics would be required to compare one color to another in large series of measurements. In order to solve this problem, Hogewoning et al. (2012) used a laboratory-built PAM fluorometer equipped with red and green sources of measuring flashes applied at different fre-quencies. Fluorescence emissions induced by the flashes were detected selectively and simultaneously using two laboratory-built demodulators, one for each of the two excitation wavelengths. However, this highly complicated dual-frequency technique requires an exact mutual adjustment of two photodiodes and lock-in amplifiers (demodulators). If the experiment needs a parallel use of
three or more sources of measuring light, the difficulties
may be too great. In the present work, we have introduced a simple bi-
color (potentially multi-color) FFT method of PAM fluorometry based on our previously developed monocolor FFT PAM (Lysenko et al. 2014). Bi-color FFT PAM, in contrast to the monocolor PAM, allows simultaneous use of two or several sources of measuring light for one sample instead only one color of measuring light.
We showed that the 20-min adaptation of plants under blue continuous actinic light leads to the sufficient increase of the ratio between the values of quantum yields of PSII photochemistry (chromatic divergence) determined with red and blue measuring lights.
Ficus benjamina L. ‘Danielle’ plants, 40–50 cm in height, were cultivated in a greenhouse on soil mix for palm and fig trees under standard conditions [temperature of 25 ± 1°C; relative air humidity of 70%; relative soil moisture of 60%; light/dark regime of 16 h/8 h; PPFD of 510 µmol(photon) m–1 s–2 of white color]. Hordeum vulgare L. ‘tetrastichum’, 24-d-old plants, 10–11 cm in height, were cultivated on peat/sand/loam (1:2:1) soil mix under the same moisture and light conditions.
Bicolor FFT PAM-fluorometry was performed in accordance with the technical principles and practical approaches applied in the previously described (Lysenko et al. 2014) monocolor FFT method of PAM-fluorometry with modifications. Measuring flashes (duration about of 1.4 ms) were simultaneously emitted by red (max = 660 nm) LED at a frequency of 360 Hz and blue (max = 470 nm) LED at a frequency of 370 Hz. Each LED applied PPFD of 0.1 mol(photon) m–2 s–1 at the adaxial sides of the leaves. Red (660 nm) and blue (470 nm) strong saturating pulses [2-s duration, 900 µmol(photon) m–2 s–1] were obtained with 10-W LEDs (660 nm and 470 nm) and applied in darkness and on the background of continuous actinic [660 nm or 470 nm, 120 µmol(photon) m–2 s–1] light at the adaxial sides of the leaves. Chl fluorescence emitted from the adaxial leaf side was detected through 740-nm interference filter (Esco Products, Oak Ridge, NJ, USA) by the photodiode connected with an operational amplifier of inverting type having a zero input impedance and then

BICOLOR FAST-FOURIER PAM CHLOROPHYLL FLUOROMETRY
1449
the output signal was passed to the PC sound card Creative SBX Pro Studio (Creative Technology Ltd., Singapore). Real-time signal data processing was carried out to perform FFT using the SpectraPlus 5.0 (Informer Technologies, Inc., USA) program package. The following settings optimized for bicolor PAM were applied: FFT size: 65,576 samples; sampling rate: 192,000 Hz; sampling format: 24 bit, mono. Peak amplitudes at specified frequencies (marker levels 360 and 370 Hz) were measured in 0.34-s intervals and the obtained values were saved to a log *.xlsx file.
Leaves of F. benjamina were detached at the beginning of day light period (10.00–11.00 h) and were immediately used in experiments. A sequence of light/dark periods was applied in accordance with the type of quenching analysis involving relaxation in darkness (Lazár 2015). The leaves were dark-adapted (first dark period) for 20 min followed with illumination by continuous actinic blue or red light for 20 min (the related Chl fluorescence levels are denoted with a single-prime) and recovery in darkness for 20 min (second dark period; the related fluorescence levels are denoted with a double-prime).
Minimal Chl fluorescence levels (F0, F01'', F02'') were determined with blue or red measuring light. Operating Chl fluorescence level (Ft) was measured with blue or red measuring flashes on the background of blue or red continuous actinic light just before application of the saturating pulses. Maximal Chl fluorescence levels (Fm, Fm', Fm1'', Fm2'') were measured with blue or red measuring light on the background of blue or red continuous actinic light during blue or red saturating pulse. Maximal quantum yields of PSII photochemistry for the dark-adapted state and for the beginning and the end of the dark recovery were evaluated as Fv/Fm, Fv1''/Fm1'', and Fv2''/Fm2'', respec-tively. Operating quantum yield of PSII photochemistry in the light-adapted state was evaluated as Fq/Fm. Subscripts were added to the symbols of the measured levels to denote color of the measuring light, continuous actinic light, and saturating pulses as follows: MB or MR – measuring blue or red light; AB or AR – continuous blue or red actinic light; SB or SR – blue or red saturating pulses.
In addition, a coefficient of chromatic divergence, , between values of given quantum yields obtained by red and blue measuring light was calculated as a ratio of the yield measured by red flashes to the yield measured by blue flashes; for example, for Fv/Fm the chromatic divergence was calculated as:
/
/ (1)
Timing and application of the particular light sources are depicted in Fig 1.
Apart of the studies on the influence of colors of the measuring light on the quantum yields of PSII photo-chemistry as described above, we evaluated the fraction of active, non(photo)inhibited, PSII centers, A, which also is expected to be color-dependent and can be easily
calculated from quenching analysis within our measuring protocol as (see Lazár 2015):
A = (Fv2''/Fm2'')/(Fv/Fm) (2)
where the pairs Fv2''/Fm2'' and Fv/Fm were obtained for the same either blue or red color of all light sources (leftmost and rightmost values in bold at Table 1).
Blank experiments with Chl solution in ethanol were performed to test the linearity of the signal and demon-strated that Fv did not exceed noise level (data not shown). In addition, the method was tested for the possibility of simultaneous application of three colors of measuring flashes applied at three corresponding frequencies (blue, red, and green LEDs). In this (multicolor) case, the noise did not increase by more than 10% compared to the bicolor technique (data not shown).
Testing of statistically significant difference between the quantum yields determined with red and blue mea-suring light for the same saturating pulse (done by ANOVA test) and evaluating of mean ± SD for Fv/Fm, Fq'/Fm', Fv1''/Fm1'', and Fv2''/Fm2'' were performed using Microsoft Excel 2007.
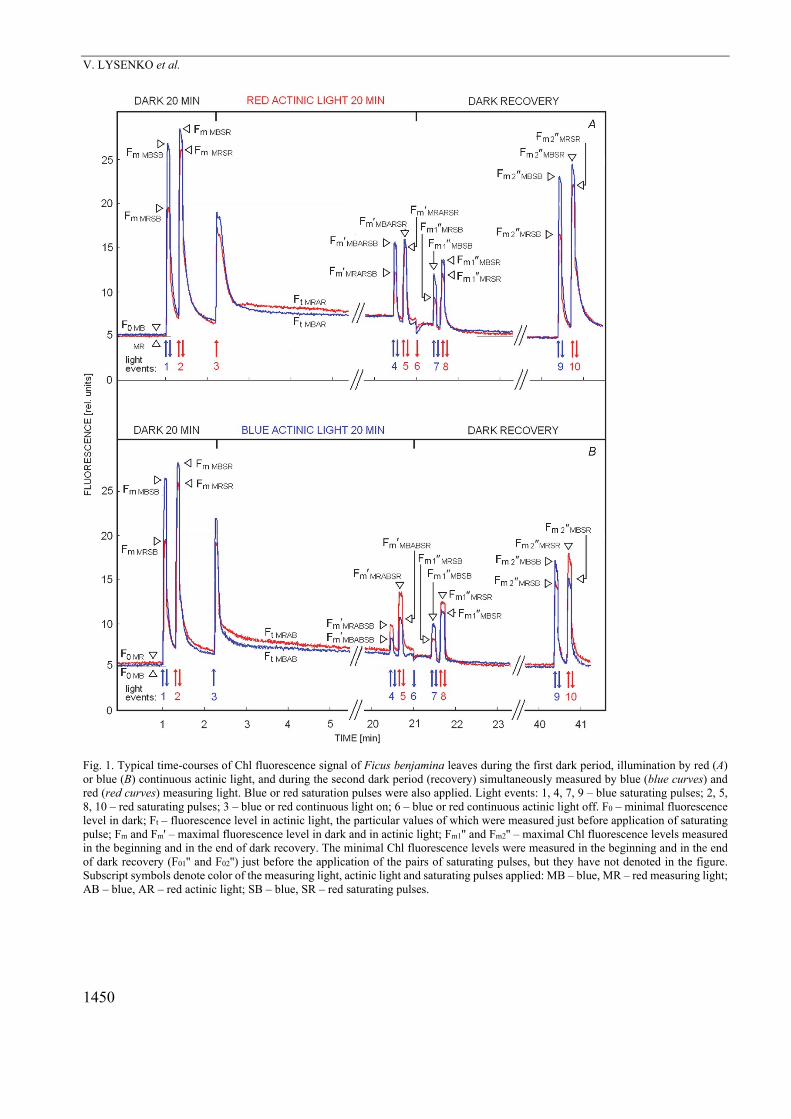
Fig. 1 shows that specific levels of Chl fluorescence induction curves in F. benjamina leaves significantly differed depending on what the color (red or blue) of different light sources (actinic light, saturating pulses, and measuring light) was used. After the first 20 min of dark adaptation (before the actinic light exposure), maximal quantum yield of PSII photochemistry (Fv/Fm) for red measuring light was slightly lower than that for blue measuring light under blue saturating pulse ( = 0.90), whereas the color of measuring light did not influence much the Fv/Fm under red saturating pulse ( = 0.98) (Fig. 1, Table 1).
At the end of red continuous actinic light exposure, the operating quantum yield of PSII photochemistry (Fq/Fm) obtained with red measuring light still remained lower than that with blue measuring light independently of whether the blue ( = 0.75) or red ( = 0.98) saturating pulse was used (Fig. 1A, Table 1). An opposite behavior was ob-served with blue continuous actinic light (Fig. 1B, Table 1), the application of which led to the decline of all values of operating quantum yields comparing to red actinic light, but operating quantum yields evaluated with blue measuring light (under blue actinic light) were suppressed stronger than with red measuring light. It resulted in the significant relative increase of operating quantum yield of PSII photochemistry obtained with red measuring light regardless whether the blue ( = 1.30) or red ( = 1.17) saturating pulse was used.
Generally, the application of blue saturating pulse caused a higher chromatic divergence (i.e., a higher deviation of from 1 to lower or higher values) of the operating quantum yield of PSII photochemistry in F. benjamina leaves ( = 0.75 for red AL and 1.30 for blue AL) than application of the red saturating pulse ( = 0.98
V. LYSENKO et al.
1450
Fig. 1. Typical time-courses of Chl fluorescence signal of Ficus benjamina leaves during the first dark period, illumination by red (A) or blue (B) continuous actinic light, and during the second dark period (recovery) simultaneously measured by blue (blue curves) and red (red curves) measuring light. Blue or red saturation pulses were also applied. Light events: 1, 4, 7, 9 – blue saturating pulses; 2, 5, 8, 10 – red saturating pulses; 3 – blue or red continuous light on; 6 – blue or red continuous actinic light off. F0 – minimal fluorescence level in dark; Ft – fluorescence level in actinic light, the particular values of which were measured just before application of saturating pulse; Fm and Fm' – maximal fluorescence level in dark and in actinic light; Fm1'' and Fm2'' – maximal Chl fluorescence levels measured in the beginning and in the end of dark recovery. The minimal Chl fluorescence levels were measured in the beginning and in the end of dark recovery (F01'' and F02'') just before the application of the pairs of saturating pulses, but they have not denoted in the figure. Subscript symbols denote color of the measuring light, actinic light and saturating pulses applied: MB – blue, MR – red measuring light; AB – blue, AR – red actinic light; SB – blue, SR – red saturating pulses.
BICOLOR FAST-FOURIER PAM CHLOROPHYLL FLUOROMETRY
1451
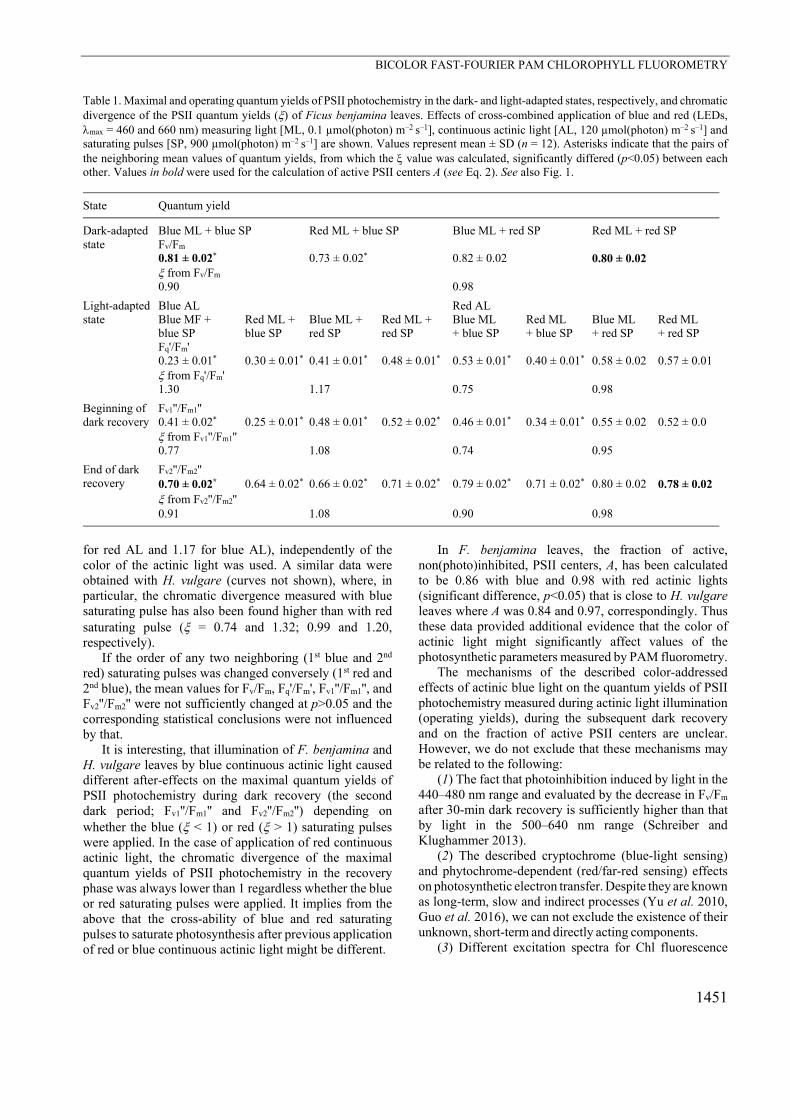
Table 1. Maximal and operating quantum yields of PSII photochemistry in the dark- and light-adapted states, respectively, and chromatic divergence of the PSII quantum yields () of Ficus benjamina leaves. Effects of cross-combined application of blue and red (LEDs, max = 460 and 660 nm) measuring light [ML, 0.1 µmol(photon) m–2 s–1], continuous actinic light [AL, 120 µmol(photon) m–2 s–1] and saturating pulses [SP, 900 µmol(photon) m–2 s–1] are shown. Values represent mean ± SD (n = 12). Asterisks indicate that the pairs of the neighboring mean values of quantum yields, from which the value was calculated, significantly differed (p<0.05) between each other. Values in bold were used for the calculation of active PSII centers A (see Eq. 2). See also Fig. 1.
State Quantum yield
Dark-adapted state
Blue ML + blue SP Red ML + blue SP Blue ML + red SP Red ML + red SP Fv/Fm 0.81 ± 0.02* 0.73 ± 0.02* 0.82 ± 0.02 0.80 ± 0.02 from Fv/Fm 0.90 0.98
Light-adapted state
Blue AL Red AL Blue MF + blue SP
Red ML + blue SP
Blue ML + red SP
Red ML + red SP
Blue ML + blue SP
Red ML + blue SP
Blue ML + red SP
Red ML + red SP
Fq'/Fm' 0.23 ± 0.01* 0.30 ± 0.01* 0.41 ± 0.01* 0.48 ± 0.01* 0.53 ± 0.01* 0.40 ± 0.01* 0.58 ± 0.02 0.57 ± 0.01 from Fq'/Fm' 1.30 1.17 0.75 0.98
Beginning of dark recovery
Fv1''/Fm1'' 0.41 ± 0.02* 0.25 ± 0.01* 0.48 ± 0.01* 0.52 ± 0.02* 0.46 ± 0.01* 0.34 ± 0.01* 0.55 ± 0.02 0.52 ± 0.0 from Fv1''/Fm1'' 0.77 1.08 0.74 0.95
End of dark recovery
Fv2''/Fm2'' 0.70 ± 0.02* 0.64 ± 0.02* 0.66 ± 0.02* 0.71 ± 0.02* 0.79 ± 0.02* 0.71 ± 0.02* 0.80 ± 0.02 0.78 ± 0.02 from Fv2''/Fm2'' 0.91 1.08 0.90 0.98
for red AL and 1.17 for blue AL), independently of the color of the actinic light was used. A similar data were obtained with H. vulgare (curves not shown), where, in particular, the chromatic divergence measured with blue saturating pulse has also been found higher than with red saturating pulse ( = 0.74 and 1.32; 0.99 and 1.20, respectively).
If the order of any two neighboring (1st blue and 2nd red) saturating pulses was changed conversely (1st red and 2nd blue), the mean values for Fv/Fm, Fq'/Fm', Fv1''/Fm1'', and Fv2''/Fm2'' were not sufficiently changed at p>0.05 and the corresponding statistical conclusions were not influenced by that.
It is interesting, that illumination of F. benjamina and H. vulgare leaves by blue continuous actinic light caused different after-effects on the maximal quantum yields of PSII photochemistry during dark recovery (the second dark period; Fv1''/Fm1'' and Fv2''/Fm2'') depending on whether the blue ( < 1) or red ( > 1) saturating pulses were applied. In the case of application of red continuous actinic light, the chromatic divergence of the maximal quantum yields of PSII photochemistry in the recovery phase was always lower than 1 regardless whether the blue or red saturating pulses were applied. It implies from the above that the cross-ability of blue and red saturating pulses to saturate photosynthesis after previous application of red or blue continuous actinic light might be different.
In F. benjamina leaves, the fraction of active, non(photo)inhibited, PSII centers, A, has been calculated to be 0.86 with blue and 0.98 with red actinic lights (significant difference, p<0.05) that is close to H. vulgare leaves where A was 0.84 and 0.97, correspondingly. Thus these data provided additional evidence that the color of actinic light might significantly affect values of the photosynthetic parameters measured by PAM fluorometry.
The mechanisms of the described color-addressed effects of actinic blue light on the quantum yields of PSII photochemistry measured during actinic light illumination (operating yields), during the subsequent dark recovery and on the fraction of active PSII centers are unclear. However, we do not exclude that these mechanisms may be related to the following:
(1) The fact that photoinhibition induced by light in the 440–480 nm range and evaluated by the decrease in Fv/Fm after 30-min dark recovery is sufficiently higher than that by light in the 500–640 nm range (Schreiber and Klughammer 2013).
(2) The described cryptochrome (blue-light sensing)
and phytochrome-dependent (red/far-red sensing) effects
on photosynthetic electron transfer. Despite they are known
as long-term, slow and indirect processes (Yu et al. 2010, Guo et al. 2016), we can not exclude the existence of their
unknown, short-term and directly acting components. (3) Different excitation spectra for Chl fluorescence

V. LYSENKO et al.
1452
originated from PSI and PSII (Pfündel 2009). It implies their different contribution of PSI and PSII to the total electron transport during the applied light conditions of the experiment considering a known (Schreiber 2004) fact that PSI can contribute in F0, thus influencing the calculated quantum yields of PSII in dark- and light-adapted states.
(4) Blue light-induced chloroplast movement (e.g., Baránková et al. 2016) which was demonstrated to affect Chl fluorescence parameters (e.g., Pfündel et al. 2018).
The authors hope that the developed method would be
useful in various studies on photosynthetic light reactions, where the different light colors are applied, including the studies performed in connection with greenhouse applications of red and blue LEDs used for plant growth. In addition, a special interest in the application of FFT PAM-fluorometry lies in the possibility of its unification with the previously developed FFT photoacoustic method (Lysenko and Varduny 2013) that would allow to use the same data signal processing hardware and software (amplifiers, sound cards, SpectraPlus software etc.).
References Baránková B., Lazár D., Nauš J.: Analysis of the effect of
chloroplast arrangement on optical properties of green tobacco leaves. – Remote Sens. Environ. 174: 181-196, 2016.
Figueroa F.L., Jerez C.G., Korbee N.: Use of in vivo chlorophyll fluorescence to estimate photosynthetic activity and biomass productivity in microalgae grown in different culture systems. – Lat. Am. J. Aquat. Res. 41: 801-819, 2013.
Genty B., Briantais J.-M., Baker N.R.: The relationship between the quantum yield of photosynthetic electron transport and quenching of chlorophyll fluorescence. – Biochim. Biophys. Acta 990: 87-92, 1989.
Guo Z, Wang F, Xiang X. et al.: Systemic induction of photo-synthesis via illumination of the shoot apex is mediated sequentially by Phytochrome B, auxin and hydrogen peroxide in tomato. – Plant Physiol. 172: 1259-1272, 2016.
Hogewoning S.W., Trouwborst G., Maljaars H. et al.: Blue light dose-responses of leaf photosynthesis, morphology, and chemical composition of Cucumis sativus grown under different combinations of red and blue light. – J. Exp. Bot. 61: 3107-3117, 2010.
Hogewoning S.W., Wientjes E., Douwstra P. et al.: Photosyn-thetic quantum yield dynamics: from photosystems to leaves. – Plant Cell 24: 1921-1935, 2012.
Jakob T., Schreiber U., Kirchesch V. et al.: Estimation of chloro-phyll content and daily primary production of the major algal groups by means of multiwavelength-excitation PAM chlorophyll fluorometry: performance and methodological limits. – Photosynth. Res. 83: 343-361, 2005.
Kitajima M., Butker W.L.: Quenching of chlorophyll fluores-cence and primary photochemistry in chloroplasts by dibromo-thymoquinone. – Biochim. Biophys. Acta 376: 105-115, 1975.
Lazár D.: Parameters of photosynthetic energy partitioning. – J. Plant Physiol. 175: 131-147, 2015.
Lysenko V., Varduny T.: Anthocyanin-dependent anoxygenic photosynthesis in coloured flower petals? – Sci. Rep. 3: 3373, 2013.
Lysenko V.S., Varduny T.V., Simonovich E.I. et al.: Far-red spectrum of second Emerson effect: a study using dual-
wavelength pulse amplitude modulation fluorometry. – Am. J. Biochem. Biotech. 10: 234-240, 2014.
Muneer S., Kim E.J., Park J.S. et al.: Influence of green, red and blue light emitting diodes on multiprotein complex proteins and photosynthetic activity under different light intensities in lettuce leaves (Lactuca sativa L.). – Int. J. Mol. Sci. 15: 4657-4670, 2014.
Pfündel E.E.: Deriving room temperature excitation spectra for photosystem I and photosystem II fluorescence in intact leaves from the dependence of FV/FM on excitation wavelength. – Photosynth. Res. 100: 163-177, 2009.
Pfündel E.E., Latuche G., Meister A., Cerovic Z.G.: Linking chloroplast relocation to different responses of photosynthesis to blue and red radiation in low and high light-acclimated leaves of Arabidopsis thaliana. – Photosynth. Res. 137: 105-128, 2018.
Schreiber U., Klughammer C., Kolbowski J.: Assessment of wavelength-dependent parameters of photosynthetic electron transport with a new type of multi-color PAM chlorophyll fluorometer. – Photosynth. Res. 113: 127-144, 2012.
Schreiber U.: Pulse-amplitude-modulation (PAM) fluorometry and saturation pulse method: An overview. – In: Papageorgiou G.C., Govindjee (ed.): Chlorophyll a Fluorescence: a Signature of Photosynthesis. Pp. 279-319. Springer, Dordrecht 2004.
Schreiber U., Klughammer C.: Wavelength-dependent photo-damage to Chlorella investigated with a new type of multi-color PAM chlorophyll fluorometer. – Photosynth. Res. 114: 165-177, 2013.
Suggett D.J., Goyen S., Evenhuis C. et al.: Functional diversity of photobiological traits within the genus Symbiodinium appears to be governed by the interaction of cell size with cladal designation. – New Phytol. 208: 370-381, 2015.
Szabó M., Wangpraseurt D., Tamburic B. et al.: Effective light absorption and absolute electron transport rates in the coral Pocillopora damicornis. – Plant Physiol. Bioch. 83: 159-167, 2014.
Yu X., Liu H., Klejnot J. et al.: The cryptochrome blue light receptors. – Arabidopsis Book 8: e0135, 2010.