Embed Size (px)
Citation preview
1
M. Cai
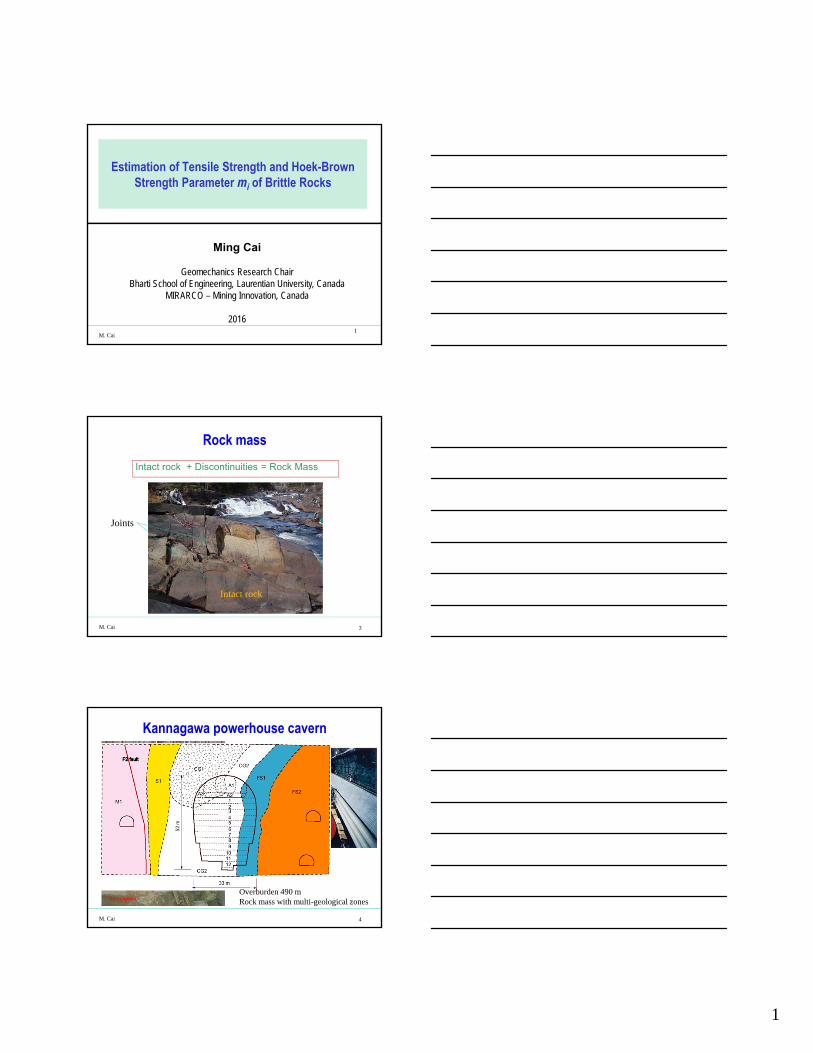
Estimation of Tensile Strength and Hoek-Brown Strength Parameter mi of Brittle Rocks
Ming Cai
Geomechanics Research ChairBharti School of Engineering, Laurentian University, Canada
MIRARCO – Mining Innovation, Canada
20161
M. Cai
Rock mass
Intact rock + Discontinuities = Rock Mass
Joints
Intact rock
3
M. Cai
Kannagawa powerhouse cavern
4
powermag.com
Overburden 490 mRock mass with multi-geological zones

2
M. Cai
Design analysis
3.5 m
5
M. Cai
Mohr-Coulomb failure criterion• The Mohr-Coulomb failure criterion in two forms
1
3
c
t
tension cut-off
sin1
sin1
K
sin1
cos2
cc
– friction anglec – cohesion – normal stress on failure plane
tan c
c
tension cut-off
elastic
impossibleAt failure
c
6
M. Cai
Hoek-Brown failure criterion
• The Hoek-Brown failure criterion is defined as
05.0
331
sm
cic
wheremi – rock friction strength parameters – rock cohesion strength parameter (s = 1 for intact rocks)c - UCS
It was an empirical failure criterion based on data fitting
t/c 7

3
M. Cai
Influence of mi value on rock strength
8
M. Cai
Generalized Hoek-Brown criterion and GSI system
a
cbc sm
3
31
D
GSImm ib 1428
100exp
D
GSIs
39
100exp
3/2015/
6
15.0 eea GSI
To use this criterion, one has to know DGSImic and , , ,
where
9
Hoek et al. (2002)
M. Cai
Quantitative GSI chartCai et al. (2004)
321
3210
sinsinsin sss
Vb
A
RC J
JJ
,ln0253.0ln0151.01
ln9.0ln79.85.26,
bc
bccb VJ
VJJVGSI
10
Cai and Kaiser (2006)
Hoel et al. (1995)

4
M. Cai
How do we determine these model input parameters?
Tensile strength?
mb (mi) parameter?
11
M. Cai
Focus of this talk
• Tensile strength (t) of brittle rocks
• Hoek-Brown strength parameter mi
D
GSImb 1428
100expim
12
M. Cai
Approaches
• Tensile strength of brittle rocks – Direct tensile test– Brazilian test– Database
• Hoek-Brown strength parameter mi
– Triaxial test– Database
Traditional approach
• Tensile strength of brittle rocks – Uniaxial compressive test
• Hoek-Brown strength parameter mi – Uniaxial compressive test
An alternative approach
13

5
M. Cai
Tensile strength of rocks
Data from Sheorey (1997)
10t
cR
14
M. Cai
Tensile strength testing
• Direct tensile strength test
A
Ft
F – failure loadA – failure plane area
F
F
F
F
15
M. Cai
Tensile strength testing
• Indirect tensile strength test – Brazilian test
Rt
Ft
F – failure loadR – disk radiust – specimen thickness
Indirect tension
F
F
16
6
M. Cai
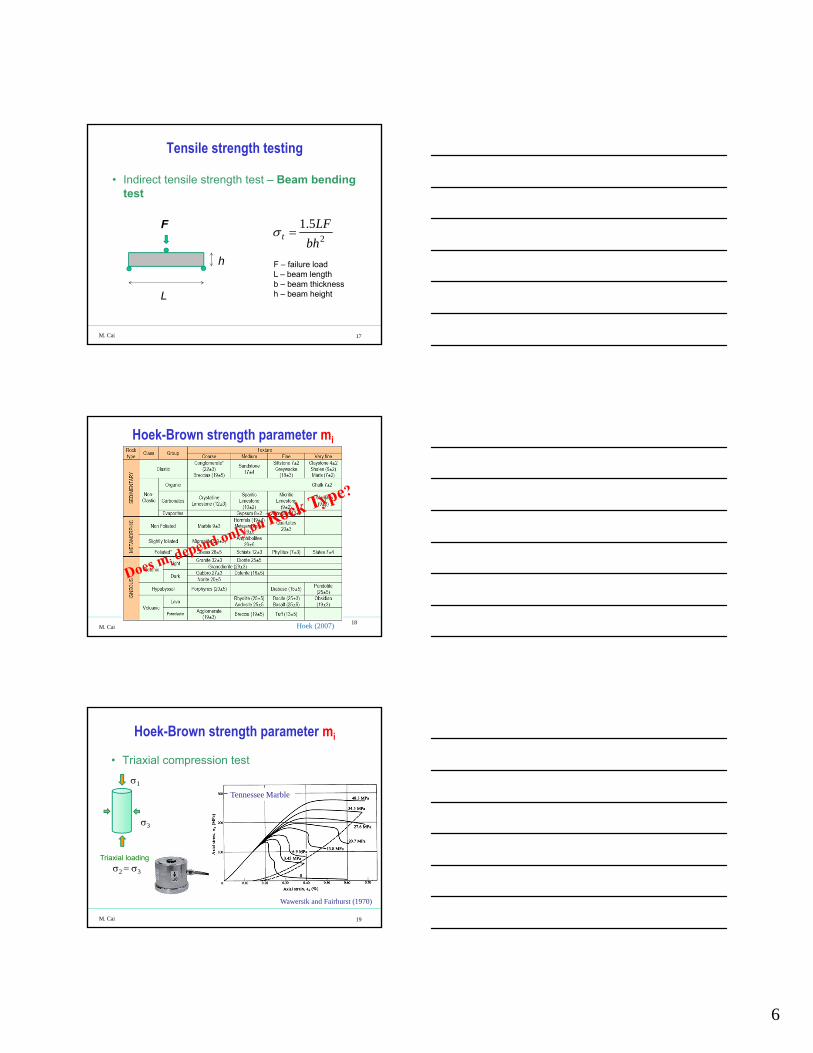
Tensile strength testing
• Indirect tensile strength test – Beam bending test
2
5.1
bh
LFt F
F – failure loadL – beam lengthb – beam thicknessh – beam heightL
h
17
M. Cai
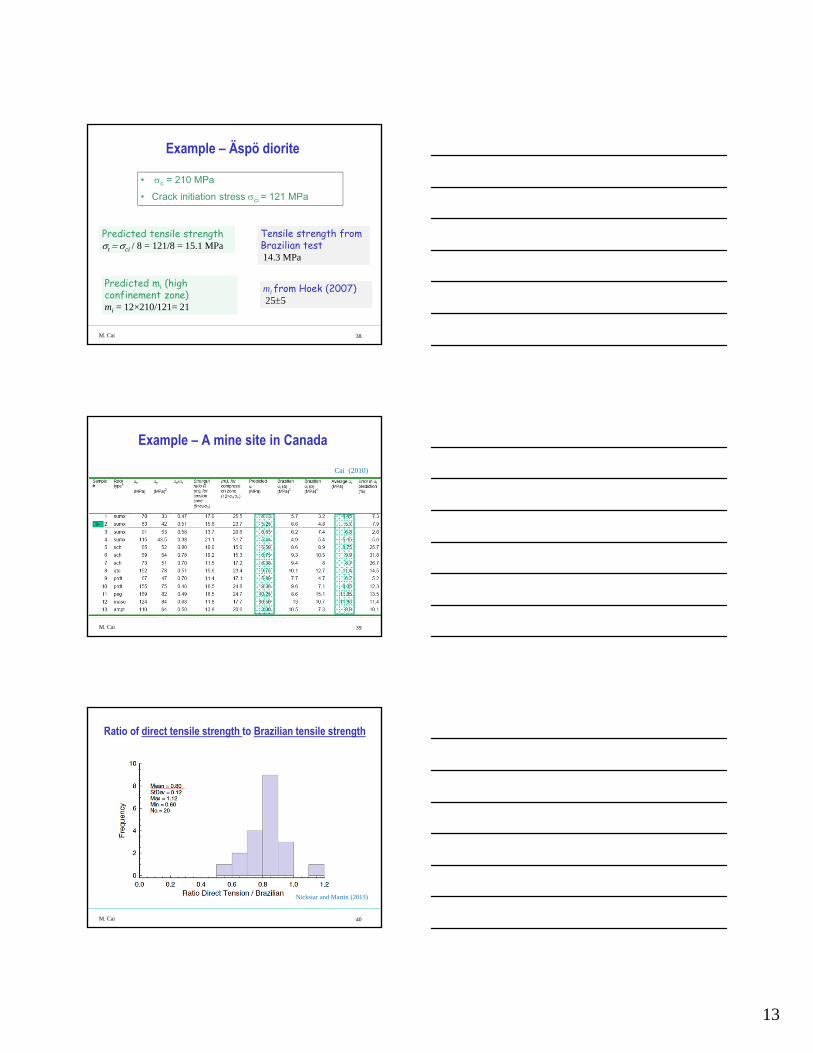
Hoek-Brown strength parameter mi
Hoek (2007) 18
M. Cai
Hoek-Brown strength parameter mi
• Triaxial compression test
Wawersik and Fairhurst (1970)
Tennessee Marble
1
3
2 3
Triaxial loading
19

7
M. Cai
Stress–strain relation under compression
20
Cai et al. (2004)
M. Cai
Griffith Theory
• Griffith proposed in 1920 that the strength of brittle materials is governed by the initial presence of small cracks.
• Failure occurs when the most vulnerably oriented crack in a population of randomly oriented cracks begins to extend under applied stress.
A.A. Griffith (1893-1963)
21
M. Cai
Griffith Theory – uniaxial tension• For a material to break in tension owing
to the presence of an existing microcrack, sufficient energy must be released to provide the necessary new surface energy as the crack propagates.
• In uniaxial tension, the energy criterion predicts failure at the stress of
c
Et
'2
21'
EE
E is the Young’s modulus, is Poisson's ratio, is the specific surface energy, c is the half crack length- plane strain problems
E’= E - plane stress problems
2c
22

8
M. Cai
Griffith’s strength criterion • Under uniaxial and biaxial compression, assuming
that elliptical cracks will propagate from the points of maximum tensile stress concentration, Griffith (1924) derived a stress criterion.
• It predicts a strength ratio of RG = c/ t = 8
08 312
31 t
• 3D version of the Griffith’s strength criterion was developed by Murrell (1963)
• It predicts a strength ratio of RM = c/ t = 12
024 3212
132
322
31 t
23
M. Cai
Griffith’s strength criterion
• The Griffith’s compressive strength to tensile strength ratio (8) is smaller than generally observed for rocks.
• Crack closure is not significantly affecting the strength ratio.
• The reason? The Griffith’s theory deals only with the initiation of failure (crack initiation). – Under tensile conditions, the crack initiation is often
equivalent to final failure
– Under compressive conditions, crack initiation happens at a stress level normally much lower than the peak stress
24
M. Cai
Stress-strain curves under uniaxial tension
Norite
Bieniawski (1967)
ttcd
ttci
965.0)(
945.0)(
25

9
M. Cai
Rock fracturing in tension
Crack initiation stress (ci)t
Tensile strength t
Stress
Strain
ttci )(
×
26
M. Cai
Simulation results
Cai and Kaiser (2004)
27
M. Cai
Micro-cracking mechanism under compression• Microscopic observations
indicate that newly generated cracks are tensile in nature, generated by extension strain, and mostly aligned in the same direction as the maximum compressive stress.
• After crack initiation, the propagation of the
microcracks is a stable process, which means that the cracks only extend by limited amounts in response to given increments in stress.
Pore or inclusionGriffith crack
Indentation
28

10
M. Cai
Griffith’s crack simulationvideo
(a) (b) (c) (d)
Axial loading
Cai (2003)
29
0.27 c 0.976 c 0.979 c Post-peak
M. Cai
Crack initiation in compression
Grain boundary cracks in rock
Bieniawski (1967)
30
M. Cai
Rock fracturing in compression
Crack initiation stress ci
UCSc
cci
31
Gap

11
M. Cai
The proposed method – Strength ratio, Tensile strength
• Crack initiation in tension often means tensile fracture is imminent.
• Crack initiation in compression is stable and it is only linked to a lower stress compared with the peak compressive strength.
• When both crack initiation and peak strength are considered the same (e.g. Griffith’s approach), it leads to an c/t ratio of RG = 8.
• In compression, additional loading is required to bring the stress level from ci to c.
• A better strength ratio R can be obtained by modifying RG by ci/c
8cic
t R
Tensile strength
ci
c
ci
cGRR
8
Cai (2010) 32
M. Cai
The proposed method – mi
• It can be shown from Hoek-Brown failure criterion that
1
11
2
2
RRm
t
c
c
ti
• When R is high (e.g. ≥ 8), we have
ci
ci Rm
8
2D Griffith cracking mechanism rock fracturing under tensile and low confinement conditions
Initial (pre-existing) crack
Wing
Direction of unstable growth
Rock mass
Excavation surface
Cai (2010)
33
M. Cai
The proposed method – mi
Dyskin et al. (1999)
ci
c
ci
cMcii Rmm
12
• Under high confining stress (3 > 5 MPa), microcrack initiation from most pre-existing defects will follow the stress state defined by 3D Griffith ellipsoidal cracks.
• In such a case, Murrell’s strength ratio RM, instead of Griffith’s strength ratio RG, is considered more appropriate for the estimation of mi.
mi in the high confinement zone is 1.5 times large than mi in the low confinement zone Cai (2010)
34

12
M. Cai
Typical values
Coarsegrained rocks
Medium grained rocks
Fine grained rocks
ci/c 0.3 – 0.4 0.4 – 0.5 0.5 – 0.7Strength ratio 20 - 27 16 - 20 11 - 16
mi (low confinement) 20 - 27 16 - 20 11 - 16
mi (high confinement) 30 - 40 24 - 30 16.5 - 24
ci
cR
8
ci
cim
12
ci
cim
8
35
M. Cai
Example – Westerly granite
• c = 214 MPa
• mi to fit the test data well in the tensile zone is 16.
• mi to fit the test data well in the compression zone is 26.7.
• 26.7/16 = 1.67
• 12/8 = 1.5Cai (2010)
36
M. Cai
Example – Medium to coarse grained granite from the Mine-by tunnel
• c = 21320 MPa
• Crack initiation stress ci 70 to 80 MPa
Predicted tensile strengtht ci / 8 = (70 to 80) / 8 = 8.75 to 10 MPa, average: 9.4 MPa
Tensile strength from Brazilian test8.91 MPa
Predicted mi (high confinement zone, average)mi = 12×213/75 = 34
mi from triaxial test30.8 ~ 34.8
37
13
M. Cai
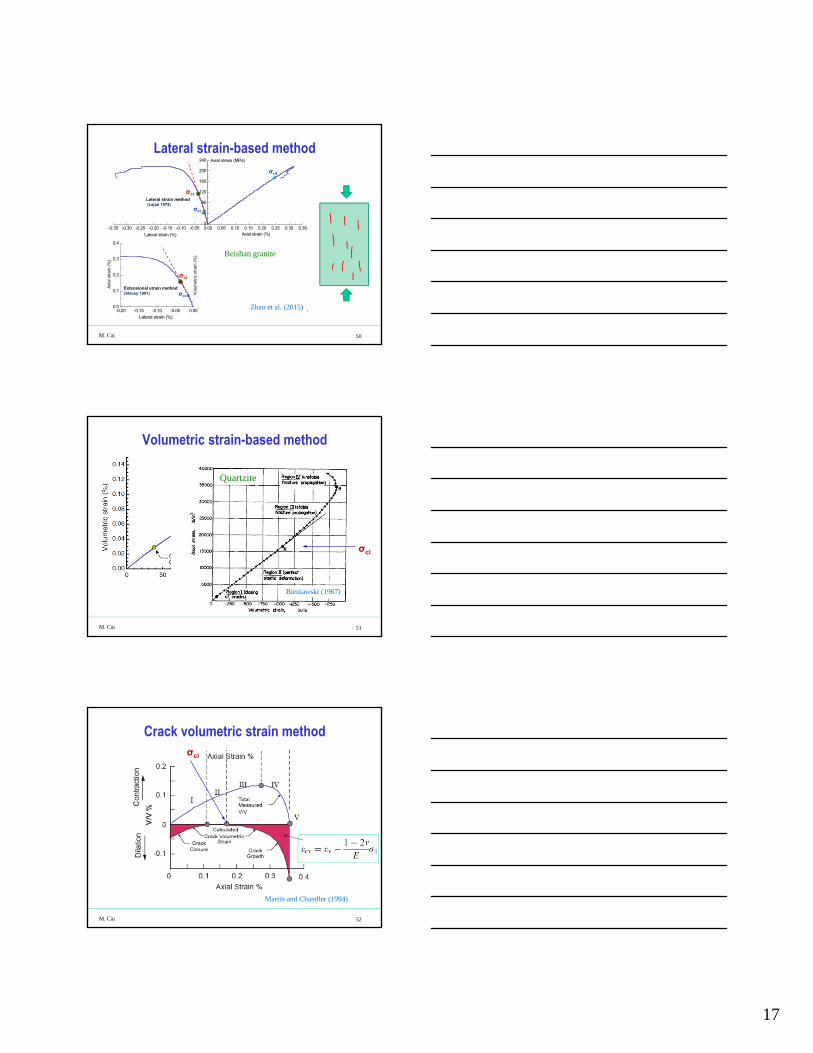
Example – Äspö diorite
• c = 210 MPa
• Crack initiation stress ci = 121 MPa
Predicted tensile strengtht ci / 8 = 121/8 = 15.1 MPa
Tensile strength from Brazilian test14.3 MPa
Predicted mi (high confinement zone)mi = 12×210/121= 21
mi from Hoek (2007)255
38
M. Cai
Example – A mine site in Canada
39
Cai (2010)
M. Cai
Ratio of direct tensile strength to Brazilian tensile strength
40
Nicksiar and Martin (2013)

14
M. Cai
Example – Forsmark metagranodiorite
41ci / t
Nicksiar and Martin (2013)
t = ci / 7.76
8ci
t
M. Cai
Spalling limit
• Low confinement zone, 2D cracking mechanism
• High confinement zone, 3D cracking mechanism
• Transition zone spalling limit
ci
cim
8
ci
cim
12
Cai (2010)
42
M. Cai
Summary
• Perform UCS test; measure axial and lateral strains or AE.
• Identify the crack initiation stress ci and the peak strength c.
8ci
t
Tensile strength t
milow confinement zone
ci
cim
8
miHigh confinement zone
ci
cim
12 Simple and yet effective approach
43

15
M. Cai
Weak rocks
Cai (2010)
• Opalinus Clay: c = 16 MPa, t = 5 MPa c / t ratio = 3.2.
• Why not = 8?
44
M. Cai
Generalized form
• and depend on – rock texture (e.g. grain size and shape)
– mineral content (e.g. clay and/or calcite content)
– crack initiation mechanism (e.g. Griffith cracks = 12 > , pore inclusions < )
• 2D – Griffith crack = 8, circular hole = 3
• 3D – Griffith crack = 12, elliptical hole = 5,
spherical hole = 4.
,
,
,
,
ci
cci
ci
cti
cit
ci
c
m
m
R
Cai (2010)
45
M. Cai
Strong vs weak rocks
Cai (2010)
Strong rocks Weak rocks
46

16
M. Cai 47
Carrara marble
mi = 8.25
Ramsey and Chester (2004)Hoek and Martin (2015)
M. Cai
Methods of determining ci
• Strain-based methods– Axial strain-based
– Volumetric strain-based
– Volumetric stiffness method
– Instantaneous Poisson's ratio method
– Lateral strain response (LSR) method
• Wave velocity method
• AE-based methods
48
Use of the proposed method depends on accurate determination of ci
No ISRM Suggested Method for ci determination yet.
M. Cai
Axial strain-based method
Martin (1993)
σci
49
17
M. Cai
Lateral strain-based method
-0.35 -0.30 -0.25 -0.20 -0.15 -0.10 -0.05 0.00 0.05 0.10 0.15 0.20 0.25 0.30 0.350
40
80
120
160
200
240
0.00 0.05 0.10 0.15 0.20 0.25 0.30 0.35-0.15
-0.10
-0.05
0.00
0.05
0.10
0.15
Lateral strain (%) Axial strain (%)
Axial strain (%)
Axial stress (MPa)
Lateral strain (%)
Axi
al s
trai
n (%
)
V
olum
etric
str
ain
(%)
-0.20 -0.15 -0.10 -0.05 0.000.0
0.1
0.2
0.3
0.4
Volumetric strain method(Brace et al. 1966)
Lateral strain method(Lajtai 1974)
Extensional strain method(Stacey 1981)
σci
σci
σci
σci
σcc
σcc
σcd
σcd
σcc
σcc
Crack volumetric strain method(Martin and Chandler 1994)
Zhao et al. (2015)
Beishan granite
50
M. Cai
Brace et al. (1966)
σci
Volumetric strain-based method
Bieniawski (1967)
σci
Quartzite
51
M. Cai
Crack volumetric strain methodσci
Martin and Chandler (1994)
52
18
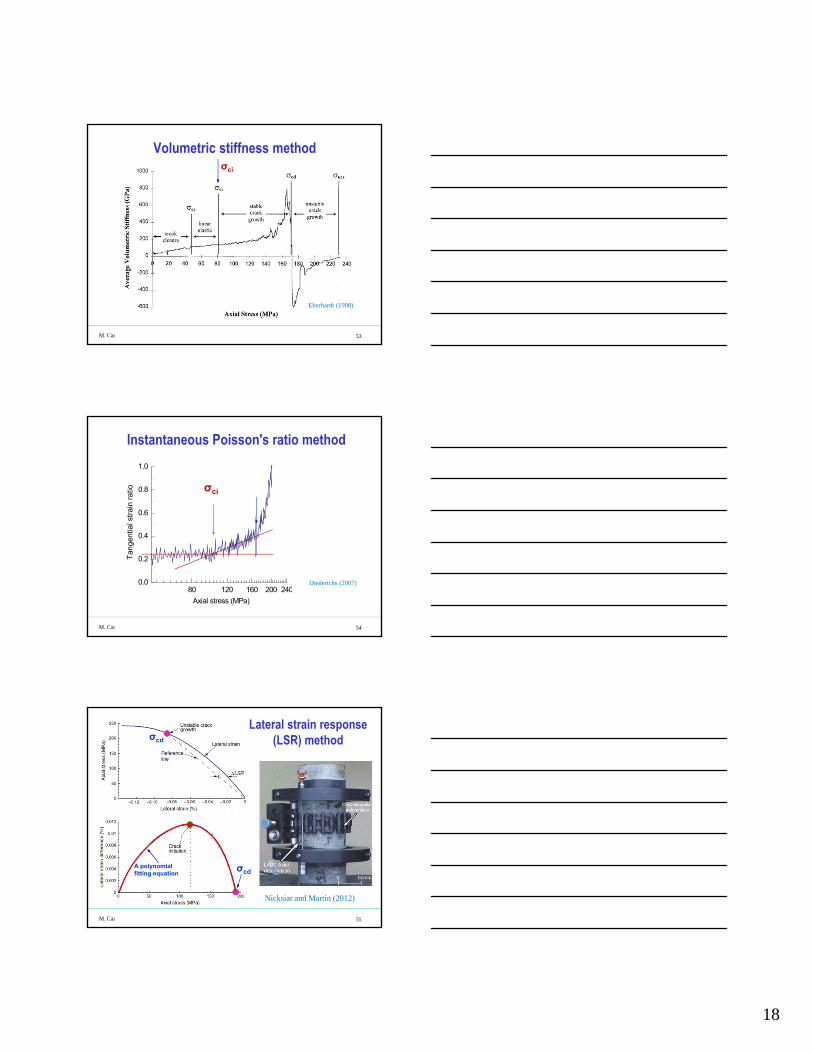
M. Cai
Volumetric stiffness method
Eberhardt (1998)
σci
53
M. Cai
Instantaneous Poisson's ratio method
Tan
gent
ial s
trai
n ra
tio
Axial stress (MPa)
80 120 160 200 2400.0
0.2
0.4
0.6
0.8
1.0
Diederichs (2007)
σci
54
M. Cai
σcd
σcd
A polynomial fitting equation
Lateral strain response (LSR) method
Nicksiar and Martin (2012)
55

19
M. Cai
Wave velocity method
56
Paterson and Wong (2005)
Turichshev and Hadjigeorgiou (2016)
M. Cai
Wave velocity method
57
σci
Turichshev and Hadjigeorgiou (2016)
M. Cai
AE-based method
58
Thompson et al. (2006)

20
M. Cai
AE-based method
0.0 0.1 0.2 0.3 0.4 0.5
0
1
2
3
4
Axial strain (%)
Rin
gdo
wn
cou
nts
(10
3 )
r
Rise time
Ringdown counts
Threshold
Peak amplitude
Event duration
Energy
σci
?
(Eberhardt 1998)
Zhao et al. (2015)
59
M. Cai
AE-based method
60
Eberhardt et al. (1998)
σci
M. Cai
AE-based method
Zhao et al. (2015)
-0.2 -0.1 0.0 0.1 0.2 0.30
20
40
60
80
100
120
140
160
Cumulative AE hits
Axial strain (%)
Axial stress (MPa) Volumetric strain
Cum
ula
tive
AE
hits
(1
05 )
Lateral strain (%)
cd
0.0
0.2
0.4
0.6
0.8
1.0
σci
?
61

21
M. Cai
The cumulative AE hit (CAEH) method
Beijing Research Institute of Uranium Geology
0 20 40 60 80 100 120 140 1600
2
4
6
8
10Peak stress
Axial stress (MPa)
Cu
mu
lativ
e A
E h
its (
104 )
Initial point
Minimum slope Upper bound
0 20 40 60 80 100 120 1400.9
1.2
1.5
1.8
2.1
Axial stress (MPa)
Cum
ulat
ive
AE
hits
(10
4 )
0 20 40 60 80 100 120 1400.9
1.2
1.5
1.8
2.1
Axial stress (MPa)
Cum
ulat
ive
AE
hits
(10
4 )
Initial pointUpper bound
Minimum slope
Lower bound
40 50 60 70 80 90 100 110 1201.4
1.5
1.6
1.7
1.8
1.9
Axial stress (MPa)
Cu
mul
ativ
e A
E h
its (
104)
Upper bound
Lower bound
Reference line
AE hit Difference
40 50 60 70 80 90 100 110 1200.0
0.1
0.2
0.3
0.4
0.5
0.6
Axial stress (MPa)
Cum
ulat
ive
AE
hit
diffe
renc
e (1
03)
Lower bound
Upper bound
σci
AE-based methodZhao et al. (2015)
Objective method
62
M. Cai
AE-based method
Zhao et al. (2015)
63
M. Cai
120 135 150 165 180 195 210 225 2400
40
80
120
160
200 BS06 BS16 BS18 BS19 TH01 TH02-1 TH02-2 YM01
Cra
ck in
itiat
ion
stre
ss (
MP
a)
Uniaxial compressive strength (MPa)
0.48 UCS
Relation between the UCS and the σci
Zhao et al. (2015)
64
22
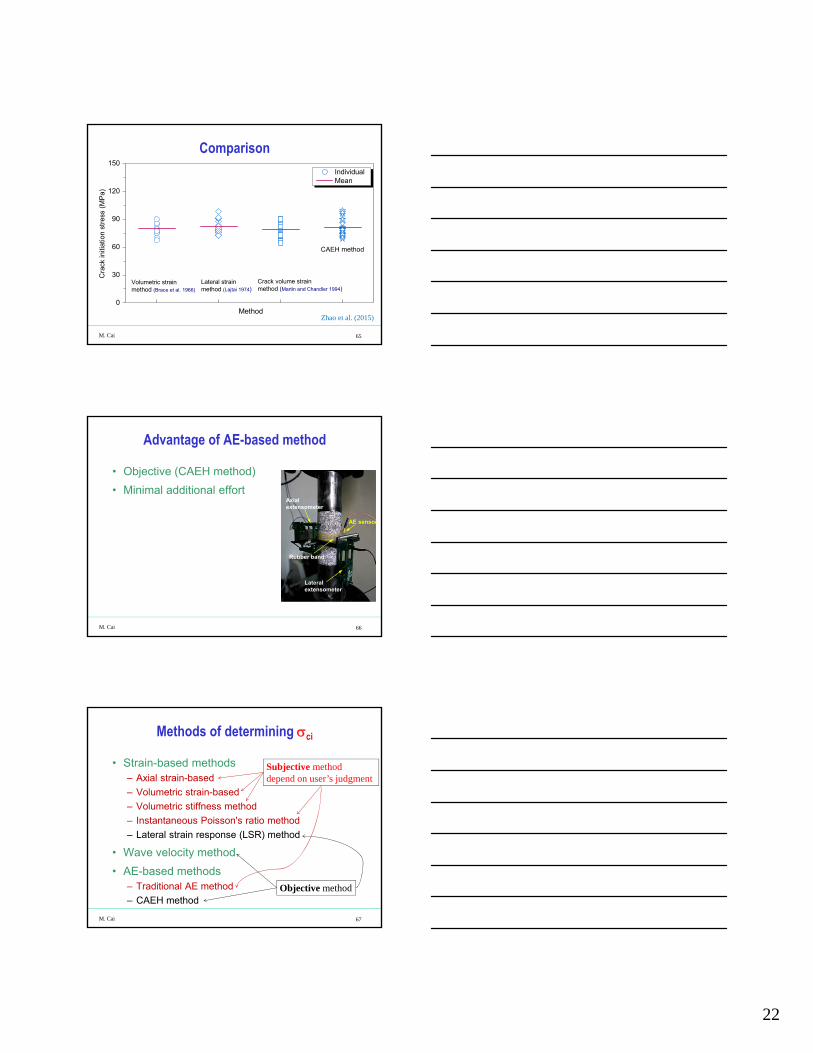
M. Cai
0
30
60
90
120
150
Crack volume strainmethod (Martin and Chandler 1994)
Lateral strain method (Lajtai 1974)
Volumetric strain method (Brace et al. 1966)
Individual Mean
Cra
ck in
itiat
ion
stre
ss (
MP
a)
Method
CAEH method
Comparison
Zhao et al. (2015)
65
M. Cai
Advantage of AE-based method
• Objective (CAEH method)
• Minimal additional effortAxialextensometer
Lateralextensometer
AE sensor
Rubber band
66
M. Cai
Methods of determining ci
• Strain-based methods– Axial strain-based
– Volumetric strain-based
– Volumetric stiffness method
– Instantaneous Poisson's ratio method
– Lateral strain response (LSR) method
• Wave velocity method
• AE-based methods – Traditional AE method
– CAEH method
Subjective methoddepend on user’s judgment
Objective method
67

23
M. Cai
Factors affecting σc – Size effect
The tested compressive peakstrength is not an intrinsicproperty. Intrinsic material properties do not depend on the specimen geometry or the loading conditions used in the test.
Hoek and Brown (1980)68
M. Cai
Factors affecting σc – Shape effect
• Elastic modulus is basically unaffected by specimen shape, but strength and ductility increase as the ratio of sample diameter to length increases
• Reason: Effect of loading platens
Hudson and Harrison (1997)
69
M. Cai
Factors affecting rock strength – Strain rate
• The post-peak part of the force-displacement curve is more sensitive to strain rate than that in the pre-peak
Peng (1973)
70
24
M. Cai
True material property?
• σc depends on many factors– Specimen shape
– Loading platens
– Specimen size
– Loading rate
– Loading machine
– …
• σci is not affected by specimen shape, loading platens or loading machine. It is awonderful parameter to have.
71
mi is also affected by these factors
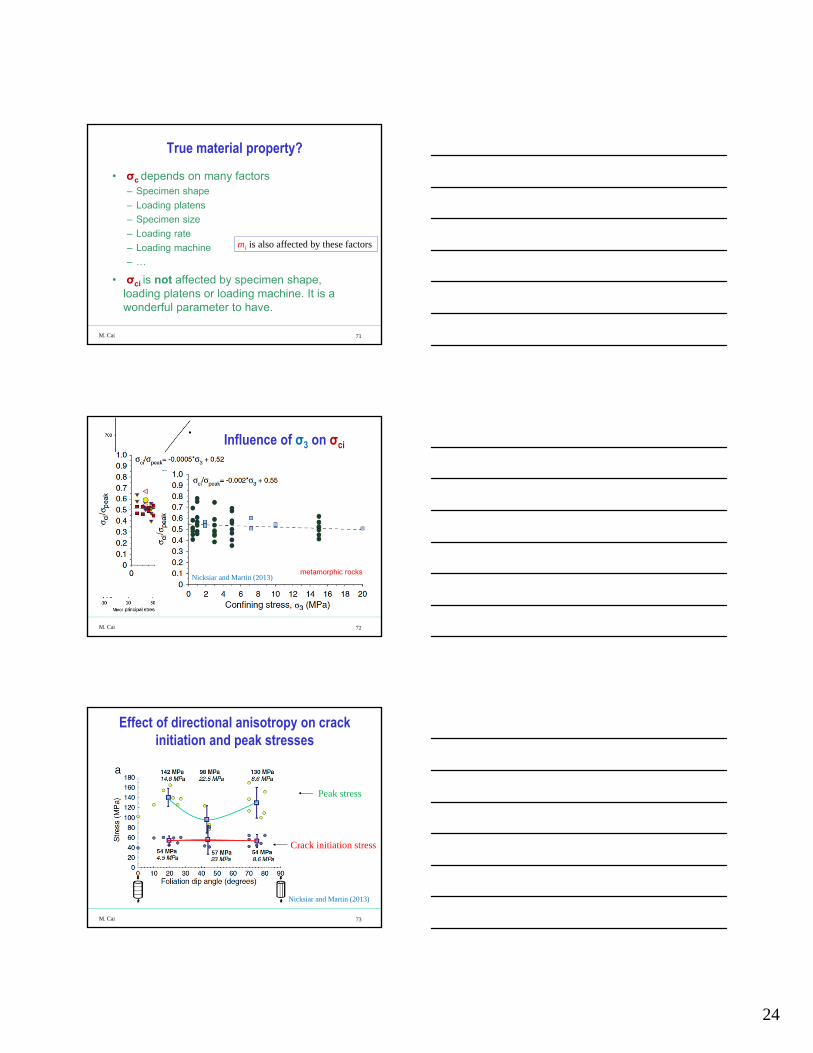
M. Cai
Lau and Gorski (1992)
Lac du Bonnet granite
Influence of σ3 on σci
72
igneous rocks
metamorphic rocksNicksiar and Martin (2013)
M. Cai
Effect of directional anisotropy on crack initiation and peak stresses
73
Nicksiar and Martin (2013)
Crack initiation stress
Peak stress

25
M. Cai
σci potentially as the ultimate long-term strength
74
Damjanac and Fairhurst (2010)
σci
M. Cai
Conclusions
• Tensile strength σt can be estimated from
• mi can be estimated from
• Accurate determination of σci is important– Lateral strain-based LSR method
– AE-based CAEH method
• Best for preliminary design
8ci
t
ci
cim
8
ci
cim
12
75
M. Cai
Reading list
• Griffith, A.A. 1921. The phenomena of rupture and flow in solids. Phil. Trans. Royal Soc. London. 221A: 163-198.
• Bieniawski, Z.T. 1967. Mechanism of brittle fracture of rock: Part I, II, III. Int. J. Rock Mech. Min. Sci. Geomech. Abs. 4(4): 395-406.
• Hoek, E. (2007): Practical Rock Engineering. Available online: www.rocscience.com, 342.
• Cai, M. (2010) Practical estimates of tensile strength and Hoek-Brown strength parameter mi of brittle rocks. Rock Mech. Rock Engng, 43(2), 167-184.
• Zhao, X.G., Cai, M., Wang, J., Li, P.F., Ma, L.K. (2015) Objective determination of crack initiation stress of brittle rocks under compression using AE measurement, Rock Mech. Rock Engng, 48(6), 2473-2484.
76