Embed Size (px)
Citation preview

A Method for Estimating Zero-Flow Pressureand Intracranial Pressure
Caren Marzban PhDw Paul R Illian BS David Morison BS Anne Moore BSN RVTzMichel Kliot MDz Marek Czosnyka PhDy and Pierre D Mourad PhDz8
Background It has been hypothesized that the critical closing
pressure of cerebral circulation or zero-flow pressure (ZFP) can
estimate intracranial pressure (ICP) One ZFP estimation method
used extrapolation of arterial blood pressure as against blood-flow
velocity The aim of this study was to improve ICP predictions
Methods Two revisions have been considered (1) the linear
model used for extrapolation is extended to a nonlinear equa-
tion and (2) the parameters of the model are estimated by an
alternative criterion (not least squares) The method is applied
to data on transcranial Doppler measurements of blood-flow
velocity arterial blood pressure and ICP from 104 patients
suffering from closed traumatic brain injury sampled across
the United States and England
Results The revisions lead to qualitative (eg precluding negative
ICP) and quantitative improvements in ICP prediction While
moving from the original to the revised method the plusmn2SD of the
error is reduced from 33 to 24mm Hg and the root-mean-squared
error is reduced from 11 to 82mm Hg The distribution of root-
mean-squared error is tighter as well for the revised method the
25th and 75th percentiles are 41 and 137mm Hg respectively as
compared with 51 and 188mm Hg for the original method
Conclusions Proposed alterations to a procedure for estimating
ZFP lead to more accurate and more precise estimates of ICP
thereby offering improved means of estimating it noninvasively The
quality of the estimates is inadequate for many applications but
further work is proposed which may lead to clinically useful results
Key Words blood flow brain head injury intracranial pressure
noninvasive
(J Neurosurg Anesthesiol 201200000ndash000)
Monitoring and manipulation of intracranial pressure(ICP) aids patient management and may improve
clinical outcome after trauma and other conditions1ndash12
Increased ICP impairs neural function by reducing bloodflow (causing ischemia) and by direct mechanical com-pression or herniation of brain tissue Measurements ofICP require placement of a pressure sensor within thecranium The invasiveness of this procedure has led to thedevelopment of a variety of noninvasive approaches Oneclass of approaches uses transcranial Doppler (TCD) andarterial blood pressure (ABP) measurements13ndash15 Anotherclass is based on imaging and analysis of various com-partments of the eyemdashin particular the ophthalmic arteryor the optic nerve sheath diameter16ndash22 In the presentstudy blood-flow velocity (FV) in the middle cerebralartery derived from TCD and ABP are used to develop analternative approach for the estimation of ICP
Burton23 conducted an analysis showing that arte-rial critical closing pressure (CCP) may approximate bothICP and a force resulting from the tension of the smoothmuscles of the arterial walls Aaslid and colleagues2425
examined several methods for estimating CCP compar-ing the results with a ldquogold standardrdquo measured duringinduced ventricular fibrillation Michel et al26 andKottenberg-Assenmacher et al27 used physics-basedmodels to address CCP measurements and have reportedhow it may aid in estimating ICP noninvasively Anotherstudy more focused on the hemodynamics in preg-nancy28 has examined the connection between CCP andICP The role played by the cerebrovascular wall tensionin the CCP-ICP connection has been examined as well29
A simple method for estimating CCP involves fittinga least-squares line through ABP versus FV Specificallyone first considers the scatterplot of ABP versus FV whenthe 2 have been aligned to have a comparable phase (iemaximum correlation) If the scatterplot displays a linearrelationship between ABP and FV the y-intercept of aline fitting the scatterplot defines an estimate of CCPThis method is simple because the alternatives generallyconsider smoothing or filtering based on Fourier analysisof the various time series as carried out in the study byAaslid et al25 Preprocessing of this type adds complexityto the analysis and for this reason the CCP estimationmethod considered here is a variation of the simple ex-trapolation method The main goal of the study here isnot to improve on the estimation of CCP itself but rather
Received for publication March 6 2012 accepted June 8 2012From the Applied Physics Laboratory Departments of wStatisticszNeurological Surgery 8Department of Bioengineering Universityof Washington Seattle WA and yDepartment of NeurosurgeryUniversity of Cambridge Addenbrookersquos Hospital Cambridge UK
Supported by the National Institutes of Health (Grant R43NS46824-01A1) National Space Biomedical Research Institute (GrantSMS00701-2009-513) and PhysioSonics Incorporated MK andPDM have a significant financial interest in PhysioSonics one ofthe sponsors of the research described here
The authors have no conflicts of interest to discloseReprints Caren Marzban PhD Applied Physics Laboratory Depart-
ment of Statistics University of Washington Seattle WA 98195(e-mail marzbanstatwashingtonedu)
Copyright r 2012 by Lippincott Williams amp Wilkins
CLINICAL INVESTIGATION
J Neurosurg Anesthesiol Volume 00 Number 00 rsquorsquo 2012 wwwjnsacom | 1
to develop alternative models of CCP estimation thatbetter correlate with ICP
Czosnyka et al30 examined several methods for es-timating CCP and also studied the correlation betweenCCP and ICP Using a data set involving 98 patients theyreported a correlation coefficient of 041 between ICP andCCP They also reported that ICP can be predicted fromCCP to within plusmn27mm Hg (95 confidence level)Thees et al31 found a correlation of 091 based on 70patients (no predictive error bar has been reported) On adata set involving 20 patients Buhre et al32 used a methoddeveloped by Weyland et al33 and reported a correlationcoefficient of 093 and a 2 SD (ie approximately 955confidence interval) of plusmn152mm Hg In the work car-ried out by these authors CCP was often referred to asthe zero-flow pressure (ZFP) and so we define the ldquoZFPhypothesisrdquo as the hypothesis that ICP can be estimatedfrom some estimate of ZFP (or CCP)
In the current paper 2 revisions to the extrapolationmethod have been examined both aimed at improvingthe estimation of ICP The revisions involve (1) relaxingthe linearity of the equationmodel used for extrapo-lation and (2) using an alternative criterion (not leastsquares) for estimating the parameters of the model Thefirst revision ensures that the ICP predictions are physical(ie non-negative) and the second revision eliminates theneed to align FV and ABPmdasha necessary step in theoriginal extrapolation method In addition to thesequalitative improvements the revised method also leadsto more accurate and precise estimates of ICP
MATERIAL AND METHODS
PatientsPatient data for this preclinical study were collected
from a variety of hospitals in the United States after astudy at the University of Washington led by DrMourad as well as from Addenbrookersquos HospitalCambridge England led by Dr Czosnyka
The core contributing hospitals within the UnitedStates were Harborview Medical Center (Seattle WA)Columbia University Medical College (New York CityNY) and the University of Texas Medical School atHouston TX Data from 59 patients (49 male 10 female)with a mean age of 34 years (range 13 to 81) and a meanGlasgow Coma Score of 5 (range 3 to 11) were collectedStudies there met the following inclusion criteria (1) allpatients experienced closed head injury (2) no patientreceived neurosurgical intervention other than placementof an invasive ICP monitor (3) all patients had an ABPcatheter in place at the time of the study (4) all patientscould tolerate a TCD examination (5) all patients were 8years old or older and (6) informed consent was obtainedfrom all patients or their families These criteria were alsofollowed at Addenbrookersquos Hospital except that patientsregardless of age could consent to participate in the studyand in addition all patients were intubated Finally forboth centers all patients were monitored and treated
following the specifications of the Brain Trauma Foun-dation910
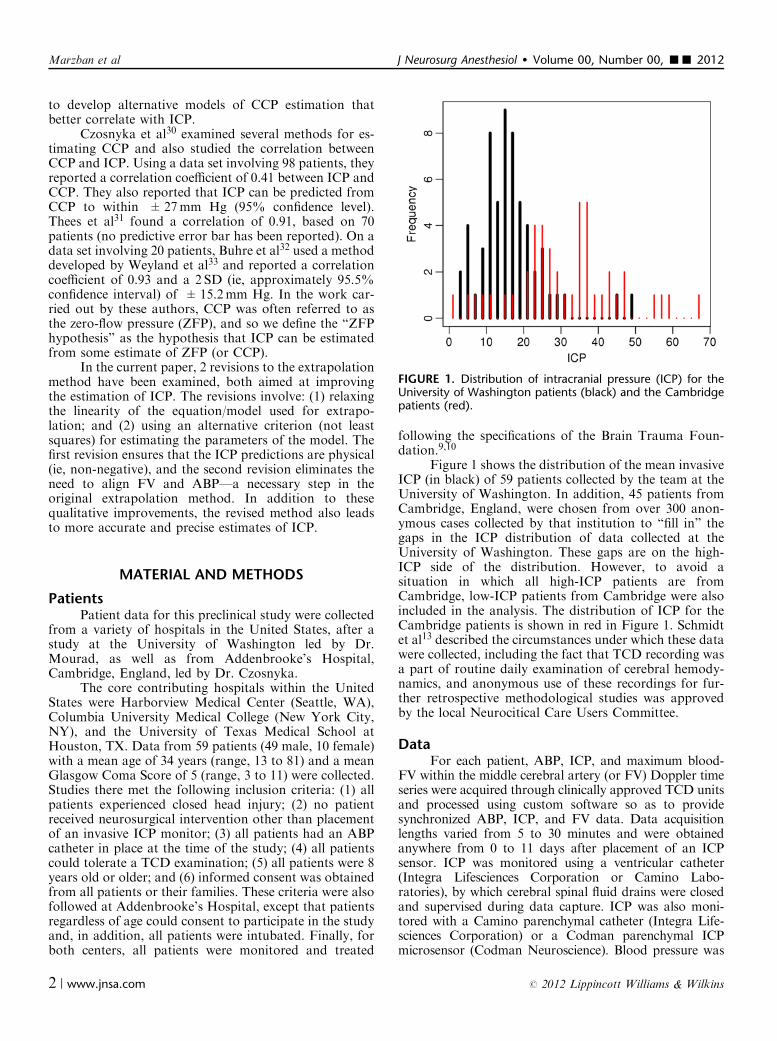
Figure 1 shows the distribution of the mean invasiveICP (in black) of 59 patients collected by the team at theUniversity of Washington In addition 45 patients fromCambridge England were chosen from over 300 anon-ymous cases collected by that institution to ldquofill inrdquo thegaps in the ICP distribution of data collected at theUniversity of Washington These gaps are on the high-ICP side of the distribution However to avoid asituation in which all high-ICP patients are fromCambridge low-ICP patients from Cambridge were alsoincluded in the analysis The distribution of ICP for theCambridge patients is shown in red in Figure 1 Schmidtet al13 described the circumstances under which these datawere collected including the fact that TCD recording wasa part of routine daily examination of cerebral hemody-namics and anonymous use of these recordings for fur-ther retrospective methodological studies was approvedby the local Neurocitical Care Users Committee
DataFor each patient ABP ICP and maximum blood-
FV within the middle cerebral artery (or FV) Doppler timeseries were acquired through clinically approved TCD unitsand processed using custom software so as to providesynchronized ABP ICP and FV data Data acquisitionlengths varied from 5 to 30 minutes and were obtainedanywhere from 0 to 11 days after placement of an ICPsensor ICP was monitored using a ventricular catheter(Integra Lifesciences Corporation or Camino Labo-ratories) by which cerebral spinal fluid drains were closedand supervised during data capture ICP was also moni-tored with a Camino parenchymal catheter (Integra Life-sciences Corporation) or a Codman parenchymal ICPmicrosensor (Codman Neuroscience) Blood pressure was
FIGURE 1 Distribution of intracranial pressure (ICP) for theUniversity of Washington patients (black) and the Cambridgepatients (red)
Marzban et al J Neurosurg Anesthesiol Volume 00 Number 00 rsquorsquo 2012
2 | wwwjnsacom r 2012 Lippincott Williams amp Wilkins
acquired invasively from an arterial line placed in the ra-dial femoral brachial or ulnar artery All patients fromCambridge were sedated paralyzed and ventilated tomaintain adequate oxygenation and mild hypocapnia Allpatients from the University of Washington cohort under-went the same treatment except for 1 patient who was nolonger under ventilation when this study was performed
All retrospective data processing and analysis wasconducted at the Applied Physics Laboratory (APL)University of Washington Data collected through the APLhospital cohort were digitized at 125Hz whereas datacollected in Cambridge were digitized at 40Hz To place thedata sets on the same footing the APL data sets weredownsampled to 40Hz A fixed duration (5min) was se-lected from each of the 104 patients for statistical analysis
Data Processing and Statistical AnalysisIn this study the methodology of Weyland et al33
and Buhre et al32 (WB method) has been revised Therevised method involves 2 specific alterations (1) thelinear modelequation in the WB method is replaced witha nonlinear equation and (2) the least-squares criterionfor estimating the parameters of the model is replacedwith an alternative criterion that does not have a commonname we shall refer to it as the SD criterion These re-visions are further described in the Appendix The mainpurpose of the first revision is to prevent negative ICPpredictions that arise in the WB method The primarybenefit of the second revision is to preclude the pre-
processing step of aligning the FV and ABP time seriesThis alignment is necessary for the least-squares criterionmethod and requires the specification of quantities thatadd to its complexity For example given that the align-ment procedure is an optimization problem one mustspecify the quantity being optimized the correlation orthe covariance between the 2 series are common choicesbut can lead to different results The duration of the 2time series over which the alignment is performed is an-other quantity that can affect the results In addition tothese benefits the revised methodology (involving bothrevisions) leads to higher-quality ICP predictions ascompared with those of the WB method The goodness ofthe ICP estimates is assessed in terms of the bias SD androot-mean-square of the errors (RMSE)
To demonstrate the ingredients of the WB methodconsider the data from a single patient Figure 2A showsthe time series for FV (solid curve) and ABP (dashed line)for 1 patient for a duration of 25 seconds (ie 100 datapoints displayed at 40Hz) Figure 2B displays the scat-terplot of ABP versus FV (circles) after they have beenaligned The 2 lines are based on the least-squares crite-rion (dotted) and the SD criterion (solid) their equationsare y= 141+070x and y= 130+073x respectivelyThe ZFP hypothesis asserts that the y-intercept of theleast-squares line approximates the mean ICP The meanof the observed ICP for this patient is 135mm Hgmarked with an arrow along the y-axis Evidentlythe y-intercept of the least-squares line agrees with this
FIGURE 2 A The time series of flow velocity (FV) (solid line) and arterial blood pressure (ABP) (dashed line) for 1 patient BScatterplot of ABP versus FV (circles) the least-squares fit (dotted line) and the SD line (solid line) The mean ICP for this patient islabeled along the y-axis with an arrow C Same as B but before alignment of the 2 time series
J Neurosurg Anesthesiol Volume 00 Number 00 rsquorsquo 2012 ZFP Hypothesis and Intracranial Pressure
r 2012 Lippincott Williams amp Wilkins wwwjnsacom | 3
patientrsquos mean ICP supporting the ZFP hypothesis forthis patient In this case the lines according to the 2 cri-teria are nearly identical and so they lead to approx-imately equal estimates of mean ICP
As mentioned above a utility of the SD criterion isthat it does not require an alignment of the ABP and FVtime series This is demonstrated in Figure 2C where thescatterplot of ABP versus FV is shown without any align-ment Also shown are the lines corresponding to the least-squares and the SD criteria their equations are y= 297+050x and y= 130+073x respectively Whereas they-intercept of the former deviates considerably from themean ICP of 135mm Hg that of the latter does not In-deed the SD line for the nonaligned data is identical to thatof the aligned data This feature is not a coincidence and isexplained in the Appendix The SD line is unaffected by anyphase difference between the ABP and FV time seriesTherefore use of the SD line simplifies the WB method byeliminating the alignment procedure
Our paper compares the WB method with the revisedmethod developed here Each method is applied to a seg-ment of the ABP and FV time series of 75 seconds (ie 300data points) This duration was selected because it is suffi-ciently long to cover several respiratory cycles (2 to 4 de-pending on the patient) at the same time being sufficientlyshort to be unaffected by slow waves in ICP Although theresults are relatively insensitive to the length of the timeseries very short time segments do not produce sufficientcases for an adequate estimation of the fit In contrastrecall that the ZFP as estimated from the ABP and FVobserved over a time segment is expected to approximatethe mean of ICP over that same time segment As suchresults obtained from very long time segments are likely tobe confounded by slow changes in ICP
To utilize the information in the time series morefully (ie beyond only one time segment of 75 s in dura-tion) 200 different segments of the time series are sam-pled randomly Each of these 200 trials yields an estimateof mean ICP This sampling of the time series is im-portant because any given time segment may or may notconfirm the ZFP hypothesis Only the aggregate of allthe 200 estimates legitimately assesses the validity of thehypothesis and its statistical significance
All analyses were performed using a statisticalanalysis software called R34
RESULTSFigure 3 shows the scatterplot of the observed ICP
versus ZFP (ie the estimated ICP) for all 104 patients forthe WB method (Fig 3A) and the revised method(Fig 3B) Each clustercolor in the figures corresponds toa patient and so each cluster contains 200 points asso-ciated with the aforementioned 200 trials The verticaland horizontal lines denote the grand mean of the ob-served ICP across all patients The diagonal line has aslope of 1 and a 0 y-intercept If the estimates were per-fect all the points in the scatterplot would reside on thisdiagonal line In contrast if the ZFP hypothesis did not
hold at all the points would be randomly distributed (atbest about the vertical line) Without performing anyquantitative analysis it is quite evident from these scat-terplots that the ZFP hypothesis does hold in the WBmethod (Fig 3A) because that procedure produces neg-ative (unphysical) ZFP values In contrast the revisedmethod (Fig 3B) does not The revised method alsoproduces a ldquotighterrdquo scatterplot suggesting higher-qualitypredictions further discussed below
Instead of a scatterplot of ICP versus ZFP manystudies consider the Bland-Altman plot that is the plotof the errors (ICP-ZFP) versus the average of ICP andZFP Figure 4A shows such a plot for the WB methodThe 3 dashed lines show the average of the errors (ie bias)plusmn2SDs in this case they are at 4plusmn33mm Hg Thefact that the average of the errors is below 0 indicates thatthe estimates are (positively) biased that is ZFP is gen-erally larger than the observed ICP Furthermore theaverages of ICP and ZFP take on negative values as aconsequence of ZFP itself taking negative values Toeliminate these negative values it may be tempting tosimply shift all ZFP by some positive amount howeverthis increases the bias further Similarly shifting ZFP bysome negative amount decreases the bias but only at thecost of increasing the incidents of negative ZFP
The results from the revised method are shownin Figure 4B The average plusmn2SD of the errors is now at0plusmn24mm Hg The plusmn2SD of the errors is reducedfrom 33 to 24mm Hg In short the revised method leads
FIGURE 3 The scatterplot of the observed intracranial pres-sure (ICP) versus zero-flow pressure (ZFP) (ie estimated ICP)for all 104 patients (clusters in different colors) according tothe Weyland et al and Buhre et al (WB) method (A) and therevised method (B) Each cluster contains 200 points corre-sponding to 200 different time segments of the time series forthat patient The vertical and horizontal lines denote the grandmean of the observed ICP across all patients The diagonal lineis a line with slope equal to 1 and y-intercept equal to 0
Marzban et al J Neurosurg Anesthesiol Volume 00 Number 00 rsquorsquo 2012
4 | wwwjnsacom r 2012 Lippincott Williams amp Wilkins
to estimates that are non-negative (ie physical) and moreprecise than those for the WB method The average errorin the revised method is nearly 0 as a consequence ofsetting g in Eq(4) to 175mm Hg The reason for thischoice is discussed in the next section
Table 1 shows quantiles of the distribution of errorsfor the 2 methods It is evident that the revised method issuperior to the WB method in terms of both the median(50th percentile) and the spread of the distribution oferrors The distribution of RMSE values is also shownThe median RMSE values for the 2 methods are 111 and82mm Hg respectively the revised method has thenarrower of the 2 distributions thereby leading to moreprecise estimates of ICP
A direct comparison of the WB method with therevised method is presented in the form of a Bland-Altman plot showing the difference between the 2 esti-mates of ZFP as a function of their average (Fig 5) Evi-dently the 2 estimates can differ significantly dependingon the patient For some patients the difference betweenthe 2 estimates is small (plusmn5mm Hg) and centered around0 For other patients the 2 estimates can differ as much asplusmn20mm Hg For some patients the revised estimates of
ZFP are consistently higher than the WB estimateswhereas for other patients that comparison is reversedMoreover the nonlinear pattern (across patients) shownin Figure 5 implies that the 2 estimates are nonlinearlyrelated this nonlinearity is a direct consequence of thenonlinearity of Eq (4) In short the relationship betweenthe 2 estimates is complex and varies between patients
DISCUSSIONThe ldquoZFP hypothesisrdquo asserts that the ZFP approx-
imates ICP Although many groups have contributed totesting this hypothesis one of the simplest methods esti-mates ZFP by extrapolation using a least squares straightline fit of ABP versus FV after the 2 time series have beenaligned Here several revisions to that method (called theldquoWB methodrdquo) are proposed first instead of a straight linefit a nonlinear equation is used Second instead of theleast-squares criterion for estimating the parameters of thefit the SD criterion is used These revisions preclude neg-ative ICP predictions and eliminate the least-squares re-quirement of maximally correlating the FV and ABP dataMoreover it is shown that these revisions improve the es-timates of ICP in terms of their bias (accuracy) and SD
FIGURE 4 Comparison of intracranial pressure (ICP) and zero-flow pressure (ZFP) for the Weyland et al and Buhre et al (WB)method (A) and the revised method (B) The dashed hori-zontal lines denote the mean and mean plusmn 2 SD They are4 plusmn 33 and 0 plusmn 24 mm Hg respectively
TABLE 1 The Percentiles of the Distribution of Errors and of RMSE for the 2 Methods
Percentiles of Error Percentiles of RMSE
0th 25th 50th 75th 100th 0th 25th 50th 75th 100th
WB method 674 149 48 55 466 00 51 111 188 674Revised method 412 84 01 81 392 00 41 82 137 412
RMSE indicates root-mean-squared error WB method Weyland et al and Buhre et al method
FIGURE 5 A Bland-Altman plot showing the difference be-tween the zero-flow pressure (ZFP) estimated by the 2methods [Weyland et al and Buhre et al (WB) method andrevised] as a function of their average The 2 estimates appearto have a nonlinear and complex relationship that varies acrosspatients
J Neurosurg Anesthesiol Volume 00 Number 00 rsquorsquo 2012 ZFP Hypothesis and Intracranial Pressure
r 2012 Lippincott Williams amp Wilkins wwwjnsacom | 5
(precision) as well as their RMSE The meanplusmn2SD of theerrors for the revised model is about 0plusmn24mm Hg incontrast to 4plusmn33mm Hg as obtained by applying theWB method to our data set The median RMSE for therevised model is 82mm Hg compared with 111mm Hgusing the WB method
Buhre et al32 reported a value of 152mm Hg fortheplusmn2SD of errors when they applied the WB method totheir data set nearly half of the value found here (33mmHg) when the WBmethod is applied to the current data setA few explanations for the discrepancy are as follows Onedifference between the 2 studies is in the mean ICP acrossall patients Buhre and colleagues reported a mean ICP of347mm Hg for their data set as opposed to 20mm Hg forthe current data set Thus their patients have generallyhigher ICP than those analyzed here Therefore it may bethat the ZFP hypothesis works better at higher ICP valuesAnother difference is in the size of the sample the data setanalyzed by Buhre and colleagues consists of 20 patientsmuch smaller than the 104 patients in the data set analyzedhere Furthermore they reported that the median numberof measurements taken from each patient was about 7resulting in a total of 180 measurements The number ofmeasurements taken from each patient in the current dataset is 200 resulting in a total of 20800 measurements Thelarger number of patients and the larger number of meas-urements per patient together are likely to lead to the largererrors found on the current data set
It is important to explain why the mean of the errorsfrom the revised method is nearly 0mm Hg The revisedmethod is based on a model [Eq (4)] that in addition to theintercept and slope parameters (a b) also has another pa-rameter (g) that effectively controls the mean of the errors(ie the bias of the ICP predictions) Whereas the formerparameters vary between patients the latter is a constant forall patients Given that it controls bias it can be set to avalue that in turn renders the predictions bias free For thecurrent data set that value is 175mmHg Assuming the 104patients in the data set are a random sample from thepopulation of interest g=175mm Hg should give bias-freepredictions for all ldquofuturerdquo patients not included in thecurrent data To test that expectation a resampling meth-od35 was used for the purpose of estimating the samplingvariability of bias when g=175mm Hg (only bias wasconsidered because it is the facet of performance most af-fected by g) Specifically the proposed model (with g=175mm Hg) was applied to half of the 104 patients ran-domly selected and the bias of the predictions was recordedThis resampling procedure was repeated 10 times each timetaking a different random sample of 52 patients and com-puting the bias of the predictions The mean plusmn2SD acrossthe 10 trials was found to be 09 plusmn20mm Hg well withinthe bounds of observational and instrumental error In otherwords the bias-free nature of the predictions on the currentdata set (as assured by g=175mm Hg) is likely to beinsensitive to sampling variations
Also note that only the mean of the observed valuesof ICP is used in determining this value of g because biasis simply the difference between the mean of the observed
and predicted ICP This observation offers another ex-planation for why the choice of g=175mm Hg is likelyto be generalizable to the population at large It is alsopossible to set g=0 in which case the observed mean ofICP is not used at all at any stage in the development ofthe revised model The result (not shown here) is that therevised method still outperforms the WB method in termsof the percentiles of the errors and the RMSE althoughthe bias of the errors is no longer 0
A visual examination of Figure 3 suggests that al-though there is a correlation between ICP and ZFPldquobetween patientsrdquo the correlation ldquowithin patientrdquo is lessclear For some patients the 200 points are tightly clus-tered around a line (implying a strong within-patientcorrelation) but for other patients no such correlation isevident We are currently investigating the characteristicsof the patients (eg the location of the ABP gauge) thatmay distinguish between these types of patients The de-composition of variance (into between-patients andwithin-patient) may also improve the estimates of ICPthrough the development of mixed-effects models36
In all of the analyses performed here the quantitycalled ZFP has served only as a predictor of ICP it has beenassumed that this ZFP is an accurate measure of the ldquotruerdquoZFP Indeed even the quantity called ABP has been as-sumed to be an accurate estimate of the true ABP The firstassumption has been addressed by Aaslid et al25 wherein itappears that examining the first harmonics of the time seriesfor ABP and FV may lead to more accurate estimates of thetrue ZFP Kalmar et al37 have also considered alternativemeasures of ZFP Hsu et al38 examined the effects of moreaccurate measures of the true ABP in assessing the trueZFP It is therefore possible that the ICP predictions fromour method can be improved further by invoking moreaccurate measures of the true ZFP and ABP
An important limitation of our study centers on ouruse of ABP data Specifically the height difference be-tween the point of ABP measurement and point of TCDmeasurement was not reported with the data collected atAddenbrookersquos Hospital We therefore did not reduce theperipherally measured ABP by an amount proportionalto this height difference to create a proxy for cerebralABP at the middle cerebral artery This may have in-troduced a systematic overestimation of cerebral ABPand therefore a shift in the scatterplots to the right withsystematical errors of ZFP and consequently of g Thispotential source of error would however contributeequally to both the WB method and the SD methodleaving the conclusion of this paper intactmdashnamely theadvantage of the SD method relative to the WB methodFuture work will consider correction to the measuredABP on the basis of the potential height difference be-tween the point of measurements of ABP and blood flowin the brain which may improve the results further
CONCLUSIONSProposed revisions to a methodology for estimating
ICP from ZFP through FV and ABP have been shown
Marzban et al J Neurosurg Anesthesiol Volume 00 Number 00 rsquorsquo 2012
6 | wwwjnsacom r 2012 Lippincott Williams amp Wilkins
to lead to improved predictions of invasively measuredvalues of ICP Although the plusmn2SD of errors is reducedfrom 33 to 24mm Hg the quality of the predictions re-mains mostly unacceptable at least clinically becausemost applications would require a prediction error ofr10mm Hg Further work including those suggestedhere is necessary before this approach can yield a clin-ically useful predictor for ICP
APPENDIXFor data on (x y) the WB method calls for a
straight line fit
yfrac14athornbx eth1THORN
where the parameters a b are estimated via the least-squares criterion from data on x=FV and y=ABP thatis
afrac14mean ABPeth THORNmean FVeth THORNb bfrac14rSD ABPeth THORN
SD FVeth THORN eth2THORN
and r is Pearson correlation coefficient between ABP andFV The ZFP hypothesis asserts that the least-squares es-timate of a (ie the y-intercept) approximates ICP The SDcriterion is based on the SD of x and y (hence the ldquoSDrdquo inthe name) The line according to the SD criterion is definedas the line that goes through the point defined by the meanof x and mean of y with a slope given by the ratio SD(y)SD(x) where SD denotes standard deviation39 In shortthe equation of an SD line for ABP versus FV is that givenin Eq (1) but with
afrac14mean ABPeth THORNmean FVeth THORNb bfrac14SD ABPeth THORN
SD FVeth THORN eth3THORN
Note that the only difference is that the correlationcoefficient does not enter into the latter This is the reasonwhy the SD line is unaffected by the alignment of x and yThe geometry underlying the SD criterion is in manyways more intuitive than that of the least-squares crite-rion despite the popularity of the latter For example if ascatterplot displays a cigar-shaped or elliptical patternthen the SD line coincides with the major axis of theellipse while the least-squares line has a slope generallysmaller than that of the SD line39 Note that in Eq (2) asr approaches 1 then the estimates of a and b according tothe least-squares criterion coincide with the estimatesgiven by the SD criterion in Eq (3) Said differently theSD line and the least-squares line coincide when x and yare aligned
The structure of the fit in Eq (1) does not precludenegative values of the y-intercept To disallow such un-physical values of ICP we propose the following fit
ygeth THORN12frac14 athornbx eth4THORN
where g is a fixed non-negative constant Then the ZFP isgiven by g+a2 and so cannot be negative Structuresinvolving the exponential have also been tested but withno noticeable difference
REFERENCES1 Becker D Miller JD Ward JD et al The outcome from severe head
injury with early diagnosis and intensive management J Neurosurg197747491ndash502
2 Miller J Butterworth JF Gudeman SK et al Further experience inthe management of severe head injury J Neurosurg 198154289ndash299
3 Narayan RK Greenberg RP Miller JD et al Improved confidenceof outcome prediction in severe head injury A comparative analysisof the clinical examination multimodality evoked potentials CTscanning and intracranial pressure J Neurosurg 198154751ndash762
4 Narayan RK Kishore PRS Becker DP et al Intracranial pressureto monitor or not to monitor A review of our experience with headinjury J Neurosurg 198256650ndash659
5 Saul T Ducker T Effect of intracranial pressure monitoring andaggressive treatment on mortality in severe head injury J Neurosurg198256498ndash503
6 Marmarou A Anderson RL Ward JD et al Impact of ICPinstability and hypotension on outcome in patients with severetrauma J Neurosurg 199175S159ndashS166
7 Marshall LP Gautille T Klauber MR et al The outcome of severeclosed head injury J Neurosurg 199175S28ndashS36
8 Ghajar J Hariri RJ Narayan RK et al Survey of critical caremanagement of comatose head injured patients in the UnitedStates Crit Care Med 199523560ndash567
9 Bullock R Chesnut RM Clifton G et al Guidelines for themanagement of severe head injury Brain Trauma FoundationJ Neurotrauma 200017451ndash553
10 Bratton SL Chesnut RM Ghajar J et al Guidelines for themanagement of severe traumatic brain injury J Neurotrauma200724(suppl)1
11 Bulger E Nathans AB Rivara FP et al Management of severehead injury institutional variations in care and effect on outcomeCrit Care Med 2002301870ndash1876
12 Patel HC Bouamra O Woodford M et al Trauma Audit andResearch Network Trends in head injury outcome from 1989 to2003 and the effect of neurosurgical care an observational studyLancet 20053661538ndash1544
13 Schmidt B Czosnyka M Raabe A et al Adaptive noninvasiveassessment of intracranial pressure and cerebral autoregulationStroke 20033484ndash89
14 Czosnyka M Smielewski P Timofeev I et al Intracranial pressuremore than a number Neurosurg Focus 2007221ndash7
15 Czosnyka M Smielewski P Lavinio A et al A synopsis of brainpressures which when Are they all useful Neurol Res 200729672ndash679
16 Ragauskas A Daubaris G Dziugys A et al Innovative non-invasive method for absolute intracranial pressure measurementwithout calibration Acta Neurochir Suppl 200595357ndash361
17 Sajjadi SA Harirchian MH Sheikhbahaei N et al The relationbetween intracranial and intraocular pressures study of 50 patientsAnn Neurol 200659867ndash870
18 Kimberly HH Shah S Marill K et al Correlation of optic nervesheath diameter with direct measurement of intracranial pressureAcad Emerg Med 200815201ndash204
19 Soldatos T Karakitsos D Chatzimichail K et al Optic nervesonography in the diagnostic evaluation of adult brain injury CritCare 200812R67
20 Soldatos T Chatzimichail K Papathanasiou M et al Optic nervesonography a new window for the non-invasive evaluation ofintracranial pressure in brain injury Emerg Med J 200926630ndash634
21 Geeraerts T Merceron S Benhamou D et al Non-invasiveassessment of intracranial pressure using ocular sonography inneurocritical care patients Intensive Care Med 2008342062ndash2067
22 Moretti R Pizzi B Ultrasonography of the optic nerve inneurocritically ill patients Acta Anaesthesiol Scand 201155644ndash652
23 Burton AC On the physical equilibrium of the small blood vesselsAm J Physiol 1951164319ndash329
J Neurosurg Anesthesiol Volume 00 Number 00 rsquorsquo 2012 ZFP Hypothesis and Intracranial Pressure
r 2012 Lippincott Williams amp Wilkins wwwjnsacom | 7
24 Aaslid R Lash SR Bardy GH et al Dynamic pressure-flowvelocity relationships in the human cerebral circulation Stroke2003341645ndash1649
25 Aaslid R Newell DW Stooss R et al Assessment of cerebralautoregulation dynamics from simultaneous arterial and venoustranscranial Doppler recordings in humans Stroke 1991221148ndash1154
26 Michel M Hillebrand S von Twickel J et al Frequency dependenceof cerebrovascular impedance in preterm neonates a different viewon critical closing pressure J Cereb Blood Flow Metab 1997171127ndash1131
27 Kottenberg-Assenmacher E Aleksic I Eckholt M et al Criticalclosing pressure as the arterial downstream pressure with the heartbeating and during circulatory arrest Anaesthesiology 2009110370ndash379
28 Sherman RW Bowie RA Henfrey MME et al Cerebralhaemodynamics in pregnancy and pre-eclampsia as assessed bytranscranial Doppler ultrasonography Br J Anaesth 200289687ndash692
29 Steiner LA Czosnyka M Sherman R et al Estimation of criticalclosing pressure and cerebral perfusion pressure using transcranialDoppler Br J Anaesth 200390396ndash397
30 Czosnyka M Smielewski P Piechnik S et al Critical closingpressure in cerebrovascular circulation J Neurol Neurosurg Psy-chiatry 199966606ndash611
31 Thees C Scholz M Schaller C et al Relationship betweenintracranial pressure and critical closing pressure in patients withneurotrauma Anesthesiology 200296595ndash599
32 Buhre W Heinzel FR Grund S et al Extrapolation to zero-flowpressure in cerebral arteries to estimate intracranial pressure Br JAnaesth 200390291ndash295
33 Weyland A Buhre W Grund S et al Cerebrovascular tone ratherthan intracranial pressure determines the effective downstreampressure of the cerebral circulation in the absence of intracranialhypertension J Neurosurg Anesthesiol 200012210ndash216
34 R Development Core Team R A Language and Environment forStatistical Computing ISBN 3-900051-07-0 R Development CoreTeam Available at httpwwwR-projectorg 2011
35 Efron B Tibshirani RJ An Introduction to the Bootstrap LondonChapman amp Hall 1993
36 Montgomery DC Design and Analysis of Experiments 6th ed NewJersey John Wiley amp Sons Inc 2005
37 Kalmar AF Dewaele F Foubert L et al Study of the cerebralhemodynamic physiology during steep Trendelenburg position andCO2 pneumoperitoneum Br J Anaesth 2012108478ndash484
38 Hsu H-Y Chen Y-T Hu H-H Limitations in estimating criticalclosing pressure by noninvasive blood pressure measurementsStroke 20043591ndash92
39 Freedman DA Statistical Models Theory and Practice New YorkCambridge University Press 2005
Marzban et al J Neurosurg Anesthesiol Volume 00 Number 00 rsquorsquo 2012
8 | wwwjnsacom r 2012 Lippincott Williams amp Wilkins
to develop alternative models of CCP estimation thatbetter correlate with ICP
Czosnyka et al30 examined several methods for es-timating CCP and also studied the correlation betweenCCP and ICP Using a data set involving 98 patients theyreported a correlation coefficient of 041 between ICP andCCP They also reported that ICP can be predicted fromCCP to within plusmn27mm Hg (95 confidence level)Thees et al31 found a correlation of 091 based on 70patients (no predictive error bar has been reported) On adata set involving 20 patients Buhre et al32 used a methoddeveloped by Weyland et al33 and reported a correlationcoefficient of 093 and a 2 SD (ie approximately 955confidence interval) of plusmn152mm Hg In the work car-ried out by these authors CCP was often referred to asthe zero-flow pressure (ZFP) and so we define the ldquoZFPhypothesisrdquo as the hypothesis that ICP can be estimatedfrom some estimate of ZFP (or CCP)
In the current paper 2 revisions to the extrapolationmethod have been examined both aimed at improvingthe estimation of ICP The revisions involve (1) relaxingthe linearity of the equationmodel used for extrapo-lation and (2) using an alternative criterion (not leastsquares) for estimating the parameters of the model Thefirst revision ensures that the ICP predictions are physical(ie non-negative) and the second revision eliminates theneed to align FV and ABPmdasha necessary step in theoriginal extrapolation method In addition to thesequalitative improvements the revised method also leadsto more accurate and precise estimates of ICP
MATERIAL AND METHODS
PatientsPatient data for this preclinical study were collected
from a variety of hospitals in the United States after astudy at the University of Washington led by DrMourad as well as from Addenbrookersquos HospitalCambridge England led by Dr Czosnyka
The core contributing hospitals within the UnitedStates were Harborview Medical Center (Seattle WA)Columbia University Medical College (New York CityNY) and the University of Texas Medical School atHouston TX Data from 59 patients (49 male 10 female)with a mean age of 34 years (range 13 to 81) and a meanGlasgow Coma Score of 5 (range 3 to 11) were collectedStudies there met the following inclusion criteria (1) allpatients experienced closed head injury (2) no patientreceived neurosurgical intervention other than placementof an invasive ICP monitor (3) all patients had an ABPcatheter in place at the time of the study (4) all patientscould tolerate a TCD examination (5) all patients were 8years old or older and (6) informed consent was obtainedfrom all patients or their families These criteria were alsofollowed at Addenbrookersquos Hospital except that patientsregardless of age could consent to participate in the studyand in addition all patients were intubated Finally forboth centers all patients were monitored and treated
following the specifications of the Brain Trauma Foun-dation910
Figure 1 shows the distribution of the mean invasiveICP (in black) of 59 patients collected by the team at theUniversity of Washington In addition 45 patients fromCambridge England were chosen from over 300 anon-ymous cases collected by that institution to ldquofill inrdquo thegaps in the ICP distribution of data collected at theUniversity of Washington These gaps are on the high-ICP side of the distribution However to avoid asituation in which all high-ICP patients are fromCambridge low-ICP patients from Cambridge were alsoincluded in the analysis The distribution of ICP for theCambridge patients is shown in red in Figure 1 Schmidtet al13 described the circumstances under which these datawere collected including the fact that TCD recording wasa part of routine daily examination of cerebral hemody-namics and anonymous use of these recordings for fur-ther retrospective methodological studies was approvedby the local Neurocitical Care Users Committee
DataFor each patient ABP ICP and maximum blood-
FV within the middle cerebral artery (or FV) Doppler timeseries were acquired through clinically approved TCD unitsand processed using custom software so as to providesynchronized ABP ICP and FV data Data acquisitionlengths varied from 5 to 30 minutes and were obtainedanywhere from 0 to 11 days after placement of an ICPsensor ICP was monitored using a ventricular catheter(Integra Lifesciences Corporation or Camino Labo-ratories) by which cerebral spinal fluid drains were closedand supervised during data capture ICP was also moni-tored with a Camino parenchymal catheter (Integra Life-sciences Corporation) or a Codman parenchymal ICPmicrosensor (Codman Neuroscience) Blood pressure was
FIGURE 1 Distribution of intracranial pressure (ICP) for theUniversity of Washington patients (black) and the Cambridgepatients (red)
Marzban et al J Neurosurg Anesthesiol Volume 00 Number 00 rsquorsquo 2012
2 | wwwjnsacom r 2012 Lippincott Williams amp Wilkins
acquired invasively from an arterial line placed in the ra-dial femoral brachial or ulnar artery All patients fromCambridge were sedated paralyzed and ventilated tomaintain adequate oxygenation and mild hypocapnia Allpatients from the University of Washington cohort under-went the same treatment except for 1 patient who was nolonger under ventilation when this study was performed
All retrospective data processing and analysis wasconducted at the Applied Physics Laboratory (APL)University of Washington Data collected through the APLhospital cohort were digitized at 125Hz whereas datacollected in Cambridge were digitized at 40Hz To place thedata sets on the same footing the APL data sets weredownsampled to 40Hz A fixed duration (5min) was se-lected from each of the 104 patients for statistical analysis
Data Processing and Statistical AnalysisIn this study the methodology of Weyland et al33
and Buhre et al32 (WB method) has been revised Therevised method involves 2 specific alterations (1) thelinear modelequation in the WB method is replaced witha nonlinear equation and (2) the least-squares criterionfor estimating the parameters of the model is replacedwith an alternative criterion that does not have a commonname we shall refer to it as the SD criterion These re-visions are further described in the Appendix The mainpurpose of the first revision is to prevent negative ICPpredictions that arise in the WB method The primarybenefit of the second revision is to preclude the pre-
processing step of aligning the FV and ABP time seriesThis alignment is necessary for the least-squares criterionmethod and requires the specification of quantities thatadd to its complexity For example given that the align-ment procedure is an optimization problem one mustspecify the quantity being optimized the correlation orthe covariance between the 2 series are common choicesbut can lead to different results The duration of the 2time series over which the alignment is performed is an-other quantity that can affect the results In addition tothese benefits the revised methodology (involving bothrevisions) leads to higher-quality ICP predictions ascompared with those of the WB method The goodness ofthe ICP estimates is assessed in terms of the bias SD androot-mean-square of the errors (RMSE)
To demonstrate the ingredients of the WB methodconsider the data from a single patient Figure 2A showsthe time series for FV (solid curve) and ABP (dashed line)for 1 patient for a duration of 25 seconds (ie 100 datapoints displayed at 40Hz) Figure 2B displays the scat-terplot of ABP versus FV (circles) after they have beenaligned The 2 lines are based on the least-squares crite-rion (dotted) and the SD criterion (solid) their equationsare y= 141+070x and y= 130+073x respectivelyThe ZFP hypothesis asserts that the y-intercept of theleast-squares line approximates the mean ICP The meanof the observed ICP for this patient is 135mm Hgmarked with an arrow along the y-axis Evidentlythe y-intercept of the least-squares line agrees with this
FIGURE 2 A The time series of flow velocity (FV) (solid line) and arterial blood pressure (ABP) (dashed line) for 1 patient BScatterplot of ABP versus FV (circles) the least-squares fit (dotted line) and the SD line (solid line) The mean ICP for this patient islabeled along the y-axis with an arrow C Same as B but before alignment of the 2 time series
J Neurosurg Anesthesiol Volume 00 Number 00 rsquorsquo 2012 ZFP Hypothesis and Intracranial Pressure
r 2012 Lippincott Williams amp Wilkins wwwjnsacom | 3
patientrsquos mean ICP supporting the ZFP hypothesis forthis patient In this case the lines according to the 2 cri-teria are nearly identical and so they lead to approx-imately equal estimates of mean ICP
As mentioned above a utility of the SD criterion isthat it does not require an alignment of the ABP and FVtime series This is demonstrated in Figure 2C where thescatterplot of ABP versus FV is shown without any align-ment Also shown are the lines corresponding to the least-squares and the SD criteria their equations are y= 297+050x and y= 130+073x respectively Whereas they-intercept of the former deviates considerably from themean ICP of 135mm Hg that of the latter does not In-deed the SD line for the nonaligned data is identical to thatof the aligned data This feature is not a coincidence and isexplained in the Appendix The SD line is unaffected by anyphase difference between the ABP and FV time seriesTherefore use of the SD line simplifies the WB method byeliminating the alignment procedure
Our paper compares the WB method with the revisedmethod developed here Each method is applied to a seg-ment of the ABP and FV time series of 75 seconds (ie 300data points) This duration was selected because it is suffi-ciently long to cover several respiratory cycles (2 to 4 de-pending on the patient) at the same time being sufficientlyshort to be unaffected by slow waves in ICP Although theresults are relatively insensitive to the length of the timeseries very short time segments do not produce sufficientcases for an adequate estimation of the fit In contrastrecall that the ZFP as estimated from the ABP and FVobserved over a time segment is expected to approximatethe mean of ICP over that same time segment As suchresults obtained from very long time segments are likely tobe confounded by slow changes in ICP
To utilize the information in the time series morefully (ie beyond only one time segment of 75 s in dura-tion) 200 different segments of the time series are sam-pled randomly Each of these 200 trials yields an estimateof mean ICP This sampling of the time series is im-portant because any given time segment may or may notconfirm the ZFP hypothesis Only the aggregate of allthe 200 estimates legitimately assesses the validity of thehypothesis and its statistical significance
All analyses were performed using a statisticalanalysis software called R34
RESULTSFigure 3 shows the scatterplot of the observed ICP
versus ZFP (ie the estimated ICP) for all 104 patients forthe WB method (Fig 3A) and the revised method(Fig 3B) Each clustercolor in the figures corresponds toa patient and so each cluster contains 200 points asso-ciated with the aforementioned 200 trials The verticaland horizontal lines denote the grand mean of the ob-served ICP across all patients The diagonal line has aslope of 1 and a 0 y-intercept If the estimates were per-fect all the points in the scatterplot would reside on thisdiagonal line In contrast if the ZFP hypothesis did not
hold at all the points would be randomly distributed (atbest about the vertical line) Without performing anyquantitative analysis it is quite evident from these scat-terplots that the ZFP hypothesis does hold in the WBmethod (Fig 3A) because that procedure produces neg-ative (unphysical) ZFP values In contrast the revisedmethod (Fig 3B) does not The revised method alsoproduces a ldquotighterrdquo scatterplot suggesting higher-qualitypredictions further discussed below
Instead of a scatterplot of ICP versus ZFP manystudies consider the Bland-Altman plot that is the plotof the errors (ICP-ZFP) versus the average of ICP andZFP Figure 4A shows such a plot for the WB methodThe 3 dashed lines show the average of the errors (ie bias)plusmn2SDs in this case they are at 4plusmn33mm Hg Thefact that the average of the errors is below 0 indicates thatthe estimates are (positively) biased that is ZFP is gen-erally larger than the observed ICP Furthermore theaverages of ICP and ZFP take on negative values as aconsequence of ZFP itself taking negative values Toeliminate these negative values it may be tempting tosimply shift all ZFP by some positive amount howeverthis increases the bias further Similarly shifting ZFP bysome negative amount decreases the bias but only at thecost of increasing the incidents of negative ZFP
The results from the revised method are shownin Figure 4B The average plusmn2SD of the errors is now at0plusmn24mm Hg The plusmn2SD of the errors is reducedfrom 33 to 24mm Hg In short the revised method leads
FIGURE 3 The scatterplot of the observed intracranial pres-sure (ICP) versus zero-flow pressure (ZFP) (ie estimated ICP)for all 104 patients (clusters in different colors) according tothe Weyland et al and Buhre et al (WB) method (A) and therevised method (B) Each cluster contains 200 points corre-sponding to 200 different time segments of the time series forthat patient The vertical and horizontal lines denote the grandmean of the observed ICP across all patients The diagonal lineis a line with slope equal to 1 and y-intercept equal to 0
Marzban et al J Neurosurg Anesthesiol Volume 00 Number 00 rsquorsquo 2012
4 | wwwjnsacom r 2012 Lippincott Williams amp Wilkins
to estimates that are non-negative (ie physical) and moreprecise than those for the WB method The average errorin the revised method is nearly 0 as a consequence ofsetting g in Eq(4) to 175mm Hg The reason for thischoice is discussed in the next section
Table 1 shows quantiles of the distribution of errorsfor the 2 methods It is evident that the revised method issuperior to the WB method in terms of both the median(50th percentile) and the spread of the distribution oferrors The distribution of RMSE values is also shownThe median RMSE values for the 2 methods are 111 and82mm Hg respectively the revised method has thenarrower of the 2 distributions thereby leading to moreprecise estimates of ICP
A direct comparison of the WB method with therevised method is presented in the form of a Bland-Altman plot showing the difference between the 2 esti-mates of ZFP as a function of their average (Fig 5) Evi-dently the 2 estimates can differ significantly dependingon the patient For some patients the difference betweenthe 2 estimates is small (plusmn5mm Hg) and centered around0 For other patients the 2 estimates can differ as much asplusmn20mm Hg For some patients the revised estimates of
ZFP are consistently higher than the WB estimateswhereas for other patients that comparison is reversedMoreover the nonlinear pattern (across patients) shownin Figure 5 implies that the 2 estimates are nonlinearlyrelated this nonlinearity is a direct consequence of thenonlinearity of Eq (4) In short the relationship betweenthe 2 estimates is complex and varies between patients
DISCUSSIONThe ldquoZFP hypothesisrdquo asserts that the ZFP approx-
imates ICP Although many groups have contributed totesting this hypothesis one of the simplest methods esti-mates ZFP by extrapolation using a least squares straightline fit of ABP versus FV after the 2 time series have beenaligned Here several revisions to that method (called theldquoWB methodrdquo) are proposed first instead of a straight linefit a nonlinear equation is used Second instead of theleast-squares criterion for estimating the parameters of thefit the SD criterion is used These revisions preclude neg-ative ICP predictions and eliminate the least-squares re-quirement of maximally correlating the FV and ABP dataMoreover it is shown that these revisions improve the es-timates of ICP in terms of their bias (accuracy) and SD
FIGURE 4 Comparison of intracranial pressure (ICP) and zero-flow pressure (ZFP) for the Weyland et al and Buhre et al (WB)method (A) and the revised method (B) The dashed hori-zontal lines denote the mean and mean plusmn 2 SD They are4 plusmn 33 and 0 plusmn 24 mm Hg respectively
TABLE 1 The Percentiles of the Distribution of Errors and of RMSE for the 2 Methods
Percentiles of Error Percentiles of RMSE
0th 25th 50th 75th 100th 0th 25th 50th 75th 100th
WB method 674 149 48 55 466 00 51 111 188 674Revised method 412 84 01 81 392 00 41 82 137 412
RMSE indicates root-mean-squared error WB method Weyland et al and Buhre et al method
FIGURE 5 A Bland-Altman plot showing the difference be-tween the zero-flow pressure (ZFP) estimated by the 2methods [Weyland et al and Buhre et al (WB) method andrevised] as a function of their average The 2 estimates appearto have a nonlinear and complex relationship that varies acrosspatients
J Neurosurg Anesthesiol Volume 00 Number 00 rsquorsquo 2012 ZFP Hypothesis and Intracranial Pressure
r 2012 Lippincott Williams amp Wilkins wwwjnsacom | 5
(precision) as well as their RMSE The meanplusmn2SD of theerrors for the revised model is about 0plusmn24mm Hg incontrast to 4plusmn33mm Hg as obtained by applying theWB method to our data set The median RMSE for therevised model is 82mm Hg compared with 111mm Hgusing the WB method
Buhre et al32 reported a value of 152mm Hg fortheplusmn2SD of errors when they applied the WB method totheir data set nearly half of the value found here (33mmHg) when the WBmethod is applied to the current data setA few explanations for the discrepancy are as follows Onedifference between the 2 studies is in the mean ICP acrossall patients Buhre and colleagues reported a mean ICP of347mm Hg for their data set as opposed to 20mm Hg forthe current data set Thus their patients have generallyhigher ICP than those analyzed here Therefore it may bethat the ZFP hypothesis works better at higher ICP valuesAnother difference is in the size of the sample the data setanalyzed by Buhre and colleagues consists of 20 patientsmuch smaller than the 104 patients in the data set analyzedhere Furthermore they reported that the median numberof measurements taken from each patient was about 7resulting in a total of 180 measurements The number ofmeasurements taken from each patient in the current dataset is 200 resulting in a total of 20800 measurements Thelarger number of patients and the larger number of meas-urements per patient together are likely to lead to the largererrors found on the current data set
It is important to explain why the mean of the errorsfrom the revised method is nearly 0mm Hg The revisedmethod is based on a model [Eq (4)] that in addition to theintercept and slope parameters (a b) also has another pa-rameter (g) that effectively controls the mean of the errors(ie the bias of the ICP predictions) Whereas the formerparameters vary between patients the latter is a constant forall patients Given that it controls bias it can be set to avalue that in turn renders the predictions bias free For thecurrent data set that value is 175mmHg Assuming the 104patients in the data set are a random sample from thepopulation of interest g=175mm Hg should give bias-freepredictions for all ldquofuturerdquo patients not included in thecurrent data To test that expectation a resampling meth-od35 was used for the purpose of estimating the samplingvariability of bias when g=175mm Hg (only bias wasconsidered because it is the facet of performance most af-fected by g) Specifically the proposed model (with g=175mm Hg) was applied to half of the 104 patients ran-domly selected and the bias of the predictions was recordedThis resampling procedure was repeated 10 times each timetaking a different random sample of 52 patients and com-puting the bias of the predictions The mean plusmn2SD acrossthe 10 trials was found to be 09 plusmn20mm Hg well withinthe bounds of observational and instrumental error In otherwords the bias-free nature of the predictions on the currentdata set (as assured by g=175mm Hg) is likely to beinsensitive to sampling variations
Also note that only the mean of the observed valuesof ICP is used in determining this value of g because biasis simply the difference between the mean of the observed
and predicted ICP This observation offers another ex-planation for why the choice of g=175mm Hg is likelyto be generalizable to the population at large It is alsopossible to set g=0 in which case the observed mean ofICP is not used at all at any stage in the development ofthe revised model The result (not shown here) is that therevised method still outperforms the WB method in termsof the percentiles of the errors and the RMSE althoughthe bias of the errors is no longer 0
A visual examination of Figure 3 suggests that al-though there is a correlation between ICP and ZFPldquobetween patientsrdquo the correlation ldquowithin patientrdquo is lessclear For some patients the 200 points are tightly clus-tered around a line (implying a strong within-patientcorrelation) but for other patients no such correlation isevident We are currently investigating the characteristicsof the patients (eg the location of the ABP gauge) thatmay distinguish between these types of patients The de-composition of variance (into between-patients andwithin-patient) may also improve the estimates of ICPthrough the development of mixed-effects models36
In all of the analyses performed here the quantitycalled ZFP has served only as a predictor of ICP it has beenassumed that this ZFP is an accurate measure of the ldquotruerdquoZFP Indeed even the quantity called ABP has been as-sumed to be an accurate estimate of the true ABP The firstassumption has been addressed by Aaslid et al25 wherein itappears that examining the first harmonics of the time seriesfor ABP and FV may lead to more accurate estimates of thetrue ZFP Kalmar et al37 have also considered alternativemeasures of ZFP Hsu et al38 examined the effects of moreaccurate measures of the true ABP in assessing the trueZFP It is therefore possible that the ICP predictions fromour method can be improved further by invoking moreaccurate measures of the true ZFP and ABP
An important limitation of our study centers on ouruse of ABP data Specifically the height difference be-tween the point of ABP measurement and point of TCDmeasurement was not reported with the data collected atAddenbrookersquos Hospital We therefore did not reduce theperipherally measured ABP by an amount proportionalto this height difference to create a proxy for cerebralABP at the middle cerebral artery This may have in-troduced a systematic overestimation of cerebral ABPand therefore a shift in the scatterplots to the right withsystematical errors of ZFP and consequently of g Thispotential source of error would however contributeequally to both the WB method and the SD methodleaving the conclusion of this paper intactmdashnamely theadvantage of the SD method relative to the WB methodFuture work will consider correction to the measuredABP on the basis of the potential height difference be-tween the point of measurements of ABP and blood flowin the brain which may improve the results further
CONCLUSIONSProposed revisions to a methodology for estimating
ICP from ZFP through FV and ABP have been shown
Marzban et al J Neurosurg Anesthesiol Volume 00 Number 00 rsquorsquo 2012
6 | wwwjnsacom r 2012 Lippincott Williams amp Wilkins
to lead to improved predictions of invasively measuredvalues of ICP Although the plusmn2SD of errors is reducedfrom 33 to 24mm Hg the quality of the predictions re-mains mostly unacceptable at least clinically becausemost applications would require a prediction error ofr10mm Hg Further work including those suggestedhere is necessary before this approach can yield a clin-ically useful predictor for ICP
APPENDIXFor data on (x y) the WB method calls for a
straight line fit
yfrac14athornbx eth1THORN
where the parameters a b are estimated via the least-squares criterion from data on x=FV and y=ABP thatis
afrac14mean ABPeth THORNmean FVeth THORNb bfrac14rSD ABPeth THORN
SD FVeth THORN eth2THORN
and r is Pearson correlation coefficient between ABP andFV The ZFP hypothesis asserts that the least-squares es-timate of a (ie the y-intercept) approximates ICP The SDcriterion is based on the SD of x and y (hence the ldquoSDrdquo inthe name) The line according to the SD criterion is definedas the line that goes through the point defined by the meanof x and mean of y with a slope given by the ratio SD(y)SD(x) where SD denotes standard deviation39 In shortthe equation of an SD line for ABP versus FV is that givenin Eq (1) but with
afrac14mean ABPeth THORNmean FVeth THORNb bfrac14SD ABPeth THORN
SD FVeth THORN eth3THORN
Note that the only difference is that the correlationcoefficient does not enter into the latter This is the reasonwhy the SD line is unaffected by the alignment of x and yThe geometry underlying the SD criterion is in manyways more intuitive than that of the least-squares crite-rion despite the popularity of the latter For example if ascatterplot displays a cigar-shaped or elliptical patternthen the SD line coincides with the major axis of theellipse while the least-squares line has a slope generallysmaller than that of the SD line39 Note that in Eq (2) asr approaches 1 then the estimates of a and b according tothe least-squares criterion coincide with the estimatesgiven by the SD criterion in Eq (3) Said differently theSD line and the least-squares line coincide when x and yare aligned
The structure of the fit in Eq (1) does not precludenegative values of the y-intercept To disallow such un-physical values of ICP we propose the following fit
ygeth THORN12frac14 athornbx eth4THORN
where g is a fixed non-negative constant Then the ZFP isgiven by g+a2 and so cannot be negative Structuresinvolving the exponential have also been tested but withno noticeable difference
REFERENCES1 Becker D Miller JD Ward JD et al The outcome from severe head
injury with early diagnosis and intensive management J Neurosurg197747491ndash502
2 Miller J Butterworth JF Gudeman SK et al Further experience inthe management of severe head injury J Neurosurg 198154289ndash299
3 Narayan RK Greenberg RP Miller JD et al Improved confidenceof outcome prediction in severe head injury A comparative analysisof the clinical examination multimodality evoked potentials CTscanning and intracranial pressure J Neurosurg 198154751ndash762
4 Narayan RK Kishore PRS Becker DP et al Intracranial pressureto monitor or not to monitor A review of our experience with headinjury J Neurosurg 198256650ndash659
5 Saul T Ducker T Effect of intracranial pressure monitoring andaggressive treatment on mortality in severe head injury J Neurosurg198256498ndash503
6 Marmarou A Anderson RL Ward JD et al Impact of ICPinstability and hypotension on outcome in patients with severetrauma J Neurosurg 199175S159ndashS166
7 Marshall LP Gautille T Klauber MR et al The outcome of severeclosed head injury J Neurosurg 199175S28ndashS36
8 Ghajar J Hariri RJ Narayan RK et al Survey of critical caremanagement of comatose head injured patients in the UnitedStates Crit Care Med 199523560ndash567
9 Bullock R Chesnut RM Clifton G et al Guidelines for themanagement of severe head injury Brain Trauma FoundationJ Neurotrauma 200017451ndash553
10 Bratton SL Chesnut RM Ghajar J et al Guidelines for themanagement of severe traumatic brain injury J Neurotrauma200724(suppl)1
11 Bulger E Nathans AB Rivara FP et al Management of severehead injury institutional variations in care and effect on outcomeCrit Care Med 2002301870ndash1876
12 Patel HC Bouamra O Woodford M et al Trauma Audit andResearch Network Trends in head injury outcome from 1989 to2003 and the effect of neurosurgical care an observational studyLancet 20053661538ndash1544
13 Schmidt B Czosnyka M Raabe A et al Adaptive noninvasiveassessment of intracranial pressure and cerebral autoregulationStroke 20033484ndash89
14 Czosnyka M Smielewski P Timofeev I et al Intracranial pressuremore than a number Neurosurg Focus 2007221ndash7
15 Czosnyka M Smielewski P Lavinio A et al A synopsis of brainpressures which when Are they all useful Neurol Res 200729672ndash679
16 Ragauskas A Daubaris G Dziugys A et al Innovative non-invasive method for absolute intracranial pressure measurementwithout calibration Acta Neurochir Suppl 200595357ndash361
17 Sajjadi SA Harirchian MH Sheikhbahaei N et al The relationbetween intracranial and intraocular pressures study of 50 patientsAnn Neurol 200659867ndash870
18 Kimberly HH Shah S Marill K et al Correlation of optic nervesheath diameter with direct measurement of intracranial pressureAcad Emerg Med 200815201ndash204
19 Soldatos T Karakitsos D Chatzimichail K et al Optic nervesonography in the diagnostic evaluation of adult brain injury CritCare 200812R67
20 Soldatos T Chatzimichail K Papathanasiou M et al Optic nervesonography a new window for the non-invasive evaluation ofintracranial pressure in brain injury Emerg Med J 200926630ndash634
21 Geeraerts T Merceron S Benhamou D et al Non-invasiveassessment of intracranial pressure using ocular sonography inneurocritical care patients Intensive Care Med 2008342062ndash2067
22 Moretti R Pizzi B Ultrasonography of the optic nerve inneurocritically ill patients Acta Anaesthesiol Scand 201155644ndash652
23 Burton AC On the physical equilibrium of the small blood vesselsAm J Physiol 1951164319ndash329
J Neurosurg Anesthesiol Volume 00 Number 00 rsquorsquo 2012 ZFP Hypothesis and Intracranial Pressure
r 2012 Lippincott Williams amp Wilkins wwwjnsacom | 7
24 Aaslid R Lash SR Bardy GH et al Dynamic pressure-flowvelocity relationships in the human cerebral circulation Stroke2003341645ndash1649
25 Aaslid R Newell DW Stooss R et al Assessment of cerebralautoregulation dynamics from simultaneous arterial and venoustranscranial Doppler recordings in humans Stroke 1991221148ndash1154
26 Michel M Hillebrand S von Twickel J et al Frequency dependenceof cerebrovascular impedance in preterm neonates a different viewon critical closing pressure J Cereb Blood Flow Metab 1997171127ndash1131
27 Kottenberg-Assenmacher E Aleksic I Eckholt M et al Criticalclosing pressure as the arterial downstream pressure with the heartbeating and during circulatory arrest Anaesthesiology 2009110370ndash379
28 Sherman RW Bowie RA Henfrey MME et al Cerebralhaemodynamics in pregnancy and pre-eclampsia as assessed bytranscranial Doppler ultrasonography Br J Anaesth 200289687ndash692
29 Steiner LA Czosnyka M Sherman R et al Estimation of criticalclosing pressure and cerebral perfusion pressure using transcranialDoppler Br J Anaesth 200390396ndash397
30 Czosnyka M Smielewski P Piechnik S et al Critical closingpressure in cerebrovascular circulation J Neurol Neurosurg Psy-chiatry 199966606ndash611
31 Thees C Scholz M Schaller C et al Relationship betweenintracranial pressure and critical closing pressure in patients withneurotrauma Anesthesiology 200296595ndash599
32 Buhre W Heinzel FR Grund S et al Extrapolation to zero-flowpressure in cerebral arteries to estimate intracranial pressure Br JAnaesth 200390291ndash295
33 Weyland A Buhre W Grund S et al Cerebrovascular tone ratherthan intracranial pressure determines the effective downstreampressure of the cerebral circulation in the absence of intracranialhypertension J Neurosurg Anesthesiol 200012210ndash216
34 R Development Core Team R A Language and Environment forStatistical Computing ISBN 3-900051-07-0 R Development CoreTeam Available at httpwwwR-projectorg 2011
35 Efron B Tibshirani RJ An Introduction to the Bootstrap LondonChapman amp Hall 1993
36 Montgomery DC Design and Analysis of Experiments 6th ed NewJersey John Wiley amp Sons Inc 2005
37 Kalmar AF Dewaele F Foubert L et al Study of the cerebralhemodynamic physiology during steep Trendelenburg position andCO2 pneumoperitoneum Br J Anaesth 2012108478ndash484
38 Hsu H-Y Chen Y-T Hu H-H Limitations in estimating criticalclosing pressure by noninvasive blood pressure measurementsStroke 20043591ndash92
39 Freedman DA Statistical Models Theory and Practice New YorkCambridge University Press 2005
Marzban et al J Neurosurg Anesthesiol Volume 00 Number 00 rsquorsquo 2012
8 | wwwjnsacom r 2012 Lippincott Williams amp Wilkins


