Embed Size (px)
Citation preview

A METHOD FOR DETERMINING SUCROSE AND CORN SYRUP
SOLIDS CONTENTS OF DAIRY-TYPE FROZEN DESSERTS
USING INVERTASE AND AMYLOGLUCOSIDASE
By
ANDREW H. MAGER, B,S,
A THESIS
IN
FOOD TECHNOLOGY
Submitted to the Graduate Faculty of Texas Tech University in Partial Fulfillment of the Requirements for
the Degree of
MASTER OF SCIENCE
Approved
Accepted
August, 1978

H01'UUH6
7 :
ACKNOWLEDGMENTS
The author wishes to express sincere appreciation to Dr. M. L.
Peeples for his numerous suggestions, technical contributions, and
assistance in preparation of this material, and to my parents,
Mr. and Mrs. George L. Mager, for their understanding and encourage
ment throughout this study.
11

CONTENTS
ACKNOWLEDGMENTS ii
LIST OF TABLES iv
LIST OF FIGURES v
I. INTRODUCTION 1
II. BACKGROUND 2
III. PROCEDURE 7
General 7
Methods 10
Detailed Procedures 12
Experimental Design 14
IV. RESULTS AND DISCUSSION 18
V. SUMMARY 29
LIST OF REFERENCES 31
111

LIST OF TABLES
Table Page
1. Percentages of Milk Powder, Whey Powder, Sucrose, Corn Syrup Solids, and Fat in Experimental Ice Cream Mixes 15
2. Percentages of Lactose, Sucrose and Corn Syrup Solids in the Experimental Mixes 21
3. Comparison of Actual Amounts of Sucrose in 30 Gram Samples of Ice Cream Mix to Amounts Determined Experimentally 22
4. Comparison of Actual Amounts of Corn Syrup Solids and Lactose in 30 Gram Samples of Ice Cream Mix to Amounts Determined Experimentally 23
5. GE Values for Each Titration Involved in Analyzing the Four Experimental Ice Cream Mixes 24
IV
LIST OF FIGURES
Figure Page
1. Diagrammatic sketch of proposed method for estimating percentages of sucrose and com syrup solids in frozen dairy-type desserts 9

I. INTRODUCTION
To date, there are no simplified procedures available to the
dairy industry for quantitatively measuring the various sugar
contents in ice cream mixes. This thesis represents a continuation
of efforts at Texas Tech University regarding the development of such
a method.
Essentially the objective of this research was to modify the
procedures of Eastham (1963) and Hutcheson (1977). Eastham developed
a procedure involving the use of Fehling's solution to measure the
reducing power of sugars in both their unhydrolyzed and hydrolyzed
states, and delineated a rather satisfactory method for estimating
sucrose content of ice cream. Hutcheson reported a method for
determining amounts of lactose in frozen desserts by using the enzyme
Beta-galactosidase.
This study was concerned with determining sucrose and corn
syrup solids contents in frozen desserts by using the enzyme
invertase for hydrolyzing sucrose, and a commercial preparation of
amyloglucosidase for com syrup solids. The reducing powers of
samples hydrolyzed with these enzymes were measured by the method
of Peeples & Hutcheson (1978), and formulas for converting the data
to percentages of each sugar were developed.
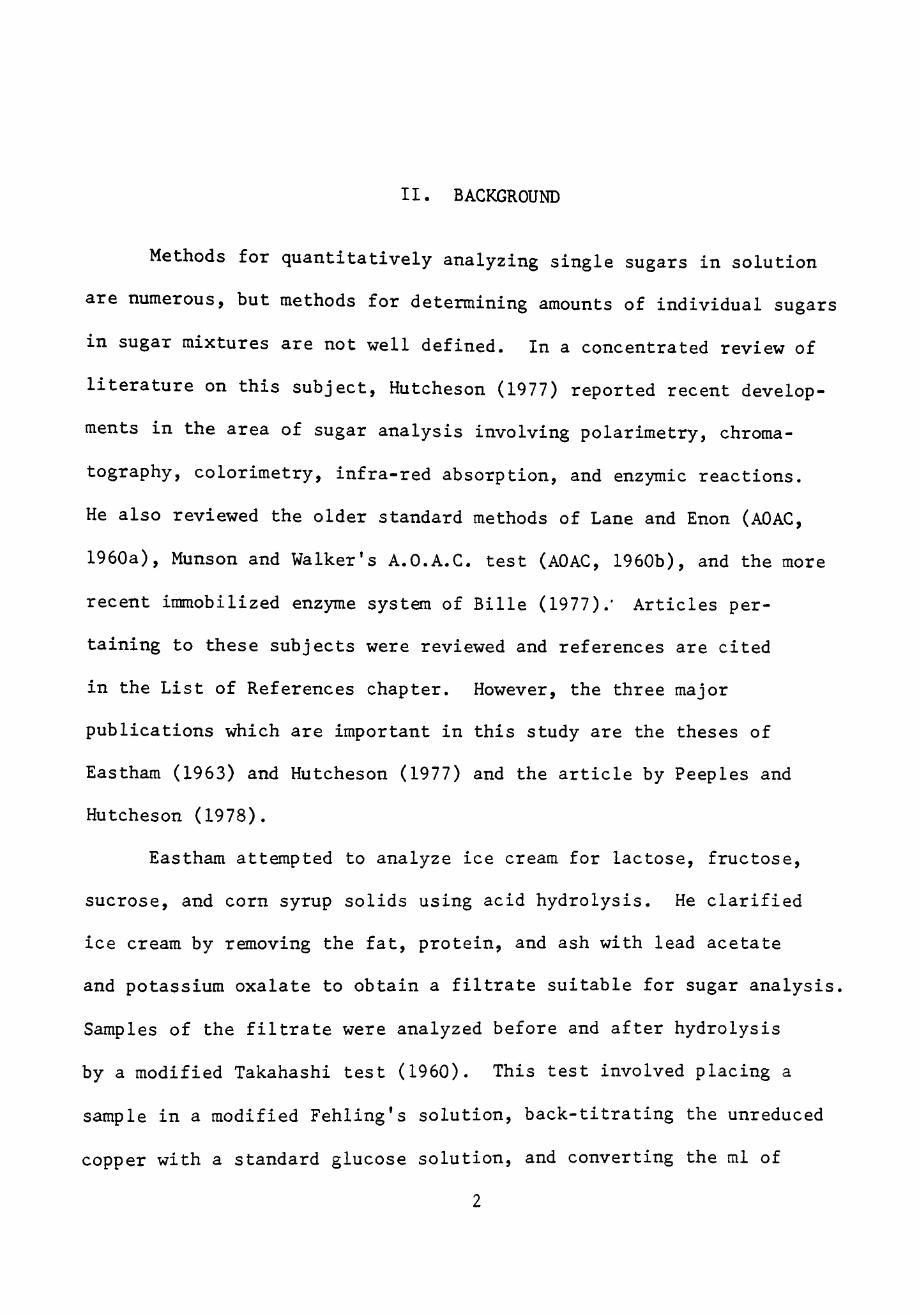
II. BACKGROUND
Methods for quantitatively analyzing single sugars in solution
are numerous, but methods for determining amounts of individual sugars
in sugar mixtures are not well defined. In a concentrated review of
literature on this subject, Hutcheson (1977) reported recent develop
ments in the area of sugar analysis involving polarimetry, chroma
tography, colorimetry, infra-red absorption, and enzymic reactions.
He also reviewed the older standard methods of Lane and Enon (AOAC,
1960a), Munson and Walker's A.O.A.C. test (AOAC, 1960b), and the more
recent immobilized enzyme system of Bille (1977).* Articles per
taining to these subjects were reviewed and references are cited
in the List of References chapter. However, the three major
publications which are important in this study are the theses of
Eastham (1963) and Hutcheson (1977) and the article by Peeples and
Hutcheson (1978),
Eastham attempted to analyze ice cream for lactose, fructose,
sucrose, and corn syrup solids using acid hydrolysis. He clarified
ice cream by removing the fat, protein, and ash with lead acetate
and potassium oxalate to obtain a filtrate suitable for sugar analysis.
Samples of the filtrate were analyzed before and after hydrolysis
by a modified Takahashi test (1960). This test involved placing a
sample in a modified Fehling's solution, back-titrating the unreduced
copper with a standard glucose solution, and converting the ml of

standard glucose solution used to reducing power of the sample in
terms of grams glucose equivalent, Eastham reasoned that the
difference between grams glucose equivalent of the unhydrolyzed and
the hydrolyzed samples was proportional to the amounts of total sugars
present, but he had problems in distinguishing the amounts of
particular sugars contributing to this reducing power.
He determined sucrose content by using a modified Kolthoff-
Kruisheer test (1948). In this method the reducing power of the
aldehyde sugars in hydrolyzed samples were destroyed with a hypoiodite
solution so that only the reducing power of ketose sugars (fructose)
from the sucrose was measured titrametrically and converted to percent
sucrose in the sample.
He then estimated the amount of milk-solids-not-fat in the sample
by the Crowhurst procedure (1956) and calculated the percentage of
lactose on the assumption that milk-solids-not-fat contains 557.
lactose. Then, he combined the glucose equivalents calculated for
hydrolyzed sucrose and lactose in the samples and subtracted the
calculated grams glucose equivalent of the unhydrolyzed sample. This
difference he converted to, and reported as, percent com syrup solids.
Obviously, his procedures for estimating lactose and corn syrup solids
contents were less than adequate. Accordingly, Peeples, in reporting
on Eastham's work, published only the procedures for estimating
sucrose content in ice cream samples (Peeples, 1972).
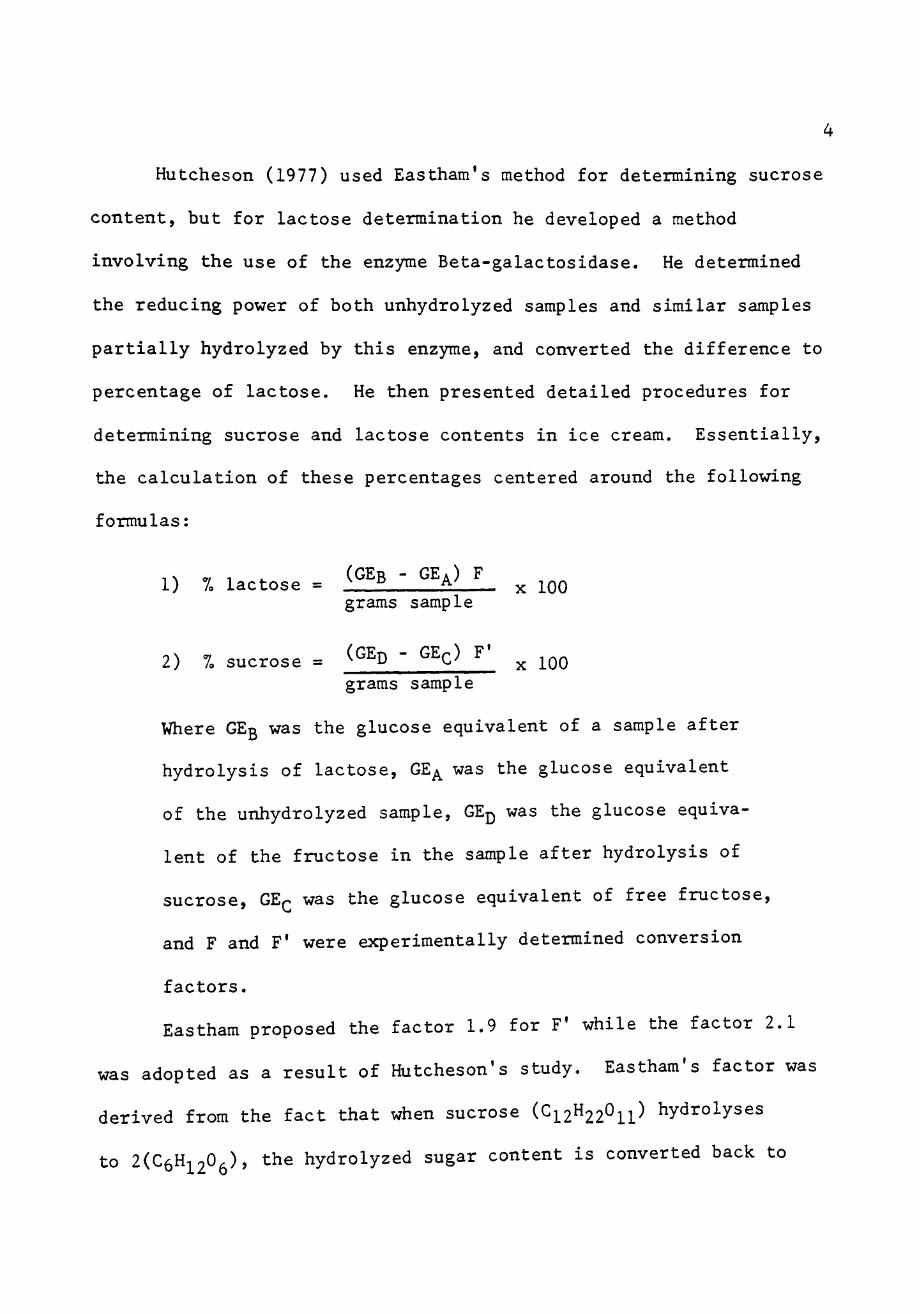
Hutcheson (1977) used Eastham's method for determining sucrose
content, but for lactose determination he developed a method
involving the use of the enzyme Beta-galactosidase. He determined
the reducing power of both unhydrolyzed samples and similar samples
partially hydrolyzed by this enzyme, and converted the difference to
percentage of lactose. He then presented detailed procedures for
determining sucrose and lactose contents in ice cream. Essentially,
the calculation of these percentages centered around the following
formulas:
i\ »/ 1 ^ (GER - GEA) F 1) 7, lactose = J ^ tl x 100
grams sample
2) 7o sucrose = (G^D - E^) F' ^ ^^^
grams sample
Where GEg was the glucose equivalent of a sample after
hydrolysis of lactose, GE^ was the glucose equivalent
of the unhydrolyzed sample, GEj was the glucose equiva
lent of the fructose in the sample after hydrolysis of
sucrose, GE(> was the glucose equivalent of free fructose,
and F and F' were experimentally determined conversion
factors.
Eastham proposed the factor 1.9 for F' while the factor 2,1
was adopted as a result of Hutcheson's study. Eastham's factor was
derived from the fact that when sucrose {^^u^^l^ll^ hydrolyses
to 2(C6H]_20^), the hydrolyzed sugar content is converted back to

sucrose by:
1.9(2C6Hj^206) = C12H22O11
In Hutcheson's study, the sucrose content was determined by
multiplying (GEj) - GEQ) by a factor which would equal the known
sucrose content of the sample. To do this, the calculation was:
g sucrose in 30 g sample _ p« (GEj) - GEc)
The value for F' ranged from 2.07 to 2.12. The average F' value
was 2,10 and is the conversion factor recommended in Hutcheson's
procedure. Reasons for the discrepancy between this and Eastham's
factor are unknown.
Hutcheson's recommended value for F in the above formula for
determining percent lactose was 3,85. In arriving at this figure,
he noted, when analyzing water solutions of lactose in the unhydro
lyzed state, lactose shows 797o glucose equivalent by the copper
reduction method (this means that when one gram of lactose is
exposed to a modified Fehling's solution, it reduces this solution
to the same degree as would 0.79 grams glucose). Therefore, for
a sugar-water solution containing only lactose, the glucose equiva
lent of the unhydrolyzed sample (determined by the Takahashi test)
divided by 0.79 should approximate the total lactose in the sample
(GE^/0,79), Furthermore, Hutcheson found that when one gram of
lactose is hydrolyzed by the enzyme Beta-galactosidase to glucose

and galactose, it shows a glucose equivalent of 1.05 g (because of
weight gained by water of hydrolysis). Hence (1.05 - 0.79)F = Ig,
and F = 3.85. Data were presented to verify this line of reasoning
and the value for F was recommended for use in calculating lactose
content of frozen desserts analyzed by his method.
After analyzing for sucrose and lactose content by the above
methods, he reported the percentage of corn syrup solids by difference.
In an article by Peeples and Hutcheson (1978), the inadequacies
of the procedures for determining sucrose and corn syrup solids were
recognized and a suggestion was made that further work should be
conducted considering the use of enzymes for hydrolyzing and estimating
corn syrup solids content.

Ill, PROCEDURE
General
Sugar and water solutions containing various combinations of
lactose, sucrose and corn syrup solids, water suspensions of non-fat
milk solids and whey solids, and four experimentally prepared ice
cream mixes were analyzed by a modification of a technique introduced
by Hutcheson (1977). The technique was based on the respective
capacities of sucrose, lactose, and corn syrup solids (CSS) in their
unhydrolyzed and hydrolyzed forms to reduce Fehling's solution.
Known amounts of sample were placed into standard Fehling's solution
and allowed to react, and then the amount of standard glucose solution
necessary to complete reduction of copper was related to reducing
capacity of the sample in terms of "grams glucose equivalent." A
given sample of sugar mixture (for example, from a clarified ice
cream sample) was analyzed to determine its "glucose equivalent"
(1) in the unhydrolyzed state, (2) after lactose had been hydrolyzed
by the action of Beta-galactosidase, (3) after sucrose had been
hydrolyzed by the action of invertase, and (4) after corn syrup
solids had been hydrolyzed by the action of Diazyme L-lOO (a commer
cial preparation of amyloglucosidase obtained from Miles Laboratory,
Inc., Elkhart, Ind.). Formulas were developed to utilize this
information in estimating percentages of sucrose and corn syrup
solids in frozen desserts containing combinations of milk-fat.

8
non-fat-milk-solids, whey solids, sucrose, corn syrup solids, stabilizer
and flavoring materials.
A method (Fig, 1) was set up whereby 30 grams samples of ice
cream (or other product) were clarified by adding lead acetate to
remove protein and fat, treated with potassium oxalate to remove
traces of lead ion, and diluted with water to make solutions with
proper amounts of "glucose equivalent" to be compatible with the
various analytical procedures involved.
Four basic procedures (A through D in Fig. 1) were involved, all
of which required different dilutions of the sample. Dilutions were
made to provide less than or equal to 48 mg reducing glucose equiva
lent per determination. The essential steps of sample preparation
and the purpose of each procedure, are given in Figure 1. Procedure A
was for the purpose of determining the "glucose equivalent" (g/30g)
of unhydrolyzed samples. Contributors to this reducing power were
unhydrolyzed corn syrup solids and unhydrolyzed lactose. Procedure B
gave the "glucose equivalent" after lactose had been hydrolyzed,
Procedure C gave the "glucose equivalent" after sucrose had been
hydrolyzed, and Procedure D gave the "glucose equivalent" after both
the sucrose and corn syrup solids had been hydrolyzed.
Three basic treatments were employed for each of the four
procedures. The first step involved clarification with lead acetate
and potassium oxalate (see "Methods" later in this chapter for
details). The second step was to hydrolyze the various sugars
present with appropriate enzymes, and the third step was to determine

Figure 1, Diagrammatic sketch of proposed method for estimating percentages of sucrose and corn syrup solids in frozen dairy-type desserts.
Sample (30g)
lead acetate
250 ml . (filter)
20 ml
A
100 ml
20 ml (titrate)
T 15 ml
V
B
100 ml
20 ml (titrate)
^ 200 ml
potassium oxalate
250 mlVf (filter)
10 ml
100 ml
20 ml (titrate)
10 ml
D
100 ml
20 ml (titrate)
Procedure A - determine glucose equivalent of unhydrolyzed sample.
Procedure B - determine glucose equivalent of sample, after hydrolysis of lactose,
Procedure C - determine glucose equivalent of sample, after hydrolysis of sucrose.
Procedure D - determine glucose equivalent of sample, after hydrolysis of both sucrose and hydrolyzed corn syrup solids,
• -Dilutions and/or sample size should be adjusted to provide less than or equal to 48 mg reducing sugar equivalent/titration, so that oxidizing capacity of the copper solution is not exceeded.

10
"glucose equivalents" of samples in Procedures A through D by the
Takahashi titration procedure (Methods).
Methods
1. Clarification Treatment (Eastham 1963)
a) Equipment--Large funnels, 100 ml and 250 ml volumetric flasks, 300 ml Erlenmeyer flasks, 40 ml, 60 ml and 200 ml pipettes, number 588 S&S filter paper.
b) Reagents 1) 107. neutral lead acetate solution (Fisher Scientific
Company - certified A.C.S.) 2) 107o potassium, oxalate solution (J. T. Baker Chemical
Company - reagent A.C.S.) 3) Antifoam A spray (Dow Corning) - optional
c) Steps 1) Weigh a 30 gram sample of ice cream into a 250 ml
volumetric flask. Add distilled water until half full and spray the inside of flask with a small amount of antifoam A spray. Let stand 15 to 30 min.
2) Add 60 ml of 107, lead acetate and let stand for about 15 minutes, then make to volume with water,
3) Filter contents through S«iS #588 filter into a 300 ml Erlenmeyer flask.
4) Pipette 200 ml of filtrate from Step 3 into a 250 ml volumetric flask.
5) Add 40 ml of potassium oxalate to filtrate and make to volume with water.
6) Filter contents of flask from Step 5 through S&S #588 filter and collect in a 300 ml Erlenmeyer flask.
7) The filtrate from Step 6 is used for sugar analysis.
2. Takahashi titration test (Takahashi 1960)
a) Equipment--Bunsen burner, ring stands, ring attachment, buret clamp, wire gauze, class A buret, 250 ml Erlenmeyer flask, 400 ml beakers, 5 ml and 20 ml pipettes.
11
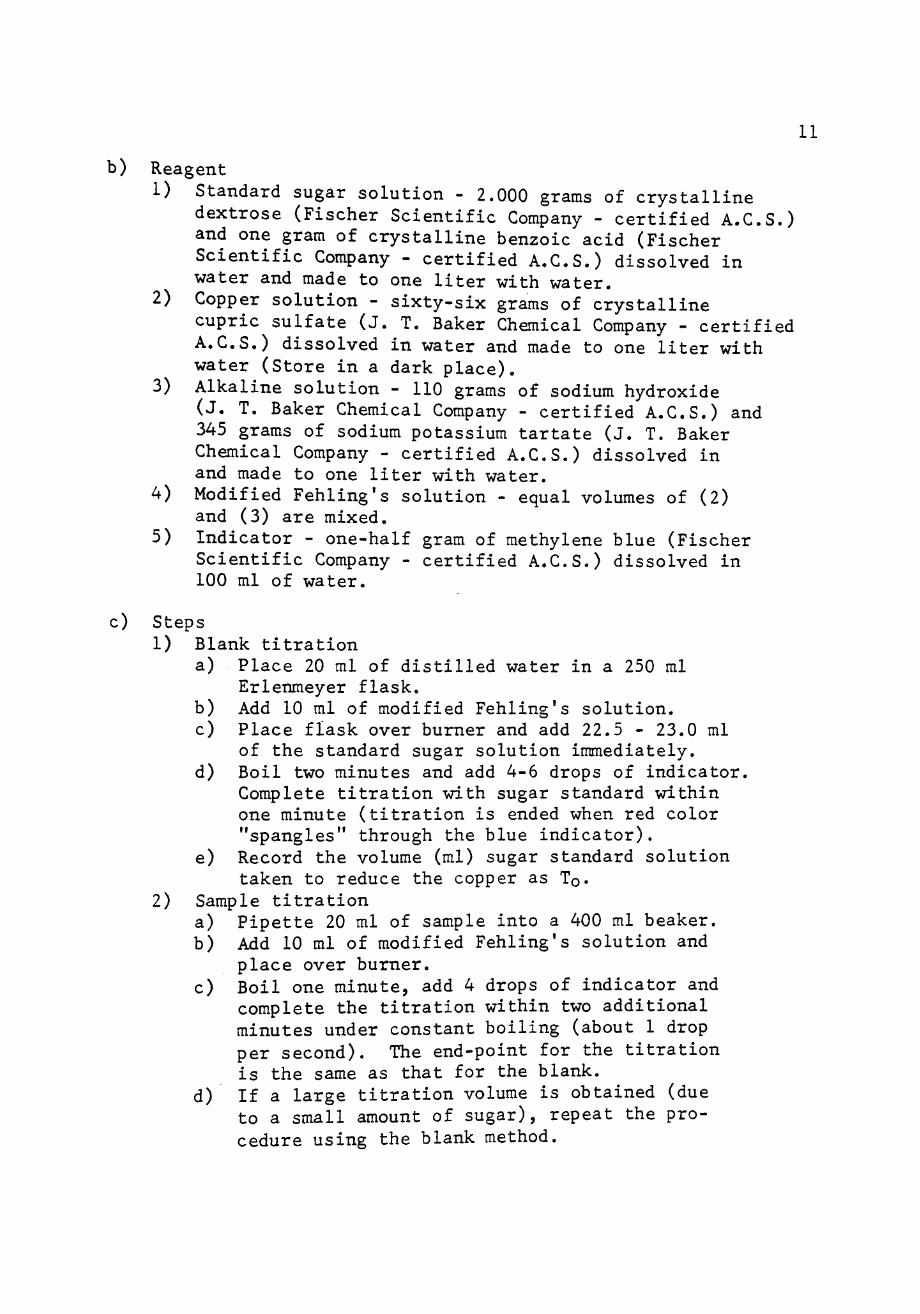
b) Reagent 1) Standard sugar solution - 2,000 grams of crystalline
dextrose (Fischer Scientific Company - certified A.C.S,) and one gram of crystalline benzoic acid (Fischer Scientific Company - certified A.C.S.) dissolved in water and made to one liter with water.
2) Copper solution - sixty-six grams of crystalline cupric sulfate (J. T. Baker Chemical Company - certified A.C.S.) dissolved in water and made to one liter with water (Store in a dark place).
3) Alkaline solution - 110 grams of sodium hydroxide (J. T. Baker Chemical Company - certified A.C.S.) and 345 grams of sodium potassium tartate (J. T. Baker Chemical Company - certified A.C.S,) dissolved in and made to one liter with water.
4) Modified Fehling's solution - equal volumes of (2) and (3) are mixed.
5) Indicator - one-half gram of methylene blue (Fischer Scientific Company - certified A.C.S.) dissolved in 100 ml of water.
c) Steps 1) Blank titration
a) Place 20 ml of distilled water in a 250 ml Erlenmeyer flask.
b) Add 10 ml of modified Fehling's solution. c) Place flask over burner and add 22.5 - 23.0 ml
of the standard sugar solution immediately. d) Boil two minutes and add 4-6 drops of indicator.
Complete titration with sugar standard within one minute (titration is ended when red color "spangles" through the blue indicator).
e) Record the volume (ml) sugar standard solution taken to reduce the copper as TQ.
2) Sample titration a) Pipette 20 ml of sample into a 400 ml beaker. b) Add 10 ml of modified Fehling's solution and
place over burner. c) Boil one minute, add 4 drops of indicator and
complete the titration within two additional minutes under constant boiling (about 1 drop per second). The end-point for the titration is the same as that for the blank.
d) If a large titration volume is obtained (due to a small amount of sugar), repeat the procedure using the blank method.

12
Detailed Procedures
1. Procedure A (see Figure 1)
a) Equipment—
100 ml volumetric flasks, 20 ml volumetric pipettes, 400 ml beakers.
b) Steps
1) Pipette 20 ml of final filtrate from clarification into a 100 ml volumetric flask and make to volume with water,
2) Pipette 20 ml of diluted sample into a 400 ml beaker and run the Takahashi test to determine glucose equivalent,
3) Record volume (ml) sugar standard used as T^.
2. Procedure B (see Figure 1)
a) Equipment— 100 ml volumetric flasks, 4 ml, 10 ml and 15 ml and 20 ml pipettes,
b) Reagents 1) Buffer solution - 0.1 M solution made with 7.5g Na2HP0^
(Allied Chemical - reagent A,C.S,) and 7.5g of KH2PO, (J, T, Baker Chemical Company - reagent A.C.S.) per liter, pH 7.0.
2) Enzyme solution - 0.05 grams of Beta-galactosidase (Worthington Biochemical Company - 138 u/mg) dissolved in buffer and made to 50 ml with buffer (store in refrigerator).
c) Steps 1) In a 100 ml volumetric flask mix 10 ml of buffer,
4 ml of enzyme (Beta-galactosidase), and 15 ml of filtrate from the clarification treatment.
2) Incubate overnight at 7°C. 3) Pipette 20 ml of sample into a 400 ml beaker and run
Takahaski test for glucose equivalent. 4) Record volume (ml) standard sugar solution used as Tg,
3. Procedure C (see Figure 1)
a) Equipment—
100 ml volumetric flask and 2 ml, 10 ml, 20 ml, and 25 ml volumetric pipettes.

13
b) Reagent 1) Buffer solution - 0,1 N acetate buffer (13.6 grams of
CH3C00Na • 3H2O + 6,0 ml glacial acetic acid dissolved in water and made up to 2,0 liters with water).
2) Enzyme solution - 0.1 ml of invertase enzyme solution in a 100 ml volumetric flask and made to volume with water. (Technical grade invertase (ICN Pharmaceuticals, Cleveland, Ohio) was used, which was labeled as having a K value of 0.26 as determined by the A.O.A.C. method.)
c) Steps 1) Mix in a 100 ml volumetric flask, 25 ml of buffer, 2 ml
of enzyme preparation (invertase 1:1000) and 10 ml of final filtrate from the clarification treatment.
2) Incubate in a 54^0 water bath for 24 hrs, let cool, and complete to volume with water.
3) Pipette 20 ml of sample into 400 ml beaker and run Takahashi test for glucose equivalent, and record volume (ml) sugar standard used as TQ.
4) Procedure D (see Figure 1)
a) Equipment--100 ml volumetric flask, 1 ml, 2 ml, 10 ml, 20 ml, and 25 ml volumetric pipettes.
b) Reagents 1) Buffer solution - 0.1 N acetate buffer (13.6 grams
of CH3C00Na • 3H2O + 6.0 ml glacial acetic acid dissolved in water and made up to 2.0 liters with water),
2) Enzyme solutions a) Diazyme L-lOO (1 ml of enzyme in a 100 ml
volumetric flask and made to volume with water), b) Invertase (1:1000).
c) Steps 1) In a 100 ml volumetric flask mix 25 ml of buffer,
2 ml of invertase enzyme, 1 ml of Diazyme L-lOO solution, and 10 ml of filtrate from the clarification treatment.
2) Incubate in a 54°C water bath for 24 hrs. 3) Run the modified Takahashi test and record the ml
of standard sugar solution used as T-Q,

14
Experimental Design
The experiments were divided into three categories. First
water solutions containing known amounts of sucrose, lactose, and/or
corn syrup solids were analyzed to determine that (1) no sucrose or
corn syrup solids were hydrolyzed when Beta-galactosidase was
introduced for purposes of hydrolyzing lactose, (2) no lactose or
com syrup solids were hydrolyzed v^en invertase was introduced for
purposes of hydrolyzing sucrose, and (3) no sucrose or lactose were
hydrolyzed when Diazyme L-lOO was introduced for purposes of hydro
lyzing corn syrup solids. Secondly, supplies of commercial milk-
solids-not-fat (NFDMS or skim milk powder) and whey solids (whey
powder) were used in making the experimental mixes. Water suspen
sions of these materials were made in various combinations and
concentrations, and analyzed to (1) determine lactose content,
and (2) to see that no factors in the milk and whey powders other
than lactose contributed reducing power in the Takahashi test.
Thirdly, four experimental ice cream mixes were prepared using
variable amounts of butter, sucrose (commercial sugar), com syrup
solids, and combinations of skim milk and whey powders (the
approximate compositions of these mixes are given in Table 1).
Each sample was analyzed by the Takahashi titration test to
determine "glucose equivalent" (GE) for each procedure (A through D).
These values were obtained by the following calculation procedure.

15
Samp 1 e
TABLE 1
PERCENTAGES OF MILK POWDER, WHEY POWDER, SUCROSE, CORN SYRUP SOLIDS, AND FAT IN EXPERIMENTAL ICE CREAM MIXES
Skim Milk Powder
7o
10.70
5,00
5.00
10.00
Whey Powder 7o
--
5.00
5,00
--
Sucrose 7o
16.10
10.00
5.00
5.00
CSS 7,
--
--
5.00
10.00
Fat 7o
10.00
10.00
10,00
10,00
A
B
C
D
16
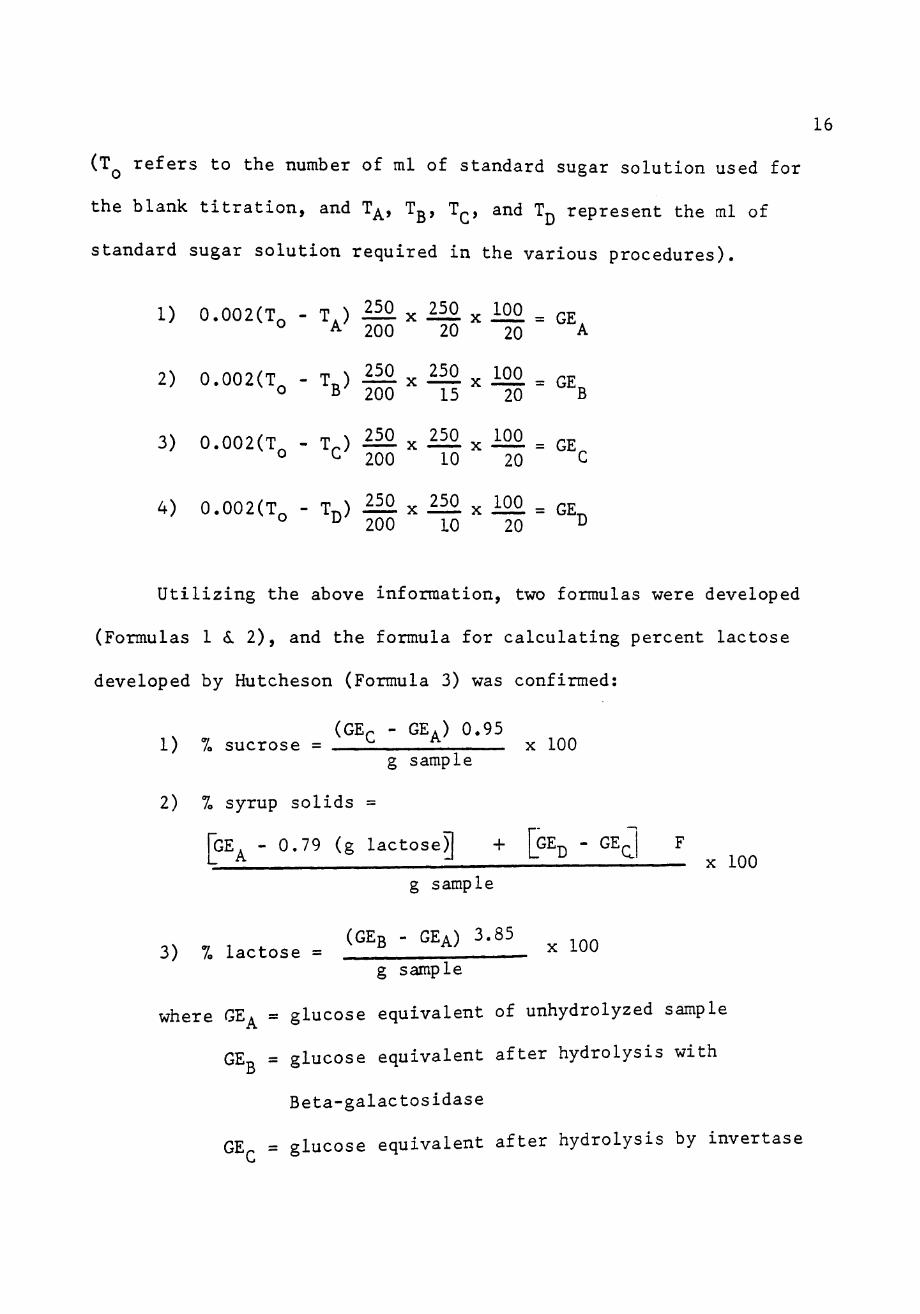
(TQ refers to the number of ml of standard sugar solution used for
the blank titration, and T^, Tg, T^, and T^ represent the ml of
standard sugar solution required in the various procedures).
1) 0,002(To - T J i ^ X i ^ X i2£ = GE ° A. 200 20 20 A
2) 0.002(T - TJ 150 x i ^ x M = GE o B 200 15 20 B
3) 0.002(T^ - Tp) ^ ^ x 1 ^ x 1 ^ = GE ° ^ 200 10 20 C
4) 0,002(T^ - TT,) ili x 1 ^ x i:00 = GE^ ° ^ 200 10 20 ^
Utilizing the above information, two formulas were developed
(Formulas 1 5. 2), and the formula for calculating percent lactose
developed by Hutcheson (Formula 3) was confirmed:
(GEp - G E A ) 0.95 1) 7o sucrose = ^ ^ x 100
g sample
2) 7o syrup solids =
FGE^ - 0.79 (g lactose)| + [GE^ - .. GE, X 100
g sample
(GEn - GEA) 3.85 3) 7, lactose = ^ ^^ ^ 100
g sample
where GE^ = glucose equivalent of unhydrolyzed sample
GEr. = glucose equivalent after hydrolysis with
Beta-galactosidase
GE = glucose equivalent after hydrolysis by invertase
17
GE-. = glucose equivalent after hydrolysis by
amyloglucosidase
and F = experimentally determined correction factor
for CSS determination.
The analyses (with respect to experimental frozen dessert mixes)
were replicated three times, and all titrations were made in tripli
cate. Statistical evaluations were conducted, according to Kramer
and Twigg (1970),

IV. RESULTS AND DISCUSSION
After running tests on 50 sucrose solutions ranging from 5 to
157o sucrose, it was found that dilutions of the enzyme greater than
2:1000 yielded less than 1007o inversion (using procedure C in
Figure 1) but that with dilutions at or less than 2:1000, practically
1007o hydrolysis was obtained.
Next, 15 samples of water solutions of lactose, containing from
5 to 157o lactose, and 15 similar samples of corn syrup solids were
treated according to procedure C using the 2:1000 enzyme preparation.
It was found that the enzyme preparation did not affect either lactose
or CSS as evidenced by the fact that GEp (glucose equivalent after
incubation) was the same as GEp^ (glucose equivalent before incubation).
To further substantiate the fact that procedure C was satis
factory for use in estimating sucrose content of samples containing
mixtures of sucrose, lactose and CSS, 10 samples containing mixtures
of known amounts of these three materials were analyzed. Again, in
all cases, practically 1007o hydrolysis of sucrose was achieved without
any accompanying breakdown of lactose and CSS.
Samples of water solutions of CSS were analyzed by procedure D
to determine the optimum amount of Diazyme L-lOO to be used to
hydrolyze the CSS, and to determine whether this enzyme preparation
would partially hydrolyze lactose and/or sucrose. (The Diazyme L-lOO
18
19
preparation was obtained from Miles Laboratories, Inc., Elkhart,
Indiana). From telephone conversations with commercial companies
using this preparation, it was recommended that the preparation be
used at a rate of 80 ml per 100# starch-like material to be hydrolyzed.
This would be equivalent to using 1 ml of a 1:100 dilution per 15 ml
of clarified sample. Accordingly, 50 samples containing from 5 to 157o
CSS were analyzed by procedure D using dilutions of the enzyme ranging
from 1:100 to 1:10,000. It was found that the use of dilutions greater
than 1:100 yielded less than 1007o hydrolysis (as evidenced by the fact
that less CSS was indicated experimentally than was actually used in
sample preparation).
The 1:100 dilution yielded satisfactory results with respect to
CSS hydrolysis, but when sucrose-in-water solutions were subjected
to these conditions there was some evidence of a small amount of
inversion, indicating that the enzyme preparation may have had trace
amounts of invertase activity. Therefore, in procedure D, instead of
using only Diazyme L-lOO to break down CSS, it was decided to use a
mixture of Diazyme L-lOO (1:100) and invertase (2:1000) and effect
hydrolysis of both CSS and sucrose. Then, by subtracting GE^ one
could calculate the glucose equivalent of CSS present.
To determine the effects, if any, of invertase and Diazyme
L-lOO on milk powder and whey solids, suspensions of the two were
subjected to enzyme activities as outlined in procedures C and D.
It was found that neither enzyme had any effect on the two materials.

20
Ten samples of the NFDMS and whey solids used in subsequent
experiments were treated by procedure B to determine lactose contents.
For NFDMS the range of values were 467. to 517, and the average lactose
content was 497,. Likewise the range of lactose content for the whey
solids was 697o to 747, and the average was 717,, This agreed with
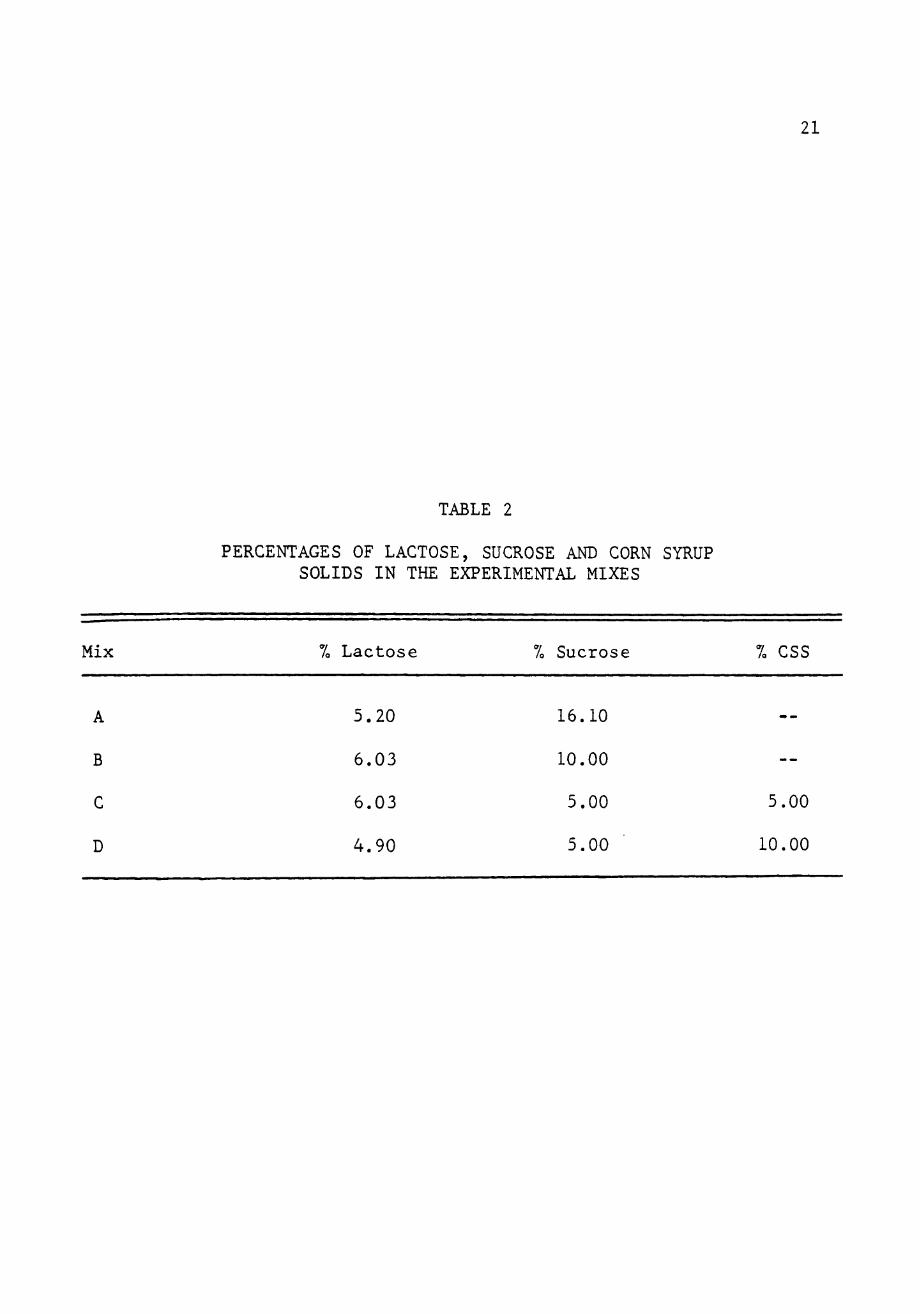
Hutcheson's findings (1977), Table 1 shows the composition of the
experimental frozen dessert mixes and Table 2 gives lactose, sucrose
and CSS in these mixes based on the premise that the skim milk and
whey powder contained 497, and 717, lactose, respectively. By comparing
this information to experimental data (Tables 3 and 4) the suitability
of the method was ascertained. In these tables it may be noted that
three replicates of each mix were analyzed. Three titration values
were obtained for each replicate, and average values were used in
calculating GE. These average values reported in columns 4 and 5
of Table 3 as GE^ and GEp respectively, and in columns 4, 5, 9 and 10
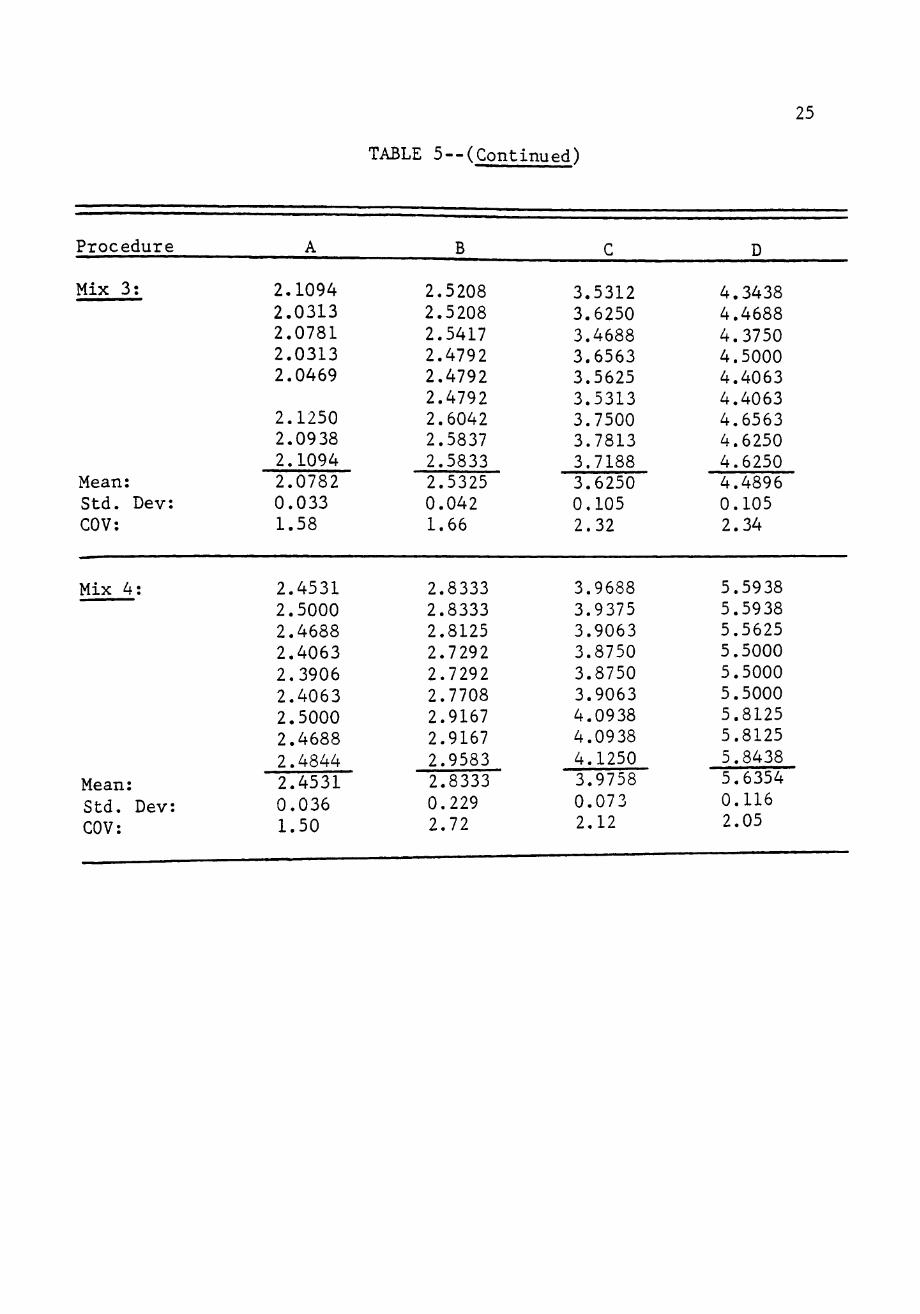
of Table 4 as GE. through GE^, respectively. Actual GE values for
each titration are given in Table 5 with associated coefficients of
variability (Kramer and Twigg, 1970).
Referring to column 7 of Table 3 it may be noted that the number
of grams of sucrose recovered per sample was calculated by multiplying
the glucose equivalent of hydrolyzed sucrose (column 6) by 0.95.
This was to account for the water gained in hydrolysis. From column
8 of Table 3, from 92.67% to 104.0% (average = 98.49%) of the sucrose
was accounted for experimentally, as calculated by the formula
21
TABLE 2
PERCENTAGES OF LACTOSE, SUCROSE AND CORN SYRUP SOLIDS IN THE EXPERIMENTAL MIXES
Mix % L a c t o s e % Sucrose % CSS
A
B
C 6 ,03 5.00 5.00
D 4 ,90 5,00 10.00
7o L a c t o s e
5.20
6 .03
6 ,03
4 ,90
% Sucrose
16.10
10,00
5.00
5,00

22
Mix D:
TABLE 3
COMPARISON OF ACTUAL AMOUNTS OF SUCROSE IN 30 GRAM SAMPLES OF ICE CREAM MIX TO AMOUNTS DETERMINED
EXPERIMENTALLY
8
Mix A: Al 16.10 4.83 1,22 6,13 4.91 4,67 96.69
A2 16.10 4.83 1.17 6.25 5,08 4.83 100.00
A3 16,10 4.83 1.25 6.41 5.16 4.90 101.45
Mix B: Bl 10.00 3.00 1.43 4.48 3,05 2.90 96.67
B2 10.00 3.00 1.41 4.59 3.18 3.02 100.67
B3 10.00 3.00 1.48 4,75 3,27 3.11 103.67
Mix C: CI 5,00 1.50 2,08 3.53 1.45 1.38 92,00
C2
C3
Dl
D2
D3
5,00
5.00
5.00
5 .00
5 ,00
1.50
1.50
1.50
1.50
1.50
2 .03
2 .11
2,48
2 ,41
2.48
3.59
3,75
3.94
3.88
4.09
1,56
1,64
1.46
1.47
1.61
1.48
1.56
1.39
1.40
1,53
98,67
104.00
92.67
93 .33
102.00
1) Sample number
2) Percent sucrose in sample
3) Grams sucrose in 30 g of ice cream mix
4) GE^
5) GE^
6) GEc - GE^ = glucose equivalent of hydrolyzed sucrose
7) 0,95x(col. 6) - g of sucrose recovered per 30 g of sample
^ ~\ ^ „^^ f +-Vip Artual sucrose indicated 8) col. 7/col. 31 X 100 = percentages of the actual su
•- " b y the test.

-a
O
o >-
en
CN
a^
CX)
vO
i n
CO
c s
p - O r>-vO O ^
. . . es vO O O ON O ^ --1
<r <r -1 LO -"d" m
. . . r-H r- l f-<
ON 00 vD i n ^ i n
en o «^ en o "^
. . . O ON «S ,-( (y^ (y\
r-< r^ 1 ^ m ON r^
. . . m cs CM
.-M vO vO < f O 00
23
00 --^ CO m <!• ^
. . . <r <r <t
<m ON i n i n i n r~«-
. • , en on en
r^ 00 O en m o
. . . en in o o^ ON O
ON en c—I sO r » 00
en en CN
ON O ' -< i n i n 00
. . . i n i n m
-d- 00 ON O^ 00 o
. , * en en ^d"
<!• r» r->-00 vO ON
. . . r-( en v t ON 00 -—I
i n c* ON en r^ vo
r-< --I r-i r-« f^ r:: 00 00 00 <i" <r <r
CM 00 00 i n <r l o
. . . cs es e^i
CO <^ ' - ' O O ^
. • • c s e s e s
o o o i n i n m
o o o o o o
, . • i n i n i n
r-i es en O O O
en en cs 00 r-- ON
. • • CN CvJ eN
00 —• 00 <r <r <r
. . • CN evi c s
o o o o o o
. . • en en en
o o o o o o
» • • o o o
r-^ evi en P O P
X
5:
X •H
e s <u 5-1
o
o •H
r-l M-( O J O e
0)
i a;
r- l a-S 03
• H
CO 00
a
o
o en
• H
C O C O
a CO
e 5-1
^ 3
dJ > O o
6 e CO OJ J-i O
o •H
a, B CO
O en ' ^ (U CO
o 4-i o CO
> o o
u
CO
o o CO
II
(30
CO
e CO }-( O b O O O
en i n 00
C
CO
o
X
CO iXi O
CO 6
< ; cQ CO
0 0 0
(U u > o o <u 5-1
CO CO
u
1 3 (U
4-J CO
•H O o CO CO 00
J-> C <u
, - < CO >
•H 3
cr (U Q) CO O O
II
" a w 0
1
OJ M CU
ered
ec
ov
u CO CO
> o 0
p o w 0
+
<u 5-1
CO CO CJ
0 5 ^
II
0 0 r—1
00 X
en '-«• 0
X •
. ' - s r-l
0 "--
1
(Qr-t
w 0 c w 0
(Co
l 0
.97
C
ol.
ON X M*
1
<;r- l r-l
ow 0 0 0 —
r g en < r 1 ^ ^ " ^ CO ON o --! ^ T^

TABLE 5
GE VALUES FOR EACH TITRATION I fVOLVED IN ANALYZING THE FOUR EXPERIMENTAL ICE CREAM MIXES
24
Procedure
Mix 1:
Mean: Std. Dev: GOV:
Mix 2:
Mean: Std. Dev: GOV:
A
1.2188 1.2344 1.2031 1.1563 1.1406 1.1250 1.2500 1.2500 1.2188 1.1991 0.042 3.51
1.4336 1.4336 1.4175 1.4219 1.4063 1.3906 1.5000 1.4844 1.4531 1,4379 0.036 2.56
B
1.6250 1.5833 1.5833 1.5000 1.5417 1.5208 1.6250 1.6458 1.6458 1.5856 0.049 2.65
1.8686 1.8900 1.8256 1.8333 1.8333 1.8125 1.9375 1.9375 1.9375 1.8151 0.1119 2.24
C
6,1250 6.1250 6,0000 6.2500 6.2500 6.1563 6.5938 6.4063 6.4063 6.2570 0.136 3.19
4.5103 4.4781 4.4781 4.6563 4.6250 4.5313 4.7500 4.7500 4.7813 4.6178 0.303 2.21
D
6.1250 6.0938 6.0625 6.1875 6,1563 6.1875 6.4003 6.3750 6.4063 6.2222 0.115 1.86
4.5103 4.5103 4.5103 4.6250 4.6250 4.5625 4.7188 4.7188 4.7813 4.6180 0.091 1.98
25
TABLE 5 —(Cont inued)
Procedure
Mix 3:
Mean: Std. Dev: GOV:
Mix 4:
Mean: Std. Dev: GOV:
A
2.1094 2.0313 2.0781 2.0313 2.0469
2.1250 2.0938 2.1094 2.0782 0.033 1.58
2.4531 2.5000 2.4688 2.4063 2.3906 2.4063 2.5000 2.4688 2.4844 2.4531 0.036 1.50
B
2.5208 2.5208 2.5417 2.4792 2.4792 2.4792 2.6042 2.5837 2.5833 2.5325 0.042 1.66
2.8333 2.8333 2.8125 2.7292 2.7292 2.7708 2.9167 2,9167 2.9583 2.8333 0.229 2,72
C
3.5312 3.6250 3,4688 3.6563 3.5625 3.5313 3.7500 3.7813 3.7188 3.6250 0.105 2.32
3.9688 3.9375 3.9063 3.8750 3.8750 3.9063 4.0938 4.0938 4,1250 3.9758 0.073 2.12
D
4.3438 4.4688 4.3750 4.5000 4.4063 4.4063 4.6563 4.6250 4.6250 4.4896 0.105 2.34
5.5938 5.5938 5.5625 5,5000 5.5000 5.5000 5.8125 5.8125 5.8438 5.6354 0,116 2.05

26
(GEp - GEJ 0.95 7o sucrose = ^ -^ x 100
grams of sample
The coefficient of variability (COV) of the percent sucrose recovered
was calculated as 3.747o. This means, for example, that for a mix
containing 157, sucrose, the method vould show 13.887, to 16.127, sucrose
at the 957o confidence level.
Referring to Table 4, column 8 shows that 93.377, to 1007, of the
lactose in mix C was found experimentally and that the amount of
lactose indicated in sample D amounted to 83.677, to 114.977, of that
actually present. The wide range for sample D cannot be explained
but it illustrates the sensitivity of the relationship of
GE^/0.79 to GEg x 0.95 with respect to lactose. As we pointed out
by Takahashi (1960) and confirmed by Hutcheson (1977) the peculiar
manner in v^ich lactose reacts to Fehling's solution appears to cause
variations in quantitative test results. Further work should be done
in this area to find ways of reducing this variability. Nevertheless,
the COV associated with lactose determination was 12.797,. In other
words, at the 957, level of confidence, analysis of a 157, lactose
solution would show from 11.167, to 18.847, lactose present. This
agrees with the findings of Peeples d Hutcheson (1978).
Using the formula presented in footnote 11 of Table 3 the
glucose equivalent associated with the CSS, as indicated experimentally
in mixes C and D, are presented in column 11. Realizing that a
certain amount of water associated with hydrolysis is included in

27
these glucose equivalents, a correction factor was developed to com
pensate. From columns 4, 7 and 10 it can be shown that GE^ - 0.79
(g lactose), (which represents the glucose equivalent of unhydrolyzed
com syrup solids) ranged from 40.217, to 47.17,, with an average of
447,, of the GE of hydrolyzed CSS. This means that 567, of the GE
of hydrolyzed CSS (column 10) resulted from hydrolysis by the enzyme.
Since, when 1 gram of mixed dextrin is hydrolyzed, approximately
1.0 to 1.1 grams of glucose results (1.05 grams average) then compen
sation must be made for 567, x 0.05 or 0.028 g of water (from
hydrolysis) per gram of mixed dextrins. Therefore, a correction
factor of 0.97, (1.00/1.028), was multiplied by the glucose equiva
lent attributed to CSS (column 11) to obtain actual amounts of CSS
present (column 12). As a result by using the following formula,
the method indicated 92.477, to 110.267, (average 100.187,) of the actual
amounts of CSS present in the mixes (column 13):
TGEA - 0.79 (g lactose)] + (GEp - GEc) 0.97 ^ 7, corn syrup solids = ^ ^ T ~ ~ "
•' ^ g sample
By analysis of variance, the method can be used (at the 957, confidence
level) to give from 85.987, to 114.027, of the CSS actually present in
samples of frozen dairy desserts.
In conclusion, the method for determining amounts of lactose
and sucrose in frozen desserts, as outlined by Peeples and Hutcheson
(1978), was expanded to include a means for estimating percentages
of corn syrup solids using amyloglucosidase. Also, the procedure
28
for estimating sucrose content was changed. Whereas Peeples and
Hutcheson estimated sucrose content from the amount of fructose
produced by acid hydrolysis, in this study percentages of sucrose
were calculated from increases in reducing sugar content resulting
from hydrolysis of samples with invertase. The new method is one
which can be used routinely by the dairy industry to estimate the
percentages of lactose, sucrose, and corn syrup solids in frozen
dairy desserts.
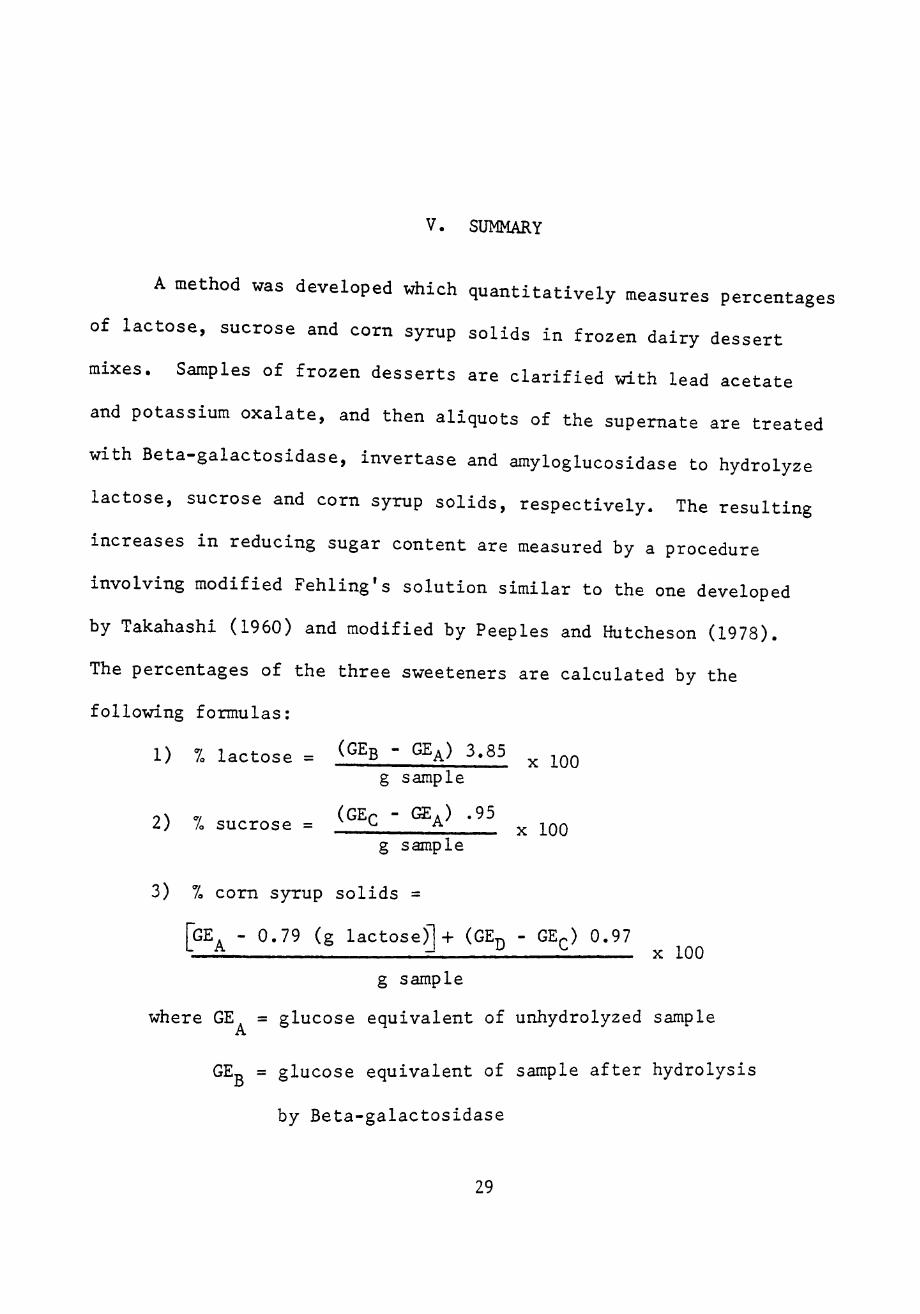
V. SUMMARY
A method was developed which quantitatively measures percentages
of lactose, sucrose and corn syrup solids in frozen dairy dessert
mixes. Samples of frozen desserts are clarified with lead acetate
and potassium oxalate, and then aliquots of the supernate are treated
with Beta-galactosidase, invertase and amyloglucosidase to hydrolyze
lactose, sucrose and corn syrup solids, respectively. The resulting
increases in reducing sugar content are measured by a procedure
involving modified Fehling's solution similar to the one developed
by Takahashi (1960) and modified by Peeples and Hutcheson (1978).
The percentages of the three sweeteners are calculated by the
following formulas:
1) 7, lactose = (GEB - GE^) 3.85 ^ ^^^ g sample
2) 7, sucrose = (GEQ - GE^) -95 ^ ^^^
g sample
3) 7, corn syrup solids =
[GE^ - 0.79 (g lactose)] + (GE^ - GE^) 0.97 X 100
g sample
where GE = glucose equivalent of unhydrolyzed sample
GEg = glucose equivalent of sample after hydrolysis
by Beta-galactosidase
29

30
GEp = glucose equivalent after hydrolysis by
invertase
and GE = glucose equivalent after hydrolysis by
amyloglucosidase.

LIST OF REFERENCES
"^^":":na?;s?ff^i?i r;p! 426^455! ^^^^ ^ °- ^^-- - - '^^°^':f':naijs?ff'%':i t!:^^?\^27?''"'''''''''''' ''''^'^' - ^ ^
^^^^' M'IV'D^^I^* .^„^^^y^i^ Method for the Determination of Skimmed Milk Powder m Raw Sausage, Analyst. 96:80-92.
Bahl, R. K 1972. An Enzymic Method for the Determination of Lactose m Milk Including Human Milk, Analyst. 97:559-561,
Barnett, A. J. G., and G. A. Taub. 1957. A Rapid Method for the Determination of Lactose in Milk and Cheese. The Journal of Science of Food and Agriculture.
Belowcher, E. A. 1940. The Polarimetric Determination of Sucrose in Ice Cream. Chemical Abstracts 36:2036.
Bergmeyer, H. V, 1965. Methods of Enzymic Analysis. 2nd ed. Academic Press, New York. p. 103.
Biggs, D. A., and L. Szijarto, 1963. Method for Routine Determination of Lactose in Milk, Journal of Dairy Science, 46:1196-1200,
Bille, C. 1977, Enzymatic Analyzer Determines 3 Sugars in Ice Cream Mixes. Dairy Review, 39:3:28B-28F.
Browne, C. A., and F. W. Zerban. 1948. Physical and Chemical Methods of Sugar Analysis. John Wiley and Sons, Inc., New York, pp. 832, 855, 900, 902.
Chan, T. C,, and J. Tobias, 1959. Chromatographic Determination of Sugars in Ice Cream, Journal of Dairy Science. 42:898.
Conrad, E. C,, and J. K. Palmer. 1976. Rapid Analysis of Carbohydrates by High Pressure Liquid Chromatography. Food Technology. 30:10:84-92.
Cox, H. E. 1950. The Chemical Analysis of Foods. 4th ed. Sherwood
Press, Washington, D. C. p. 5.
31
32
Crov^iurst, B. 1956. The Determination of Milk-Solids-Not-Fat in Ice Cream. Analyst. 81:123-124.
Dubois, M., K. A. Gilles, J. K. Hamilton, P. A. Rebers, and F. Smith. 1956. Colorimetric Method for Determination of Sugars and Related Substances. Analytical Chemistry. 28:350.
Eastham, J. B, 1963. A Quantitative Method for Determining the Sugar Content of Ice Cream. A Thesis in Dairy Industry, Texas Tech University.
Fagan, H, J., E. Sibback, and R, V. Hussong. 1954. The Use of Anthrone for the Quantitative Estimation of Lactose in Dairy Products.
Fox, K. K,, M. K. Harper, V. H. Holsinger, and M. J. Pollansch. 1962. Colorimetric Measurements of Lactose in Dairy Products. Journal of Agriculture and Food Chemistry. 10:5:408-410.
Goulden, J. D. S. 1959. A Proposed Method for the Determination of Lactose in Separated Milk and Condensed Whey by Infra-red Absorption. Journal of Dairy Research. 26:2:151-156.
Hobbs, J. S., and J, G. Lawrence. 1972. Determination of Carbohydrates by Liquid Chromatography; Lactose in Milk. The Journal of Science of Food and Agriculture. 23:45-51.
Hutcheson, R. M. 1977, Quantitative Determination of Sugars in Dairy-Type Frozen Desserts. A Thesis in Food Technology, Texas Tech University.
Jaynes, H. 0., and T. Asan. 1973. Determination of Lactose in Milk by Gas Liquid Chromatography. Journal of Milk and Food Technology. 36:6:333-336.
Kramer, A., and Twigg, B. A. 1970. Quality Control for the Food Industry. The AVI Publishing Company, Inc., p. 457.
Laboratory Manual Methods of Analysis of Milk and Its Products. 1959. Milk Industry Foundation, Washington, D. C. pp. 487-490.
Lawrence, A. J. 1960. The Determination of Lactose in Milk Products, Australian Journal of Dairy Technology. 23:103.
Mittevoch, A. 1965. Anthrone as a Reagent for Determining Carbohydrate in Rat's Milk and Related Materials. Analyst. 90:759-762.

33
Pearson, A, M, and D, A, Biggs. 1974. Estimating Sweeteners in Frozen Desserts. Dairy and Ice Cream Field. 7:36-37, 67.
Pearson, D. 1962. The Chemical Analysis of Foods. 5th ed. J. d A. Churchill, Ltd., London, p. 401.
Peeples, M. L, 1972. A Method for Determining Sucrose Content of Ice Cream. Dairy and Ice Cream Field. 155:3:49, 62, 64,
Peeples, M. L., and R, M. Hutcheson. 1978. A Method for Determining Lactose and Sucrose Contents in Ice Cream. Journal of Food Science 43:799-800.
Sommer, H. H. 1932. The Theory and Practice of Ice Cream Making. Published by the author, Madison, Wisconsin, pp. 243-250.
Southgate, D. A. T. 1969. Determination of Carbohydrate in Foods. The Journal of Science of Food and Agriculture. 20:326-330.
Takahashi, M. 1960. Determination of Reducing Sugars by Means of Back Titration Against Alkaline Copper Solution. I. Bulletin of the Chemical Society of Japan. 33:178.
Winton, A. L,, and K. B, Winton, 1945, The Analysis of Foods. Chapman and Hall, Ltd. pp. 170-183.
Wobba, N. 1965. A Simple Colorimetric Method for Determination of Lactose in Milk. Analyst. 90:432-434.