Embed Size (px)
Citation preview
A Metabolic Widget Adjusts thePhosphoenolpyruvate-DependentFructose Influx in Pseudomonas putida
Max Chavarría,a,b Ángel Goñi-Moreno,a* Víctor de Lorenzo,a Pablo I. Nikela
Systems and Synthetic Biology Program, National Spanish Center for Biotechnology (CNB-CSIC), Madrid,Spaina; Escuela de Química and CIPRONA, Universidad de Costa Rica, San José, Costa Ricab
ABSTRACT Fructose uptake in the soil bacterium Pseudomonas putida occursthrough a canonical phosphoenolpyruvate (PEP)-dependent sugar transport system(PTSFru). The logic of the genetic circuit that rules its functioning is puzzling: thetranscription of the fruBKA operon, encoding all the components of PTSFru, can es-cape the repression exerted by the catabolite repressor/activator protein Cra solelyin the presence of intracellular fructose-1-P, an agonist formed only when fructosehas been already transported. To study this apparently incongruous regulatory archi-tecture, the changes in the transcriptome brought about by a seamless Δcra dele-tion in P. putida strain KT2440 were inspected under different culture conditions.The few genes found to be upregulated in the cra mutant unexpectedly includedPP_3443, encoding a bona fide glyceraldehyde-3-P dehydrogenase. An in silicomodel was developed to explore emergent properties that could result from suchconnections between sugar uptake with Cra and PEP. Simulation of fructosetransport revealed that sugar uptake called for an extra supply of PEP (obtainedthrough the activity of PP_3443) that was kept (i.e., memorized) even when thecarbohydrate disappeared from the medium. This feature was traced to the ac-tion of two sequential inverters that connect the availability of exogenous fruc-tose to intracellular PEP levels via Cra/PP_3443. The loss of such memory causeda much longer lag phase in cells shifted from one growth condition to another.The term “metabolic widget” is proposed to describe a merged biochemical andregulatory patch that tailors a given node of the cell molecular network to suitspecies-specific physiological needs.
IMPORTANCE The regulatory nodes that govern metabolic traffic in bacteria oftenshow connectivities that could be deemed unnecessarily complex at a first glance.Being a soil dweller and plant colonizer, Pseudomonas putida frequently encountersfructose in the niches that it inhabits. As is the case with many other sugars, fruc-tose is internalized by a dedicated phosphoenolpyruvate (PEP)-dependent transportsystem (PTSFru), the expression of which is repressed by the fructose-1-P-respondingCra regulatory protein. However, Cra also controls a glyceraldehyde-3-P dehydroge-nase that fosters accumulation of PEP (i.e., the metabolic fuel for PTSFru). A simplemodel representing this metabolic and regulatory device revealed that such an un-expected connectivity allows cells to shift smoothly between fructose-rich andfructose-poor conditions. Therefore, although the metabolic networks that handlesugar (i.e., fructose) consumption look very similar in most eubacteria, the way inwhich their components are intertwined endows given microorganisms with emer-gent properties for meeting species-specific and niche-specific needs.
KEYWORDS: Cra regulator, metabolic memory, PTS sugar transport, Pseudomonasputida, glyceraldehyde-3-P dehydrogenase, nutrient shifts, phosphoenolpyruvate
Received 11 October 2016 Accepted 1November 2016 Published 6 December 2016
Citation Chavarría M, Goñi-Moreno Á, deLorenzo V, Nikel PI. 2016. A metabolic widgetadjusts the phosphoenolpyruvate-dependentfructose influx in Pseudomonas putida.mSystems 1(6):e00154-16.doi:10.1128/mSystems.00154-16.
Editor Pieter C. Dorrestein, University ofCalifornia San Diego
Copyright © 2016 Chavarría et al. This is anopen-access article distributed under the termsof the Creative Commons Attribution 4.0International license.
Address correspondence to Víctor de Lorenzo,[email protected].
*Present address: Ángel Goñi-Moreno, Schoolof Computing Science, Newcastle University,Newcastle upon Tyne, United Kingdom.
M.C. and Á.G.-M. contributed equally to thiswork.
A metabolic widget connectstranscriptional regulation to metabolicdemands and rules hexose uptake in the soilbacterium Pseudomonas putida
RESEARCH ARTICLEMolecular Biology and Physiology
crossmark
Volume 1 Issue 6 e00154-16 msystems.asm.org 1
on May 30, 2018 by guest
http://msystem
s.asm.org/
Dow
nloaded from

The diversity of nutrient transport mechanisms and the way that their intake iscoupled to specific metabolic demands are one of the most puzzling features in
environmental bacteria (1–3). While it is tempting to attribute such a diversity andcomplexity to the mere evolutionary history of the bacteria at stake, some scenarios areconspicuously perplexing and suggest that some adaptive advantage of the corre-sponding molecular architectures has shaped the cognate uptake processes (4, 5). Forinstance, glucose (Glu) and fructose (Fru) are both transported in Escherichia colithrough the general phosphoenolpyruvate (PEP)-dependent sugar transport system(PTS) (6–8). This transport device separately phosphorylates the two sugars as a stepprior to their import in a fashion ultimately controlled by the intracellular PEP/pyruvate(Pyr) ratio. In this way, an internal metabolic signal (i.e., the PEP/Pyr ratio) propagatesinto instructing the PTS to either increase or restrict sugar intake (9). In contrast, the soilbacterium Pseudomonas putida KT2440 has a non-PTS transport mechanism for Glu(which can follow either phosphorylation of the hexose or its oxidation to organic acids[10]), while Fru is captured through a dedicated PTSFru (see Fig. S1 in the supplementalmaterial) (11–13). This Fru-only transport system involves two unique polyproteins:EI/HPr/EIIAFru (cytoplasmic, encoded by fruB) and EIIBC (membrane bound, encoded byfruA). Interestingly, in E. coli the expression of the fruBKA operon is downregulated byFruR (also known as the catabolite repressor/activator [Cra] protein) (14, 15). Thisrepressor protein is considered to be a sensor of glycolytic flux due to its sensitivity tothe metabolic intermediate fructose-1,6-P2 (FBP) (16) and also because the cra genemaps in a chromosomal location far from fruBKA (17, 18). In P. putida, the same genecomplement is arranged as a fruBKA operon (19, 20), and its transcription is controlledby the product of the adjacent fruR/cra gene (Fig. 1A). However, the correspondingCraP. putida protein does not respond to FBP at all but solely to fructose-1-P (F1P) (21, 22),a metabolite that can be formed only upon the action of PTSFru on Fru. In sum, when
FIG 1 Genomic organization of the fruBKA locus in Escherichia coli K-12 and Pseudomonas putidaKT2440 and structure of the Cra binding site. (A) Conserved genomic organization of the fruBKAoperon in enterobacteria and in P. putida. This gene cluster encompasses fruB (fructose-specificEI/HPr/EIIA component of the PTS), fruK (1-phosphofructokinase), and fruA (fructose-specific subunitIIC of the PTS). Note that while the cra (i.e., fruR) gene lies far away from the fruBKA gene cluster inE. coli, the corresponding orthologue in strain KT2440 forms part of the same genomic locus butlocated in a divergent fashion. (B) The canonical E. coli consensus sequence for the binding of Cra toDNA was retrieved from the PRODORIC database (53, 54). Note that this sequence forms anincomplete palindrome in which the left half-site is considerably better conserved than the righthalf-site (the Cra binding sites of P. putida examined in this work are closer to a perfect palindrome;see below).
Chavarría et al.
Volume 1 Issue 6 e00154-16 msystems.asm.org 2
on May 30, 2018 by guest
http://msystem
s.asm.org/
Dow
nloaded from

the Fru transport systems of E. coli and P. putida are compared, the same basicconstituents are found: fruB, fruA (along with a third gene needed for F1P phosphor-ylation, fruK), the Cra repressor, and the phosphorylated forms of Fru (i.e., F1P and FBP)as the effectors. The canonical Cra operator, on the other hand, is well conservedamong bacterial species (Fig. 1B) (17, 23). Yet, all these elements appear to beconnected differently in terms of functionality, and they seem to respond to differentphysiological/environmental cues. In fact, the most intriguing aspect of the metabolicarchitecture in each case is the role of Cra/FruR on the regulation of PTSFru. Inenterobacteria, Cra is a transcriptional regulator that controls the expression of a largenumber of genes in central carbon metabolism (CCM) according to the distribution ofglycolytic fluxes (24–26). In contrast, CraP. putida strongly binds an operator at the PfruB
promoter in a fashion exclusively dependent on the intracellular F1P concentration (22).The lack of other CraP. putida targets in the chromosome of strain KT2440 is somewhatintriguing considering the plethora of CCM genes regulated by the orthologue inenterobacteria. Furthermore, the regulatory logic of Fru transport in P. putida is a ratherperplexing one: F1P is needed to relieve the repression exerted by CraP. putida on theexpression of the fruBKA operon, and the expression of this operon is obviously neededfor the assembly of the PTSFru complex, without which Fru cannot be transported intothe cells. Yet, F1P cannot be generated unless a functional PTSFru is in place and someFru has been transported to the cytoplasm.
The work described in this contribution was set to clarify such a metabolic conun-drum, i.e., why PTSFru of P. putida follows such an apparently incongruous regulatorylayout. To this end, the consequences of seamlessly deleting cra on the cognatewhole-genome transcriptome were examined in P. putida KT2440 growing underdifferent metabolic regimens. As shown below, a key gene (PP_3443) encoding aglyceraldehyde-3-P (GA3P) dehydrogenase (GAPDH) activity was found to be regulatedby CraP. putida. This new regulatory connection grants CraP. putida the control of theoverall GAPDH activity through PP_3443, thereby regulating the levels of PEP depend-ing on metabolic requirements. Yet, what is the impact of this regulatory pattern on thecell physiology? By modeling a combined metabolic and regulatory circuit in silico thatemerges from such a new connection, it was discovered that CraP. putida regulates theavailability of PEP (and therefore the uptake of Fru) through PP_3443. Also, theresulting device (which we have called a “metabolic widget”) acts as a memory patchthat eases the shift of cells between conditions with different levels of Fru availability.Thus, new and often subtle regulatory connections adjust default and widely sharedmetabolic networks to specific needs of given bacteria in particular environmentalniches. New functionalities in biochemical setups thereby emerge not because of themere enumeration of the components at stake but owing to novel functional relation-ships between these elements.
RESULTS AND DISCUSSIONTranscriptional analysis of wild-type P. putida KT2440 and its �cra derivativereveals unexpected regulatory targets. Previous studies have indicated that the Craprotein of E. coli and Salmonella enterica serovar Typhimurium acts as a dual regulator,as it represses the expression of some CCM genes (e.g., pfkA, pykA, pykF, acnB, edd, eda,mtlADR, and gapB) and activates the expression of others (e.g., ppsA, fbp, pckA, acnA, icd,aceA, and aceB) (27–29). As a physiological consequence of the regulation exerted byCra on multiple genes of CCM in E. coli, this regulator controls the carbon flow andultimately influences the utilization of several substrates (30–32).
The genome of the soil bacterium P. putida KT2440 encodes a Cra orthologue whosegene (cra, also called fruR [Fig. 1A]) is divergently oriented in respect to the fruBKAoperon. CraP. putida binds one quasipalindromic operator (5=-TTA AAC · GTT TCA-3=,Fig. 1B) located between PfruB and fruB, thereby repressing the expression of the entirefruBKA operon in an F1P-dependent fashion. Because other possible regulatory func-tions for CraP. putida remain unknown, the genome-wide transcription landscapes ofwild-type and Δcra cells grown on different carbon sources (Glu, succinate [Suc], and
Metabolic Widget for Sugar Consumption
Volume 1 Issue 6 e00154-16 msystems.asm.org 3
on May 30, 2018 by guest
http://msystem
s.asm.org/
Dow
nloaded from
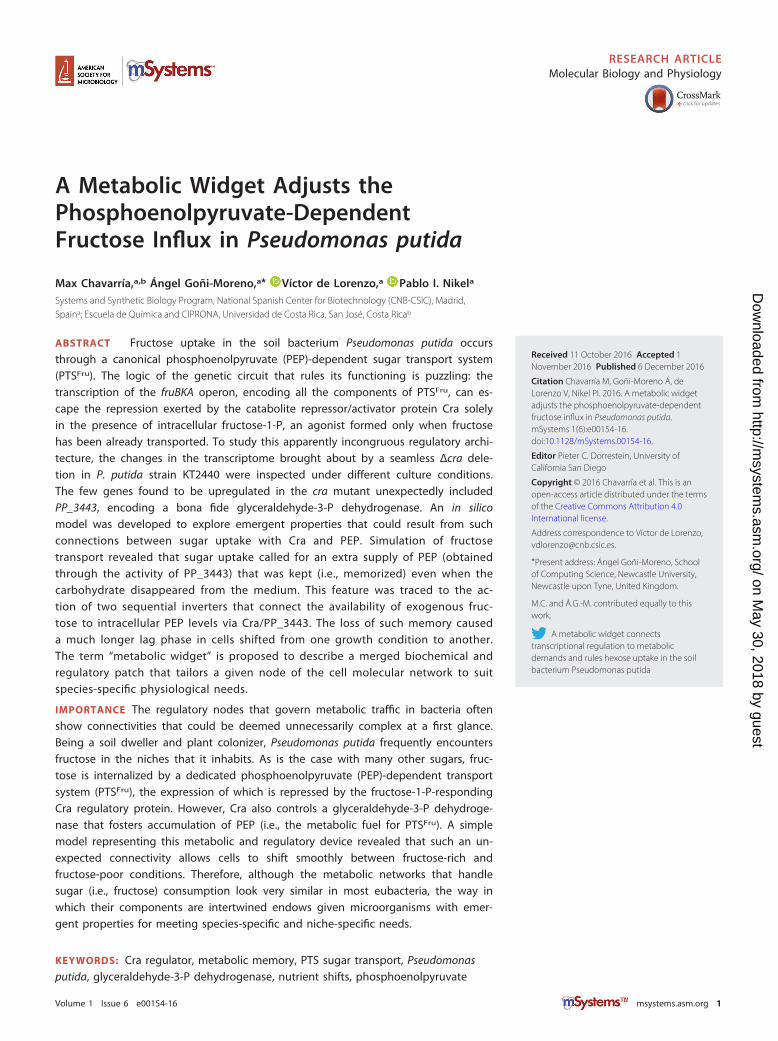
Fru) were compared by means of deep RNA sequencing (33, 34). We first focused on thetranscription of genes encoding components of CCM at the single-nucleotide resolu-tion. In agreement with the results of previous studies, differences were observed in thetranscription of the fruBKA operon between wild-type KT2440 and the Δcra mutant (seeFig. S2 in the supplemental material). No transcription was observed in Glu- orSuc-grown wild-type cells, while fruBKA was highly transcribed in the Δcra background(i.e., CraP. putida represses the expression of components of PTSFru). Wild-type cellsgrown on Fru represent a control for the results obtained in Glu and Suc as F1P is freelyproduced under this condition, it binds to CraP. putida, and the transcription of PTSFru isderepressed (see Fig. S2 in the supplemental material). Yet, what is the situation forother genes of CCM?
No gene related to CCM in P. putida KT2440, belonging to the pathways depicted inFig. S1 in the supplemental material, seemed to be transcriptionally regulated byCraP. putida across the culture conditions tested in this study (data not shown), with theintriguing exception of PP_3443. The expression of PP_3443 was repressed in Suc andGlu and transcribed in strain KT2440, but this pattern changed in the Δcra mutant, inwhich the gene was highly transcribed under either gluconeogenic or glycolytic growthconditions (Fig. 2A). Since PP_3443 has been recently shown to represent a GAPDH inP. putida growing on different substrates (35), we asked the question whether thetranscription of other genes known to encode GAPDH activities could be also under thecontrol of CraP. putida (Fig. 2A). PP_0665 was the only GAPDH-encoding gene that did notshow any significant level of transcription under all the conditions tested. The geneencoding Gap-1, the main glycolytic GAPDH activity, was expectedly transcribed in Glu-and Fru-grown cells (but not on Suc) irrespective of the presence of CraP. putida. Incontrast, gap-2 was highly transcribed across the culture conditions and strains tested,
FIG 2 Sequence coverage plots for genes encoding glyceraldehyde-3-P dehydrogenase activities in Pseudomonasputida KT2440 and its �cra mutant analyzed at the single-nucleotide level. (A) Coverage plots for the raw deep RNAsequencing data. The plots shown in the diagram correspond to the expression pattern of the selected genes insamples taken during mid-log phase from cultures developed on glucose, fructose, or succinate as the sole carbonsource as indicated at the far right. (B) Quantitative analysis of gene expression for the four genes encodingglyceraldehyde-3-P dehydrogenase activities. The bars represent the mean value of the expression level for each geneobserved in the �cra mutant normalized to the expression level detected in P. putida KT2440, expressed as�log2(�cra/wild type). Differences in the pairwise comparison of the expression of PP_3443 against that of any othergene in the diagram (i.e., gap-1, gap-2, or PP_0665) were significant as judged by the corresponding false discoveryrate values (51). (C) The regulatory region of the PP_3443 gene in P. putida, containing a single operator identified asindicated in the outline. The sequence 5=-TGA AAC GAT TCA-3= (highlighted in red) corresponds to the quasipalin-dromic Cra binding motif upstream of the PP_3443 gene. WT, wild-type strain.
Chavarría et al.
Volume 1 Issue 6 e00154-16 msystems.asm.org 4
on May 30, 2018 by guest
http://msystem
s.asm.org/
Dow
nloaded from

and therefore, its expression seems to be constitutive. When these transcription datawere individually analyzed and converted into the corresponding relative expressionlevels, the effect of CraP. putida on the transcription of PP_3443 became even moreevident (Fig. 2B). In particular, the level of expression of this gene increased by 4.4- and2.4-fold in the Δcra mutant compared to the wild-type strain in Suc and Glu cultures,respectively.
This regulatory pattern on the PP_3443 gene was further checked in silico byapplying the Cra binding E. coli sequence consensus (Fig. 1B) to the 5= untranslatedregion of PP_3443. Further, the entire genome of strain KT2440 was scanned to checkfor potential regulatory targets. Possible CraP. putida binding sites were identified in theintergenic region of three CCM genes (i.e., gap-1, 5=-TGA AAC · GGT TTT-3=; edd, 5=-TGAAAC · GGT TTT-3=; and PP_3443, 5=-TGA ATC · GTT TCA-3=) (Fig. 2C; see also Table S1 inthe supplemental material). Therefore, deep sequencing of RNA transcripts and theanalysis of possible CraP. putida operators in the genome of P. putida KT2440 indicatedthat the only bona fide CCM gene subjected to transcriptional regulation by CraP. putida
is PP_3443, in addition to the known regulation on the Fru utilization operon. Again,this information reveals that the regulatory tasks of CraP. putida are entirely different withrespect to enterobacteria.
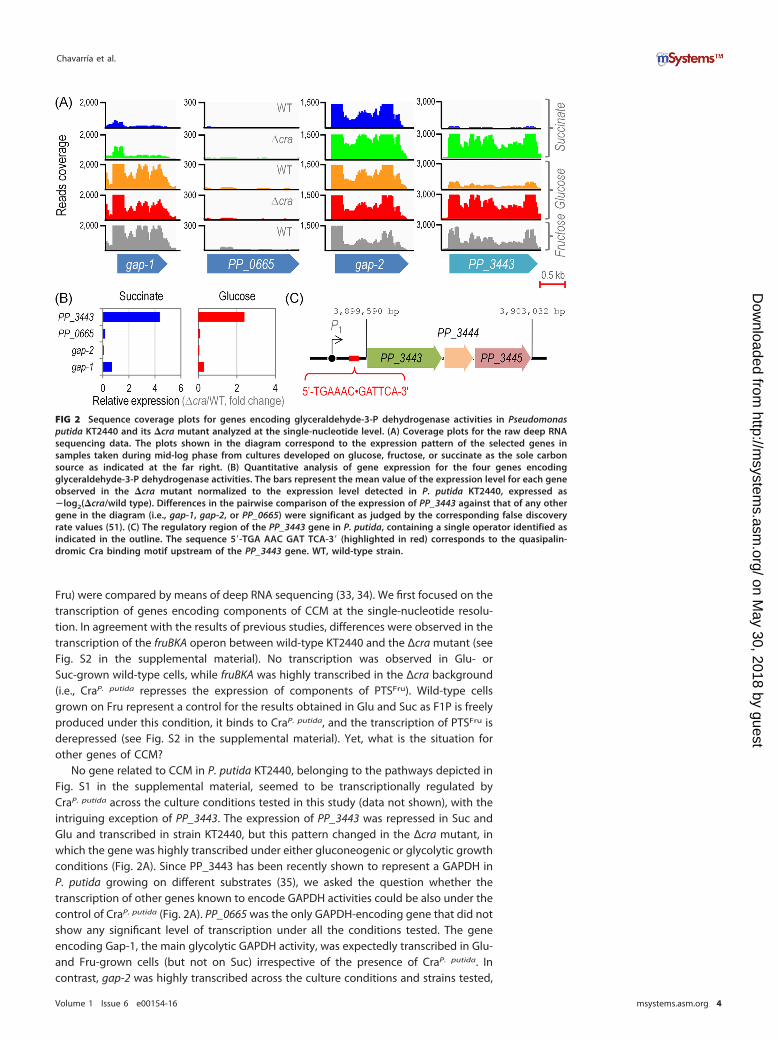
Cra regulates the GAPDH activity of P. putida KT2440. Since the only gene incentral CCM over which we observed transcriptional differences between wild-typeP. putida and the Δcra mutant was PP_3443, the next relevant question was whetherthis transcriptional pattern correlates with an actual metabolic regulation. As indicatedabove, the GA3P metabolic node in P. putida KT2440 comprises four potential enzymes(Fig. 3A). The in vitro evaluation of the total GAPDH activity in a P. putida ΔPP_3443strain grown on glycerol indicated that this enzyme seems to be NADP� dependent(35). Based on these previous studies and the RNA sequencing results discussed above,we measured the total GAPDH activity in wild-type cells and in the Δcra mutant. The invitro enzymatic assays were performed using either NAD� or NADP� as the cofactor incell extracts obtained from cells grown on Glu or Fru.
The GAPDH activities with either redox cofactor were similar in the wild-type strainand its Δcra derivative when Fru was used as the carbon source (Fig. 3B). As previouslyexplained for the expression of components of PTSFru, the regulatory functions ofCraP. putida are deactivated in Fru, as the effector F1P is continuously produced and
FIG 3 In vitro determination of the glyceraldehyde-3-P dehydrogenase activity in Pseudomonasputida KT2440 and its �cra mutant. (A) Biochemical sequence proposed for the processing ofglyceraldehyde-3-P. Enzymes involved in these conversions are shown beside the reaction that theycatalyze. Note that the first biochemical step is catalyzed by the glyceraldehyde-3-P dehydrogenases(Gap-1 and Gap-2) and the two other isoforms of these enzymes, encoded by PP_0665 and PP_3443.All the reactions are conventionally written in the catabolic direction, and the wide shaded arrowsindicate the connection of this series of biochemical reactions with the rest of the central carbohy-drate metabolic pathways. (B) In vitro quantitation of the total specific (Sp) activity ofglyceraldehyde-3-P dehydrogenase in P. putida KT2440 and its isogenic �cra derivative determinedin cells grown on glucose or fructose and using different redox cofactors as indicated. Each barrepresents the mean value of the corresponding enzymatic activity � standard deviation of duplicatemeasurements from at least three independent experiments. WT, wild-type strain.
Metabolic Widget for Sugar Consumption
Volume 1 Issue 6 e00154-16 msystems.asm.org 5
on May 30, 2018 by guest
http://msystem
s.asm.org/
Dow
nloaded from
derepression occurs constitutively. Although in a Δcra mutant the expression ofPP_3443 is fully derepressed, no significant differences were observed in enzymaticassays between the two strains. Results from cells grown on Glu as the sole carbonsource, however, clearly evidenced the regulation exerted by Cra on PP_3443. The invitro assays revealed a 1.22-fold increase in the NAD�-dependent GAPDH activitybetween the wild type and the Δcra mutant, and far more clear differences wereobserved in the GAPDH activity evaluated in the presence of NADP� as the cofactor(i.e., a 1.54-fold increase in the specific GAPDH activity in the Δcra mutant with respectto P. putida KT2440). In a similar fashion as the results of transcriptomic analysispreviously discussed, the direct comparison of the specific enzymatic activities of thewild-type strain grown on Glu and Fru represents a useful control for the observationsobtained in the Δcra mutant cells. This regulation was disclosed by the 1.46-fold-higherspecific GAPDH activity observed in P. putida KT2440 grown in Fru than in the samecells grown on Glu (Fig. 3B). Thus, the results of in vitro enzymatic determinations certifythe regulation of CraP. putida on the overall GAPDH activity that the transcriptionalevidence had suggested. Yet, what is the physiological relevance of this delicate controlin the GA3P node mediated by CraP. putida in strain KT2440?
The regulation exerted by CraP. putida on PP_3443 is related to phosphateavailability for the operation of PTSFru. The transcriptomic and enzymatic dataestablished a connection between CraP. putida and the overall GAPDH activity throughthe product encoded by PP_3443. This observation raises new questions: why wouldP. putida require a higher GAPDH activity when growing on Fru than when growing onGlu or Suc? And, more importantly, what are the physiological consequences of thiscatabolic regulation? The close examination of the pathways involved in CCM inP. putida KT2440 (see Fig. S1 in the supplemental material) provides a hint to answerthese questions. GAPDH enzymes are located in a key regulatory point of CCM: theGA3P node. This key metabolite can follow several central routes, i.e., (i) GA3P can bedirected toward the formation of PEP and Pyr to subsequently enter into the tricar-boxylic acid (TCA) cycle as acetyl coenzyme A; (ii) it can be recycled upward for theproduction of FBP, fructose-6-P, and glucose-6-P to generate reducing power (namely,NADPH � H� [36]) through the so-called EDEMP cycle (11); and (iii) it may be also usedin reversible reactions within the pentose phosphate pathway. GA3P is therefore a veryimportant metabolic hub from where carbon fluxes can be accommodated throughseveral branching pathways according to biochemical and environmental require-ments. However, there is another factor that needs to be considered in this picture: thephosphate group borne by GA3P.
As mentioned in the introduction, PTSFru of P. putida (composed of FruA/EIIBC andFruB/EI-HPr-EIIA) coexists with PTSNtr (composed of PtsP/EINtr, PtsO/NPr, and PtsN/EIIANtr). The source of the high-energy phosphate residue that fuels the activity of bothPTS systems is PEP (37). Since the source of such a phosphate residue needed for theconversion of Fru into F1P is PEP (12), and considering that this metabolite can begenerated from GA3P only under glycolytic conditions (i.e., using either Glu or Fru asthe carbon source) (38), the interplay between carbon fluxes and the availability ofhigh-energy phosphate residues was also considered in our interpretation. In particular,we hypothesized that the overall GAPDH activity, from which PEP is ultimately ob-tained, rules the availability of high-energy phosphate needed for Fru phosphorylationthrough PTSFru. Since CraP. putida controls the expression of PP_3443 in strain KT2440and therefore the total GAPDH activity, it seems plausible that this regulation results indifferences in the operativity of the whole PTSFru. This hypothesis fits with the distri-bution of metabolic fluxes, based on 13C tracers, in wild-type P. putida KT2440 whencells are grown on Glu and Fru (see Fig. S3 in the supplemental material). When thenormalized metabolic fluxes from GA3P to PEP were evaluated, a 25% increase wasobserved in the GAPDH flux in Fru-grown cells over the flux in those grown in Glu. Froma more general perspective, the normalized fluxomic data indicated that the net fluxesconnecting GA3P ¡ glycerate-3-P ¡ PEP ¡ Pyr are higher in Fru- than in Glu-grownP. putida cells.
Chavarría et al.
Volume 1 Issue 6 e00154-16 msystems.asm.org 6
on May 30, 2018 by guest
http://msystem
s.asm.org/
Dow
nloaded from

Kinetic modeling of the fructose intake in P. putida KT2440 reveals adynamic behavior in central carbon metabolism ruled by CraP. putida. Thetranscriptomic, fluxomic, and quantitative physiology data above point toward aconnection between the CraP. putida regulator, the activity of GAPDH (and hence theintracellular availability of PEP), and the process of Fru uptake in P. putida KT2440. Yet,these functional relationships are of a purely qualitative nature, and therefore, the nextobjective was to analyze these connections with methods that go beyond experimentaltechniques to describe the process of Fru uptake mediated by PTSFru in this bacterium.The functional connections between the elements at stake are so specific and ephem-eral that is extremely difficult to evaluate them in vivo. In order to fulfill this objective,we built a mathematical model of these cell components and kinetic parameters thatreveals the details of short-lived dynamics (Fig. 4). The resulting dynamic model takesinto consideration (and merges) (i) the transcriptional regulation exerted by CraP. putida
on PP_3443 and fruBKA, (ii) the actual GAPDH activity brought about by PP_3443 andthe transporter activity of FruAB/FruK (i.e., PTSFru), (iii) the intracellular concentrationsof PEP and F1P, and (iv) the extracellular levels of Fru as a substrate. Furthermore, theregulatory effect of F1P on CraP. putida was also taken into account as a variable in themodel. Note, however, that the sketch shown in Fig. 4 does not incorporate all thepotential connections that exist in the system; instead, it describes those reactionsconsidered responsible for the dynamics of the entire network under study. These werethe relevant parameters targeted for simulation studies. In particular, the intracellularconcentration of PEP was used as a measuring reference (i.e., a proxy) in both wetexperiments and in silico analysis. The reactions corresponding to the model circuit areindicated in Fig. S4A in the supplemental material, and the rate values along with initialspecies concentrations are indicated in Table 1. Species dynamics over time weresimulated deterministically with a set of coupled ordinary differential equations (ODEs)(see Fig. S4B in the supplemental material). The selection of rates and molecular speciesintervening in the model was done on the basis of (i) direct measurements in wet-labexperiments whenever possible (e.g., k17, which represents the specific rate of Fru
FIG 4 Network used for modeling the dynamics of fructose uptake and the regulation exerted byCra in Pseudomonas putida KT2440. The model merges the dynamics of gene expression, proteinstability, enzymatic activity, and the concentration of intracellular and extracellular metabolites. Notethat this sketch does not incorporate all the possible connections existing in the system; rather, itdepicts only those reactions deemed responsible for the dynamics of the network considered andthus targeted for the simulation studies described here. The values of all the k constants (represent-ing individual rates in the model) are indicated in Table 1. F1P, fructose-1-P; PEP, phosphoenolpy-ruvate; Cra*, inactive form of the Cra regulator; PP_xxxx, alternative glyceraldehyde-3-P dehydroge-nases (i.e., other than PP_3443). The Ø symbol represents degradation of the corresponding species.
Metabolic Widget for Sugar Consumption
Volume 1 Issue 6 e00154-16 msystems.asm.org 7
on May 30, 2018 by guest
http://msystem
s.asm.org/
Dow
nloaded from

uptake, qS) and (ii) estimation of some parameters taken from the literature when directexperimental values were not available (e.g., k1, which represents the affinity ofCraP. putida for the P1 promoter that drives the expression of PP_3443). In any case, thereconstructed network and the corresponding model suggest that the alteration of theset of estimated values would lead to relatively small quantitative changes in theoverall output (as opposed to qualitative changes). The ODEs were coded using Pythonas the programming language.
Figure 5 shows the results of a simulation in which the PEP concentration wasplotted as a function of the specific rate of Fru uptake (i.e., qS, represented in the model
TABLE 1 Rates, values, and species used for simulation
Rateb Value and unit Sourcea
k1 1 �mol�1 · liter · h�1 Es; this workk�1 50 � 10�3 h�1 Es; this workk2 60 h�1 Es; 59, 60k3 8 � 104 h�1 Ft; this workk4 10 �mol�1 · liter�1 · h�1 Ft; this workk5 1 �mol�1 · liter · h�1 Ob; this workk�5 50 � 10�3 h�1 Ob; this workk6 90 h�1 Es; 59, 60k7 208 �mol�1 · liter · h�1 Es; 59, 60k8 30 �mol�1 · liter · h�1 Es; 59, 60k9 0.35 �mol�1 · liter · h�1 Ob; this workk�9 50 � 10�3 h�1 Ob; this workk10 2 h�1 Es; 59, 60k11 17 h�1 Es; this workk12 0.17 h�1 Es; 59, 60k13 0.17 h�1 Es; 59, 60k14 17 h�1 Es; this workk17 168 �mol · liter�1 · h�1 Ob; this workk18 1.7 h�1 Es; this workP1 1.7 � 10�3 �mol · liter�1 Ob; this workP2 1.7 � 10�3 �mol · liter�1 Ob; this workCra 4 �mol · liter�1 Es; this workaAll the parameters are codified as Es (estimated), Ob (experimentally obtained), or Ft (fitted).bSee the model in Fig. 4 and the legend to Fig. S4 in the supplemental material for information on the rates.
FIG 5 Dynamic modeling of the intracellular availability of phosphoenolpyruvate with respect to thespecific rate of fructose uptake. The plots indicate the level of phosphoenolpyruvate (PEP, y axis)while varying the specific rate of fructose uptake (qS, k17 in the network shown in Fig. 4, x axis) forthe wild-type (WT) Pseudomonas putida KT2440 strain (A) and its �cra derivative (B). Black lines(arrows pointing to the right) show the state of PEP in the system while k17 increases from an initialstate without fructose in the medium (far left). Red lines (arrows pointing to the left) show the stateof PEP in the system while k17 decreases from the final state (far right). The OFF and ON states of thesystem are indicated in the graphics, and the architecture of the network is shown on top of the plotsin terms of inverters (connecting PEP and fructose through the regulatory action exerted by Cra). Theyellow dot indicates the experimentally measured values for the intracellular PEP level and k17. Theshadowed areas in the plots indicate what would happen if the cells were hypothetically overloadedwith fructose (i.e., beyond the physically possible limits determined experimentally). As shown in thediagrams, the level of available PEP would decrease, as it would be consumed right away to mediatefructose transport.
Chavarría et al.
Volume 1 Issue 6 e00154-16 msystems.asm.org 8
on May 30, 2018 by guest
http://msystem
s.asm.org/
Dow
nloaded from
by k17). The first indication of the dynamics of the system came from the shape of thetrajectories representing PEP concentration, which differed depending on whether theqS values were increasing or decreasing. In other words, there was a hysteresis processtaking place in wild-type P. putida KT2440 cells at low-to-medium qS values whereby,for a given x axis point, there were two very different values of the y axis depending onwhether the system was transiting from a high qS value (going from right to left in thex axis) or from a low qS value (going from left to right in the x axis) (Fig. 5A). Such ahysteresis process disappeared altogether in the Δcra mutant (Fig. 5B). Therefore, thisbehavior, affecting the internal state of the cells in terms of PEP availability, stems fromthe history of the system. The entire network in the wild-type cell acts as a circuit withtwo inverters in a row, what we purposely call a “metabolic widget”. If the Fru level inthe external medium is negligible (and thus qS is very low), the output (the actualintracellular PEP concentration) is OFF; if, on the contrary, Fru is present in the culturemedium, the output is ON. The circuit is cut off in the Δcra mutant, yielding analways-ON behavior with respect to PEP formation. In both cases, the PEP concentrationdecreases on the far right because all the components of the system are ON andtherefore PEP gets consumed right away to mediate Fru transport, without eventransiting through an available state. The hysteresis process is observed in wild-typecells and not in the Δcra mutant derivative because the forces at play in the wholenetwork are rooted in slow dynamics (please refer to the differences highlighted inFig. S5 in the supplemental material), caused by gene expression/repression events (i.e.,as opposed to fast changes in the intracellular metabolite concentration). Since thesechanges are brought about by gene expression patterns, the behavior of the entiresystem can be traced to the regulatory action of the CraP. putida protein. The hysteresisphenomenon represents a temporal memory (i.e., the system tends to stay in itsprevious state). The next standing question was to analyze if PP_3443 participates insuch a regulatory circuit.
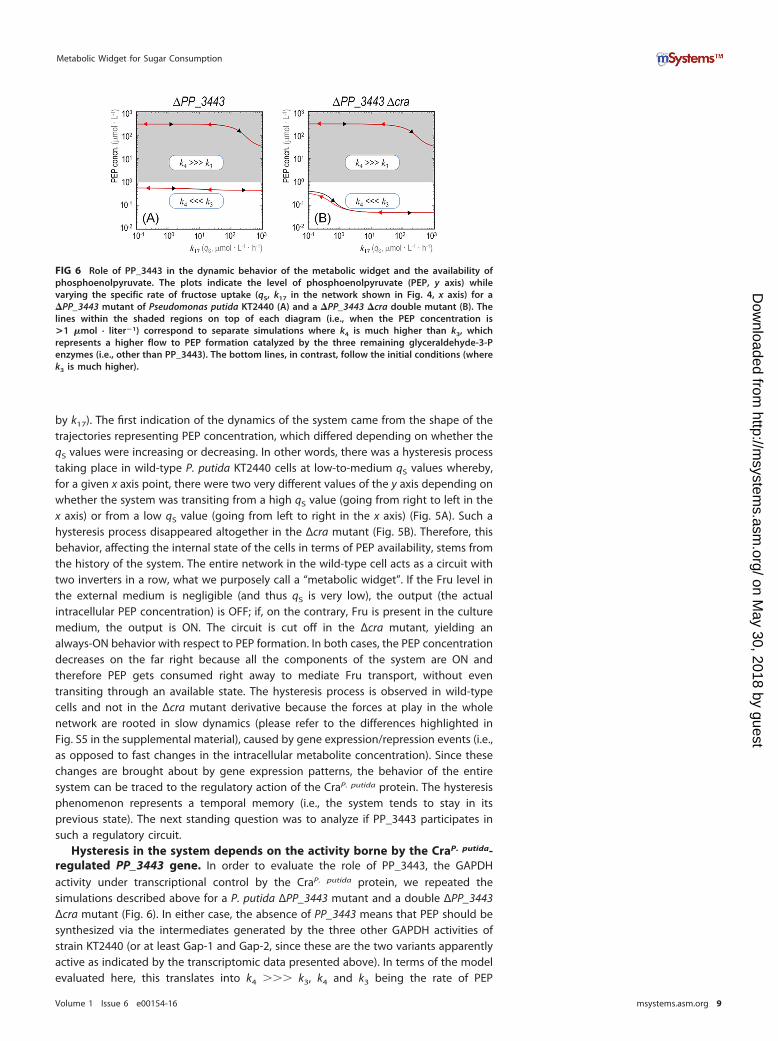
Hysteresis in the system depends on the activity borne by the CraP. putida-regulated PP_3443 gene. In order to evaluate the role of PP_3443, the GAPDHactivity under transcriptional control by the CraP. putida protein, we repeated thesimulations described above for a P. putida ΔPP_3443 mutant and a double ΔPP_3443Δcra mutant (Fig. 6). In either case, the absence of PP_3443 means that PEP should besynthesized via the intermediates generated by the three other GAPDH activities ofstrain KT2440 (or at least Gap-1 and Gap-2, since these are the two variants apparentlyactive as indicated by the transcriptomic data presented above). In terms of the modelevaluated here, this translates into k4 ��� k3, k4 and k3 being the rate of PEP
FIG 6 Role of PP_3443 in the dynamic behavior of the metabolic widget and the availability ofphosphoenolpyruvate. The plots indicate the level of phosphoenolpyruvate (PEP, y axis) whilevarying the specific rate of fructose uptake (qS, k17 in the network shown in Fig. 4, x axis) for a�PP_3443 mutant of Pseudomonas putida KT2440 (A) and a �PP_3443 �cra double mutant (B). Thelines within the shaded regions on top of each diagram (i.e., when the PEP concentration is>1 �mol · liter�1) correspond to separate simulations where k4 is much higher than k3, whichrepresents a higher flow to PEP formation catalyzed by the three remaining glyceraldehyde-3-Penzymes (i.e., other than PP_3443). The bottom lines, in contrast, follow the initial conditions (wherek3 is much higher).
Metabolic Widget for Sugar Consumption
Volume 1 Issue 6 e00154-16 msystems.asm.org 9
on May 30, 2018 by guest
http://msystem
s.asm.org/
Dow
nloaded from

generation through the GAPDH activity of Gap-1 and Gap-2 and that of PP_3443,respectively. When PP_3443 is eliminated from the system (in both Fig. 6A and B), PEPformation expectedly drops drastically at the initial values of qS (i.e., the intracellularPEP concentration remains at �1 �mol · liter�1; see white bottom regions in the plots).The lines representing PEP concentration in the shaded regions of the plots look alike,irrespective of the presence of CraP. putida, under the assumption that the overall GAPDHactivity of the ΔPP_3443 mutant is enough to provide the PEP needed for Fru uptakeand proper cell functioning. In other words, the dynamics of the system describedabove are completely lost if PP_3443 is absent. In the case of the Δcra mutant, theintracellular levels of PEP decrease further because this metabolite is being used (andconsumed) by FruBA. In such a hypothetical scenario, an increase in k4 (shaded topregions of plots) restores the levels of PEP, which indicates that the routes responsiblefor PEP production are dynamically adjusted in the cells. No hysteresis happens in thesystem under these conditions, as no expression/repression events take place and slowreaction dynamics are altogether eliminated.
Functional validation of the metabolic widget for fructose utilization inP. putida KT2440. The importance of the regulatory control displayed by theCraP. putida/PP_3443/PEP widget described here was made evident when growth pa-rameters of P. putida KT2440 and the Δcra and ΔPP_3443 mutant derivatives wereanalyzed in quantitative physiology experiments (Fig. 7). When using Glu or Suc as thecarbon source, the three strains followed rather similar growth patterns, and thedifferences in the kinetic parameters analyzed were not significant. In fact, the specificgrowth rates/characteristic doubling times and the duration of the lag phase in thesecultures were consistent with previous findings (11, 35, 39), Suc promoting the fastestgrowth among the conditions tested. A different situation, however, was noted whenFru was used as the substrate. The P. putida Δcra mutant, for instance, displayed aremarkable behavior in these Fru-dependent cultures, characterized by (i) a 30% shorterlag phase (Fig. 7A) and (ii) a 46% higher specific growth rate (Fig. 7B) with respect tothe wild-type strain. In the wild-type strain, the derepression of the genes encoding thePTSFru involves the buildup of enough F1P and the binding of this metabolite toCraP. putida, thereby bringing about a conformational change in the protein to break freefrom the target DNA regions (22); i.e., an overall transcriptional adaptation process isneeded to start growing on Fru. The shorter lag phase of the Δcra strain is to beexpected since such transcriptional adaptation (and the ensuing derepression of thegenes encoding PTSFru) is not relevant in this genetic background. As expected, thisreduced lag phase in cultures of the Δcra mutant was observed only on Fru, while whenusing the other carbon sources (either Glu or Suc), where the regulation exerted by
FIG 7 Kinetic and growth parameters of Pseudomonas putida KT2440 and its �cra and �PP_3443derivatives. Batch cultures of the strains under study, using different gluconeogenic and glycolyticcarbon sources as indicated in the plots, were analyzed by the duration of the characteristic lag phase(A) and the specific growth rate of the cells (B). The extension of the lag phase was analyticallyobtained from growth parameters as detailed by Dalgaard and Koutsoumanis (43), and the specificgrowth rate was determined during exponential growth. Each bar represents the mean value of thecorresponding parameter � standard deviation of triplicate measurements from at least threeindependent experiments.
Chavarría et al.
Volume 1 Issue 6 e00154-16 msystems.asm.org 10
on May 30, 2018 by guest
http://msystem
s.asm.org/
Dow
nloaded from

CraP. putida is not significant for their utilization, no differences were observed. On theother hand, the most important physiological effect of deleting cra could be observedin the specific growth rate. We propose that the absence of the CraP. putida transcrip-tional regulator not only increases the expression of the components of the PTSFru butalso boosts the phosphate flux from GA3P to PEP due to the complete derepression ofPP_3443. Once again, this effect on the specific growth rate is not observed in Glu orSuc as the carbon source (where it is not needed).
Quantitative physiology experiments with the ΔPP_3443 mutant of P. putida KT2440were also conducted to check the impact of the cognate GAPDH activity on the overallcell physiology. Under all the tested conditions, the absence of the PP_3443 generesulted in a longer lag phase and a growth rate lower than that of the wild-type strain(Fig. 7). Although there are other genes encoding GAPDH activities in the genome ofstrain KT2440, PP_3443 seems to be relevant under both glycolytic and gluconeogenicgrowth conditions, a finding in line with the role observed for this enzyme in glycerolcultures (35). However, the most prominent effect was observed when Fru was used asthe carbon source. Under such conditions, the ΔPP_3443 mutant had a (i) 75% longerlag phase (Fig. 7A) and (ii) 32% lower specific growth rate (Fig. 7B) with respect to thewild-type strain. These results point, again, to a relevant role of the GAPDH activityencoded by PP_3443 in the catabolism of Fru.
Conclusion. The results presented in this work revealed two important findings: (i)unlike the case in E. coli, CraP. putida is alien to the regulation of many genes related toCCM, and (ii) CraP. putida regulates transcriptionally the expression of the PP_3443 gene,thereby affecting the overall GAPDH activity of strain KT2440 and the intracellularavailability of PEP. The regulation of CraP. putida on PP_3443 is further wired to theactivity of PTSFru in this bacterium, since in cultures using Fru as the sole carbon source,CraP. putida derepresses the expression of PP_3443 to increase the total GAPDH activityand therefore ensures sufficient PEP levels for Fru uptake through PTSFru. A model ofthis remarkable metabolic device, which we termed a metabolic widget, is presented inFig. 8. The metabolic setting where CraP. putida exerts its regulation is key for the cell: theGA3P node, a hub of CCM. At this point, carbon and phosphate fluxes can be adjustedaccording to nutritional requirements and/or environmental cues. CraP. putida orches-trates the operation of PTSFru in a more precise fashion than previously thought: this isbecause the regulator not only controls the expression of components of the transportsystem (i.e., the fruBKA operon) but also regulates the phosphate flux in CCM with a sortof memory patch. This situation ensures the availability of enough of the PEP neededfor the phosphorylation of the PTS components all the way up to exogenous Fru duringshifts between conditions characterized by different levels of hexose availability. Thissituation is reminiscent of the regulatory phenomenon observed when P. putida cellsgrow on glycerol as the carbon source (39). Under these conditions, this bacteriumdisplays a sort of memory, ruled by the GlpR regulator, that enables the cells to betteradapt to environmental situations in which glycerol is highly abundant. The regulatoryscope of the Cra transcriptional factor in P. putida KT2440 seems to be mostly relatedto the control of Fru uptake, while the corresponding E. coli orthologue seems to havedivergently evolved to regulate the expression of several CCM genes in response to theinternal glycolytic flux. The work above thus exemplifies how the same biochemical andregulatory constituents of a functionality shared by different bacteria might evolvequite differently depending on subtle changes in the connectivity of the cognatemolecular ingredients.
MATERIALS AND METHODSBacterial strains, culture media, and growth conditions. The reference strain P. putida KT2440 and its�cra and �PP_3443 derivatives have been described previously (12, 20, 35). All P. putida strains wereaerobically grown batchwise at 30°C with shaking at 170 rpm on LB medium or M9 minimal medium (40)containing either Glu, Fru, or Suc at 10 mM as the sole carbon and energy source. Growth was estimatedby measuring the optical density at 600 nm (OD600), assessed in an Ultrospec 3000 pro UV/visiblespectrophotometer (GE Healthcare Bio-Sciences Corp., Piscataway, NJ). For determination of growthparameters, cell cultures were harvested by centrifugation (15 min, 4,000 � g, 4°C), washed twice with
Metabolic Widget for Sugar Consumption
Volume 1 Issue 6 e00154-16 msystems.asm.org 11
on May 30, 2018 by guest
http://msystem
s.asm.org/
Dow
nloaded from

10 mM MgSO4, and finally resuspended in 10 mM MgSO4 to an OD600 of ~3. Culture media with theappropriate carbon source were inoculated to an OD600 of 0.05 from this cell suspension. Finally, 200-�laliquots of the freshly inoculated suspension were distributed in microtiter plates (clear-bottom poly-propylene 96-well plates; Nunc A/S, Roskilde, Denmark) and were incubated at 30°C with 2 min of orbitalshaking every 15 min (41, 42). Bacterial growth was estimated by periodically monitoring the OD600 ina SpectraMax Plus384 microplate reader (Molecular Devices, Sunnyvale, CA). Kinetic growth parameters,including the duration of the lag phase and the specific growth rate, were calculated as describedelsewhere (43–46).
RNA manipulation and deep sequencing of transcripts. Total RNA was extracted by using theRNeasy kit (Qiagen, Valencia, CA), and RNase-free DNase (Qiagen) treatment was performed during theisolation procedure to eliminate any residual DNA in the preparation. The quality of RNA samples wasevaluated in an Agilent 2100 Bioanalyzer (Agilent Technologies, Santa Clara, CA). RNA library constructionand sequencing were carried out by BGI (Shenzhen, China), using the Illumina mRNA sequencing samplepreparation kit (catalog no. RS-930-1001) and the Illumina HiSeq 2000 system (Illumina, Inc., San Diego,CA). Reads generated by the sequencing machines were cleaned and mapped to the database ofPseudomonas gene sequences (NCBI reference sequence NC_002947, version NC_002947.3) (47) usingSOAP2 software (version 2.21) (48), and the resulting alignment was visualized using IGV software (49).Fold changes and P values were calculated as described by Audic and Claverie (50). As the RNAsequencing data generated corresponded to a single biological sample for each carbon source, P valueswere corrected and expressed as false discovery rate values (51, 52). Genes with false discovery rates of�0.001 and absolute fold changes larger than 2 were considered differentially expressed. The detailedprocedures and the complete set of raw data generated in these experiments are available in a separatestudy (34).
Identification of a cra operator in the promoter region of PP_3443. The reference E. coliconsensus sequence for Cra binding sites was retrieved from the PRODORIC database (53, 54). Theresulting DNA motif was then searched in the genome of P. putida KT2440 by means of the VirtualFootprint software (version 3.0) (55), which revealed the presence of (at least) 89 possible Cra bindingsites in the target chromosome, including the site in the promoter region of PP_3443.
Preparation of cell extracts and in vitro enzymatic assays. All the enzyme activity determinationswere carried out in cultures during mid-exponential phase (i.e., corresponding to an OD600 of ca. 0.5). Cellextracts were prepared starting from 50 ml of culture broth, which was centrifuged at 4,000 � g for10 min. All the following procedures were carried out at 4°C. Cells were washed in 150 mM NaCl andsubsequently in 100 mM phosphate-buffered saline (PBS; pH 7.4). The washed pellets were suspendedin 500 �l of 100 mM PBS (pH 7.4), supplemented with 1.5 mM 2-mercaptoethanol, and disrupted byultrasonic treatment (10 treatments of 15 s with 30-s pauses between each round). The mixture was
FIG 8 Regulatory duties of Cra in Pseudomonas putida KT2440 and metabolic widget for fructoseuptake. The diagram sketches the functional relationship between the relevant elements that rulefructose uptake in P. putida KT2440. The transcriptional regulator Cra modulates the expression ofthe fruBKA operon, encoding the enzymes needed for fructose transport and phosphorylation, andit also controls the glyceraldehyde-3-P dehydrogenase activity through the activation of PP_3443 toensure a high-enough availability of high-energy phosphate (indicated in this outline by a red dot)needed to fulfill the fructose phosphorylation step using phosphoenolpyruvate (PEP) as the phos-phate donor. Note that in strain KT2440, the operation of central carbon metabolism is organizedaround the EDEMP cycle, which encompasses enzymes from the Embden-Meyerhof-Parnas, Entner-Doudoroff, and pentose phosphate pathways (11). GA3P, glyceraldehyde-3-P; FBP, fructose-1,6-P2;F1P, fructose-1-P; Pyr, pyruvate.
Chavarría et al.
Volume 1 Issue 6 e00154-16 msystems.asm.org 12
on May 30, 2018 by guest
http://msystem
s.asm.org/
Dow
nloaded from

centrifuged at 12,000 � g for 5 min, and the supernatant was collected and kept on ice. Enzyme activitieswere normalized by determining the total cell protein concentration using a Bradford-based (56, 57)protein assay purchased from Sigma-Aldrich Co. We used an extinction coefficient (�NADH) of 6.22 mM�1
cm�1, representing the difference between the extinction coefficients of NAD(P)H and NAD(P)�. One unitof enzyme activity was defined as the quantity of enzyme that catalyzed the formation of 1 �mol of thecorresponding product during the time indicated and at 30°C. GAPDH activity was measured by usingthe protocol described by Tiwari and Campbell (58) as modified by Nikel et al. (35). The assay mixturecontained (in a final volume of 1.0 ml) 100 mM Tris-HCl (pH 7.5), 6 mM D,L-GA3P, 10 mM cysteine-HCl,15 mM NaH2AsO4, 20 mM NaF, 0.35 mM NAD� or NADP�, and 50 to 150 �l of the cell extract. The GA3Pand cysteine-HCl solutions were neutralized just before use. The reaction mixture without GA3P wasincubated at 30°C for 1 min, and the reaction was initiated by adding the substrate. The reduction ofeither NAD� or NADP� was followed by taking readings every 10 s for 15 min at 340 nm.
In silico modeling and simulations. The kinetic model that represents the reactions (see Fig. S4A inthe supplemental material) of the system at stake was built deterministically with a set of ODEs (seeFig. S4B in the supplemental material). Due to the high number of connections modeled that haveunknown dynamics, stochastic approaches are to be considered noninformative for the time being.Simulations were carried out using our own in-house program coded in Python as the programminglanguage. Each of the plots in Fig. 5 and 6 shows a number of simulations, in particular, one per graphcoordinate at intervals of 0.1 along the x axis. All the simulations began with the system at a pristineinitial state; thus, the concentration of the output molecular species was set at 0 �M. The measurementsplotted correspond to the values of the system at a steady state after 0.5 h of evolution. All the graphsare represented in a logarithmic scale in both axes to facilitate the inspection of the system at low k17
values, where the dynamics revealed a very specific behavior as described in Results and Discussion.Metabolic flux analysis. Data for the distribution of metabolic fluxes in P. putida KT2440 growing on
different substrates were taken from our previous publications (11, 12) and analyzed as described byNikel and Chavarría (36).
Accession number(s). The complete raw data set of the deep RNA sequencing analysis is publiclyavailable at the Gene Expression Omnibus site of the NCBI (http://www.ncbi.nlm.nih.gov/geo) withGenBank accession number GSE46491.
SUPPLEMENTAL MATERIALSupplemental material for this article may be found at http://dx.doi.org/10.1128/mSystems.00154-16.
Figure S1, PDF file, 0.3 MB.Figure S2, PDF file, 0.1 MB.Figure S3, PDF file, 0.1 MB.Figure S4, PDF file, 0.1 MB.Figure S5, PDF file, 0.1 MB.Table S1, PDF file, 0.05 MB.
ACKNOWLEDGMENTSWe are indebted to J. Kim (University of Surrey, United Kingdom) for his valuable helpduring the analysis of transcriptomic data.
We declare that no conflicts of interest exist.V.D.L. and P.I.N. conceived and designed the project. M.C. and P.I.N. performed the
experiments and analyzed part of the data. Á.G.-M. carried out the in silico modeling. Allauthors analyzed the results and drafted the conclusions of this study. V.D.L. and P.I.N.wrote the manuscript.
During his internship at V.D.L.’s laboratory, M.C. was the recipient of a fellowshipfrom the University of Costa Rica.
FUNDING INFORMATIONThis work was funded by the CAMBIOS (RTC-2014-1777-3) and HELIOS (BIO-2015-66960-C3-2-R) projects of the Spanish Ministry of Economy and Competitiveness (MI-NECO) and the EVOPROG (FP7-ICT-610730), ARISYS (ERC-2012-ADG-322797), and Em-PowerPutida (EU-H2020-BIOTEC-2014-2015-6335536) contracts of the European Union.
REFERENCES1. del Castillo T, Ramos JL, Rodríguez-Herva JJ, Fuhrer T, Sauer U,
Duque E. 2007. Convergent peripheral pathways catalyze initial glucosecatabolism in Pseudomonas putida: genomic and flux analysis. J Bacteriol189:5142–5152. http://dx.doi.org/10.1128/JB.00203-07.
2. Jahreis K, Pimentel-Schmitt EF, Brückner R, Titgemeyer F. 2008. Ins
and outs of glucose transport systems in eubacteria. FEMS Microbiol Rev32:891–907. http://dx.doi.org/10.1111/j.1574-6976.2008.00125.x.
3. Iyer B, Rajput MS, Jog R, Joshi E, Bharwad K, Rajkumar S. 2016.Organic acid mediated repression of sugar utilization in rhizobia. Micro-biol Res 192:211–220. http://dx.doi.org/10.1016/j.micres.2016.07.006.
Metabolic Widget for Sugar Consumption
Volume 1 Issue 6 e00154-16 msystems.asm.org 13
on May 30, 2018 by guest
http://msystem
s.asm.org/
Dow
nloaded from

4. Pflüger-Grau K, de Lorenzo V. 2014. From the phosphoenolpyruvatephosphotransferase system to selfish metabolism: a story retraced inPseudomonas putida. FEMS Microbiol Lett 356:144 –153. http://dx.doi.org/10.1111/1574-6968.12459.
5. Clarke PH. 1982. The metabolic versatility of pseudomonads. Antonievan Leeuwenhoek 48:105–130. http://dx.doi.org/10.1007/BF00405197.
6. Somavanshi R, Ghosh B, Sourjik V. 2016. Sugar influx sensing by thephosphotransferase system of Escherichia coli. PLoS Biol 14:e2000074.http://dx.doi.org/10.1371/journal.pbio.2000074.
7. Luo Y, Zhang T, Wu H. 2014. The transport and mediation mechanismsof the common sugars in Escherichia coli. Biotechnol Adv 32:905–919.http://dx.doi.org/10.1016/j.biotechadv.2014.04.009.
8. Deutscher J, Francke C, Postma PW. 2006. How phosphotransferasesystem-related protein phosphorylation regulates carbohydrate metab-olism in bacteria. Microbiol Mol Biol Rev 70:939 –1031. http://dx.doi.org/10.1128/MMBR.00024-06.
9. Bettenbrock K, Fischer S, Kremling A, Jahreis K, Sauter T, Gilles ED.2006. A quantitative approach to catabolite repression in Escherichia coli.J Biol Chem 281:2578 –2584. http://dx.doi.org/10.1074/jbc.M508090200.
10. Nikel PI, Chavarría M, Danchin A, de Lorenzo V. 2016. From dirt toindustrial applications: Pseudomonas putida as a synthetic biology chas-sis for hosting harsh biochemical reactions. Curr Opin Chem Biol 34:20 –29. http://dx.doi.org/10.1016/j.cbpa.2016.05.011.
11. Nikel PI, Chavarría M, Fuhrer T, Sauer U, de Lorenzo V. 2015. Pseu-domonas putida KT2440 strain metabolizes glucose through a cycleformed by enzymes of the Entner-Doudoroff, Embden-Meyerhof-Parnas,and pentose phosphate pathways. J Biol Chem 290:25920 –25932.http://dx.doi.org/10.1074/jbc.M115.687749.
12. Chavarría M, Kleijn RJ, Sauer U, Pflüger-Grau K, de Lorenzo V. 2012.Regulatory tasks of the phosphoenolpyruvate-phosphotransferase sys-tem of Pseudomonas putida in central carbon metabolism. mBio3:e00028-12. http://dx.doi.org/10.1128/mBio.00028-12.
13. Nikel PI, Martínez-García E, de Lorenzo V. 2014. Biotechnologicaldomestication of pseudomonads using synthetic biology. Nat Rev Mi-crobiol 12:368 –379. http://dx.doi.org/10.1038/nrmicro3253.
14. Kornberg HL. 2001. Routes for fructose utilization by Escherichia coli. JMol Microbiol Biotechnol 3:355–359.
15. Shimizu K. 2016. Metabolic regulation and coordination of the metab-olism in bacteria in response to a variety of growth conditions. AdvBiochem Eng Biotechnol 155:1–54. http://dx.doi.org/10.1007/10_2015_320.
16. Kochanowski K, Volkmer B, Gerosa L, Haverkorn van Rijsewijk BR,Schmidt A, Heinemann M. 2013. Functioning of a metabolic flux sensorin Escherichia coli. Proc Natl Acad Sci USA 110:1130 –1135. http://dx.doi.org/10.1073/pnas.1202582110.
17. Shimada T, Yamamoto K, Ishihama A. 2011. Novel members of the Craregulon involved in carbon metabolism in Escherichia coli. J Bacteriol193:649 – 659. http://dx.doi.org/10.1128/JB.01214-10.
18. Keseler IM, Collado-Vides J, Santos-Zavaleta A, Peralta-Gil M, Gama-Castro S, Muñiz-Rascado L, Bonavides-Martinez C, Paley S, Krum-menacker M, Altman T, Kaipa P, Spaulding A, Pacheco J, Laten-dresse M, Fulcher C, Sarker M, Shearer AG, Mackie A, Paulsen I,Gunsalus RP, Karp PD. 2011. EcoCyc: a comprehensive database ofEscherichia coli biology. Nucleic Acids Res 39:D583–D590. http://dx.doi.org/10.1093/nar/gkq1143.
19. Belda E, van Heck RGA, López-Sánchez MJ, Cruveiller S, Barbe V,Fraser C, Klenk HP, Petersen J, Morgat A, Nikel PI, Vallenet D, RouyZ, Sekowska A, Martins dos Santos VAP, de Lorenzo V, Danchin A,Médigue C. 2016. The revisited genome of Pseudomonas putida KT2440enlightens its value as a robust metabolic chassis. Environ Microbiol18:3403–3424. http://dx.doi.org/10.1111/1462-2920.13230.
20. Nelson KE, Weinel C, Paulsen IT, Dodson RJ, Hilbert H, Martins dosSantos VAP, Fouts DE, Gill SR, Pop M, Holmes M, Brinkac L, BeananM, DeBoy RT, Daugherty S, Kolonay J, Madupu R, Nelson W, WhiteO, Peterson J, Khouri H, Hance I, Chris Lee P, Holtzapple E, ScanlanD, Tran K, Moazzez A, Utterback T, Rizzo M, Lee K, Kosack D, MoestlD, Wedler H, Lauber J, Stjepandic D, Hoheisel J, Straetz M, Heim S,Kiewitz C, Eisen JA, Timmis KN, Düsterhöft A, Tümmler B, Fraser CM.2002. Complete genome sequence and comparative analysis of themetabolically versatile Pseudomonas putida KT2440. Environ Microbiol4:799 – 808. http://dx.doi.org/10.1046/j.1462-2920.2002.00366.x.
21. Chavarría M, Durante-Rodríguez G, Krell T, Santiago C, Brezovsky J,Damborsky J, de Lorenzo V. 2014. Fructose 1-phosphate is the one andonly physiological effector of the Cra (FruR) regulator of Pseudomonas
putida . FEBS Open Bio 4:377–386. http://dx.doi.org/10.1016/j.fob.2014.03.013.
22. Chavarría M, Santiago C, Platero R, Krell T, Casasnovas JM, deLorenzo V. 2011. Fructose 1-phosphate is the preferred effector of themetabolic regulator Cra of Pseudomonas putida. J Biol Chem 286:9351–9359. http://dx.doi.org/10.1074/jbc.M110.187583.
23. Shimada T, Fujita N, Maeda M, Ishihama A. 2005. Systematic searchfor the Cra-binding promoters using genomic SELEX system. Genes Cells10:907–918. http://dx.doi.org/10.1111/j.1365-2443.2005.00888.x.
24. Chubukov V, Gerosa L, Kochanowski K, Sauer U. 2014. Coordinationof microbial metabolism. Nat Rev Microbiol 12:327–340. http://dx.doi.org/10.1038/nrmicro3238.
25. Ramseier TM. 1996. Cra and the control of carbon flux via metabolicpathways. Res Microbiol 147:489 – 493. http://dx.doi.org/10.1016/0923-2508(96)84003-4.
26. Zhang Z, Aboulwafa M, Saier MH. 2014. Regulation of crp geneexpression by the catabolite repressor/activator, Cra, in Escherichia coli.J Mol Microbiol Biotechnol 24:135–141. http://dx.doi.org/10.1159/000362722.
27. Yao R, Hirose Y, Sarkar D, Nakahigashi K, Ye Q, Shimizu K. 2011.Catabolic regulation analysis of Escherichia coli and its crp, mlc, mgsA, pgiand ptsG mutants. Microb Cell Fact 10:67. http://dx.doi.org/10.1186/1475-2859-10-67.
28. Lemuth K, Hardiman T, Winter S, Pfeiffer D, Keller MA, Lange S,Reuss M, Schmid RD, Siemann-Herzberg M. 2008. Global transcriptionand metabolic flux analysis of Escherichia coli in glucose-limited fed-batch cultivations. Appl Environ Microbiol 74:7002–7015. http://dx.doi.org/10.1128/AEM.01327-08.
29. Sarkar D, Siddiquee KA, Araúzo-Bravo MJ, Oba T, Shimizu K. 2008.Effect of cra gene knockout together with edd and iclR genes knockouton the metabolism in Escherichia coli. Arch Microbiol 190:559 –571.http://dx.doi.org/10.1007/s00203-008-0406-2.
30. Nanchen A, Schicker A, Revelles O, Sauer U. 2008. Cyclic AMP-dependent catabolite repression is the dominant control mechanism ofmetabolic fluxes under glucose limitation in Escherichia coli. J Bacteriol190:2323–2330. http://dx.doi.org/10.1128/JB.01353-07.
31. Perrenoud A, Sauer U. 2005. Impact of global transcriptional regulationby ArcA, ArcB, Cra, Crp, Cya, Fnr, and Mlc on glucose catabolism inEscherichia coli. J Bacteriol 187:3171–3179. http://dx.doi.org/10.1128/JB.187.9.3171-3179.2005.
32. Ramseier TM, Bledig S, Michotey V, Feghali R, Saier MH. 1995. Theglobal regulatory protein FruR modulates the direction of carbon flow inEscherichia coli. Mol Microbiol 16:1157–1169. http://dx.doi.org/10.1111/j.1365-2958.1995.tb02339.x.
33. van Vliet AH. 2010. Next generation sequencing of microbialtranscriptomes: challenges and opportunities. FEMS Microbiol Lett 302:1–7. http://dx.doi.org/10.1111/j.1574-6968.2009.01767.x.
34. Kim J, Oliveros JC, Nikel PI, de Lorenzo V, Silva-Rocha R. 2013.Transcriptomic fingerprinting of Pseudomonas putida under alternativephysiological regimes. Environ Microbiol Rep 5:883– 891. http://dx.doi.org/10.1111/1758-2229.12090.
35. Nikel PI, Kim J, de Lorenzo V. 2014. Metabolic and regulatory rear-rangements underlying glycerol metabolism in Pseudomonas putidaKT2440. Environ Microbiol 16:239 –254. http://dx.doi.org/10.1111/1462-2920.12224.
36. Nikel PI, Chavarría M. 2016. Quantitative physiology approaches tounderstand and optimize reducing power availability in environmentalbacteria, p 39 –70. In McGenity TJ, Timmis KN, Nogales-Fernández B (ed),Hydrocarbon and lipid microbiology protocols. Synthetic and systemsbiology. Tools. Humana Press, Heidelberg, Germany. http://dx.doi.org/10.1007/8623_2015_84.
37. Clore GM, Venditti V. 2013. Structure, dynamics and biophysics of thec y t o p l a s m i c p r o t e i n - p r o t e i n c o m p l e x e s o f t h e b a c t e r i a lphosphoenolpyruvate:sugar phosphotransferase system. TrendsBiochem Sci 38:515–530. http://dx.doi.org/10.1016/j.tibs.2013.08.003.
38. Noor E, Eden E, Milo R, Alon U. 2010. Central carbon metabolism as aminimal biochemical walk between precursors for biomass and energy.Mol Cell 39:809 – 820. http://dx.doi.org/10.1016/j.molcel.2010.08.031.
39. Nikel PI, Romero-Campero FJ, Zeidman JA, Goñi-Moreno Á, deLorenzo V. 2015. The glycerol-dependent metabolic persistence ofPseudomonas putida KT2440 reflects the regulatory logic of the GlpRrepressor. mBio 6:e00340-15. http://dx.doi.org/10.1128/mBio.00340-15.
40. Green MR, Sambrook J. 2012. Molecular cloning: a laboratory manual,4th ed. Cold Spring Harbor Laboratory Press, Cold Spring Harbor, NY.
Chavarría et al.
Volume 1 Issue 6 e00154-16 msystems.asm.org 14
on May 30, 2018 by guest
http://msystem
s.asm.org/
Dow
nloaded from

41. Martínez-García E, Nikel PI, Aparicio T, de Lorenzo V. 2014. Pseu-domonas 2.0: genetic upgrading of P. putida KT2440 as an enhancedhost for heterologous gene expression. Microb Cell Fact 13:159. http://dx.doi.org/10.1186/s12934-014-0159-3.
42. Martínez-García E, Aparicio T, de Lorenzo V, Nikel PI. 2014. Newtransposon tools tailored for metabolic engineering of Gram-negativemicrobial cell factories. Front Bioeng Biotechnol 2:46. http://dx.doi.org/10.3389/fbioe.2014.00046.
43. Dalgaard P, Koutsoumanis K. 2001. Comparison of maximum specificgrowth rates and lag times estimated from absorbance and viable countdata by different mathematical models. J Microbiol Methods 43:183–196. http://dx.doi.org/10.1016/S0167-7012(00)00219-0.
44. Nikel PI, de Lorenzo V. 2013. Engineering an anaerobic metabolicregime in Pseudomonas putida KT2440 for the anoxic biodegradationof 1,3-dichloroprop-1-ene. Metab Eng 15:98 –112. http://dx.doi.org/10.1016/j.ymben.2012.09.006.
45. Nikel PI, de Lorenzo V. 2013. Implantation of unmarked regulatory andmetabolic modules in Gram-negative bacteria with specialised mini-transposon delivery vectors. J Biotechnol 163:143–154. http://dx.doi.org/10.1016/j.jbiotec.2012.05.002.
46. Nikel PI, Pérez-Pantoja D, de Lorenzo V. 2013. Why are chlorinatedpollutants so difficult to degrade aerobically? Redox stress limits 1,3-dichloroprop-1-ene metabolism by Pseudomonas pavonaceae. PhilosTrans R Soc Lond B Biol Sci 368:20120377. http://dx.doi.org/10.1098/rstb.2012.0377.
47. Winsor GL, Griffiths EJ, Lo R, Dhillon BK, Shay JA, Brinkman FS. 2016.Enhanced annotations and features for comparing thousands of Pseu-domonas genomes in the Pseudomonas genome database. Nucleic AcidsRes 44:D646 –D653. http://dx.doi.org/10.1093/nar/gkv1227.
48. Li R, Yu C, Li Y, Lam TW, Yiu SM, Kristiansen K, Wang J. 2009. SOAP2:an improved ultrafast tool for short read alignment. Bioinformatics25:1966 –1967. http://dx.doi.org/10.1093/bioinformatics/btp336.
49. Thorvaldsdóttir H, Robinson JT, Mesirov JP. 2013. Integrative genom-ics viewer (IGV): high-performance genomics data visualization andexploration. Brief Bioinform 14:178 –192. http://dx.doi.org/10.1093/bib/bbs017.
50. Audic S, Claverie JM. 1997. The significance of digital gene expressionprofiles. Genome Res 7:986 –995. http://dx.doi.org/10.1101/gr.7.10.986.
51. Benjamini Y, Drai D, Elmer G, Kafkafi N, Golani I. 2001. Controlling the
false discovery rate in behavior genetics research. Behav Brain Res125:279 –284. http://dx.doi.org/10.1016/S0166-4328(01)00297-2.
52. Lippolis JD, Brunelle BW, Reinhardt TA, Sacco RE, Thacker TC, LooftTP, Casey TA. 2016. Differential gene expression of three mastitis-causing Escherichia coli strains grown under planktonic, swimming, andswarming culture conditions. mSystems 1:e00064-16. http://dx.doi.org/10.1128/mSystems.00064-16.
53. Grote A, Klein J, Retter I, Haddad I, Behling S, Bunk B, Biegler I,Yarmolinetz S, Jahn D, Münch R. 2009. PRODORIC (release 2009): adatabase and tool platform for the analysis of gene regulation in pro-karyotes. Nucleic Acids Res 37:D61–D65. http://dx.doi.org/10.1093/nar/gkn837.
54. Münch R, Hiller K, Barg H, Heldt D, Linz S, Wingender E, Jahn D.2003. PRODORIC: prokaryotic database of gene regulation. Nucleic AcidsRes 31:266 –269. http://dx.doi.org/10.1093/nar/gkg037.
55. Münch R, Hiller K, Grote A, Scheer M, Klein J, Schobert M, Jahn D.2005. Virtual footprint and PRODORIC: an integrative framework forregulon prediction in prokaryotes. Bioinformatics 21:4187– 4189. http://dx.doi.org/10.1093/bioinformatics/bti635.
56. Bradford MM. 1976. A rapid and sensitive method for the quantitationof microgram quantities of protein utilizing the principle of protein-dyebinding. Anal Biochem 72:248 –254. http://dx.doi.org/10.1016/0003-2697(76)90527-3.
57. Ruiz JA, Fernández RO, Nikel PI, Méndez BS, Pettinari MJ. 2006. Dye(arc) mutants: insights into an unexplained phenotype and its suppres-sion by the synthesis of poly(3-hydroxybutyrate) in Escherichia coli re-combinants. FEMS Microbiol Lett 258:55– 60. http://dx.doi.org/10.1111/j.1574-6968.2006.00196.x.
58. Tiwari NP, Campbell JJ. 1969. Enzymatic control of the metabolicactivity of Pseudomonas aeruginosa grown in glucose or succinate me-dia. Biochim Biophys Acta 192:395– 401. http://dx.doi.org/10.1016/0304-4165(69)90388-2.
59. Dublanche Y, Michalodimitrakis K, Kümmerer N, Foglierini M, Ser-rano L. 2006. Noise in transcription negative feedback loops: simulationand experimental analysis. Mol Syst Biol 2:41. http://dx.doi.org/10.1038/msb4100081.
60. Miró-Bueno JM, Rodríguez-Patón A. 2011. A simple negative interac-tion in the positive transcriptional feedback of a single gene is sufficientto produce reliable oscillations. PLoS One 6:e27414. http://dx.doi.org/10.1371/journal.pone.0027414.
Metabolic Widget for Sugar Consumption
Volume 1 Issue 6 e00154-16 msystems.asm.org 15
on May 30, 2018 by guest
http://msystem
s.asm.org/
Dow
nloaded from