Embed Size (px)
Citation preview

A Meeting of the Waco
City Council Budget & Audit Committee or
A Meeting of the City Council, Acting as
City Council Budget & Audit Committee
Regular Meeting
Public Notice
Tuesday, February 9, 2021 1:30 PM 3rd Floor Conference Room City Hall 300 Austin Avenue, Waco, TX 76701
City Council Budget & Audit Committee Page 1 Printed
VIDEOCONFERENCE: In accordance with social distancing guidelines, the City Council Budget and
Audit Committee meeting will be closed to the public attending in person. Council/Committee members
will attend remotely by videoconference in accordance with Governor Greg Abbott’s emergency orders
related to the COVID-19 pandemic and the Texas Open Meetings Act.
The public may register to view the meeting live at:
https://wacotx.zoomgov.com/webinar/register/WN_lnFD5EtmSrm4VVLj6CD0IA
Members of the public who wish to submit written comments must submit their comments on-line by
emailing [email protected] or by calling 254-750-5750 for staff assistance. Comments and
registrations must be received no later than 11:00 am before the meeting on February 9, 2021.
AGENDA
I. Call to Order
II. Minute Approval
1. Budget & Audit Committee – Regular Meeting – December 8, 2020
III. Discussions
1. Discussion of Fiscal Year 2019-20 Financial Audit with Jaynes, Reitmeier, Boyd and Therrell, P.C., and Staff.
2. Discussion of Employee Health Insurance Plan.
3. Discussion of requests for Resolutions of Support for proposed projects applying for inclusion in the Low Income Housing Tax Credit Program administered by the Texas Department of Housing and Community Affairs.
IV. Request for Future Agenda Items and Next Meeting Date
The Committee/City Council may go into Executive Session on any item listed on the Agenda in accordance with
Chapter 551 of the Government Code, specifically including Sec. 551.071(2) (attorney-client privilege/relationship).
_______________________________
Bradley Ford, City Manager
It is the opinion of the City Attorney’s Office that this agenda complies with the requirements of Chapter 551 of the Texas
Government Code.
_______________________________
Jennifer Richie, City Attorney
DocuSign Envelope ID: 13657A76-9A92-48CF-8FA7-F8E6D9DEB9BE

Regular Meeting Tuesday, February 9, 2021 1:30 PM
City Council Budget & Audit Committee Page 2 Printed
_______________________________
Esmeralda Hudson, City Secretary
Note: Persons with disabilities who wish to participate in this meeting and who may need auxiliary services should
contact the City Secretary’s Office, at (254) 750-5750 at least twenty-four hours before this meeting so that
appropriate arrangements can be made.
DocuSign Envelope ID: 13657A76-9A92-48CF-8FA7-F8E6D9DEB9BE
I hereby certify that this notice was posted at Waco City Hall on the 5th of February, 2021 at 4:45 pm.

A Meeting of the
City Council acting as the
Budget & Audit Committee
Video Conference
Summary Notes
Tuesday, December 8, 2020 1:30 PM – 3:34 PM City Hall - 3rd Floor Conference Room 300 Austin Ave, Waco, TX 76701
City Council Budget & Audit Committee Page 1 Printed
I. Call to Order
Mayor Meek called meeting to order at 1:30 p.m.
Council Members present remotely via ZoomGov: Mayor Dillon Meek, Mayor Pro Tem Hector Sabido, and Council Members Andrea Barefield, Josh Borderud, Kelly Palmer, and Jim Holmes.
II. Minutes Approval
Budget & Audit Committee - Regular Meeting – November 10, 2020 Minutes were approved as presented. (1:42)
III. Discussions
1. Discussion of the Fiscal Year 2019-20 Financial Audit with Jaynes, Reitmeier, Boyd, and Therrell, P.C. (JRBT) and staff. Paul Cain, Assistant City Manager, introduced the discussion about the financial audit that is required by the City of Waco Charter. JRBT has served as City Auditor since 2005. Diana Ward, Audit Partner, JRBT, provided an update on the audit process including the single-audit status, financial audit and the remaining timeline. The engagement team includes Diana Ward, audit partner, Kristy Davis, audit concurring review partner, and Katie King, Audit Senior Manager. The presentation highlighted:
• Overview of the audit process by JRBT of the city’s financial statements. • The audit provides a reasonable assurance that the financial statements are free of material
misstatements in large areas. • The Single Audit is required when the City has a total federal assistance of more than
$750,000. • Major Programs that are being tested by single audit are the U.S Department of
Transportation Airport Improvements Program (CARES & Non-CARES funding), U.S. Department of Treasury CARES Act Coronavirus Relief Fund, and the Texas Office of the Governor Criminal Justice Division, Texas Anti-Gang Grant (State Funding.)
• The audit work is substantially complete. • The financial audit status of the Comprehensive Annual Financial Report (CAFR) is
organized by opinion units. • Component units that City is responsible for under accounting standards includes the Waco
Health Faculties Development Corporation and the Baylor Stadium Authority. • The audit also reviews the internal controls to test the design an operating effectiveness and
has substantial controls. • General Information Technology controls for computer systems that are over all
applications used by the entire City are being reviewed by JRBT subcontractor, Eric McMullen of the McMullen Investment Group. (13:38)

Regular Meeting Tuesday, December 8, 2020
City Council Budget & Audit Committee Page 2 Printed
• Currently in the audit no deficiencies have been identified. • The review of the CAFR is in progress. • The significant transaction impact related to the WMARSS agreement termination will be
include in the review.
Discussion included the previous deficiencies related to the conversion from SunGard to Munis that caused delays in interim financial reporting to the Budget and Audit Committee, which is considered a key control. In addition, the bank reconciliation process was also identified as a deficiency in a previous audit and the Budget and Finance team has worked through the issues to resolve resulting in no deficiencies in the current audit. Remaining field work timing includes:
• CAFR Draft presentation at the January 2, 2021 Budget and Audit Committee meeting • Issue Date of the Final Reports on January 22, 2021 • Presentation on the Audit to Council on February 16, 2021
2. Discussion of the 4th Quarter Fiscal Year 2019-20 Financials and Fiscal Year 2019-20 Year
End Budget. Paul Diaz, Budget Manager/Interim Director of the OMB, made the presentation. The presentation is on file at the City Secretary’s Office and provided an overview of the Fiscal Year 2020 financial highlights. The figures presented are still being reviewed by the independent audit team. Highlights included:
• City Staff’s cost management response to COIVD resulting in $12 million in savings across the City funds.
• Adjustments from the general fund to support other funds were made in anticipation of a negative impact due to the COVID response.
• The impact to the general fund included decreases to the airport fund, transit fund, equipment and replacement fund, and an increase to the Zoo fund.
• A review of the major funds of the city budget were also provided. The funds discussed included the general, water, wastewater, WMARSS, Solid Waste Convention Visitors Bureau (CVB) Cameron Park Zoo, Cottonwood Creek and Texas Ranger Hall of Fame.
• The current general fund year-end position will add $2.94 M to the fund balance. • Final Cares Act reimbursement will impact fund balance. • Sales Tax finished at $41 million, which was higher than revised budget by 9.3% • Enterprise fund activity is returning to pre-COVID levels for zoo admission and golf
rounds. • City staff will continue to monitor the impact of COVID on Hotel Occupancy Tax (HOT)
revenue which finished the fiscal year at 35.9% below budget.
Staff was asked for the information related to year over year (delta) for the general fund and the impact of the $2.94 million year end position on the fund balance. Paul Cain explained that budget process and the effect of the WMARSS agreement termination which was based on inaccurate estimates. The new estimates for WMARSS operations are based on actual meter flows. The city has

Regular Meeting Tuesday, December 8, 2020
City Council Budget & Audit Committee Page 3 Printed
received $1.5 million of CARES funding and the application for additional COVID expense reimbursements is underway. Staff was asked if there had been consideration by management to support City staff who responded to COVID by taking on additional roles and significant responsibilities. Bradley Ford, City Manager, explained that the Management team has been working towards providing a mid-year increases for employees. Conditions for providing a mid-year compensation increase are based on solid revenue baseline and increase and identification of some long-term savings.
3. Discussion of General Fund Reserves including restricted, committed, assigned, and unassigned Fund balance. Janice Andrews, Chief Finance Officer, provided an overview of the general fund reserves. The presentation is on file at the City Secretary’s Office and includes an overview of the classifications under GASB 54 of the fund balance. The classifications include the non-spendable, restricted committed, assigned and unassigned funding. The general fund includes an additional $3.6 million for the audit to include the economic development and municipal information Cable PEG 1% fee funds. Over $800,000 is committed to the economic development. The presentation included a breakdown of the assigned projects. The assigned categories are capital improvements economic development, public safety, culture and recreation, public works, subsequent year’s budget and encumbrances. Highlights included:
• Capital Improvements proposed assignments that historically has the largest allocations. • Capital Projects Reserve Fund is funding that can be used for future projects based on
Council priorities ($7,079,345). • Economic Development Category includes Riverfront, Prosper Waco, Demolition Needs,
equitable economic development, and a STEAM center. The proposed assignments must be approved by Council resolution and projects will still have to go through the appropriation process.
• The Capital Projects Revenue Fund (CPRF) has a total proposed funding allocation of $10.3 million with the $3.2 million transfer in the FY 20-21 budget and the $7.1 assigned in Capital Improvements (to be transferred to CPRF by future Council consideration.)
• Budget amendments are needed to utilize the allocated funding for planned projects. • Council recently approved a fund balance policy of 28% of budgeted revenues. • Unassigned Fund Balance is critical to having a reserve fund and measured by the city
financial policy. • The fiscal year is closing with a 33% fund balance of revenues and gets the City close to
exceeding Moody’s 30% fund balance requirement. This positions the City in a favorable position when moving to the proposed debt bond issuance.
• The City Council will consider approval of the proposed assignments at the January Council meeting. (1:06:39)
Discussion included the efforts by staff and Council to increase the fund balance reserve policy from 18% of revenue to 28% over the past several years and to accomplishment of closing the fiscal year with a 33% fund balance. Council will work with staff to strategically prioritize any excess and maintain a healthy fund balance. Staff explained that the $2.2 million that is being proposed to be

Regular Meeting Tuesday, December 8, 2020
City Council Budget & Audit Committee Page 4 Printed
moved from assigned to unassigned as well as designated a 33% fund balance is expected to maintain a 30 % fund balance through 2024, assuming a modest growth in budgeted revenues. (1:12) Due to cost management the budget includes over $10 million in the Capital Reserve Fund to be considered for future use as projects are identified. Staff will continue to move projected capital project funding to a dedicated fund and out of the fund balance assignments maintain a 30% fund balance which will facilitate discussion with the City’s financial advisor and financial rating agencies. Council would like for the public to be aware City’s budget policy and need for a healthy fund balance.
4. Discussion and consideration of the Fiscal Year 2020-2021 Proposed Capital Improvements Program (CIP) Projects and Financing Plan. Paul Cain introduced the discussion and explained that property values are an important part of the CIP and debt sales. Paul Diaz presented a summary of the proposed CIP and how they will be financed. The CIP budget process began in September 2020 and a discussion on the proposed CIP was held at the October 2020 Budget and Audit Committee meeting. Spreadsheets were provided in the packet and on file at the City Secretary’s Office. The proposed 2020-2021 CIP is primarily focused in improving the street network and parks system. Approximately $31 million is allocated for road repair and a little over $1 million is being proposed for parks improvements. Paul Cain provided an overview on the pavement condition index (PCI) and related funding levels. Discussion included an overview of initial draft estimates of $35 million to move the City streets PCI to a PCI index of 70. The PCI is an index that rates all City streets based on pavement condition. The PCI is affected by natural degradation of streets and maintenance over time. PCI changes daily. Council recommended that new council members review the presentation made by Jim Reed, Streets CIP Program Manager, about the City’s PCI. Staff will schedule a time for new Council members to visit with Jim Reed. Council discussed that expense to maintain and improve the PCI index. (1:40) The PCI presentation included a slide on the pavement management program and scenarios comparisons and highlighted that in order to reach a PCI index 70 by FY 2030, the budget would need to include $41.4 million a year to address street repairs. The proposed budget now includes that $41.4l million. The current PCI index is 49.61. Discussion included how to maintain a PCI of 70 index it is achieved and staff will be reviewing future operation funding need to preserve street conditions. Sidewalks improvements are not included in this funding; however, the Streets department continues to identify funding options to contribute to sidewalk infrastructure.
5. Discussion of the 2021 Bond Issue and City’s Debt Portfolio and Masterson Advisors LLC, and report on the financial status of existing Bond Funds. (1:39:40) Paul Cain introduced the discussion and explained the role the City’s financial advisory firm, which is to provide services related to the structure and sale relating to securities and debt and to assist insurers in trying to obtain the lowest financing cost. Financial advisors are regulated by the Security Exchange Commission and the Municipal Securities Rule Making Board. Drew Masterson, City Financial Advisor, made presentation. Drew Masterton has served as the City’s financial advisory for over 30 years.

Regular Meeting Tuesday, December 8, 2020
City Council Budget & Audit Committee Page 5 Printed
The presentation is on file at the City’s Secretary Office and included an overview of the Bond Buyer 20 Bond General Obligation Index indicating a rates are at a near record low. The main tools cities have in Texas for debt issuance include general obligations bonds, certificates of obligations and utility revenue bonds. The City has used certificates of obligations (CO) over the last 10 years. Utility funds would have to have major rate increases if CO were not an allowable tool for debt issuance. The presentation also included a summary of proposed CO pro-forma debt services and summary of projects. Total project fund amount would be $80,030,400 with a total debt service amount of $98,183,261. The City is also planning to refinance $22,440,000 million is existing bond with a total expected savings of about $2,648,995 a year. (1:52:00) Additional presentation highlights included:
• The outstanding debt service rates. • Rating considerations and Waco’s strong financial position. • The City has a current Aa1 rating by Moody and AA+ rating by S&P. • Economic Development growth is anticipated to bolster the local economy. • Notice of Intent that the Council will be considering will not exceed $81 million. • The timeline for the issuance would work to close the issuance in March 2021.
Discussion included the issuance of the CO and refinancing of existing bonds and challenges that continue with operating two different financial systems.
Staff was asked to schedule a future B&A agenda item to review the challenges presented by the rating agencies.
IV. Request for Future Agenda Items and Next Meeting Date Next meeting is scheduled for January 12, 2021 at 1:30 p.m.
The meeting adjourned at 3:34 p.m. ___________________________ _____________________ Esmeralda Hudson, City Secretary Dillon Meek, Mayor Approved on: _______________


Comprehensive Annual Financial Report
of the
City of Waco, Texas
Prepared by the
Finance Department Year Ended September 30, 2020
DRAFT

DRAFT

City of Waco, Texas
Comprehensive Annual Financial Report Year Ended September 30, 2020
Elected Officials as of November 2020
MAYOR
Dillon Meek
CITY COUNCIL
Hector Sabido, Mayor Pro Tem Andrea Barefield
Josh Borderud Kelly Palmer Jim Holmes
CITY MANAGER
Bradley Ford
DEPUTY CITY MANAGER
Deidra Emerson
ASSISTANT CITY MANAGERS
Paul Cain Ryan Holt
Galen Price
CHIEF FINANCIAL OFFICER
Janice Andrews, CPA
DRAFT

DRAFT

i
City of Waco, Texas
Table of Contents
September 30, 2020
Page INTRODUCTORY SECTION Table of Contents i Letter of Transmittal xi Organizational Chart xviii Certificate of Achievement xix FINANCIAL SECTION Independent Auditor’s Report 3 - 5 Management’s Discussion and Analysis 8 - 20 Basic Financial Statements Government-wide Financial Statements Statement of Net Position 23 Statement of Activities 24 - 25 Fund Financial Statements Balance Sheet - Governmental Funds 26 Reconciliation of the Balance Sheet to the Statement of Net Position 27 Statement of Revenues, Expenditures and Changes in Fund Balances – Governmental Funds 28 Reconciliation of the Statement of Revenues, Expenditures and Changes in Fund Balances of Governmental Funds to the Statement of Activities 29 Statement of Revenues, Expenditures and Changes in Fund Balance – Budget and Actual – General Fund 30 - 38 Statement of Net Position – Proprietary Funds 40
DRAFT
ii
City of Waco, Texas
Table of Contents (Continued)
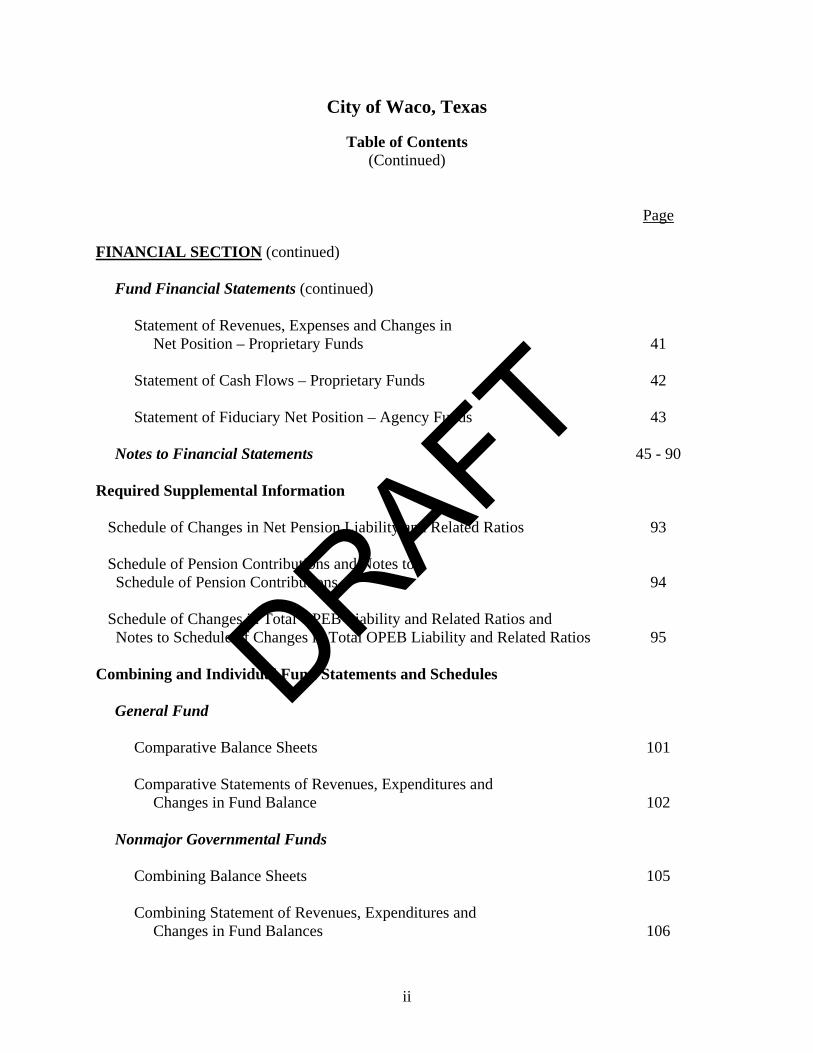
Page FINANCIAL SECTION (continued) Fund Financial Statements (continued) Statement of Revenues, Expenses and Changes in Net Position – Proprietary Funds 41 Statement of Cash Flows – Proprietary Funds 42 Statement of Fiduciary Net Position – Agency Funds 43 Notes to Financial Statements 45 - 90 Required Supplemental Information Schedule of Changes in Net Pension Liability and Related Ratios 93 Schedule of Pension Contributions and Notes to Schedule of Pension Contributions 94 Schedule of Changes in Total OPEB Liability and Related Ratios and Notes to Schedule of Changes in Total OPEB Liability and Related Ratios 95 Combining and Individual Fund Statements and Schedules General Fund Comparative Balance Sheets 101 Comparative Statements of Revenues, Expenditures and Changes in Fund Balance 102 Nonmajor Governmental Funds Combining Balance Sheets 105 Combining Statement of Revenues, Expenditures and Changes in Fund Balances 106
DRAFT

iii
City of Waco, Texas
Table of Contents (Continued)
Page FINANCIAL SECTION (continued) Combining and Individual Fund Statements and Schedules (continued) Nonmajor Special Revenue Funds Combining Balance Sheet 108 - 109 Combining Statement of Revenues, Expenditures and Changes in Fund Balances 110 - 111 Comparative Balance Sheets – Tax Increment Fund No. 1 114 Comparative Statements of Revenues, Expenditures and Changes in Fund Balance – Tax Increment Fund No. 1 115 Comparative Balance Sheets – Tax Increment Fund No. 2 118 Comparative Statements of Revenues, Expenditures and Changes in Fund Balance – Tax Increment Fund No. 2 119 Comparative Balance Sheets – Tax Increment Fund No. 3 122 Comparative Statements of Revenues, Expenditures and Changes in Fund Balance – Tax Increment Fund No. 3 123 Comparative Balance Sheets – Health Programs Fund 126 Comparative Statements of Revenues, Expenditures and Changes in Fund Balance – Health Programs Fund 127 Schedule of Revenues, Expenditures and Changes in Fund Balance – Budget and Actual – Health Programs Fund 128 - 130 Sub-Combining Balance Sheet – Grant Funds 132 - 137 Sub-Combining Schedule of Revenues, Expenditures and Changes in Fund Balances – Grant Funds 138 - 143 Comparative Balance Sheets – Waco Public Improvement District No. 1 Fund 146
DRAFT

iv
City of Waco, Texas
Table of Contents (Continued)
Page FINANCIAL SECTION (continued) Combining and Individual Fund Statements and Schedules (continued) Nonmajor Special Revenue Funds (continued) Comparative Statements of Revenues, Expenditures and Changes in Fund Balance – Waco Public Improvement District No. 1 Fund 147 Comparative Balance Sheets – Abandoned Motor Vehicle Fund 150 Comparative Statements of Revenues, Expenditures and Changes in Fund Balance – Abandoned Motor Vehicle Fund 151 Comparative Balance Sheets – Police Forfeitures Fund 154 Comparative Statements of Revenues, Expenditures and Changes in Fund Balance – Police Forfeitures Fund 155 Comparative Balance Sheets – Court Security Fund 158 Comparative Statements of Revenues, Expenditures and Changes in Fund Balance – Court Security Fund 159 Comparative Balance Sheets – Court Technology Fund 162 Comparative Statements of Revenues, Expenditures and Changes in Fund Balance – Court Technology Fund 163 Comparative Balance Sheets – Hamilton Memorial Fund 166 Comparative Statements of Revenues, Expenditures and Changes in Fund Balance – Hamilton Memorial Fund 167 Comparative Balance Sheets – Miss Nellie’s Park Maintenance Fund 170 Comparative Statements of Revenues, Expenditures and Changes In Fund Balance – Miss Nellie’s Park Maintenance Fund 171
DRAFT

v
City of Waco, Texas
Table of Contents (Continued)
Page FINANCIAL SECTION (continued) Combining and Individual Fund Statements and Schedules (continued) Nonmajor Debt Service Funds Combining Balance Sheet 174 Combining Statement of Revenues, Expenditures and Changes in Fund Balances 175 Schedule of Revenues, Expenditures and Changes in Fund Balance – Budget and Actual – General Obligation Debt Fund 176 Nonmajor Capital Projects Funds Combining Balance Sheet 178 - 179 Combining Statement of Revenues, Expenditures and Changes in Fund Balances 180 - 181 Nonmajor Permanent Funds Combining Balance Sheet 184 Combining Statement of Revenues, Expenditures and Changes in Fund Balances 185 Major Enterprise Funds Comparative Statements of Net Position – Water Fund 190 - 191 Comparative Statements of Revenues, Expenses and Changes in Net Position – Water Fund 192 Comparative Statements of Cash Flows – Water Fund 193 Comparative Statements of Net Position – Wastewater Fund 196 - 197
DRAFT
vi
City of Waco, Texas
Table of Contents (Continued)
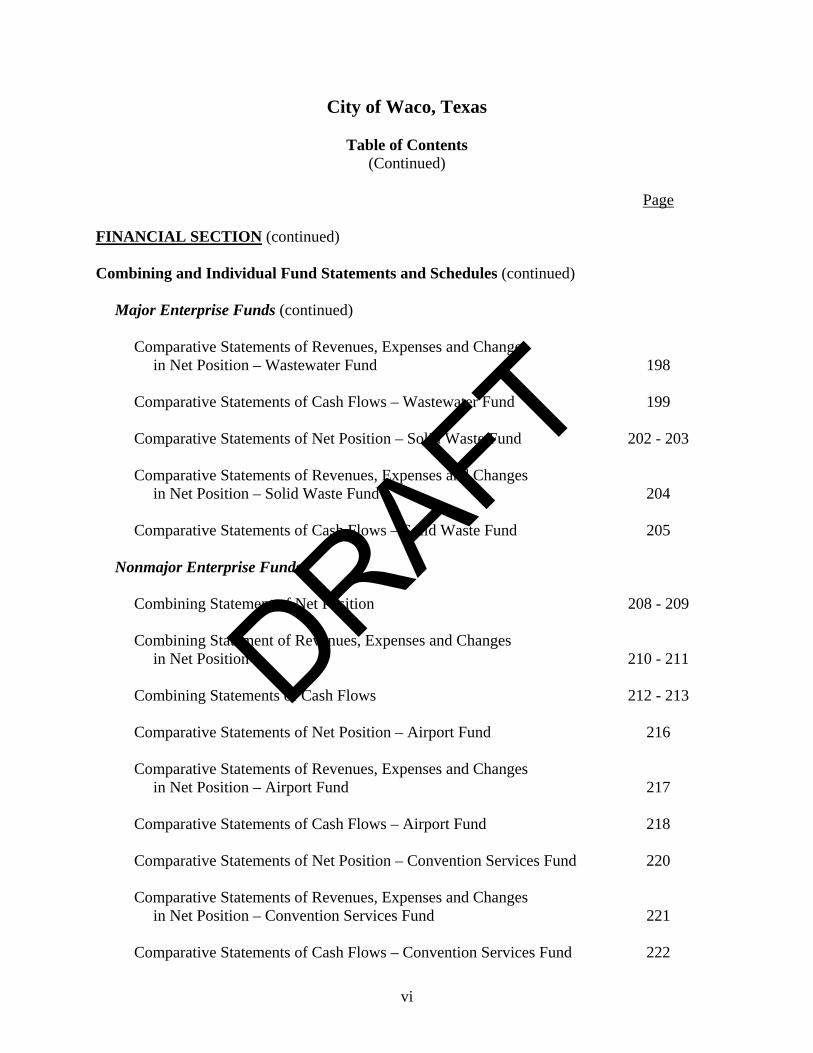
Page FINANCIAL SECTION (continued) Combining and Individual Fund Statements and Schedules (continued) Major Enterprise Funds (continued) Comparative Statements of Revenues, Expenses and Changes in Net Position – Wastewater Fund 198 Comparative Statements of Cash Flows – Wastewater Fund 199 Comparative Statements of Net Position – Solid Waste Fund 202 - 203 Comparative Statements of Revenues, Expenses and Changes in Net Position – Solid Waste Fund 204 Comparative Statements of Cash Flows – Solid Waste Fund 205 Nonmajor Enterprise Funds Combining Statement of Net Position 208 - 209 Combining Statement of Revenues, Expenses and Changes in Net Position 210 - 211 Combining Statements of Cash Flows 212 - 213 Comparative Statements of Net Position – Airport Fund 216 Comparative Statements of Revenues, Expenses and Changes in Net Position – Airport Fund 217 Comparative Statements of Cash Flows – Airport Fund 218 Comparative Statements of Net Position – Convention Services Fund 220 Comparative Statements of Revenues, Expenses and Changes in Net Position – Convention Services Fund 221 Comparative Statements of Cash Flows – Convention Services Fund 222
DRAFT

vii
City of Waco, Texas
Table of Contents (Continued)
Page FINANCIAL SECTION (continued) Combining and Individual Fund Statements and Schedules (continued) Nonmajor Enterprise Funds (continued) Comparative Statements of Net Position – Ranger Hall of Fame Fund 224 Comparative Statements of Revenues, Expenses and Changes in Net Position – Ranger Hall of Fame Fund 225 Comparative Statements of Cash Flows – Ranger Hall of Fame Fund 226 Comparative Statements of Net Position – Cameron Park Zoo Fund 228 Comparative Statements of Revenues, Expenses and Changes in Fund Net Position – Cameron Park Zoo Fund 229 Comparative Statements of Cash Flows – Cameron Park Zoo Fund 230 Comparative Statements of Net Position – Transit Services Fund 232 Comparative Statements of Revenues, Expenses and Changes in Net Position – Transit Services Fund 233 Comparative Statements of Cash Flows – Transit Services Fund 234 Comparative Statements of Net Position – Cottonwood Creek Golf Course Fund 236 Comparative Statements of Revenues, Expenses and Changes in Net Position – Cottonwood Creek Golf Course Fund 237 Comparative Statements of Cash Flows – Cottonwood Creek Golf Course Fund 238 Internal Service Funds Combining Statement of Net Position 240
DRAFT

viii
City of Waco, Texas
Table of Contents (Continued)
Page FINANCIAL SECTION (continued) Combining and Individual Fund Statements and Schedules (continued) Internal Service Funds (continued) Combining Statement of Revenues, Expenses and Changes in Net Position 241 Combining Statement of Cash Flows 242 Comparative Statements of Net Position – Insurance Fund 244 Comparative Statements of Revenues, Expenses and Changes in Net Position – Insurance Fund 245 Comparative Statements of Cash Flows – Insurance Fund 246 Comparative Statements of Net Position – Health Insurance Fund 248 Comparative Statements of Revenues, Expenses and Changes in Net Position – Health Insurance Fund 249 Comparative Statements of Cash Flows – Health Insurance Fund 250 Comparative Statements of Net Position – Engineering Fund 252 Comparative Statements of Revenues, Expenses and Changes in Net Position – Engineering Fund 253 Comparative Statements of Cash Flows – Engineering Fund 254 Comparative Statements of Net Position – Fleet Services Fund 256 Comparative Statements of Revenues, Expenses and Changes in Net Position – Fleet Services Fund 257 Comparative Statements of Cash Flows – Fleet Services Fund 258
DRAFT

ix
City of Waco, Texas
Table of Contents (Continued)
Table Page
FINANCIAL SECTION (continued) Combining and Individual Fund Statements and Schedules (continued) Agency Funds Combining Statement of Changes in Fiduciary Net Position – Agency Fund 260 STATISTICAL SECTION Net Position by Component I 262 - 263 Changes in Net Position II 264 - 267 Fund Balances of Governmental Funds III 268 - 271 Changes in Fund Balances of Governmental Funds IV 272 - 273 Assessed Value and Estimated Actual Value of Taxable Property V 274 - 275 Property Tax Rates – Direct and Overlapping Governments VI 276 - 277 Principal Property Taxpayers VII 278 - 279 Property Tax Levies and Collections VIII 280 - 281 Ratio of Outstanding Debt by Type IX 282 - 283 Ratio of General Bonded Debt Outstanding X 284 Direct and Overlapping Governmental Activities Debt XI 285 Pledged-Revenue Coverage XII 286 - 287 Demographic and Economic Statistics XIII 289 Principal Employers XIV 290 - 291
DRAFT

x
City of Waco, Texas
Table of Contents (Continued)
Table Page
STATISTICAL SECTION (continued) Full-Time Equivalent City Government Employees by Function XV 292 - 293 Operating Indicators by Function XVI 294 - 295 Capital Asset Statistics by Function XVII 296 - 297
DRAFT

DRAFT

xviii
DRAFT

xix
DRAFT

xx
DRAFT

1
Financial Section
DRAFT

2
DRAFT

3
INDEPENDENT AUDITOR’S REPORT
To the Honorable Mayor and Members of the City Council City of Waco, Texas Report on Financial Statements We have audited the accompanying financial statements of the governmental activities, the business-type activities, each major fund, and the aggregate discretely presented component units and remaining fund information of the City of Waco, Texas, as of and for the year ended September 30, 2020, and the related notes to the financial statements, which collectively comprise the City’s basic financial statements as listed in the table of contents.
Management’s Responsibility for the Financial Statements
Management is responsible for the preparation and fair presentation of these financial statements in accordance with accounting principles generally accepted in the United States of America; this includes the design, implementation, and maintenance of internal control relevant to the preparation and fair presentation of financial statements that are free from material misstatement, whether due to fraud or error.
Auditor’s Responsibility
Our responsibility is to express opinions on these financial statements based on our audit. We conducted our audit in accordance with auditing standards generally accepted in the United States of America and the standards applicable to financial audits contained in Government Auditing Standards, issued by the Comptroller General of the United States. The financial statements of the Baylor Waco Stadium Authority, a discretely presented component unit of the City, were not audited in accordance with Government Auditing Standards. Those standards require that we plan and perform the audit to obtain reasonable assurance about whether the financial statements are free from material misstatement.
An audit involves performing procedures to obtain audit evidence about the amounts and disclosures in the financial statements. The procedures selected depend on the auditor’s judgment, including the assessment of the risks of material misstatement of the financial statements, whether due to fraud or error. In making those risk assessments, the auditor considers internal control relevant to the entity’s preparation and fair presentation of the financial statements in order to design audit procedures that are appropriate in the circumstances, but not for the purpose of expressing an opinion on the effectiveness of the entity’s internal control.
DRAFT

4
Accordingly, we express no such opinion. An audit also includes evaluating the appropriateness of significant accounting policies used and the reasonableness of significant estimates made by management, as well as evaluating the overall presentation of the financial statements. We believe that the audit evidence we have obtained is sufficient and appropriate to provide a basis for our audit opinions. Opinions In our opinion, the financial statements referred to above present fairly, in all material respects, the respective financial position of the governmental activities, the business-type activities, each major fund, and the aggregate discretely presented component units and remaining fund information of the City of Waco, Texas, as of September 30, 2020, and the respective changes in financial position and, where applicable, cash flows thereof and the respective budgetary comparison for the general fund for the year then ended in accordance with accounting principles generally accepted in the United States of America. Other Matters Required Supplementary Information Accounting principles generally accepted in the United States of America require that the management’s discussion and analysis on pages 8 through 20 and the other required supplementary information on pages 93 through 95 (collectively, the “required supplementary information”) be presented to supplement the basic financial statements. Such information, although not a part of the basic financial statements, is required by the Governmental Accounting Standards Board, who considers it to be an essential part of financial reporting for placing the basic financial statements in an appropriate operational, economic, or historical context. We have applied certain limited procedures to the required supplementary information in accordance with auditing standards generally accepted in the United States of America, which consisted of inquiries of management about the methods of preparing the information and comparing the information for consistency with management’s responses to our inquiries, the basic financial statements, and other knowledge we obtained during our audit of the basic financial statements. We do not express an opinion or provide any assurance on the information because the limited procedures do not provide us with sufficient evidence to express an opinion or provide any assurance. Other Information Our audit was conducted for the purpose of forming opinions on the financial statements that collectively comprise the City of Waco, Texas’ basic financial statements. The introductory section, combining and individual fund financial statements and schedules, and statistical section are presented for purposes of additional analysis and are not a required part of the basic financial statements. The combining and individual fund financial statements and schedules are the responsibility of management and were derived from and relate directly to the underlying accounting and other records used to prepare the basic financial statements. Such information has been subjected to
DRAFT

5
the auditing procedures applied in the audit of the basic financial statements and certain additional procedures, including comparing and reconciling such information directly to the underlying accounting and other records used to prepare the basic financial statements or to the basic financial statements themselves, and other additional procedures in accordance with auditing standards generally accepted in the United States of America. In our opinion, the combining and individual fund financial statements and schedules are fairly stated in all material respects in relation to the basic financial statements as a whole. The introductory and statistical sections have not been subjected to the auditing procedures applied in the audit of the basic financial statements and, accordingly, we do not express an opinion or provide any assurance on them. Other Reporting Required by Government Auditing Standards In accordance with Government Auditing Standards, we have also issued our report dated February 9, 2021, on our consideration of the City of Waco, Texas’ internal control over financial reporting and on our tests of its compliance with certain provisions of laws, regulations, contracts and grant agreements and other matters. The purpose of that report is to describe the scope of our testing of internal control over financial reporting and compliance and the results of that testing, and not to provide an opinion on the internal control over financial reporting or on compliance. That report is an integral part of an audit performed in accordance with Government Auditing Standards in considering the City of Waco, Texas’ internal control over financial reporting and compliance. February 9, 2021 DRAFT

6
DRAFT

7
Management’s Discussion and Analysis
DRAFT

8
Management’s Discussion and Analysis
As management of the City of Waco (the City), we offer readers of the City’s financial statements this narrative overview and analysis of the financial activities of the City for the fiscal year ended September 30, 2020. We encourage readers to consider the information presented here in conjunction with additional information that we have furnished in our letter of transmittal, which can be found on pages xi through xvii of this report. FINANCIAL HIGHLIGHTS
The assets and deferred outflows of resources of the City exceeded its liabilities and deferred inflows of resources as of September 30, 2020 by $735,136,127 (net position). Of this amount, $157,314,348 (unrestricted net position) may be used to meet the City’s ongoing obligations to citizens and creditors in accordance with the City’s fund designation and fiscal policies.
The City’s total net position increased by $82,078,141.
For business-type activities and the wastewater fund, the City recognized a special item - a $29,769,651 gain from the termination of the Waco Metropolitan Area Regional Sewer System (“WMARSS”) interlocal cooperation agreement, which results in the City assuming all undivided interest in the facilities and operations of WMARSS and simultaneously executing wholesale wastewater contracts with the prior participating cities to become customers of the City’s solely-owned wastewater system. Additional information on the termination of WMARSS is included in Note IV. P. to the financial statements.
As of the close of the current fiscal year, the City’s governmental funds reported combined ending fund balances of $214,361,828. The fund balance components are nonspendable - $1,412,675, restricted - $99,319,178, committed - $38,534,149, assigned - $27,006,004 and unassigned - $48,089,822. The City Council approves the amounts reported as committed and assigned.
As of September 30, 2020, unassigned fund balance for the General Fund was $48,089,822 or 33% of the Fiscal Year 2021 budgeted general fund revenues.
OVERVIEW OF THE FINANCIAL STATEMENTS This discussion and analysis is intended to serve as an introduction to the City’s basic financial statements. The City’s basic financial statements are comprised of three components: (1) government-wide financial statements, (2) fund financial statements, and (3) notes to the financial statements. This report also contains other supplementary information in addition to the basic financial statements themselves. Government-wide financial statements – The government-wide financial statements, which begin on page 23 of this report, are designed to provide readers with a broad overview of the City’s finances, in a manner similar to a private-sector business.
DRAFT

9
The Statement of Net Position presents information on all of the City’s assets and liabilities, and deferred inflows/outflows of resources, with the difference reported as net position. Over time, increases or decreases in net position may serve as a useful indicator of whether the financial position of the City is improving or deteriorating. The Statement of Activities presents information showing how the City’s net position changed during the fiscal year. All changes in net position are reported when the underlying event giving rise to the change occurs, regardless of the timing of related cash flows. Thus, revenues and expenses are reported in this statement for some items that will only result in cash flows in the future fiscal periods (e.g., uncollected taxes and earned but unused compensated absences). Both of the government-wide financial statements distinguish functions of the City that are principally supported by taxes and intergovernmental revenues (governmental activities) from functions that are intended to recover all or a significant portion of their costs through user fees and charges (business-type activities). The governmental activities of the City include general government, public works, public safety, culture and recreation, public health, and housing and community development. The business-type activities of the City include water, wastewater, solid waste, airport, convention services, Ranger Hall of Fame, Cameron Park Zoo, transit services, and Cottonwood Creek Golf Course. The government-wide financial statements can be found on pages 23 – 25 of this report. Fund financial statements – A fund is a grouping of related accounts that is used to maintain control over resources that have been segregated for specific activities or objectives. The City, like other state and local governments, uses fund accounting to ensure and demonstrate compliance with finance-related legal requirements. All funds of the City can be divided into three categories – governmental funds, proprietary funds, and fiduciary funds. Governmental funds – Governmental funds are used to account for essentially the same functions reported as governmental activities in the government-wide financial statements. However, unlike the government-wide financial statements, governmental fund financial statements focus on near-term inflows and outflows of spendable resources, as well as on balances of spendable resources available at the end of the fiscal year. Such information may be useful in evaluating a government’s near-term financing requirements. Because the focus of governmental funds is narrower than that of the government-wide financial statements, it is useful to compare the information presented for governmental funds with similar information presented for governmental activities in the government-wide financial statements. By doing so, readers may better understand the long-term impact of the government’s near-term financing decisions. Both the governmental funds balance sheet and the governmental funds statement of revenues, expenditures, and changes in fund balances provide a reconciliation to facilitate this comparison between governmental funds and governmental activities. Beginning on page 26 of this report, information is presented separately in the Governmental Funds Balance Sheet and in the Governmental Funds Statement of Revenues, Expenditures, and Changes in Fund Balances for the general fund, which is considered a major fund. A budgetary comparison statement has been provided for the general fund to demonstrate compliance. Data from all other governmental funds are combined into a single, aggregated presentation.
DRAFT

10
Individual fund data for each of these nonmajor governmental funds is provided in the form of combining and individual fund statements and schedules elsewhere in this report. Proprietary funds – The City maintains two types of proprietary funds. Enterprise funds are used to report the same functions presented as business-type activities in the government-wide financial statements. The City uses enterprise funds to account for water, wastewater, solid waste, airport, convention services, Ranger Hall of Fame, Cameron Park Zoo, transit services, and Cottonwood Creek Golf Course operations. Internal service funds are an accounting device used to accumulate and allocate costs internally among the City’s various functions. The City uses its internal service funds to account for its risk management, health insurance, engineering, and fleet services. These internal service functions have been included within governmental activities in the government-wide financial statements. Proprietary funds provide the same type of information as the government-wide financial statements, only in more detail. The basic proprietary fund financial statements which begin on page 40 of this report provide separate information for the water, wastewater, and solid waste enterprise funds since these are considered to be major funds of the City. Data from the other enterprise funds are combined into a single, aggregated presentation. Individual fund data for each of these nonmajor enterprise funds is provided in the form of combining and individual fund statements and schedules elsewhere in this report. All internal service funds are combined into a single aggregated presentation in the proprietary fund financial statements. Individual fund data for the internal service funds is provided in the form of combining and individual fund statements and schedules elsewhere in this report. Fiduciary funds – Fiduciary funds are used to account for resources held for the benefit of parties outside the government. Fiduciary funds are not reflected in the government-wide financial statement because the resources of these funds are not available to support the City’s own programs. The accounting used for fiduciary funds is much like that used for proprietary funds. The Statement of Fiduciary Net Position can be found on page 43 of this report. Notes to the Financial Statements – The notes provide additional information that is essential to a full understanding of the data provided in the government-wide and fund financial statements. The notes to the financial statements can be found on pages 45 through 90 of this report. Other information – In addition to the basic financial statements and accompanying notes, this report also presents required supplementary information concerning the City’s changes in its net pension liability, related pension contributions, and changes in total OPEB liability. Required supplementary information can be found on pages 93 through 95 of this report. The combining and individual fund statements and schedules are presented immediately following the required supplementary information beginning on page 101 of this report. GOVERNMENT-WIDE FINANCIAL ANALYSIS As noted earlier, net position may serve over time as a useful indicator of the government’s financial position. In the case of the City of Waco, assets and deferred outflows of resources exceeded liabilities and deferred inflows of resources by $735,136,127 as of September 30, 2020.
DRAFT

11
The largest portion of the City’s net position ($528,601,739) reflects its net investment in capital assets (e.g., land, building, equipment, improvements, museum collections, construction in progress, infrastructure and water rights), less any outstanding debt used to acquire those assets. The City uses these capital assets to provide service to citizens; consequently, these assets are not available for future spending. Although the City’s investment in its capital assets is reported net of related debt, it should be noted that the resources needed to repay this debt must be provided from other sources, since the capital assets themselves cannot be used to liquidate these liabilities.
City of Waco Net Position
2020 2019 2020 2019 2020 2019
Current and other assets $ 250,719,941 218,223,373 258,451,900 249,921,870 509,171,841 468,145,243 Capital assets 323,034,288 305,585,840 542,828,050 488,950,939 865,862,338 794,536,779
Total assets 573,754,229 523,809,213 801,279,950 738,872,809 1,375,034,179 1,262,682,022
Total deferred outflows of resources 14,048,794 32,099,859 4,595,095 7,932,443 18,643,889 40,032,302
Long-term liabilities 179,028,906 189,004,221 377,099,821 371,144,955 556,128,727 560,149,176 Other liabilities 41,203,376 41,983,052 46,247,513 46,918,849 87,450,889 88,901,901
Total liabilities 220,232,282 230,987,273 423,347,334 418,063,804 643,579,616 649,051,077
Total deferred inflows 12,792,339 524,834 2,069,986 80,427 14,862,325 605,261 of resources
Net position: Net investment in capital assets 243,043,416 227,983,027 285,558,323 245,071,453 528,601,739 473,054,480 Restricted 48,213,632 43,936,163 1,006,408 1,057,103 49,220,040 44,993,266 Unrestricted 63,521,354 52,477,775 93,792,994 82,532,465 157,314,348 135,010,240
Total net position $ 354,778,402 324,396,965 380,357,725 328,661,021 735,136,127 653,057,986
Activities Activities TotalsGovernmental Business-type
A portion of the City’s net position ($49,220,040) represents resources that are subject to external restriction on how they may be used. The remaining balance ($157,314,348) of unrestricted net position may be used to meet the City’s ongoing obligation to citizens and creditors in accordance with the City’s fund designation and fiscal policies. As of September 30, 2020, the City has positive balances in all three categories of net position, both for the City as a whole, as well as for its governmental and business-type activities separately. The same situation held true for the prior fiscal year. The government’s net position increased $82,078,141 during the current fiscal year.
DRAFT

12
Analysis of the City’s operations – The following table provides a summary of the City’s operations for the year ended September 30, 2020. Governmental activities increased the City’s net position by $30,381,437 and represented 37% of the total. Business-type activities increased the City’s net position by $51,696,704 and represented 63% of the total increase.
City of Waco
Changes in Net Position
Governmental Business-type Governmental Business-typeActivities Activities Total Activities Activities Total
Revenues: Program revenues: Charges for services $ 6,759,483 121,353,597 128,113,080 8,288,182 115,996,463 124,284,645 Operating grants and contributions 22,262,586 6,773,559 29,036,145 11,527,188 4,028,788 15,555,976 Capital grants and contributions 4,689,356 6,358,716 11,048,072 8,561,177 3,182,243 11,743,420 General revenues: Ad valorem taxes 91,825,848 - 91,825,848 88,727,973 - 88,727,973 Sales taxes 41,033,102 - 41,033,102 40,610,169 - 40,610,169 Franchise taxes 14,480,403 - 14,480,403 14,590,418 - 14,590,418 Hotel/motel taxes - 3,138,696 3,138,696 - 4,617,066 4,617,066 Other taxes 1,168,421 - 1,168,421 1,273,129 - 1,273,129 Investment earnings 3,990,302 1,143,224 5,133,526 7,976,252 2,278,688 10,254,940 Miscellaneous 2,989,133 - 2,989,133 3,349,070 - 3,349,070 Total revenues 189,198,634 138,767,792 327,966,426 184,903,558 130,103,248 315,006,806
Expenses: General government 24,927,532 - 24,927,532 21,418,706 - 21,418,706 Public works 16,663,378 - 16,663,378 15,263,962 - 15,263,962 Public safety 82,482,836 - 82,482,836 81,605,115 - 81,605,115 Culture and recreation 18,281,256 - 18,281,256 20,036,504 - 20,036,504 Public health 8,941,058 - 8,941,058 9,205,925 - 9,205,925 Housing and community development 2,752,409 - 2,752,409 2,904,350 - 2,904,350 Interest on long-term debt 3,303,458 - 3,303,458 3,149,200 - 3,149,200 Water - 41,071,141 41,071,141 - 39,841,010 39,841,010 Wastewater - 29,284,437 29,284,437 - 27,232,626 27,232,626 Solid waste - 21,389,352 21,389,352 - 20,867,979 20,867,979 Airport - 5,001,016 5,001,016 - 4,333,238 4,333,238 Convention services - 4,380,349 4,380,349 - 5,684,576 5,684,576 Ranger Hall of Fame - 1,517,423 1,517,423 - 1,404,669 1,404,669 Cameron Park Zoo - 6,003,814 6,003,814 - 5,357,572 5,357,572 Transit services - 7,754,706 7,754,706 - 8,234,983 8,234,983 Cottonwood Creek Golf Course - 1,903,771 1,903,771 - 2,094,332 2,094,332 Total expenses 157,351,927 118,306,009 275,657,936 153,583,762 115,050,985 268,634,747
Increase in net position before special item and transfers 31,846,707 20,461,783 52,308,490 31,319,796 15,052,263 46,372,059 Special Item--gain on termination of WMARSS agreement - 29,769,651 29,769,651 - - - Transfers (1,465,270) 1,465,270 - (233,023) 233,023 - Increase in net position 30,381,437 51,696,704 82,078,141 31,086,773 15,285,286 46,372,059
Net position, beginning of year 324,396,965 328,661,021 653,057,986 293,310,192 313,375,735 606,685,927
Net position, end of year $ 354,778,402 380,357,725 735,136,127 324,396,965 328,661,021 653,057,986
2020 2019Year Ended September 30,
DRAFT

13
City of Waco Changes in Net Position
(Continued)
Governmental activities – Key elements of the change in governmental net position include:
Overall, governmental revenues increased $4.3 million (2.3%). Ad valorem taxes reflected an increase of $3.1 million (3.5%), primarily as a result of growth in the property tax base including an increase in assessed values of approximately $183 million resulting from new construction within the City. Sales taxes reflected a slight increase of approximately $0.4 million (1.0%). Due to COVID-19, the City amended sales taxes revenue budget projections as part of implemented cost management measures, but the revenue ended the year exceeding prior year’s actual collections. The pandemic had a detrimental impact on charges for services which reported a reduction of $1.5 million (-18.4%) compared to prior year as many of the City facilities were closed or had limited activity for much of the fiscal year. Operating grants reported an increase of $10.7 million (93.1%) primarily due to COVID-19 grant funding of $8.2 million and the Texas anti-gang state grant of $1.4 million. These increases helped to offset the reduction of $3.9 million for capital grants due primarily to reductions in public works grants and contributed assets. Investment earnings decreased approximately $4.0 million (-50.0%) primarily as a result of market fluctuations due to the impact of COVID-19.
Overall, governmental expenses increased $3.8 million (2.5%). A 3.0% salary increase for all eligible employees and job class step increases for eligible civil service employees were approved in the budget. The budget also reflected the City’s focus on investing in public safety as seven new positions were approved to be added to the Police Department during the fiscal year. Economic development incentives and economic development grants expenses increased $2.4 million primarily due to Waco-McLennan County Economic Development Corporation (“WMCEDC”) projects, and business grant programs. These increases for salaries and related benefits and economic development were partially offset by cost savings measures implemented by the City as a response to COVID-19 and an overall reduction in pension expense. As expected, significant fluctuations in pension expense may occur in response to changes in fair value of plan assets and the total pension liability. Pension expense decreased $4.9 million as compared to prior year due to market changes.
Business-type activities – Key elements of the increase in business-type net position include:
Charges for services increased by almost $5.4 million (4.6%) as compared to prior year primarily due to rate increases and growth in service activity as follows: water ($2.8 million), wastewater ($3.9 million), and solid waste ($1.4 million). Effective January 1, 2020, water and wastewater base monthly service rates increased along with volumetric rate increases. Infrastructure needs, identified in master plans for water and wastewater completed in 2015, continue to be a significant factor contributing to changes in rates. Solid waste fees for residential, commercial, roll-off, and landfill gate increased in October. These increases were necessary as the City continues its work to upgrade infrastructure necessary for the safe and timely disposal of solid waste. These increases for the three major activities were offset by decreases in charges for services in all of the other nonmajor activities. These activities reported a decrease of $2.8 million for charges for services as compared to prior year due to COVID-19 impact on operations. The Convention Center was closed for part of year due to COVID-19 and reported the largest
DRAFT

14
$- $10 $20 $30 $40 $50 $60 $70 $80 $90 $100
Capital grant and contributions
Other revenues
Franchise taxes
Other fees and service charges
Solid waste service charges
Operating grants and contributions
Wastewater service charges
Sales tax
Water service charges
Ad valorem taxes
11.1 12.4
14.5 14.8
21.9 29.0
38.3 41.0
53.1 91.8
Revenues by Source ( in $ millions)
City of Waco Changes in Net Position
(Continued)
decrease of approximately $0.9 million. Operating grants reported an increase of $2.7 million (68.1%) and capital grants and contributions increased approximately $3.2 million (99.8%). The increase in operating grants was due to COVID-19 grant funding for the Airport of approximately $1.5 million, Texas Department of Transportation intergovernmental revenue of $0.7 million for water and wastewater, and $0.5 million increase in grant funding for transit. The increase in capital grants and contributions was due to $3.6 million for contributed assets for water and wastewater and $0.7 million for transit buses, which was partially offset by a reduction of $1.1 million for airport grants primarily due to the purchase of an ARFF (Aircraft Rescue and Fire Fighting) vehicle in prior year. Investment earnings decreased approximately $1.1 million (-49.8%) primarily as a result of market fluctuations due to the impact of COVID-19.
Total expenses increased $3.3 million (2.8%) with the major activities of water, wastewater, and solid waste reporting a total increase of $3.8 million, which was offset by net reductions of $0.5 million for the other nonmajor enterprise activities. Although expenses such as salaries and benefits, supplies, depreciation, and interest increased, cost savings measures helped to reduce other expense categories such as purchased professional services, maintenance, and other purchased services. Depreciation increased $2.5 million with wastewater accounting for $1.3 million of the increase. Interest expense also increased $0.7 million primarily due to an increase in debt financing that has been issued to meet water and wastewater infrastructure needs.
For business-type activities and the wastewater fund, the City recognized a special item - a $29,769,651 gain from the termination of the WMARSS interlocal cooperation agreement, which results in the City assuming all undivided interest in the facilities and operations of WMARSS and simultaneously executing wholesale wastewater contracts with the prior participating cities to become customers of the City’s solely-owned wastewater system. Additional information on the termination of WMARSS is included in Note IV. P. to the financial statements. DRAFT

15
30%
15%
10%
10%
9%
8%
7%
6%3% 1%
1%
Expenses by Activity (Percent of Total)
Public safety
Water
Wastewater
Other enterprise expenses
General government
Solid waste
Culture and recreation
Public Works
Public health
Other governmental expenses
Housing and community development
FINANCIAL ANALYSIS OF THE GOVERNMENT'S FUNDS Governmental funds - The focus of the City of Waco's governmental funds is to provide information on near-term inflows, outflows, and balances of spendable resources. Such information is useful in assessing the City's financing requirements. In particular, unassigned fund balance may serve as a useful measure of a government's net resources available for spending at the end of the fiscal year. At the end of the current fiscal year, the City of Waco's governmental funds reported combined ending fund balances of $214,361,828. Approximately 0.7% ($1,412,675) of this total amount constitutes nonspendable fund balance. Nonspendable fund balance represents net resources that cannot be spent because of their form or because they must remain intact. Included in this component are inventories and permanent funds. Approximately 46.3% ($99,319,178) of the total fund balance is classified as restricted. Restricted fund balance reflects resources that are subject to externally enforceable legal restrictions. This classification includes debt service,
DRAFT

16
capital projects, and special revenue funds such as tax increment zones. Approximately 18.0% ($38,534,149) of the fund balance is reported as committed. Committed fund balances represent resources whose use has a self-imposed limitation imposed by the City Council and would require formal action to remove or modify the commitment. This classification includes resources that have been committed for economic development initiatives, capital projects and public health. Approximately 12.6% ($27,006,004) of the fund balance is reported as assigned which reflects the City’s intended use of resources. These intended uses are approved by the City Council. The remainder of the fund balance of $48,089,822 (22.4%) is reported as unassigned. Refer to pages 53 and 54 of this report for a more detailed presentation of governmental fund balances. During the current year the City Council approved an amendment to the City’s financial management policy statement to provide for general fund unassigned fund balance to be maintained at 28% of budgeted revenues. Unassigned general fund balance at the end of the current fiscal year is 33% of 2021 budgeted revenues. The fund balance of the general fund at the end of the current year reported an increase of $4,771,588. Total revenues in the general fund increased $6,770,852 as compared to the prior year and were $3,805,796 more than the final budget. Key factors in general fund revenue are as follows:
Increases of approximately $2.5 million in property tax revenues resulted primarily from growth in net assessed taxable values of approximately 6%. Property taxes represented approximately 44% of total general fund revenues.
Sales tax revenue reported a slight increase of approximately $0.4 million as
compared to prior year, with actual amounts exceeding the amount originally budgeted for the fiscal year by approximately $2.0 million. Prior to the impact of COVID-19 in March 2020, the City was experiencing continued strong growth in sales tax revenue. The Council took quick and decisive action to amend the City’s budget to brace for the unknown impact of the virus; however, the City was able to close the year with stronger than expected annual sales tax collections. This revenue source represents 27% of total general fund revenues.
Gross receipts fees, which had been budgeted very conservatively, decreased $0.2
million as compared to prior year. Approximately 9% of total general fund revenues came from gross receipts fees.
Proprietary funds - The City's proprietary fund statements beginning on page 40 of this report provide the same type of information found in the government-wide financial statements, but in more detail. Unrestricted net position of the respective major proprietary funds are water - $43,318,204, wastewater - $35,584,348, and solid waste - $6,496,709. These funds recognized increases in total net position during 2020 as follows: water - $11,217,524, wastewater - $40,827,845, and solid waste – $232,751.
DRAFT
17
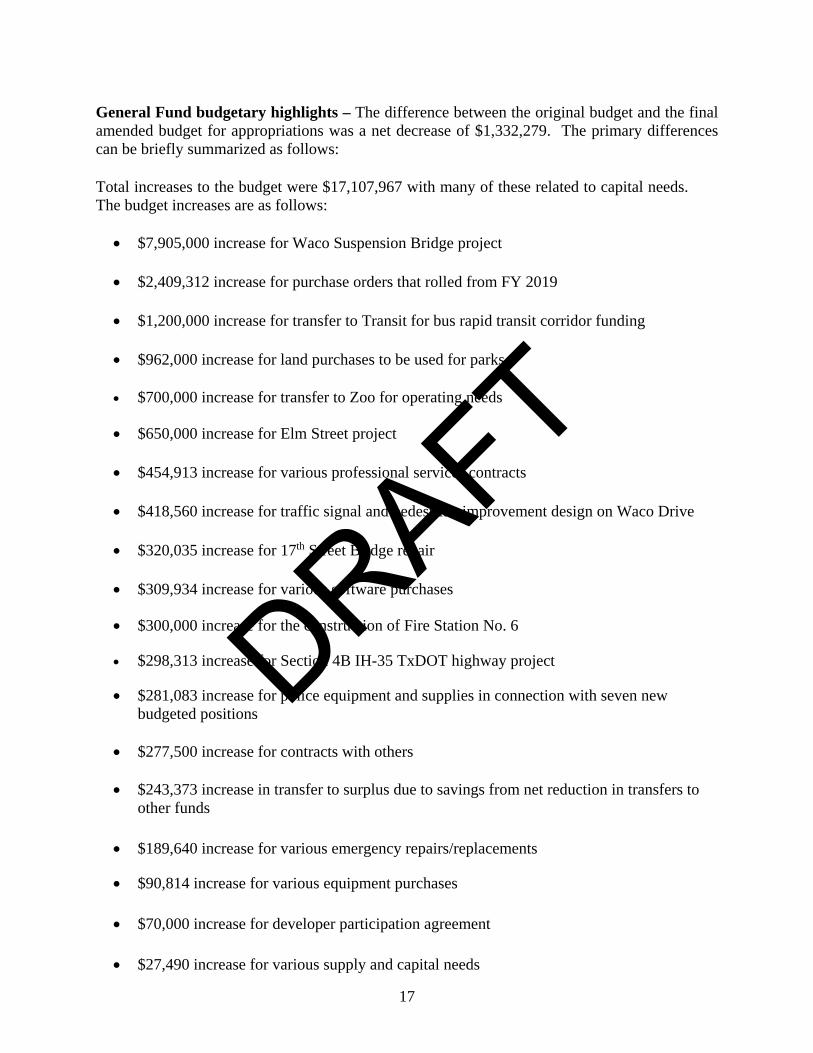
General Fund budgetary highlights – The difference between the original budget and the final amended budget for appropriations was a net decrease of $1,332,279. The primary differences can be briefly summarized as follows: Total increases to the budget were $17,107,967 with many of these related to capital needs. The budget increases are as follows:
$7,905,000 increase for Waco Suspension Bridge project
$2,409,312 increase for purchase orders that rolled from FY 2019
$1,200,000 increase for transfer to Transit for bus rapid transit corridor funding
$962,000 increase for land purchases to be used for parks
$700,000 increase for transfer to Zoo for operating needs
$650,000 increase for Elm Street project
$454,913 increase for various professional services contracts
$418,560 increase for traffic signal and pedestrian improvement design on Waco Drive
$320,035 increase for 17th Street Bridge repair
$309,934 increase for various software purchases
$300,000 increase for the construction of Fire Station No. 6
$298,313 increase for Section 4B IH-35 TxDOT highway project
$281,083 increase for police equipment and supplies in connection with seven new budgeted positions
$277,500 increase for contracts with others
$243,373 increase in transfer to surplus due to savings from net reduction in transfers to other funds
$189,640 increase for various emergency repairs/replacements
$90,814 increase for various equipment purchases
$70,000 increase for developer participation agreement
$27,490 increase for various supply and capital needs
DRAFT

18
Total decreases to the budget were $18,440,246 with the two most significant needed as a result of combining the economic incentive fund with the general fund for annual reporting. The other decreases are primarily due to cost savings measures implemented as part of the COVID-19 response.
$11,402,191 decrease for economic development projects
$2,500,000 decrease for transfer out to economic development fund
$1,469,256 decrease for continency expense
$1,225,426 decrease for transfer to Golf
$700,000 decrease for transfer to Capital Equipment Replacement Fund
$643,373 decrease in transfer to Transit for current operations
$300,000 decrease for transfer to Airport for current operations
$200,000 decrease for engineering charges for Street Department For a more detailed presentation of the actual General Fund operations compared to both the original and final budget for fiscal year 2020, refer to the General Fund Statement of Revenues, Expenditures and Changes in Fund Balances - Budget and Actual on pages 30 to 38 of this report. CAPITAL ASSETS The City of Waco's investment in capital assets for its governmental and business-type activities as of September 30, 2020, amounts to $865,862,338 (net of accumulated depreciation). This investment in capital assets includes land, building, machinery and equipment, improvements other than buildings, museum collections, water rights, infrastructure and construction work in progress. Major capital asset events occurring during the current fiscal year included the following:
Added approximately $73.8 million for various water and wastewater systems projects, including additions of $25.3 million due to the termination of the Waco Metropolitan Area Regional Sewer System (“WMARSS”) interlocal cooperation agreement, which results in the City assuming all undivided interests in the facilities and operations of WMARSS. Additional information on the termination of WMARSS is included in Note IV. P. to the financial statements.
Capitalized $27.5 million in street and drainage infrastructure and developer
contributions.
Capitalized $2.7 million for parks improvements.
DRAFT

19
City of Waco Capital Assets
2020 2019 2020 2019 2020 2019
Land $ 63,189,674 61,183,206 17,100,882 15,202,447 80,290,556 76,385,653 Buildings 84,533,296 83,011,175 85,073,136 84,508,590 169,606,432 167,519,765 Improvements other than buildings 70,838,861 69,529,596 621,197,492 584,909,947 692,036,353 654,439,543 Machinery and equipment 67,471,285 65,342,853 67,417,296 62,207,295 134,888,581 127,550,148 Museum collections - - 2,274,424 2,264,424 2,274,424 2,264,424 Infrastructure 344,126,081 318,076,080 - - 344,126,081 318,076,080 Construction work in progress 24,734,958 23,797,173 96,082,572 62,674,846 120,817,530 86,472,019 Water rights - - 32,482,879 32,482,879 32,482,879 32,482,879 Less: accumulated depreciation (331,859,867) (315,354,243) (378,800,631) (355,299,489) (710,660,498) (670,653,732)
Total capital assets $ 323,034,288 305,585,840 542,828,050 488,950,939 865,862,338 794,536,779
Activities Activities TotalsGovernmental Business-type
Additional information on the City's capital assets can be found in Note IV on pages 64 – 66 of this report.
DEBT ADMINISTRATION
At the end of the current fiscal year, the City of Waco had total bonded debt and notes payable of $516,386,028. Of this amount, $514,812,790 represents bonded debt backed by the full faith and credit of the government. The $1,573,238 notes payable are for highway improvement right of way contributions and for purchase of pump station and water transmission lines.
City of Waco Bonds and Notes Payable
2020 2019 2020 2019 2020 2019
General obligation certificates $ 133,127,359 113,735,153 381,685,431 370,491,773 514,812,790 484,226,926 Notes payable 161,422 322,844 1,411,816 1,501,978 1,573,238 1,824,822
$ 133,288,781 114,057,997 383,097,247 371,993,751 516,386,028 486,051,748
Activities Activities TotalsGovernmental Business-type
During the 2020 fiscal year, the City issued $58,710,000 in general obligation certificates of obligation. The proceeds will be used for various general City improvements, including improvements to City administration and service buildings, recreation centers, central library, fire stations, police stations and zoo facilities. Other uses will be for the construction, acquisition and improvement of City streets, traffic control systems, sidewalks, landscaping, street lighting and drainage and parks recreation facilities. Additionally certain proceeds of the bonds will be used for the acquisition of vehicles, fire-fighting, and other equipment, and water and wastewater improvements.
DRAFT

20
The City’s bond ratings are listed below:
Moody’s Standard Investors Service and Poor’s
General obligation bonds Aa1 AA+
Additional information on the City of Waco’s long-term debt can be found in Note IV on pages 69 to 74 of this report. ECONOMIC FACTORS AND NEXT YEAR’S BUDGETS AND RATES The fiscal year 2021 budget had the unprecedented challenge of budget development during a global pandemic. No change in the total property tax rate is planned for fiscal year 2021. With the uncertainly surrounding revenues such as sales tax and expected minimal growth in property tax, the general fund budget (including transfers in) for fiscal year 2021 is based on a decrease in revenues of 2.2% as compared to last year’s adopted budget. This is mainly due to a decrease in budgeted sales taxes revenues of $36 million as compared to prior year adopted budget of $39 million. Although there is a slight budgeted increase in total property tax assessed values for fiscal year 2021, the emphasis on needed infrastructure improvements resulted in a shift of the tax rate to meet the increase debt service requirements of approximately $1.8 million. As a result, general fund had a decrease of budgeted property tax revenue of approximately $1 million. The fiscal year 2021 budget includes a $7.9 million utilization of surplus to provide cash funding for capital projects. This amount is assigned in fund balance in the general fund at September 30, 2020. Due to the COVID-19, the City did not budget salary increase in the proposed budget. This represented the first time in nine years that this has not been part of the annual budget. Civil service employees will receive a job class step increase, if eligible. The City has budgeted for a potential mid-year salary adjustment which is contingent upon sales tax recovery, as well as long-term budget savings identified by the City staff. The Texas Municipal Retirement System (TMRS) benefit provisions of the City’s plan were reviewed during the fiscal year 2012 budget process and as a result, the City council approved a plan change to turn off annually repeating annuity increases. The City’s contribution rate for 2021 (14.69%) increased slightly from the 2020 rate (14.33%). The City plans to contribute more than the full rate to assist in reducing the unfunded liability more quickly. The City’s budget for fiscal year 2021 included approximately $14.2 million for TMRS contributions. Fiscal year 2021 includes rate increases to residential, commercial and industrial water and wastewater customers, but with a new rate structure water rates have been restructured to provide a lower cost for customer’s with minimal use. The results of master plans for water and wastewater were a significant factor contributing to changes in water and wastewater service rates. Infrastructure needs and a timeline to complete the essential improvements were identified in the master plans. There are no increases for solid waste residential, commercial, roll-off rates, and landfill gate fees for fiscal year 2021. REQUEST FOR INFORMATION The financial report is designed to provide our citizens, customers, investors and creditors with a general overview of the City’s finances. If you have questions about this report or need any additional information, contact Janice Andrews, Chief Financial Officer, P. O. Box 2570, Waco, Texas 76702-2570, or call (254) 750-5758.
DRAFT

21
Basic Financial Statements
DRAFT

22
DRAFT

Waco HealthBaylor Waco Facilities
Governmental Business-type Stadium DevelopmentActivities Activities Total Authority Corporation
AssetsCash and investments $ 223,092,004 101,328,362 324,420,366 71,790 31,919 Receivables (net of allowances for uncollectibles): Accounts 4,221,856 13,681,659 17,903,515 23,788 - Special assessments 9,128 - 9,128 - - Taxes 10,242,280 - 10,242,280 - - Intergovernmental receivable 9,584,171 6,729,844 16,314,015 - - Prepaid expense - 331,329 331,329 4,612 Internal balances 2,046,591 (2,046,591) - - - Inventories 1,226,382 1,305,700 2,532,082 - - Restricted cash and investments - 137,121,597 137,121,597 - - Notes receivable 231,272 - 231,272 - - Real estate held for resale 66,257 - 66,257 - - Capital assets not being depreciated: Land 63,189,674 17,100,882 80,290,556 - - Museum collections - 2,274,424 2,274,424 - - Construction in progress 24,734,958 96,082,572 120,817,530 - - Capital assets, net of accumulated depreciation: Buildings 49,945,913 36,482,800 86,428,713 - - Machinery and equipment 18,780,044 21,545,912 40,325,956 34,433 - Improvements other than buildings 28,082,255 351,248,057 379,330,312 - - Infrastructure 138,301,444 - 138,301,444 - - Water rights - 18,093,403 18,093,403 - -
Total assets 573,754,229 801,279,950 1,375,034,179 134,623 31,919
Deferred outflows of resourcesDeferred outflows of resources: Deferred losses on refundings of debt 1,235,425 2,581,875 3,817,300 - - Deferred outflows on pension liability 12,366,926 2,013,220 14,380,146 - - Deferred outflows on OPEB liability 446,443 - 446,443 - -
Total deferred outflows of resources 14,048,794 4,595,095 18,643,889 - -
LiabilitiesAccounts payable 6,026,631 3,288,468 9,315,099 38,592 - Accrued liabilities 7,522,880 2,957,093 10,479,973 - - Accrued interest payable 1,046,771 2,792,538 3,839,309 - - Unearned revenue 152,042 170,237 322,279 450 - Escrow funds 580,121 - 580,121 - - Customer deposits 804,266 - 804,266 - - Advanced deposits from Baylor University - - - 95,581 - Liabilities payable from restricted assets - 12,469,168 12,469,168 - - Noncurrent liabilities: Due within one year 25,070,665 24,670,009 49,740,674 - - Due in more than one year 179,028,906 377,099,821 556,128,727 - -
Total liabilities 220,232,282 423,447,334 643,679,616 134,623 -
Deferred inflows of resources: Deferred inflows on pension liability 12,715,629 2,069,986 14,785,615 - - Deferred inflows on OPEB liability 76,710 - 76,710 - -
Total deferred inflows of resources 12,792,339 2,069,986 14,862,325 - -
Net positionNet investment in capital assets 243,043,416 285,558,323 528,601,739 - - Restricted for: Tax increment financing/public improvement district 43,709,530 - 43,709,530 - - Housing and community development 186,868 - 186,868 - - Culture and recreation 169,374 - 169,374 - - Public safety 1,658,699 - 1,658,699 - - Public works 636,582 - 636,582 - - Municipal information 1,471,560 - 1,471,560 - - Parks and cemetery care - nonexpendable 381,019 - 381,019 - - Capital projects - 1,006,408 1,006,408 - - Unrestricted 63,521,354 93,792,994 157,314,348 - 31,919
Total net position 354,778,402$ 380,357,725$ 735,136,127$ -$ 31,919$
See accompanying notes to financial statements.
Primary Government Component Units
City of Waco, TexasStatement of Net Position
September 30, 2020
23
DRAFT

Operating CapitalCharges for Grants and Grants and
Functions/Programs Expenses Services Contributions ContributionsPrimary Government:Governmental activities: General government $ (24,927,532) 336,898 2,075,084 - Public works (16,663,378) 1,035 - 3,626,527 Public safety (82,482,836) 4,647,611 11,461,981 50,000 Culture and recreation (18,281,256) 657,512 1,725,803 607,337 Public health (8,941,058) 1,116,427 4,533,926 405,492 Housing and community development (2,752,409) - 2,465,792 - Interest on long-term debt (3,303,458) - - - Total governmental activities (157,351,927) 6,759,483 22,262,586 4,689,356
Business-type activities: Water (41,071,141) 53,110,881 258,577 1,829,961 Wastewater (29,284,437) 38,309,365 513,898 1,886,839 Solid waste (21,389,352) 21,881,584 - - Airport (5,001,016) 967,466 1,511,130 1,406,207 Convention services (4,380,349) 853,499 - - Ranger Hall of Fame (1,517,423) 381,521 26,800 10,000 Cameron Park Zoo (6,003,814) 1,711,401 - 61,338 Transit services (7,754,706) 2,547,859 4,463,154 1,164,371 Cottonwood Creek Golf Course (1,903,771) 1,590,021 - - Total business-type activities (118,306,009) 121,353,597 6,773,559 6,358,716
Total primary government $ (275,657,936) 128,113,080 29,036,145 11,048,072
Component Units:Baylor Waco Stadium Authority $ (2,432,129) 320,349 2,111,780 - Waco Health Facilities Development Corporation - - - -
Total component units $ (2,432,129) 320,349 2,111,780 -
General revenues: Taxes: Property Property tax increment financing Sales Franchise Hotel/motel Other Unrestricted investment earnings MiscellaneousSpecial item: Gain on termination of WMARSS agreementTransfers Total general revenues, special item, and transfers
Change in net position
Net position, beginning of year
Net position, end of year
See accompanying notes to financial statements.
City of Waco, Texas
Program Revenues
Year Ended September 30, 2020Statement of Activities
24
DRAFT
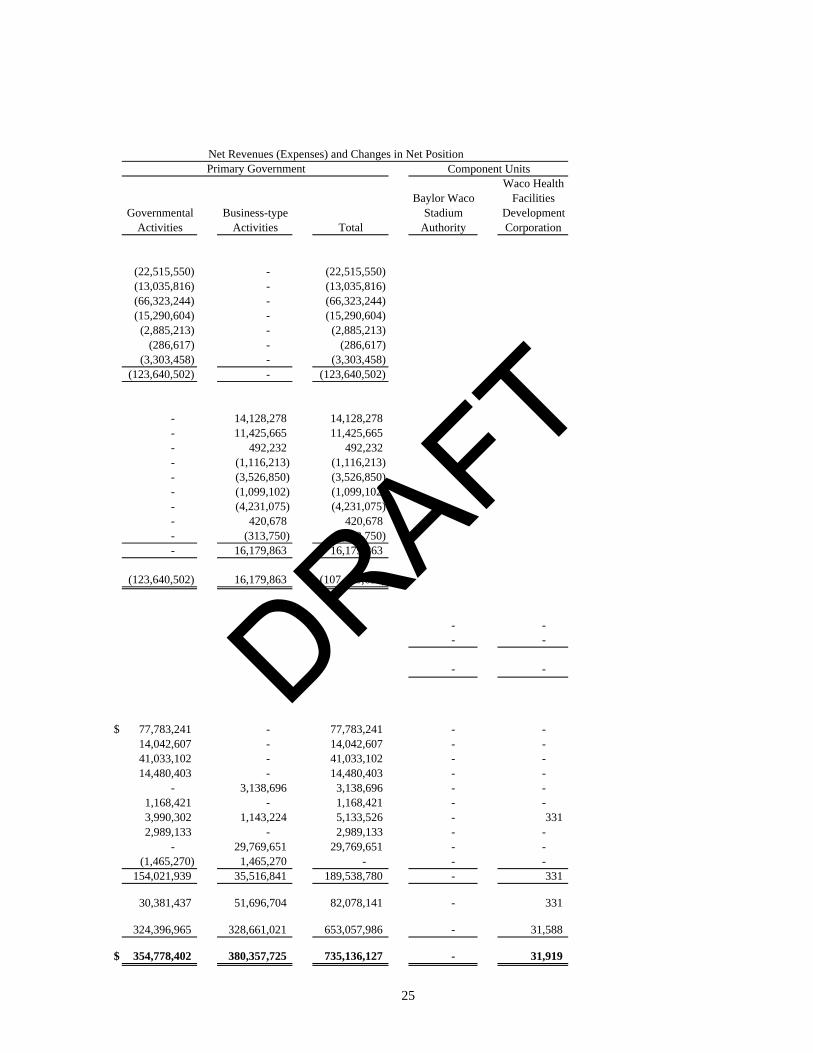
Net Revenues (Expenses) and Changes in Net Position
Waco HealthBaylor Waco Facilities
Governmental Business-type Stadium DevelopmentActivities Activities Total Authority Corporation
(22,515,550) - (22,515,550)(13,035,816) - (13,035,816)(66,323,244) - (66,323,244)(15,290,604) - (15,290,604)
(2,885,213) - (2,885,213)(286,617) - (286,617)
(3,303,458) - (3,303,458)(123,640,502) - (123,640,502)
- 14,128,278 14,128,278 - 11,425,665 11,425,665 - 492,232 492,232 - (1,116,213) (1,116,213)- (3,526,850) (3,526,850)- (1,099,102) (1,099,102)- (4,231,075) (4,231,075)- 420,678 420,678 - (313,750) (313,750)- 16,179,863 16,179,863
(123,640,502) 16,179,863 (107,460,639)
- - - -
- -
$ 77,783,241 - 77,783,241 - - 14,042,607 - 14,042,607 - - 41,033,102 - 41,033,102 - - 14,480,403 - 14,480,403 - -
- 3,138,696 3,138,696 - - 1,168,421 - 1,168,421 - - 3,990,302 1,143,224 5,133,526 - 331 2,989,133 - 2,989,133 - -
- 29,769,651 29,769,651 - - (1,465,270) 1,465,270 - - -
154,021,939 35,516,841 189,538,780 - 331
30,381,437 51,696,704 82,078,141 - 331
324,396,965 328,661,021 653,057,986 - 31,588
$ 354,778,402 380,357,725 735,136,127 - 31,919
Component UnitsPrimary Government
25
DRAFT

General FundTotal Nonmajor
Funds
Total Governmental
FundsAssetsCash and investments $ 89,482,027 $ 115,528,613 $ 205,010,640 Receivables, net of allowances:
Accounts 3,847,978 373,878 4,221,856 Special assessments - 9,128 9,128 Taxes 9,819,239 423,041 10,242,280 Notes - 231,272 231,272
Advances to other funds - 168,368 168,368 Intergovernmental receivable 6,032,811 3,551,360 9,584,171 Inventory 1,025,496 - 1,025,496 Real estate held for resale 6,160 60,097 66,257 Due from other funds 3,003,274 10,589,316 13,592,590
Total assets $ 113,216,985 $ 130,935,073 $ 244,152,058
LiabilitiesAccounts payable $ 2,266,223 $ 3,630,132 $ 5,896,355 Accrued liabilities 6,379,201 709,060 7,088,261 Unearned revenue 152,042 - 152,042 Due to other funds 8,659,352 3,809,367 12,468,719 Deposits 804,266 - 804,266 Escrow funds 427,524 152,059 579,583
Total liabilities 18,688,608 8,300,618 26,989,226
Deferred inflows of resourcesUnavailable revenue:
Property taxes 1,980,080 358,905 2,338,985 Court fines 452,891 - 452,891 Special assessments - 9,128 9,128
Total deferred inflows of resources 2,432,971 368,033 2,801,004
Total liabilities and deferred inflows of resources 21,121,579 8,668,651 29,790,230
Fund balancesNonspendable:
Inventory 1,025,496 - 1,025,496 Parks and cemetery care - 381,019 381,019 Real estate held for resale 6,160 - 6,160
Restricted for:Capital projects - 50,835,124 50,835,124 Culture and recreation - 169,374 169,374 Debt service - 600,472 600,472 Housing and community development - 246,965 246,965 Municipal information 1,471,560 - 1,471,560 Public works 636,582 636,582 Public safety - 1,658,699 1,658,699 Tax increment zone activities - 42,551,716 42,551,716 Waco Public Improvement District - 1,148,686 1,148,686
Committed to:Capital projects - 20,797,066 20,797,066 Economic development 14,496,364 - 14,496,364 Public health - 3,240,719 3,240,719
Assigned to:Capital improvements 12,917,754 - 12,917,754 Culture and recreation 8,236 - 8,236 Economic development 3,958,032 - 3,958,032 Other 1,138,853 - 1,138,853 Public safety 757,889 - 757,889 Public works 245,706 - 245,706 Subsequent year's budget appropriation 7,979,534 - 7,979,534
Unassigned 48,089,822 - 48,089,822
Total fund balances 92,095,406$ 122,266,422$ 214,361,828$
Total liabilities, deferred inflows of resources, and fund balances $ 113,216,985 $ 130,935,073 $ 244,152,058
See accompanying notes to financial statements.
City of Waco, TexasBalance Sheet
Governmental Funds September 30, 2020
26
DRAFT

Amounts reported for governmental activities in the statement of net position are different because:
Total fund balances - governmental funds (page 26) $ 214,361,828
Capital assets used in governmental activities are not financial resources and, therefore, are not reported in the funds. 322,179,170
Other long-term assets are not available to pay for current-period expenditures and, therefore, deferred in the funds. 2,801,004
Internal service funds are used by management to charge the costs of certain services to individual funds. The assets and liabilities of the internal service funds are included in the governmental activities in the statement of net position. 15,658,685
Long-term liabilities are not due and payable in the current period and, therefore, are not reported in the funds. (200,222,285)
Net position of governmental activities (page 25) $ 354,778,402
See accompanying notes to financial statements.
September 30, 2020Reconciliation of the Balance Sheet to the Statement of Net Position
City of Waco, Texas
27
DRAFT

General FundTotal Nonmajor
Funds
Total Governmental
FundsRevenues:
Taxes 107,848,201$ 25,152,357$ 133,000,558$ Special assessments - 630,654 630,654 Business and occupation fees 14,480,403 - 14,480,403 Permits, licenses and fees 1,980,690 986,740 2,967,430 Fines 1,281,770 368,246 1,650,016 Charges for services 1,921,824 - 1,921,824 Investment earnings 1,175,429 2,647,615 3,823,044 Contributions 779,925 50,000 829,925 Intergovernmental 9,631,875 10,318,776 19,950,651 Program income - 227,685 227,685 Other 13,293,399 960,504 14,253,903
Total revenues 152,393,516 41,342,577 193,736,093
Expenditures:Current:
General government 27,574,920 11,396,502 38,971,422 Public safety 77,593,423 2,417,640 80,011,063 Public works 7,264,287 661,926 7,926,213 Culture and recreation 15,189,397 7,054 15,196,451 Housing and community development 381,159 2,544,250 2,925,409 Public health - 8,813,617 8,813,617
Debt service:Principal - 7,590,000 7,590,000 Interest and fiscal charges - 4,553,085 4,553,085 Bond issuance costs - 123,993 123,993
Capital outlay - 21,821,248 21,821,248 Total expenditures 128,003,186 59,929,315 187,932,501
Excess (deficiency) of revenues over expenditures 24,390,330 (18,586,738) 5,803,592
Other financing sources (uses):General obligation bonds issued - 26,210,000 26,210,000 Premium on general obligation bonds - 2,551,941 2,551,941 Transfers in 7,192,479 24,380,433 31,572,912 Transfers out (26,811,221) (6,203,051) (33,014,272)
Total other financing sources (uses) (19,618,742) 46,939,323 27,320,581
Net change in fund balances 4,771,588 28,352,585 33,124,173 Fund balances, beginning of year 87,323,818 93,913,837 181,237,655 Fund balances, end of year 92,095,406$ 122,266,422$ 214,361,828$
See accompanying notes to financial statements.
City of Waco, TexasStatement of Revenues, Expenditures and Changes in Fund Balances
Governmental FundsYear Ended September 30, 2020
28
DRAFT

Amounts reported for governmental activities in the statement of activities(pages 24 - 25) are different because:
Net change in fund balances - total governmental funds (page 28) $ 33,124,173
Governmental funds report capital outlays as expenditures. However, in thestatement of activities, the cost of those assets is allocated over their estimateduseful lives and reported as depreciation expense. This is the amount by whichcapital outlay exceeded depreciation in the current period. 12,937,725
The net effect of various miscellaneous transactions involving capital assets(i.e., sales, transfers, trade-ins, and donations) is to increase net position. 4,483,383
Revenues in the statement of activities that do not provide current financialresources are not reported as revenues in the funds. (137,940)
The issuance of long-term debt (e.g., bonds, notes payable) provides currentfinancial resources to governmental funds, while the repayment of the principalof long-term debt consumes the current financial resources of governmentalfunds. Neither transaction, however, has any effect on net position. Also,governmental funds report the effect of premiums and similar items when debtis first issued, whereas these amounts are deferred and amortized in thestatement of activities. This amount is the net effect of these differences in thetreatment of long-term debt and related items. (21,010,519)
Some expenses reported in the statement of activities do not require the use ofcurrent financial resources and, therefore, are not reported as expenditures ingovernmental funds. (1,704,205)
Internal service funds are used by management to charge the costs of certainservices to individual funds. The change in net position of internal servicefunds is reported with governmental activities. 2,688,820
Change in net position of governmental activities (pages 24 - 25) $ 30,381,437
See accompanying notes to financial statements.
Year Ended September 30, 2020to the Statement of Activities
and Changes in Fund Balances of Governmental FundsReconciliation of the Statement of Revenues, Expenditures
City of Waco, Texas
29
DRAFT
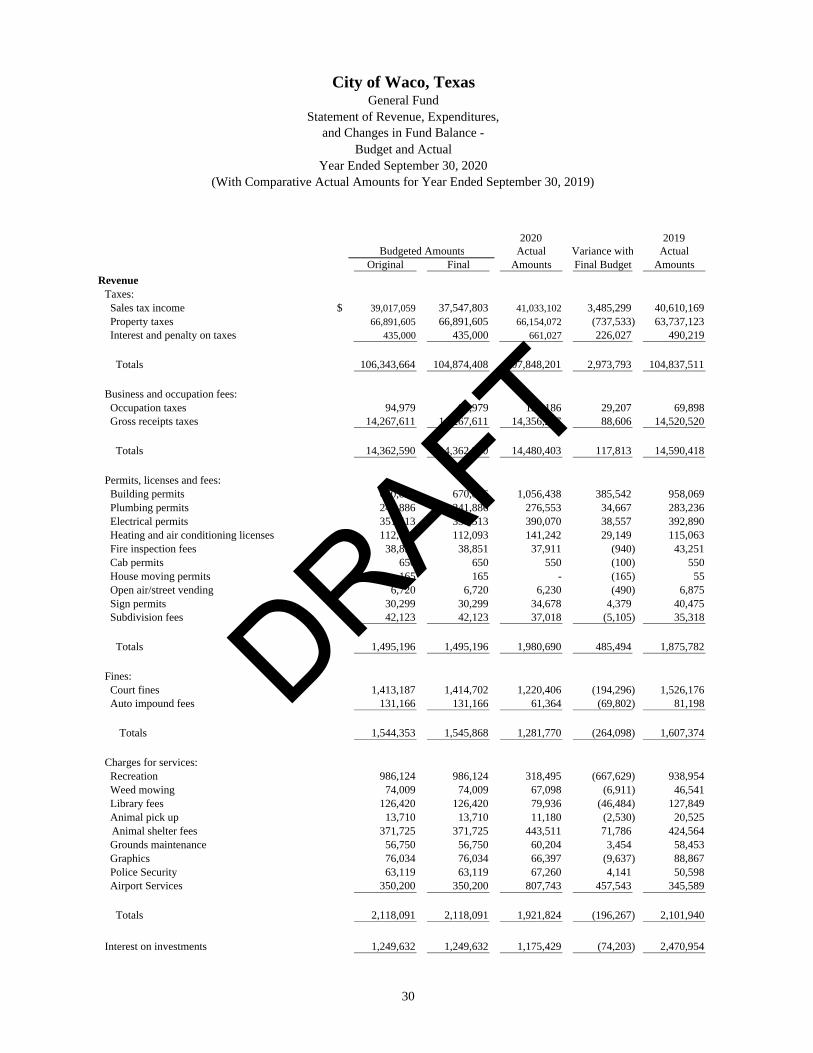
City of Waco, TexasGeneral Fund
Statement of Revenue, Expenditures, and Changes in Fund Balance -
Budget and ActualYear Ended September 30, 2020
(With Comparative Actual Amounts for Year Ended September 30, 2019)
2020 2019Budgeted Amounts Actual Variance with Actual
Original Final Amounts Final Budget Amounts
RevenueTaxes: Sales tax income $ 39,017,059 37,547,803 41,033,102 3,485,299 40,610,169 Property taxes 66,891,605 66,891,605 66,154,072 (737,533) 63,737,123 Interest and penalty on taxes 435,000 435,000 661,027 226,027 490,219
Totals 106,343,664 104,874,408 107,848,201 2,973,793 104,837,511
Business and occupation fees: Occupation taxes 94,979 94,979 124,186 29,207 69,898 Gross receipts taxes 14,267,611 14,267,611 14,356,217 88,606 14,520,520
Totals 14,362,590 14,362,590 14,480,403 117,813 14,590,418
Permits, licenses and fees: Building permits 670,896 670,896 1,056,438 385,542 958,069 Plumbing permits 241,886 241,886 276,553 34,667 283,236 Electrical permits 351,513 351,513 390,070 38,557 392,890 Heating and air conditioning licenses 112,093 112,093 141,242 29,149 115,063 Fire inspection fees 38,851 38,851 37,911 (940) 43,251 Cab permits 650 650 550 (100) 550 House moving permits 165 165 - (165) 55 Open air/street vending 6,720 6,720 6,230 (490) 6,875 Sign permits 30,299 30,299 34,678 4,379 40,475 Subdivision fees 42,123 42,123 37,018 (5,105) 35,318
Totals 1,495,196 1,495,196 1,980,690 485,494 1,875,782
Fines: Court fines 1,413,187 1,414,702 1,220,406 (194,296) 1,526,176 Auto impound fees 131,166 131,166 61,364 (69,802) 81,198
Totals 1,544,353 1,545,868 1,281,770 (264,098) 1,607,374
Charges for services: Recreation 986,124 986,124 318,495 (667,629) 938,954 Weed mowing 74,009 74,009 67,098 (6,911) 46,541 Library fees 126,420 126,420 79,936 (46,484) 127,849 Animal pick up 13,710 13,710 11,180 (2,530) 20,525
Animal shelter fees 371,725 371,725 443,511 71,786 424,564 Grounds maintenance 56,750 56,750 60,204 3,454 58,453 Graphics 76,034 76,034 66,397 (9,637) 88,867 Police Security 63,119 63,119 67,260 4,141 50,598 Airport Services 350,200 350,200 807,743 457,543 345,589
Totals 2,118,091 2,118,091 1,921,824 (196,267) 2,101,940
Interest on investments 1,249,632 1,249,632 1,175,429 (74,203) 2,470,954
30
DRAFT

City of Waco, TexasGeneral Fund
Statement of Revenue, Expenditures, and Changes in Fund Balance -
Budget and ActualYear Ended September 30, 2020
(With Comparative Actual Amounts for Year Ended September 30, 2019)
2020 2019Budgeted Amounts Actual Variance with Actual
Original Final Amounts Final Budget Amounts
Revenues (continued)Contributions 627,782 852,782 779,925 (72,857) 677,457
Intergovernmental 1,809,669 8,124,493 9,631,875 1,507,382 2,121,293
Other: Indirect expense reimbursements 9,097,290 9,097,290 9,046,939 (50,351) 9,444,613 False alarm fines 15,250 15,250 11,150 (4,100) 14,750 BSC civil penalties 7,770 7,770 2,912 (4,858) - Rents from real estate 406,711 406,711 181,095 (225,616) 427,659 Miscellaneous revenue 3,285,015 3,331,099 3,252,327 (78,772) 3,822,857 Sale of real estate 100,000 100,000 3,222 (96,778) 519,130 Sale of other scrap 9,592 9,592 9,880 288 8,686 Zoning applications 39,675 39,675 51,350 11,675 53,775 Commission from sale of mixed drinks 614,759 614,759 534,099 (80,660) 707,292 Commission on municipal court fines 55,078 55,078 48,465 (6,613) 53,957 Commission on concessions 267,971 267,971 146,815 (121,156) 269,796 Garage sale permits 18,150 18,150 4,110 (14,040) 16,630 Special assessments 1,315 1,315 1,035 (280) 790 Totals 13,918,576 13,964,660 13,293,399 (671,261) 15,339,935
Total revenue 143,469,553 148,587,720 152,393,516 3,805,796 145,622,664
ExpendituresGeneral Government
Administrative Services:Salaries and wages 1,102,884 1,102,884 1,442,473 (339,589) 912,981 Employee benefits 292,342 292,342 377,889 (85,547) 249,664 Purchased professional/technical services 180,258 330,258 202,945 127,313 154,257 Purchased property services 39,000 39,000 11,392 27,608 23,112 Other purchased services 720,712 739,248 625,915 113,333 696,197 Supplies 115,732 115,732 97,877 17,855 105,985 Capital expenditures - - 20,476 (20,476) - Other expenses 7,300 121,704 17,787 103,917 27,055
Total Administrative Services 2,458,228 2,741,168 2,796,754 (55,586) 2,169,251
City Secretary:Salaries and wages 369,448 369,448 433,230 (63,782) 329,939 Employee benefits 137,536 137,536 158,232 (20,696) 128,289 Purchased professional/technical services 200,357 264,566 109,827 154,739 47,777 Purchased property services - - - - 230 Maintenance 31,182 31,182 36,692 (5,510) 33,813 Other purchased services 36,443 36,443 25,329 11,114 27,783 Supplies 19,984 28,733 40,805 (12,072) 30,408
Total City Secretary 794,950 867,908 804,115 63,793 598,239
Finance Services:Salaries and wages 1,902,512 1,902,512 1,650,077 252,435 1,515,370 Employee benefits 616,820 616,820 544,339 72,481 506,450 Purchased professional/technical services 246,386 246,386 142,426 103,960 140,338
(Continued)31
DRAFT

City of Waco, TexasGeneral Fund
Statement of Revenue, Expenditures, and Changes in Fund Balance -
Budget and ActualYear Ended September 30, 2020
(With Comparative Actual Amounts for Year Ended September 30, 2019)
2020 2019Budgeted Amounts Actual Variance with Actual
Original Final Amounts Final Budget Amounts
Expenditures (continued)General Government (continued)
Finance Services: (continued)Purchased property services 1,000 1,000 500 500 500 Maintenance 7,310 7,310 - 7,310 159 Other purchased services 60,344 61,225 31,937 29,288 43,005 Supplies 29,710 293,885 278,189 15,696 39,361 Capital expenditures - - 16,209 (16,209) 9,304 Other expenses 78,000 78,000 60,976 17,024 59,779
Total Finance Services 2,942,082 3,207,138 2,724,653 482,485 2,314,266
Legal Services:Salaries and wages 939,578 939,578 921,254 18,324 895,484 Employee benefits 284,656 284,656 277,271 7,385 273,800 Purchased professional/technical services 4,450 4,450 69 4,381 67 Maintenance 300 300 - 300 - Other purchased services 33,974 33,974 19,432 14,542 30,251 Supplies 35,125 35,125 40,064 (4,939) 36,991
Total Legal Services 1,298,083 1,298,083 1,258,090 39,993 1,236,593
Planning Services:Salaries and wages 541,570 541,570 582,063 (40,493) 530,550 Employee benefits 186,732 186,732 175,268 11,464 175,826 Purchased professional/technical services 31,000 210,229 138,136 72,093 48,205 Purchased property services 65,784 65,784 61,284 4,500 67,284 Maintenance 4,100 4,100 1,230 2,870 455 Other purchased services 20,042 20,042 18,810 1,232 23,359 Supplies 37,490 37,490 25,820 11,670 45,141
Total Planning Services 886,718 1,065,947 1,002,611 63,336 890,820
Human Resources:Salaries and wages 887,692 887,692 910,051 (22,359) 795,761 Employee benefits 290,368 290,368 295,106 (4,738) 271,457 Purchased professional/technical services 42,580 43,521 25,935 17,586 54,059 Purchased property services 1,500 - - - - Maintenance 2,553 5,738 6,615 (877) 4,266 Other purchased services 132,354 117,615 79,547 38,068 112,854 Supplies 15,650 28,704 20,398 8,306 18,310
Total Human Resources 1,372,697 1,373,638 1,337,652 35,986 1,256,707
Municipal Information:Salaries and wages 564,486 564,486 579,205 (14,719) 550,096 Employee benefits 198,892 198,892 200,784 (1,892) 194,751 Purchased professional/technical services 28,890 28,890 54,386 (25,496) 36,188 Maintenance 54,888 54,888 21,259 33,629 21,361 Other purchased services 18,776 18,776 19,485 (709) 19,276 Supplies 67,164 67,164 40,802 26,362 42,038 Other expenses 24,000 24,000 22,498 1,502 22,876 Capital expenditures 50,000 50,000 39,918 10,082 172,470
Total Public Information Services 1,007,096 1,007,096 978,337 28,759 1,059,056
(Continued)32
DRAFT

City of Waco, TexasGeneral Fund
Statement of Revenue, Expenditures, and Changes in Fund Balance -
Budget and ActualYear Ended September 30, 2020
(With Comparative Actual Amounts for Year Ended September 30, 2019)
2020 2019Budgeted Amounts Actual Variance with Actual
Original Final Amounts Final Budget Amounts
Expenditures (continued)General Government (continued)
Information Technology Services:Salaries and wages 1,884,676 1,859,676 1,821,231 38,445 1,721,159 Employee benefits 648,556 648,556 625,082 23,474 610,148 Purchased professional/technical services 302,223 346,922 162,450 184,472 174,039 Maintenance 1,357,013 1,406,484 1,066,504 339,980 1,336,366 Other purchased services 463,110 498,810 442,219 56,591 395,251 Supplies 112,888 137,761 145,025 (7,264) 102,672 Capital expenditures 1,351,083 1,416,457 1,119,656 296,801 246,627
Total Information Technology Services 6,119,549 6,314,666 5,382,167 932,499 4,586,262
Purchasing Services:Salaries and wages 526,590 526,590 529,811 (3,221) 507,251 Employee benefits 181,128 181,128 182,537 (1,409) 176,559 Purchased professional/technical services 200 800 800 - - Maintenance 360 360 217 143 284 Other purchased services 25,807 22,984 14,336 8,648 21,369 Supplies 9,892 12,115 9,455 2,660 10,058
Total Purchasing Services 743,977 743,977 737,156 6,821 715,521
Facilities:Salaries and wages 1,174,902 1,174,902 975,908 198,994 856,929 Employee benefits 513,392 513,392 433,973 79,419 424,243 Purchased professional/technical services 752,101 1,021,889 842,741 179,148 902,806 Purchased property services 6,420 6,420 10,656 (4,236) 10,309 Maintenance 1,648,607 1,520,319 1,116,718 403,601 1,117,597 Other purchased services 57,142 57,142 55,497 1,645 64,194 Supplies 237,604 267,622 209,844 57,778 228,414 Capital expenditures - 174,556 173,960 596 13,290
Total Facilities 4,390,168 4,736,242 3,819,297 916,945 3,617,782
Economic DevelopmentSalaries and wages 317,356 317,356 259,499 57,857 296,531 Employee benefits 96,764 96,764 75,734 21,030 89,176 Purchased professional/technical services 10,300 10,300 15,560 (5,260) 7,790 Purchased property services 2,500 2,500 - 2,500 - Other purchased services 33,414 33,414 6,491 26,923 18,399 Supplies 9,375 9,375 3,213 6,162 6,760
Total Economic Development 469,709 469,709 360,497 109,212 418,656
Economic Development Incentive Purchased professional/technical services 2,500,000 2,500,000 1,658,259 841,741 175,000 Other expense 11,402,191 - 402,653 (402,653) -
Total Economic Development Incentive 13,902,191 2,500,000 2,060,912 439,088 175,000
Contributions:McLennan County 166,250 166,250 167,518 (1,268) 158,746 HOTRMHMR 39,322 99,322 58,798 40,524 39,322
(Continued)
33
DRAFT

City of Waco, TexasGeneral Fund
Statement of Revenue, Expenditures, and Changes in Fund Balance -
Budget and ActualYear Ended September 30, 2020
(With Comparative Actual Amounts for Year Ended September 30, 2019)
2020 2019Budgeted Amounts Actual Variance with Actual
Original Final Amounts Final Budget Amounts
Expenditures (continued)General Government (continued)
Contributions: (continued)H. O. T. Council of Governments 12,000 12,000 11,652 348 11,652 The Advocacy Center 84,419 84,419 84,419 - 84,419 Greater Waco Chamber 165,000 165,000 165,000 - 165,000 Central Texas African American Chamber 93,000 93,000 93,000 - 93,000 Cen-Tex Hispanic Chamber 118,000 165,500 133,000 32,500 118,000 City Center Waco 234,000 234,000 234,000 - 239,000 Central Texas Senior Ministry 35,000 35,000 35,000 - 28,000 Economic Development Grants 635,000 635,000 495,290 139,710 (26,228) McLennan County Appraisal District 852,100 852,100 704,375 147,725 729,845 Greater Waco Collective Impact Initative 100,000 355,000 266,667 88,333 75,000 Historic Waco Foundation/Arts-Historic Agencies 29,250 29,250 29,250 - 29,250 Creative Waco 377,000 408,325 326,000 82,325 406,915 HOT Goodwill Industries, Inc. 71,412 77,363 53,559 23,804 65,461 The Cove - - - - 52,291 Caritas of Waco 50,000 50,000 31,677 18,323 45,163 CampusTown 29,000 36,250 29,000 7,250 21,750
Total Contributions 3,090,753 3,497,779 2,918,205 579,574 2,336,586
Miscellaneous:Salaries and wages (870,318) (870,318) 202,575 (1,072,893) - Employee benefits 80,002 80,002 131,118 (51,116) 37,258 Purchased professional/technical services 683,500 743,763 547,678 196,085 443,468 Purchased property services - - - - 259 Maintenance 8,765 8,765 35,127 (26,362) 4,507 Other purchased services 1,412 1,412 3,588 (2,176) 287 Supplies 3,933 3,933 96,351 (92,418) 5,297 Capital expenditures - - 28,367 (28,367) 75,185 Other expenses 3,149,152 1,694,040 349,670 1,344,370 347,315
Total Miscellaneous 3,056,446 1,661,597 1,394,474 267,123 913,576
Total General Government 42,532,647 31,484,948 27,574,920 3,910,028 22,288,315
Public WorksStreets and Drainage Services:
Salaries and wages 1,746,616 1,746,616 1,746,019 597 1,211,822 Employee benefits 841,982 841,982 804,816 37,166 681,146 Purchased professional/technical services 2,094,709 2,866,300 2,989,033 (122,733) 2,871,095 Purchased property services 23,544 23,544 19,209 4,335 19,236 Maintenance 1,440,480 1,420,480 950,787 469,693 1,131,977 Other purchased services 110,653 110,653 104,027 6,626 106,247 Supplies 309,124 309,124 282,525 26,599 250,299 Other expenses 161,422 161,422 161,422 - 221,392 Capital expenditures 179,000 302,008 206,449 95,559 119,993
Total Streets and Drainage Services 6,907,530 7,782,129 7,264,287 517,842 6,613,207
Total Public Works 6,907,530 7,782,129 7,264,287 517,842 6,613,207
(Continued)
34
DRAFT

City of Waco, TexasGeneral Fund
Statement of Revenue, Expenditures, and Changes in Fund Balance -
Budget and ActualYear Ended September 30, 2020
(With Comparative Actual Amounts for Year Ended September 30, 2019)
2020 2019Budgeted Amounts Actual Variance with Actual
Original Final Amounts Final Budget Amounts
Expenditures (continued)Public Safety
Municipal Court:Salaries and wages 799,872 799,872 843,022 (43,150) 790,970 Employee benefits 289,178 289,178 295,433 (6,255) 296,163 Purchased professional/technical services 45,560 45,560 20,992 24,568 46,187 Maintenance 2,200 2,200 70,073 (67,873) 12,682 Other purchased services 26,238 26,238 13,127 13,111 19,601 Supplies 84,526 86,041 59,943 26,098 73,238 Other expenses 13,928 13,928 9,839 4,089 10,064
Total Municipal Court 1,261,502 1,263,017 1,312,429 (49,412) 1,248,905
Inspection Services:Salaries and wages 1,467,988 1,467,988 1,379,868 88,120 1,274,768 Employee benefits 542,632 542,632 513,171 29,461 482,019 Purchased professional/technical services 158,209 158,475 128,375 30,100 124,096 Purchased property services 72,144 72,144 64,232 7,912 69,381 Maintenance 35,740 35,740 17,170 18,570 57,293 Other purchased services 64,992 64,992 53,255 11,737 63,939 Supplies 50,576 56,321 53,484 2,837 76,129 Capital expenditures - - - - 48,620 Other expenses 34,664 34,664 48,807 (14,143) 38,469
Totals Inspection Services 2,426,945 2,432,956 2,258,362 174,594 2,234,714
Emergency Management Services:Salaries and wages 325,158 325,158 288,386 36,772 315,941 Employee benefits 120,438 120,438 107,096 13,342 118,088 Purchased professional/technical services 28,528 28,528 31,588 (3,060) 15,058 Purchased property services 3,000 2,900 - 2,900 550 Maintenance 482,972 587,375 438,070 149,305 325,849 Other purchased services 60,705 60,705 12,394 48,311 39,264 Supplies 332,158 332,258 339,684 (7,426) 42,887 Capital expenditures - - - - 284,149 Other expenses 138,390 138,390 110,983 27,407 114,600
Total Emergency Management Services 1,491,349 1,595,752 1,328,201 267,551 1,256,386
Fire Services:Salaries and wages 17,964,710 17,964,710 18,648,992 (684,282) 17,562,937 Employee benefits 6,566,548 6,566,548 6,571,751 (5,203) 6,332,222 Purchased professional/technical services 130,217 237,935 156,405 81,530 94,841 Purchased property services 70,020 66,160 77,967 (11,807) 63,440 Maintenance 712,473 852,860 466,342 386,518 588,781 Other purchased services 412,791 376,685 386,942 (10,257) 391,258 Supplies 751,292 848,227 745,268 102,959 776,056 Capital expenditures 56,000 138,500 245,993 (107,493) 329,517
Total Fire Services 26,664,051 27,051,625 27,299,660 (248,035) 26,139,052
(Continued)
35
DRAFT

City of Waco, TexasGeneral Fund
Statement of Revenue, Expenditures, and Changes in Fund Balance -
Budget and ActualYear Ended September 30, 2020
(With Comparative Actual Amounts for Year Ended September 30, 2019)
2020 2019Budgeted Amounts Actual Variance with Actual
Original Final Amounts Final Budget Amounts
Expenditures (continued)Public Safety (continued)
Police Services:Salaries and wages 26,441,498 26,442,282 26,256,928 185,354 25,213,403 Employee benefits 9,444,011 9,444,011 9,248,359 195,652 9,075,327 Purchased professional/technical services 840,117 858,711 768,888 89,823 615,254 Purchased property services 116,166 116,166 107,357 8,809 141,481 Maintenance 1,155,409 1,213,078 1,097,831 115,247 1,008,614 Other purchased services 1,119,833 1,120,860 995,545 125,315 1,111,848 Supplies 2,407,855 2,549,263 2,083,208 466,055 1,804,254 Capital expenditures 39,000 407,237 165,580 241,657 359,594 Other expenses 900 900 1,209 (309) 1,285
Total Police Services 41,564,789 42,152,508 40,724,905 1,427,603 39,331,060
Traffic ServicesSalaries and wages 1,084,318 1,084,318 733,276 351,042 766,133 Employee benefits 454,590 454,590 322,134 132,456 368,181 Purchased professional/technical services 122,761 215,646 160,489 55,157 124,568 Purchased property services 2,664 2,664 2,315 349 2,231 Maintenance 804,703 753,094 682,043 71,051 675,426 Other purchased services 34,456 34,456 27,115 7,341 33,010 Supplies 751,728 753,578 680,549 73,029 661,161 Capital expenditures 833,000 432,792 306,212 126,580 252,722
Totals Traffic Services 4,088,220 3,731,138 2,914,133 817,005 2,883,432
Animal ServicesSalaries and wages 895,024 895,024 727,516 167,508 711,239 Employee benefits 367,836 367,836 307,013 60,823 318,194 Purchased professional/technical services 327,974 327,974 219,020 108,954 282,052 Purchased property services 21,900 21,900 20,349 1,551 20,224 Maintenance 69,787 69,787 51,713 18,074 52,095 Other purchased services 73,804 73,804 72,235 1,569 78,147 Supplies 462,613 462,613 296,967 165,646 345,166 Capital expenditures - 42,698 60,920 (18,222) 9,130 Other expenses 1,000 1,000 - 1,000 -
Totals Animal Services 2,219,938 2,262,636 1,755,733 506,903 1,816,247
Total Public Safety 79,716,794 80,489,632 77,593,423 2,896,209 74,909,796
Culture & RecreationLibrary Services:
Salaries and wages 2,104,390 2,104,390 1,941,237 163,153 1,891,544 Employee benefits 769,718 769,718 718,573 51,145 726,927 Purchased professional/technical services 153,545 190,102 180,466 9,636 174,979 Purchased property services 27,816 27,816 21,074 6,742 19,971 Maintenance 157,276 168,333 154,917 13,416 147,605 Other purchased services 148,240 149,191 154,333 (5,142) 142,633 Supplies 775,042 784,249 758,365 25,884 745,461
(Continued)
36
DRAFT
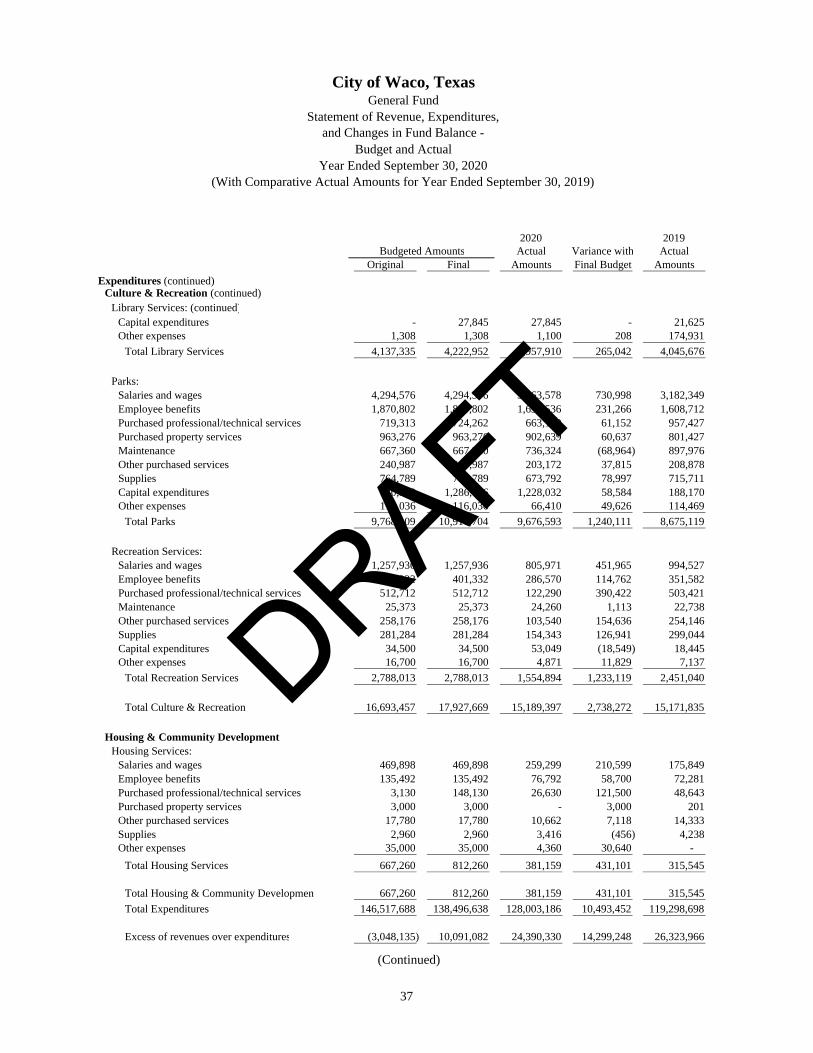
City of Waco, TexasGeneral Fund
Statement of Revenue, Expenditures, and Changes in Fund Balance -
Budget and ActualYear Ended September 30, 2020
(With Comparative Actual Amounts for Year Ended September 30, 2019)
2020 2019Budgeted Amounts Actual Variance with Actual
Original Final Amounts Final Budget Amounts
Expenditures (continued)Culture & Recreation (continued)
Library Services: (continued)Capital expenditures - 27,845 27,845 - 21,625 Other expenses 1,308 1,308 1,100 208 174,931
Total Library Services 4,137,335 4,222,952 3,957,910 265,042 4,045,676
Parks:Salaries and wages 4,294,576 4,294,576 3,563,578 730,998 3,182,349 Employee benefits 1,870,802 1,870,802 1,639,536 231,266 1,608,712 Purchased professional/technical services 719,313 724,262 663,110 61,152 957,427 Purchased property services 963,276 963,276 902,639 60,637 801,427 Maintenance 667,360 667,360 736,324 (68,964) 897,976 Other purchased services 240,987 240,987 203,172 37,815 208,878 Supplies 764,789 752,789 673,792 78,997 715,711 Capital expenditures 130,970 1,286,616 1,228,032 58,584 188,170 Other expenses 116,036 116,036 66,410 49,626 114,469
Total Parks 9,768,109 10,916,704 9,676,593 1,240,111 8,675,119
Recreation Services:Salaries and wages 1,257,936 1,257,936 805,971 451,965 994,527 Employee benefits 401,332 401,332 286,570 114,762 351,582 Purchased professional/technical services 512,712 512,712 122,290 390,422 503,421 Maintenance 25,373 25,373 24,260 1,113 22,738 Other purchased services 258,176 258,176 103,540 154,636 254,146 Supplies 281,284 281,284 154,343 126,941 299,044 Capital expenditures 34,500 34,500 53,049 (18,549) 18,445 Other expenses 16,700 16,700 4,871 11,829 7,137
Total Recreation Services 2,788,013 2,788,013 1,554,894 1,233,119 2,451,040
Total Culture & Recreation 16,693,457 17,927,669 15,189,397 2,738,272 15,171,835
Housing & Community DevelopmentHousing Services:
Salaries and wages 469,898 469,898 259,299 210,599 175,849 Employee benefits 135,492 135,492 76,792 58,700 72,281 Purchased professional/technical services 3,130 148,130 26,630 121,500 48,643 Purchased property services 3,000 3,000 - 3,000 201 Other purchased services 17,780 17,780 10,662 7,118 14,333 Supplies 2,960 2,960 3,416 (456) 4,238 Other expenses 35,000 35,000 4,360 30,640 -
Total Housing Services 667,260 812,260 381,159 431,101 315,545
Total Housing & Community Development 667,260 812,260 381,159 431,101 315,545
Total Expenditures 146,517,688 138,496,638 128,003,186 10,493,452 119,298,698
Excess of revenues over expenditures (3,048,135) 10,091,082 24,390,330 14,299,248 26,323,966
(Continued)
37
DRAFT
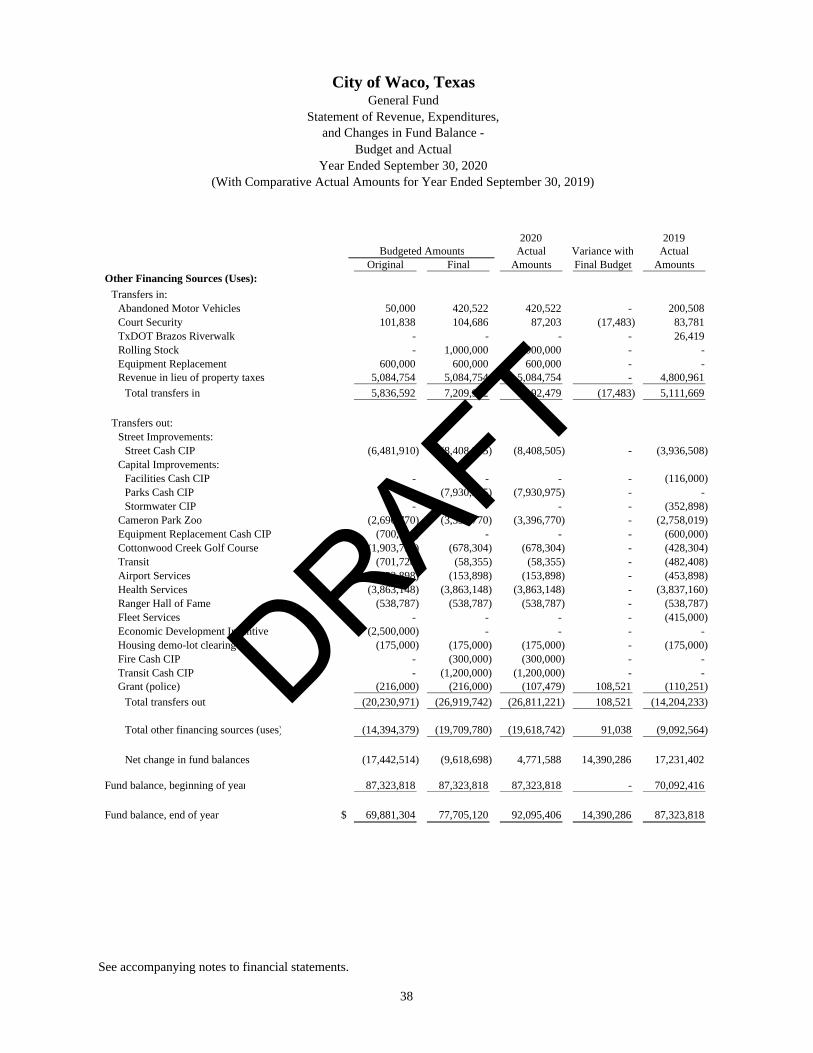
City of Waco, TexasGeneral Fund
Statement of Revenue, Expenditures, and Changes in Fund Balance -
Budget and ActualYear Ended September 30, 2020
(With Comparative Actual Amounts for Year Ended September 30, 2019)
2020 2019Budgeted Amounts Actual Variance with Actual
Original Final Amounts Final Budget AmountsOther Financing Sources (Uses):
Transfers in:Abandoned Motor Vehicles 50,000 420,522 420,522 - 200,508 Court Security 101,838 104,686 87,203 (17,483) 83,781 TxDOT Brazos Riverwalk - - - - 26,419 Rolling Stock - 1,000,000 1,000,000 - - Equipment Replacement 600,000 600,000 600,000 - - Revenue in lieu of property taxes 5,084,754 5,084,754 5,084,754 - 4,800,961
Total transfers in 5,836,592 7,209,962 7,192,479 (17,483) 5,111,669
Transfers out:Street Improvements:
Street Cash CIP (6,481,910) (8,408,505) (8,408,505) - (3,936,508) Capital Improvements:
Facilities Cash CIP - - - - (116,000) Parks Cash CIP - (7,930,975) (7,930,975) - - Stormwater CIP - - - - (352,898)
Cameron Park Zoo (2,696,770) (3,396,770) (3,396,770) - (2,758,019) Equipment Replacement Cash CIP (700,000) - - - (600,000) Cottonwood Creek Golf Course (1,903,730) (678,304) (678,304) - (428,304) Transit (701,728) (58,355) (58,355) - (482,408) Airport Services (453,898) (153,898) (153,898) - (453,898) Health Services (3,863,148) (3,863,148) (3,863,148) - (3,837,160) Ranger Hall of Fame (538,787) (538,787) (538,787) - (538,787) Fleet Services - - - - (415,000) Economic Development Incentive (2,500,000) - - - - Housing demo-lot clearing (175,000) (175,000) (175,000) - (175,000) Fire Cash CIP - (300,000) (300,000) - - Transit Cash CIP - (1,200,000) (1,200,000) - - Grant (police) (216,000) (216,000) (107,479) 108,521 (110,251)
Total transfers out (20,230,971) (26,919,742) (26,811,221) 108,521 (14,204,233)
Total other financing sources (uses) (14,394,379) (19,709,780) (19,618,742) 91,038 (9,092,564)
Net change in fund balances (17,442,514) (9,618,698) 4,771,588 14,390,286 17,231,402
Fund balance, beginning of year 87,323,818 87,323,818 87,323,818 - 70,092,416
Fund balance, end of year $ 69,881,304 77,705,120 92,095,406 14,390,286 87,323,818
See accompanying notes to financial statements.
38
DRAFT

39
DRAFT

Governmental Activities
Water Fund Wastewater FundSolid Waste
FundTotal Nonmajor
FundsTotal Enterprise
FundsInternal Service
FundsAssetsCurrent assets:
Cash and investments $ 42,949,857 $ 35,564,202 $ 15,296,490 $ 7,517,813 $ 101,328,362 $ 18,081,364 Accounts receivable, net of allowances 6,519,460 4,553,629 2,052,381 556,189 13,681,659 - Prepaid items 331,329 - - - 331,329 - Due from other funds - - - - - 754,352 Intergovernmental receivable 491,962 647,984 - 5,589,898 6,729,844 - Restricted cash and investments 6,632,529 5,836,639 - - 12,469,168 - Inventories 257,910 27,754 - 1,020,036 1,305,700 200,886
Total current assets 57,183,047 46,630,208 17,348,871 14,683,936 135,846,062 19,036,602 Noncurrent assets:
Restricted cash and investments 50,533,448 73,759,311 237,257 122,413 124,652,429 - Advances to other funds 525,336 - - - 525,336 - Capital assets:
Land 3,180,914 3,361,999 7,157,215 3,400,754 17,100,882 38,800 Buildings 10,073,953 11,553,195 1,370,137 62,075,851 85,073,136 920,153 Improvements other than buildings 345,850,339 176,283,796 30,876,058 68,187,299 621,197,492 118,289 Machinery and equipment 10,229,129 13,585,073 23,358,132 20,244,962 67,417,296 1,772,456 Museum collections - - - 2,274,424 2,274,424 - Construction work in progress 29,459,353 61,544,778 3,521,508 1,556,933 96,082,572 - Intangible water rights 32,482,879 - - - 32,482,879 - Less: accumulated depreciation and amortization (164,982,915) (78,290,443) (44,906,461) (90,620,812) (378,800,631) (1,994,580)
Total noncurrent assets 317,352,436 261,797,709 21,613,846 67,241,824 668,005,815 855,118 Total assets 374,535,483 308,427,917 38,962,717 81,925,760 803,851,877 19,891,720
Deferred outflows of resourcesDeferred losses on refundings of debt 1,948,620 633,255 - - 2,581,875 - Deferred outflows on pension liability 862,808 575,206 575,206 - 2,013,220 -
Total deferred outflows of resources 2,811,428 1,208,461 575,206 - 4,595,095 - Total assets and deferred outflows of resources $ 377,346,911 $ 309,636,378 $ 39,537,923 $ 81,925,760 $ 808,446,972 $ 19,891,720
LiabilitiesCurrent liabilities:
Accounts payable 761,059 1,061,548 1,066,799 399,062 3,288,468 130,276 Accrued liabilities 963,773 285,090 481,567 1,226,663 2,957,093 434,619 Unearned revenue - - - 170,237 170,237 - Due to other funds - - - 1,878,223 1,878,223 - Compensated absences payable 773,237 309,283 406,301 586,369 2,075,190 265,084 Refundable contracts 530,653 - - - 530,653 - Notes payable 94,166 - - - 94,166 - Escrow funds - - - - - 538 Bonds payable 12,235,000 8,540,000 1,195,000 - 21,970,000 - Accrued interest payable 1,533,445 1,232,526 26,567 - 2,792,538 -
Current liabilities payable from restricted assets:
Accounts payable 3,515,052 5,836,639 - - 9,351,691 - Customer deposits 3,117,477 - - - 3,117,477 - Estimated claims and judgments - - - - - 3,314,131
Total current liabilities 23,523,862 17,265,086 3,176,234 4,260,554 48,225,736 4,144,648 Noncurrent liabilities:
Refundable contracts 561,176 192,542 - - 753,718 - Estimated landfill closure and post-closure care costs - - 6,254,242 - 6,254,242 - Advances from other funds - - - 693,704 693,704 - Compensated absences payable 512,516 178,361 474,273 451,950 1,617,100 88,387 Bonds payable 198,858,649 158,534,321 2,322,461 - 359,715,431 - Notes payable 1,317,650 - - - 1,317,650 - Net pension liability 3,189,292 2,126,194 2,126,194 - 7,441,680 -
Total noncurrent liabilities 204,439,283 161,031,418 11,177,170 1,145,654 377,793,525 88,387 Total liabilities 227,963,145 178,296,504 14,353,404 5,406,208 426,019,261 4,233,035
Deferred inflows of resourcesDeferred inflows on pension liability 887,136 591,425 591,425 - 2,069,986 -
Total deferred inflows of resources 887,136 591,425 591,425 - 2,069,986 - Total liabilities and deferred inflows of resources 228,850,281 178,887,929 14,944,829 5,406,208 428,089,247 4,233,035
Net positionNet investment in capital assets 105,178,426 95,164,101 18,096,385 67,119,411 285,558,323 855,118 Restricted for:
Capital projects - - - 1,006,408 1,006,408 - Unrestricted 43,318,204 35,584,348 6,496,709 8,393,733 93,792,994 14,803,567
Total net position $ 148,496,630 $ 130,748,449 $ 24,593,094 $ 76,519,552 $ 380,357,725 $ 15,658,685
Business-type Activities
See accompanying notes to financial statements.
City of Waco, TexasStatement of Net Position
Proprietary Funds September 30, 2020
40
DRAFT

Governmental Activities
Water FundWastewater
FundSolid Waste
FundTotal Nonmajor
FundsTotal Enterprise
FundsInternal Service
FundsOperating revenues:
Charges for services $ 52,383,210 $ 37,639,693 $ 21,604,791 $ 5,210,022 $ 116,837,716 $ 24,642,106 Net merchandise sales - - - 855,250 855,250 - Contributions - - - 40,423 40,423 - Other 727,621 645,125 86,712 1,727,359 3,186,817 82,560
Total operating revenues 53,110,831 38,284,818 21,691,503 7,833,054 120,920,206 24,724,666
Operating expenses:Salaries and wages 5,381,938 3,594,631 4,001,338 8,109,689 21,087,596 2,983,701 Employee benefits 2,283,371 1,477,501 1,828,242 2,809,298 8,398,412 1,123,206 Purchased professional/technical services 2,093,061 2,049,031 2,996,754 1,564,383 8,703,229 1,648,903 Purchased property services 168,856 91,675 27,594 798,150 1,086,275 60,407 Maintenance 3,285,735 2,750,824 2,692,330 1,164,875 9,893,764 175,648 Other purchased services 1,421,543 354,744 227,312 1,780,946 3,784,545 1,334,121 Supplies 4,557,168 2,669,199 1,980,764 2,201,425 11,408,556 184,837 Other 5,080,087 4,913,635 4,028,028 2,279,826 16,301,576 14,573,686 Depreciation/amortization 10,912,032 6,838,111 3,540,654 5,852,487 27,143,284 156,368
Total operating expenses 35,183,791 24,739,351 21,323,016 26,561,079 107,807,237 22,240,877
Operating income (loss) 17,927,040 13,545,467 368,487 (18,728,025) 13,112,969 2,483,789
Nonoperating revenues (expenses):Investment earnings 474,308 412,060 160,680 96,176 1,143,224 164,037 Other income 50 24,547 - 218,713 243,310 - Hotel/motel tax - - - 3,138,696 3,138,696 - Contributions - - - 26,800 26,800 - Intergovernmental revenues 258,577 513,898 - 5,974,284 6,746,759 - Bond issuance costs (88,796) (64,953) - - (153,749) - Interest expense and fiscal charges (5,798,554) (4,480,133) (66,336) - (10,345,023) - Gain (loss) on disposal of capital assets - - 190,081 - 190,081 -
Total nonoperating revenues (expenses) (5,154,415) (3,594,581) 284,425 9,454,669 990,098 164,037 Income (loss) before contributions, special items, and transfers 12,772,625 9,950,886 652,912 (9,273,356) 14,103,067 2,647,826
Capital contributions 1,829,961 1,886,839 - 2,665,826 6,382,626 40,994 Special item: Gain on termination of agreement - 29,769,651 - - 29,769,651 - Transfers in 250,000 250,000 - 6,176,114 6,676,114 - Transfers out (3,635,062) (1,029,531) (420,161) (150,000) (5,234,754) -
Changes in net position 11,217,524 40,827,845 232,751 (581,416) 51,696,704 2,688,820 Total net position, beginning of year 137,279,106 89,920,604 24,360,343 77,100,968 328,661,021 12,969,865
Total net position, end of year $ 148,496,630 $ 130,748,449 $ 24,593,094 $ 76,519,552 $ 380,357,725 $ 15,658,685
See accompanying notes to financial statements.
City of Waco, TexasStatement of Revenues, Expenses, and Changes in Net Position
Proprietary FundsYear Ended September 30, 2020
Business-type Activities
41
DRAFT
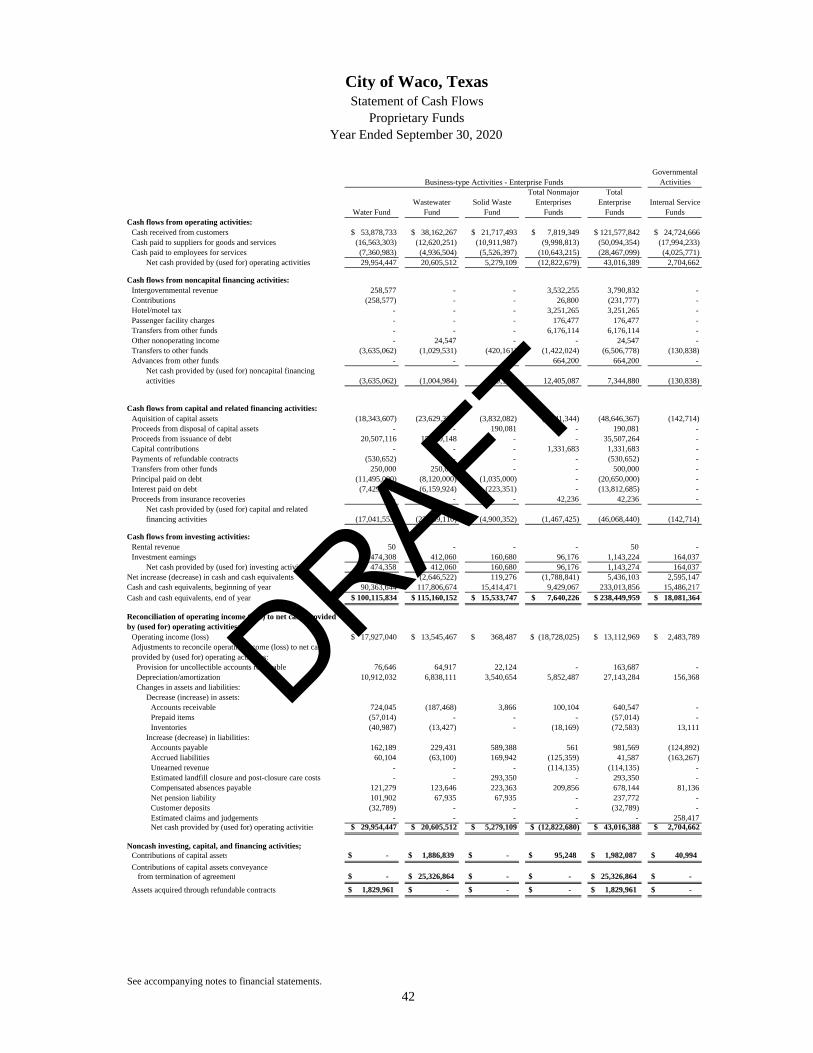
Governmental Activities
Water FundWastewater
FundSolid Waste
Fund
Total Nonmajor Enterprises
Funds
Total Enterprise
FundsInternal Service
FundsCash flows from operating activities:
Cash received from customers $ 53,878,733 $ 38,162,267 $ 21,717,493 $ 7,819,349 $ 121,577,842 $ 24,724,666 Cash paid to suppliers for goods and services (16,563,303) (12,620,251) (10,911,987) (9,998,813) (50,094,354) (17,994,233)Cash paid to employees for services (7,360,983) (4,936,504) (5,526,397) (10,643,215) (28,467,099) (4,025,771)
Net cash provided by (used for) operating activities 29,954,447 20,605,512 5,279,109 (12,822,679) 43,016,389 2,704,662
Cash flows from noncapital financing activities:Intergovernmental revenue 258,577 - - 3,532,255 3,790,832 - Contributions (258,577) - - 26,800 (231,777) - Hotel/motel tax - - - 3,251,265 3,251,265 - Passenger facility charges - - - 176,477 176,477 - Transfers from other funds - - - 6,176,114 6,176,114 - Other nonoperating income - 24,547 - - 24,547 - Transfers to other funds (3,635,062) (1,029,531) (420,161) (1,422,024) (6,506,778) (130,838)Advances from other funds - - - 664,200 664,200 -
Net cash provided by (used for) noncapital financing activities (3,635,062) (1,004,984) (420,161) 12,405,087 7,344,880 (130,838)
Cash flows from capital and related financing activities:Aquisition of capital assets (18,343,607) (23,629,334) (3,832,082) (2,841,344) (48,646,367) (142,714)Proceeds from disposal of capital assets - - 190,081 - 190,081 - Proceeds from issuance of debt 20,507,116 15,000,148 - - 35,507,264 - Capital contributions - - - 1,331,683 1,331,683 - Payments of refundable contracts (530,652) - - - (530,652) - Transfers from other funds 250,000 250,000 - - 500,000 - Principal paid on debt (11,495,000) (8,120,000) (1,035,000) - (20,650,000) - Interest paid on debt (7,429,410) (6,159,924) (223,351) - (13,812,685) - Proceeds from insurance recoveries - - - 42,236 42,236 -
Net cash provided by (used for) capital and related financing activities (17,041,553) (22,659,110) (4,900,352) (1,467,425) (46,068,440) (142,714)
Cash flows from investing activities:Rental revenue 50 - - - 50 - Investment earnings 474,308 412,060 160,680 96,176 1,143,224 164,037
Net cash provided by (used for) investing activities 474,358 412,060 160,680 96,176 1,143,274 164,037 Net increase (decrease) in cash and cash equivalents 9,752,190 (2,646,522) 119,276 (1,788,841) 5,436,103 2,595,147 Cash and cash equivalents, beginning of year 90,363,644 117,806,674 15,414,471 9,429,067 233,013,856 15,486,217 Cash and cash equivalents, end of year $ 100,115,834 $ 115,160,152 $ 15,533,747 $ 7,640,226 $ 238,449,959 $ 18,081,364
Reconciliation of operating income (loss) to net cash provided by (used for) operating activities:
Operating income (loss) $ 17,927,040 $ 13,545,467 $ 368,487 $ (18,728,025) $ 13,112,969 $ 2,483,789 Adjustments to reconcile operating income (loss) to net cash provided by (used for) operating activities:
Provision for uncollectible accounts receivable 76,646 64,917 22,124 - 163,687 - Depreciation/amortization 10,912,032 6,838,111 3,540,654 5,852,487 27,143,284 156,368 Changes in assets and liabilities:
Decrease (increase) in assets:Accounts receivable 724,045 (187,468) 3,866 100,104 640,547 - Prepaid items (57,014) - - - (57,014) - Inventories (40,987) (13,427) - (18,169) (72,583) 13,111
Increase (decrease) in liabilities:Accounts payable 162,189 229,431 589,388 561 981,569 (124,892)Accrued liabilities 60,104 (63,100) 169,942 (125,359) 41,587 (163,267)Unearned revenue - - - (114,135) (114,135) - Estimated landfill closure and post-closure care costs - - 293,350 - 293,350 - Compensated absences payable 121,279 123,646 223,363 209,856 678,144 81,136 Net pension liability 101,902 67,935 67,935 - 237,772 - Customer deposits (32,789) - - - (32,789) - Estimated claims and judgements - - - - - 258,417 Net cash provided by (used for) operating activities $ 29,954,447 $ 20,605,512 $ 5,279,109 $ (12,822,680) $ 43,016,388 $ 2,704,662
Noncash investing, capital, and financing activities;Contributions of capital assets $ - $ 1,886,839 $ - $ 95,248 $ 1,982,087 $ 40,994
Contributions of capital assets conveyance from termination of agreement $ - $ 25,326,864 $ - $ - $ 25,326,864 $ -
Assets acquired through refundable contracts $ 1,829,961 $ - $ - $ - $ 1,829,961 $ -
Business-type Activities - Enterprise Funds
See accompanying notes to financial statements.
City of Waco, TexasStatement of Cash Flows
Proprietary FundsYear Ended September 30, 2020
42
DRAFT

Agency fundsAssets
Cash and investments $ 3,471,514 Intergovernmental receivable 305,074
Total assets $ 3,776,588
LiabilitiesAccrued liabilities 3,776,588
Total liabilities $ 3,776,588
See accompanying notes to financial statements.
City of Waco, TexasStatement of Fiduciary Net Position
September 30, 2020
43
DRAFT

44
DRAFT

45
City of Waco, Texas
Notes to Financial Statements
September 30, 2020 I. Summary of Significant Accounting Policies
A. Reporting Entity
The City of Waco, Texas (the City) is a municipal corporation governed by an elected mayor and a five-member Council. The accompanying financial statements present the government and its component units, entities for which the government is considered to be financially accountable. Each discretely presented component unit is reported in a separate column in the government-wide financial statements (see note below for description) to emphasize that it is legally separate from the government. All fiduciary activities are reported only in the fund financial statements. Discretely presented component units – The following discretely presented component units are included in the reporting entity of the City:
The Baylor Waco Stadium Authority (the Authority) was created in 2014 as a nonprofit local government corporation for the purpose of managing and operating Baylor University’s McLane Stadium (the Stadium) for all events that are not designated Baylor University events. The Authority is governed by five directors who are appointed by the City Council and may be removed by the City Council at any time, with or without cause. In March 2014, the Authority entered into a 30-year tri-party operating agreement with Baylor University (BU) and the City. In the event the operating agreement terminates, operating funds in excess of obligations payable will be used in the following priority: repayment of funds advanced to the Authority by BU that are subject to reimbursement; repairs and maintenance of the Stadium; and distribution to BU and the City in proportion to each entity’s contribution to the construction of the Stadium. Separately issued financial reports for the Authority may be obtained from the Authority at 1001 South M.L.K. Jr. Blvd., Waco, Texas. The Waco Health Facilities Development Corporation (the WHFDC) was created in 1983 under the Health Facilities Development Act as a public, nonprofit corporation for the purpose of issuing obligations in order to finance all or part of the cost of one or more health facilities to assist with the maintenance of public health. The WHFDC is governed by five members who are appointed by the City Council and may only be removed with cause. Additionally, the WHFDC is prohibited from issuing bonded debt without the approval of the City Council. The WHFDC does not issue separate financial statements. Although WHFDC does not issue separate financial statements, the entity’s governmental activity is reported in its respective single fund and all information is presented within the government-wide financial statements.
DRAFT

46
City of Waco, Texas
Notes to Financial Statements (Continued)
I. Summary of Significant Accounting Policies (continued)
B. Government-wide and Fund Financial Statements
The government-wide financial statements (i.e., the statement of net position and the statement of activities) report information on all of the nonfiduciary activities of the primary government and its component units. For the most part, the effect of the interfund activity has been removed from these statements. Governmental activities, which normally are supported by taxes and intergovernmental revenue, are reported separately from business-type activities, which rely to a significant extent on fees and charges for support. Likewise, the primary government is reported separately from certain legally separate component units for which the primary government is financially accountable. The statement of activities demonstrates the degree to which the direct expenses of a given function or segment are offset by program revenue. Direct expenses are those that are clearly identifiable with a specific function or segment. Certain indirect costs have been included as part of the program expenses reported for the various functional activities. Program revenue includes (1) charges to customers or applicants who purchase, use, or directly benefit from goods, services, or privileges provided by a given function or segment, and (2) grants and contributions that are restricted to meeting the operational or capital requirements of a particular function or segment. Taxes and other items not properly included among program revenue are reported instead as general revenue. Separate financial statements are provided for governmental funds, proprietary funds, and fiduciary funds, even though the latter are excluded from the government-wide financial statements. Major individual governmental funds and major individual enterprise funds are reported as separate columns in the fund financial statements.
C. Measurement Focus, Basis of Accounting and Financial Statement Presentation
The accounting and financial reporting treatment is determined by the applicable
measurement focus and basis of accounting. Measurement focus indicates the type of resources being measured such as current financial resources or economic resources.
The basis of accounting indicates the timing of transactions or events for recognition
in the financial statements.
DRAFT

47
City of Waco, Texas
Notes to Financial Statements (Continued)
I. Summary of Significant Accounting Policies (continued)
C. Measurement Focus, Basis of Accounting and Financial Statement Presentation (continued) The government-wide financial statements are reported using the economic resources
measurement focus, and the accrual basis of accounting. Revenues are recorded when earned and expenses are recorded when a liability is incurred, regardless of the timing of the related cash flows. Property taxes are recognized as revenue in the year for which they are levied. Grants and similar items are recognized as revenue as soon as all eligibility requirements imposed by the provider have been met.
The governmental fund financial statements are reported using the current financial
resources measurement focus and the modified accrual basis of accounting. Revenues are recognized as soon as they are both measurable and available. Revenues are considered to be available when they are collectible within the current period or soon enough thereafter to pay liabilities of the current period. For this purpose, the government considers revenues to be available if collected within 60 days of the end of the current fiscal period. Expenditures generally are recorded when a liability is incurred, as under accrual accounting. However, debt service expenditures, as well as expenditures related to compensated absences and claims and judgments, are recorded only when payment is due. General capital asset acquisitions are reported as expenditures in governmental funds. Issuance of long-term debt and acquisitions under capital leases are reported as other financing sources.
The proprietary funds are reported using the economic resources measurement focus
and the accrual basis of accounting for reporting its assets and liabilities. Property taxes, sales taxes, franchise taxes, licenses, and interest associated with the
current fiscal period are all considered to be susceptible to accrual and so have been recognized as revenues of the current fiscal period. Entitlements are recorded as revenues when all eligibility requirements are met, including any time requirements, and the amount is received during the period or within the availability period for this revenue source (within 60 days of year-end). Expenditure-driven grants are recognized as revenue when the qualifying expenditures have been incurred and all other eligibility requirements have been met, and the amount is received during the period or within the availability period for this revenue source (within 60 days of year-end). All other revenue items are considered to be measurable and available only when cash is received by the government.
The City reports the following major governmental funds:
The general fund is the City’s primary operating fund. It accounts for all financial resources of the general government, except those required to be accounted for in another fund.
DRAFT

48
City of Waco, Texas
Notes to Financial Statements (Continued)
I. Summary of Significant Accounting Policies (continued)
C. Measurement Focus, Basis of Accounting and Financial Statement Presentation (continued) The City reports the following major proprietary funds:
The water fund accounts for the activities of the City’s water services.
The wastewater fund accounts for the activities of the City’s sewer services.
The solid waste fund accounts for the activities of the City’s sanitation services.
Additionally, the City reports the following fund types:
Internal service funds account for insurance/risk management services, health insurance, fleet services, and engineering services provided to other departments or agencies of the government on a cost reimbursement basis.
Agency funds account for receipts and disbursements for the Urban Renewal Agency, the Heart of Texas Housing Finance Corporation, Waco Public Improvement District No. 2, and Rural Transit Services.
As a general rule, the effect of interfund activity has been eliminated from the
government-wide financial statements. Exceptions to this general rule are charges between the City’s water and wastewater functions and various other functions of the government. Elimination of these charges would distort the direct costs and program revenue reported for the various functions concerned.
Amounts reported as program revenues include: (1) charges to customers or
applicants for goods, services, or privileges provided, (2) operating grants and contributions, and (3) capital grants and contributions, including special assessments. Internally dedicated resources are reported as general revenues rather than as program revenues. Likewise, general revenues include all taxes.
Proprietary funds distinguish operating revenues and expenses from nonoperating
items. Operating revenues and expenses generally result from providing services and producing and delivering goods in connection with a proprietary fund’s principal ongoing operations. The principal operating revenues of the City’s enterprise funds and internal service funds are charges to customers for sales and services. Operating expenses for enterprise funds and internal service funds include the cost of sales and services, administrative expenses, and depreciation on capital assets. All revenues and expenses not meeting this definition are reported as nonoperating revenues and expenses.
DRAFT

49
City of Waco, Texas
Notes to Financial Statements (Continued)
I. Summary of Significant Accounting Policies (continued)
D. Assets, Liabilities, Deferred Outflows/Inflows of Resources, and Net Position/Fund Balance Deposits and Investments The City’s cash and cash equivalents for purposes of reporting cash flows of
proprietary funds consist of cash on hand, demand deposits, certificates of deposit and deposits in the City’s internal cash and investment pool.
State statutes authorize the City to invest in U. S. Treasury and agency securities,
commercial paper, money market mutual funds, repurchase agreements, and government investment pools.
Investments for the City, as well as for its component units, are reported at fair value.
The City invests in local government investment pools (LGIPs) that were created to function as money market mutual funds within appropriate state laws and regulations. Each of these LGIPs seeks to maintain a constant $1.00 net asset value per share.
The City utilizes valuation techniques that maximize the use of observable inputs and minimize the use of unobservable inputs to the extent possible. The City determines fair value based on assumptions that market participants would use in pricing an asset or liability in the principal or most advantageous market. When considering market participant assumptions in fair value measurements, the following fair value hierarchy distinguishes between observable and unobservable inputs, which are categorized in one of the following levels:
Level 1 Inputs: Unadjusted quoted prices in active markets for identical assets or liabilities accessible to the reporting entity at the measurement date.
Level 2 Inputs: Other than quoted prices included in Level 1 inputs that are observable for the asset or liability, either directly or indirectly, for substantially the full term of the asset or liability.
Level 3 Inputs: Unobservable inputs for the asset or liability used to measure fair value to the extent that observable inputs are not available, thereby allowing for situations in which there is little, if any, market activity for the asset or liability at the measurement date.
DRAFT

50
City of Waco, Texas
Notes to Financial Statements (Continued)
I. Summary of Significant Accounting Policies (continued)
D. Assets, Liabilities, Deferred Outflows/Inflows of Resources, and Net Position/Fund Balance (continued) Receivables and Payables Activity between funds that are representative of lending/borrowing arrangements
outstanding at the end of the fiscal year are referred to as either “due to/from other funds” (i.e., the current portion of interfund loans) or “advances to/from other funds” (i.e., the noncurrent portion of interfund loans). All other outstanding balances between funds are reported as “due to/from other funds”. Any residual balances outstanding between the governmental activities and business-type activities are reported in the government-wide financial statements as “internal balances”.
Advances between funds, as reported in the fund financial statements, are not
available for appropriation and are not expendable available financial resources. All trade and property tax receivables are shown net of an allowance for
uncollectibles. Trade accounts receivable in excess of 120 days are estimated to be uncollectible and comprise the trade accounts receivable allowance for uncollectibles. The property tax receivable allowance is equal to 5.76% of outstanding property taxes at September 30, 2020.
Property taxes are levied on October 1 and attach as an enforceable lien on property
as of January 31. Statements are mailed on October 1, or as soon thereafter as possible, and are due upon receipt. All unpaid taxes become delinquent if not paid before February 1 of the following year.
Inventories and Prepaid Items All inventories are valued using the average cost method. Inventories of
governmental funds are recorded as expenditures when consumed rather than when purchased.
Certain payments to vendors reflect costs applicable to future accounting periods and
are recorded as prepaid items in both the government-wide and fund financial statements. The cost of prepaid items is recorded as expenditures/expenses when consumed rather than when purchased.
Restricted Assets Certain proceeds of the enterprise fund bonds and certain resources set aside for their
repayment, are classified as restricted assets on the balance sheet because their use is limited by applicable bond covenants.
DRAFT

51
City of Waco, Texas
Notes to Financial Statements (Continued)
I. Summary of Significant Accounting Policies (continued)
D. Assets, Liabilities, Deferred Outflows/Inflows of Resources, and Net Position/Fund Balance (continued) Capital Assets Capital assets, which include property, plant, equipment, infrastructure (e.g., roads,
bridges, and similar items), and water rights are reported in the applicable governmental or business-type activities columns in the government-wide financial statements. The City defines capital assets as assets with an initial, individual cost of more than $5,000 and an estimated useful life in excess of one year. Such assets are recorded at historical cost or estimated historical cost if purchased or constructed. Donated capital assets are recorded at acquisition value at the date of donation.
The costs of normal maintenance and repairs that do not add to the value of the asset
or materially extend assets’ lives are not capitalized. Major outlays for capital assets and improvements are capitalized as projects are constructed.
Property, plant and equipment is depreciated using the straight-line method over the
following useful lives:
Assets Years
Landfill improvements 3 – 5 Buildings 20 – 50 Water rights 35 Improvements 5 – 50 Equipment 5 – 20 Infrastructure 35 – 125
Pensions For purposes of measuring the net pension liability, deferred outflows of resources
and deferred inflows of resources related to pensions, and pension expense, information about the Fiduciary Net Position of the Texas Municipal Retirement System (TMRS) and additions to/deductions from TMRS’s Fiduciary Net Position have been determined on the same basis as they are reported by TMRS. For this purpose, plan contributions are recognized in the period that compensation is reported for the employee, which is when contributions are legally due. Benefit payments and refunds are recognized when due and payable in accordance with the benefit terms. Investments are reported at fair value.
DRAFT

52
City of Waco, Texas
Notes to Financial Statements (Continued)
I. Summary of Significant Accounting Policies (continued)
D. Assets, Liabilities, Deferred Outflows/Inflows of Resources, and Net Position/Fund Balance (continued) Other Post-Employment Benefits (“OPEB”) The fiduciary net position of the City’s defined benefit life insurance plan (OPEB
Plan) has been determined using the flow of economic resources measurement focus and the full accrual basis of accounting. This includes for purposes of measuring the net OPEB liability, deferred outflows of resources and deferred inflows of resources related to OPEB, OPEB expense, and information about assets, liabilities and additions to/deductions from the OPEB Plan’s net position. Benefit payments are recognized when due and payable in accordance with benefit terms. There are no investments as this is a pay-as-you-go plan.
Deferred Outflows/Inflows of Resources
In addition to assets, the statements of financial position will sometimes report a separate section for deferred outflows of resources. This separate financial statement element, deferred outflows of resources, represents a consumption of net position that applies to a future period(s) and so will not be recognized as an outflow of resources (expense/expenditure) until then.
In addition to liabilities, the statements of financial position will sometimes report a separate section for deferred inflows of resources. This separate financial statement element, deferred inflows of resources, represents an acquisition of net position that applies to future period(s) and so will not be recognized as an inflow of resources (revenue) until that time. Compensated Absences
It is the City’s policy to permit employees to accumulate earned but unused vacation
and sick pay benefits. All vacation pay is accrued when incurred in the government-wide and proprietary fund financial statements. For governmental activities and proprietary funds, a liability is reported for a portion of accumulating sick leave when it is probable that the government will make termination payments. A liability for compensated absences is reported in governmental funds only if they have matured, for example, as a result of employee resignations and retirements.
DRAFT

53
City of Waco, Texas
Notes to Financial Statements (Continued)
I. Summary of Significant Accounting Policies (continued)
D. Assets, Liabilities, Deferred Outflows/Inflows of Resources, and Net Position/Fund Balance (continued) Long-term Obligations
In the government-wide financial statements and proprietary fund types in the fund
financial statements, long-term debt and other long-term obligations are reported as liabilities in the applicable governmental activities, business-type activities, or proprietary fund type statement of net position. Bond premiums are deferred and amortized over the life of the bonds using the interest method. Bonds payable are reported net of the applicable amortized bond premium. Bond issuance costs are expensed when incurred.
In the fund financial statements, governmental fund types recognize bond premiums,
as well as bond issuance costs, during the current period. The face amount of debt issued is reported as other financing sources. Premiums received on debt issuances are reported as other financing sources. Issuance costs, whether or not withheld from the actual debt proceeds received, are reported as debt service expenditures.
Fund Balance In the fund financial statements, governmental fund balances classified as restricted
are balances with constraints placed on the use of resources by creditors, grantors, contributors, or laws or regulations of other governments. Fund balances classified as committed can only be used for specific purposes pursuant to constraints imposed by the City Council through a resolution. Assigned fund balances are constrained by an intent to be used for specific purposes but are neither restricted nor committed. Assignments are also approved by the City Council through a resolution.
For the classification of governmental fund balances, the City considers the order of
expenditures to be made from the most restrictive first when more than one classification is available. The order of spending available resources is as follows: restricted, committed, assigned, and unassigned.
The City Council has adopted Financial Management Policy Statements that include
the policy to strive to maintain the general fund unassigned fund balance at 28% of budgeted revenues. General fund unassigned fund balance at September 30, 2020 was 33% of fiscal year 2021 budgeted revenues.
DRAFT

54
City of Waco, Texas
Notes to Financial Statements (Continued)
I. Summary of Significant Accounting Policies (continued)
D. Assets, Liabilities, Deferred Outflows/Inflows of Resources, and Net Position/Fund Balance (continued)
The following detail of fund balances by classification is shown for major and
nonmajor governmental funds:
General OtherFund Funds Total
Fund balances:Nonspendable:
Inventory $ 1,025,496 - 1,025,496 Real estate held for resale 6,160 - 6,160 Parks and cemetery care - 381,019 381,019
Restricted for:Municipal information activities 1,471,560 - 1,471,560 Debt service activities - 600,472 600,472 Capital projects activities - 50,835,124 50,835,124 Tax increment zone activities - 42,551,716 42,551,716 Housing and community development activities - 246,965 246,965 Public works activities - 636,582 636,582 Public safety activities - 1,658,699 1,658,699 Culture and recreation activities - 169,374 169,374 Waco Public Improvement District activities - 1,148,686 1,148,686
Committed to:Economic development activities 14,496,364 - 14,496,364 Capital projects activities - 20,797,066 20,797,066 Public health services - 3,240,719 3,240,719
Assigned to:Capital improvements projects 12,917,754 - 12,917,754 Economic development activities 3,958,032 - 3,958,032 Public safety activities 757,889 - 757,889 Public works activities 245,706 - 245,706 Culture and recreation activities 8,236 - 8,236 Subsequent year's budget appropriation 7,979,534 - 7,979,534 Other activities 1,138,853 - 1,138,853
Unassigned 48,089,822 - 48,089,822
$ 92,095,406 122,266,422 214,361,828
DRAFT

55
City of Waco, Texas
Notes to Financial Statements (Continued)
I. Summary of Significant Accounting Policies (continued)
D. Assets, Liabilities, Deferred Outflows/Inflows of Resources, and Net Position/Fund Balance (continued)
Net Position
In the government-wide and proprietary fund financial statements, net position represents the difference between assets and liabilities. Net investment in capital assets consists of capital assets, net of accumulated depreciation, reduced by the outstanding balances of any borrowing used for the acquisition, construction or improvements of those assets, and adding back unspent proceeds.
Net position is reported as restricted when there are limitations imposed on its use either through the enabling legislations adopted by the City or through external restrictions imposed by creditors, grantors, laws or regulations of other governments. When both restricted and unrestricted resources are available for use, it is the City’s policy to use restricted resources first, then unrestricted resources as they are needed.
II. Reconciliation of Government-wide and Fund Financial Statements
A. Explanation of Certain Differences Between the Governmental Fund Balance Sheet and the Government-wide Statement of Net Position
The governmental fund balance sheet includes a reconciliation between fund balance – total governmental funds and net position – governmental activities as reported in the government-wide statement of net position. One element of that reconciliation explains, “long-term liabilities are not due and payable in the current period and, therefore, are not reported in the funds.” The details of this $200,222,285 difference are as follows:
Serial bonds and certificates of obligation $ 125,425,000 Less: deferred charge on refunding (to be amortized as interest expense) (1,235,425)Plus: issuance premium (to be amortized as interest expense) 7,702,359 Accrued interest payable 1,046,771 Compensated absences 18,586,627 Net pension liability and pension related deferred outflows/ inflows of $348,703 (to be amortized as pension expense) 46,061,893 Refundable contracts 80,007 Contracts payable 830,000 Net other post-employment benefit (OPEB) liability and related deferred outflows/inflows of $369,933 (to be amorized as OPEB expense) 1,563,631 Notes payable 161,422
Net adjustment to reduce fund balance - total governmental funds to arrive at net position - governmental activities $ 200,222,285
DRAFT

56
City of Waco, Texas
Notes to Financial Statements (Continued)
II. Reconciliation of Government-wide and Fund Financial Statements (continued)
B. Explanation of Certain Differences Between the Governmental Fund Statement of Revenues, Expenditures and Changes in Fund Balances and the Government-wide Statement of Activities
The governmental fund statement of revenue, expenditures and changes in fund
balances includes a reconciliation between net changes in fund balances – total governmental funds and changes in net position of governmental activities as reported in the government-wide statement of activities. One element of that reconciliation explains, “Governmental funds report capital outlays as expenditures. However, in the statement of activities, the cost of those assets is allocated over their estimated useful lives and reported as depreciation expense.” The details of this $12,937,725 difference are as follows:
Capital outlay $ 31,746,645 Depreciation expense (18,808,920) Net adjustment to increase net changes in fund balances - total governmental funds to arrive at changes in net position of governmental activities $ 12,937,725
Another element of that reconciliation states, “The net effect of various miscellaneous transactions involving capital assets (i.e., sales, trade-ins, transfers and donations) is to increase net position.” The details of this $4,483,383 difference are as follows:
Donations and transfers of capital assets increase net position in the statement of activities, but do notappear in the governmental funds because they arenot financial resources $ 4,483,383
Net adjustment to increase net changes in fund balances - total governmental funds to arrive at changes in net position of governmental activities $ 4,483,383
DRAFT

57
City of Waco, Texas
Notes to Financial Statements (Continued)
II. Reconciliation of Government-wide and Fund Financial Statements (continued)
B. Explanation of Certain Differences Between the Governmental Fund Statement of Revenues, Expenditures and Changes in Fund Balances and the Government-wide Statement of Activities (continued)
Another element of that reconciliation states, “Revenues in the statement of activities that do not provide current financial resources are not reported as revenues in the funds.” The details of this $137,940 difference are as follows:
Property taxes $ (141,608)Special assessments 3,668
Net adjustment to decrease net changes in fund balances - total governmental funds to arrive at changes in net position of governmental activities $ (137,940)
Another element of that reconciliation states, “The issuance of long-term debt (e.g., bonds, leases) provides current financial resources to governmental funds, while the repayment of the principal of long-term debt consumes the current financial resources of governmental funds. Neither transaction, however, has any effect on net position. Also, governmental funds report the effect of premiums, discounts and similar items when debt is first issued, whereas these amounts are deferred and amortized in the statement of activities.” The details of this $21,010,519 difference are as follows:
Debt issued or incurred: Issuance of general obligation debt $ (26,210,000) Plus: premium on issuance (2,551,941)Principal repayments: General obligation debt 7,590,000 Note payable 161,422 Net adjustment to decrease net changes in fund balances - total governmental funds to arrive at changes in net position of governmental activities $ (21,010,519)
DRAFT

58
City of Waco, Texas
Notes to Financial Statements (Continued)
II. Reconciliation of Government-wide and Fund Financial Statements (continued)
B. Explanation of Certain Differences Between the Governmental Fund Statement of Revenues, Expenditures and Changes in Fund Balances and the Government-wide Statement of Activities (continued)
Another element of that reconciliation states, “Some expenses reported in the statement of activities do not require the use of current financial resources and therefore are not reported as expenditures in governmental funds.” The details of this $1,704,205 difference are as follows:
OPEB liability $ (76,471)Compensated absences (1,540,752)Net pension liability (1,460,602)Accrued interest (70,199)Amortization of deferred charge on refunding (335,916)Amortization of bond premiums 1,779,735 Net adjustment to decrease net changes in fund balances - total governmental funds to arrive at changes in net position of governmental activities $ (1,704,205)
III. Stewardship, Compliance and Accountability
A. Budgetary Information
Annual budgets are adopted on a basis consistent with generally accepted accounting
principles. Annual, appropriated budgets are adopted for the general fund, health fund and general obligation debt fund. All annual appropriations lapse at fiscal year-end. Project-length financial plans are adopted for all capital projects funds and the grant fund.
Prior to August 1, the City Manager submits to the City Council a proposed operating budget for the fiscal year commencing the following October 1. The operating budget includes proposed expenditures and the means of financing them. A public hearing is conducted to obtain taxpayer comments. Prior to October 1, the budget is legally enacted through passage of a resolution Expenditures may not legally exceed appropriations at the fund level for each legally adopted annual budget. The City Council made supplemental budgetary appropriation changes during the fiscal year. In addition, transfer of appropriations between funds requires the approval of the City Council. The reported budgetary data has been revised for these amendments legally authorized during the year.
DRAFT

59
City of Waco, Texas
Notes to Financial Statements (Continued)
III. Stewardship, Compliance and Accountability (continued)
A. Budgetary Information (continued)
Encumbrance accounting is employed in governmental funds. Encumbrances (e.g., purchase orders, contracts) outstanding at year-end do not constitute expenditures or liabilities because the commitments will be re-appropriated and honored during the subsequent year.
Outstanding encumbrances for governmental funds as of September 30, 2020 are $2,150,684 for the general fund and $38,473,111 for other nonmajor funds.
IV. Detail Notes on All Funds A. Deposits and Investments
As of September 30, 2020, the City has U.S. Federal agency securities of $101,330,534 which are valued using quoted market prices (Level 1).
As of September 30, 2020, the City had the following investments:
WeightedPercent Average
Total of MaturityInvestments Portfolio (in Years)
Investments reported at amortized cost: Texas Local Government Investment Pool (Tex Pool) $ 90,924,005 19.51 0.10 Texas Local Government Investment Pool (TexPool Prime) 124,791,756 26.78 0.13 Texas Short-Term Asset Reserve (TexSTAR) 123,611,455 26.53 0.12
Total local government investment pools 339,327,216 72.82
Money market mutual funds 4,637,525 1.00 0.10
Collateralized bank savings accounts 20,654,074 4.43 -
Investments reported at fair value: U.S. Federal agency securities 101,330,534 21.75 1.82
Total investments $ 465,949,349 100.00 0.49
DRAFT

60
City of Waco, Texas
Notes to Financial Statements (Continued)
IV. Detail Notes on All Funds (continued)
A. Deposits and Investments (continued)
Interest Rate Risk Interest rate risk is the risk that changes in market interest rates will adversely affect the fair value of an investment. In accordance with its investment policy, the City manages its exposure to declines in fair value by limiting the maturities of its investments as follows: maturities of U.S. Treasury obligations, U.S. Federal agency securities and repurchase agreements cannot exceed three years. Further, the weighted average maturity of the City’s pooled operating portfolio shall at no time exceed one year with the calculation to include all portfolio securities, bank and savings account deposits and local government pools and money fund holdings. The weighted average maturity for the City’s pooled operating portfolio pursuant to this calculation was 0.59 years as of September 30, 2020. Credit Risk For an investment, credit risk is the risk that an investment issuer or other counterparty to an investment will not fulfill obligations. Texas Government Code Chapter 2256, Public Funds Investment Act, restricts the types of investments in which the City may invest. The City’s investment policy addresses credit quality by further restricting authorized investments to the following:
U.S. Treasury obligations
Other obligations of the U.S. Government guaranteed by the Federal Deposit Insurance Corporation (FDIC) or by the explicit full faith and credit of the United States
U.S. Federal agency securities
Repurchase agreements and flexible repurchase agreements, collateralized by U.S. Treasury obligations or U.S. federal agency securities, or by pass-through mortgage-backed securities issued by the U.S. federal agencies
Money market mutual funds rated not less than AAAm by Standard & Poor’s, Aaa by Moody’s or AAA/V1+ by Fitch
Local Government Investment Pools rated not less than AAAm by Standard & Poor’s, Aaa by Moody’s or AAA/V1+ by Fitch
DRAFT

61
City of Waco, Texas
Notes to Financial Statements (Continued)
IV. Detail Notes on All Funds (continued)
A. Deposits and Investments (continued)
The City’s investments in TexPool and TexSTAR are rated AAAm by Standard & Poor’s; and U.S. Federal agency securities are rated Aaa by Moody’s, and AA+ by Standard and Poor’s.
Concentration of Credit Risk Concentration of credit risk is the risk of loss attributable to the magnitude of a government’s investments in the securities of a single issuer. The City’s investment policy includes an investment objective of seeking diversification to avoid unreasonable risk. More than 5% of the City’s investments at September 30, 2020 were in securities of the following issuers:
Percent ofU.S. Agency Issuer Fair Value Portfolio
Federal Farm Credit Bank $ 35,049,992 7.52%Federal Home Loan Mortgage Corporation 37,067,655 7.96%
Custodial Credit Risk The custodial credit risk for deposits is the risk that, in the event of the failure of a
depository financial institution, a government will not be able to recover deposits or will not be able to recover collateral securities that are in the possession of an outside party. City policy requires all deposits to be fully secured in accordance with the Texas Government Code, Chapter 2257, by either surety bonds, letters of credit of the United States or its agencies and instrumentalities, or by eligible securities held by an independent third-party custodian.
For an investment, custodial credit risk is the risk that in the event of the failure of the
counter-party, the City would not be able to recover the value of its investment or collateralized securities that are in the possession of an outside third party. The City’s investment policy requires that the purchase of investment securities be settled on a delivery basis and that ownership of all securities be perfected in the name of the City.
DRAFT

62
City of Waco, Texas
Notes to Financial Statements (Continued)
IV. Detail Notes on All Funds (continued)
A. Deposits and Investments (continued) Reconciliation of Cash and Investments
Carrying amount of deposits and cash on hand $ (903,953)Carrying amount of investments 465,949,349
Total $ 465,045,396
Cash and investments - governmental activities $ 223,092,004 Cash and investments - business-type activities 101,328,362 Restricted cash and investments - business-type activities 137,121,597 Component units, excluding Baylor Waco Stadium Authority 31,919 Agency funds 3,471,514
Total $ 465,045,396
The City issues certificates of obligation to fund capital projects for governmental and business-type activities. Interest earnings on the majority of unspent proceeds of all certificates of obligation are accounted for in the capital projects fund.
Local Government Investment Pools
TexPool. The Comptroller of Public Accounts (the Comptroller) is the sole officer, director and shareholder of the Texas Treasury Safekeeping Trust Company (the Trust Company) which is authorized to operate TexPool. Federated Investors, Inc. provides asset management services to TexPool. Additionally, the Comptroller has established an advisory board composed of both participants in TexPool and other persons who do not have a business relationship with TexPool. The advisory board members review the investment policy and management fee structure. There are no maximum transaction amounts and withdrawals from TexPool may be made daily. TexPool uses amortized cost rather than fair value to report net assets to compute share prices.
TexSTAR. TexSTAR is a Texas public funds investment pool that is co-administered by J.P. Morgan Asset Management and Hilltop Securities Inc. TexSTAR is managed by a five-member governing board comprised of three representatives of eligible governmental entities and one member designated by each of the co-administrators.
DRAFT

63
City of Waco, Texas
Notes to Financial Statements (Continued)
IV. Detail Notes on All Funds (continued)
A. Deposits and Investments (continued)
Local Government Investment Pools (continued) There are no maximum transaction amounts and withdrawals from TexSTAR may be made daily. TexSTAR uses amortized cost rather than the fair value to report net assets to compute share prices.
B. Receivables
Receivables as of year-end for the City’s individual major funds and nonmajor, internal service, and fiduciary funds in the aggregate, including the applicable allowances for uncollectible accounts, are as follows:
NonmajorSolid and
General Water Wastewater Waste Other Funds TotalReceivables: Taxes $ 9,990,290 - - - 423,041 10,413,331 Accounts 15,681,187 8,929,392 5,931,587 3,359,907 1,841,592 35,743,665 Special assessments - - - - 9,128 9,128 Intergovernmental 6,032,811 491,962 647,984 - 9,141,258 16,314,015 Notes - - - - 3,759,297 3,759,297
Gross receivables 31,704,288 9,421,354 6,579,571 3,359,907 15,174,316 66,239,436 Less: allowance for uncollectibles 12,004,260 2,409,932 1,377,958 1,307,526 4,439,550 21,539,226
Net total receivables $ 19,700,028 7,011,422 5,201,613 2,052,381 10,734,766 44,700,210
Revenues of the water, wastewater, and solid waste funds are reported net of uncollectible amounts. Total uncollectible amounts related to revenues of the current period are as follows:
Uncollectibles related to water sales $ 76,646 Uncollectibles related to wastewater charges 64,917 Uncollectibles related to solid waste charges 22,124
Total uncollectibles of the current fiscal year $ 163,687
DRAFT

64
City of Waco, Texas
Notes to Financial Statements (Continued)
IV. Detail Notes on All Funds (continued)
C. Capital Assets
Capital asset activity for the year ended September 30, 2020 was as follows:
Balance BalanceOctober 1, September 30,
2019 Increases Decreases 2020Governmental activities: Capital assets, not being depreciated: Land $ 61,183,206 2,006,468 - 63,189,674 Construction in progress 23,797,173 21,957,941 (21,020,156) 24,734,958 Total capital assets not being depreciationed 84,980,379 23,964,409 (21,020,156) 87,924,632
Capital assets, being depreciated: Buildings 83,011,175 1,522,121 - 84,533,296 Machinery and equipment 65,342,853 4,591,218 (2,462,786) 67,471,285 Improvements other than buildings 69,529,596 1,309,265 - 70,838,861 Infrastructure 318,076,080 26,050,001 - 344,126,081 Total capital assets being depreciated 535,959,704 33,472,605 (2,462,786) 566,969,523
Less accumulated depreciation: Buildings 31,461,365 3,126,018 - 34,587,383 Machinery and equipment 47,002,130 4,148,775 (2,459,664) 48,691,241 Improvements other than buildings 40,160,009 2,596,597 - 42,756,606 Infrastructure 196,730,739 9,093,898 - 205,824,637 Total accumulated depreciation 315,354,243 18,965,288 (2,459,664) 331,859,867
Total capital assets being depreciated, net 220,605,461 14,507,317 (3,122) 235,109,656
Total capital assets, net $ 305,585,840 38,471,726 (21,023,278) 323,034,288
Primary Government
DRAFT

65
City of Waco, Texas
Notes to Financial Statements (Continued)
IV. Detail Notes on All Funds (continued)
C. Capital Assets (continued)
Balance BalanceOctober 1, September 30,
2019 Increases Decreases 2020
Business-type activities: Capital assets, not being depreciated/amortized: Land $ 15,202,447 1,898,435 - 17,100,882 Construction in progress 62,674,846 48,075,094 (14,667,368) 96,082,572 Museum collections 2,264,424 10,000 - 2,274,424
Total capital assets not being depreciationed/amortized 80,141,717 49,983,529 (14,667,368) 115,457,878
Capital assets, being depreciated/ amortized: Buildings 84,508,590 564,546 - 85,073,136 Machinery and equipment 62,207,295 7,458,677 (2,248,676) 67,417,296 Improvements other than buildings 584,909,947 37,682,099 (1,394,554) 621,197,492 Water rights - impound fee 32,482,879 - - 32,482,879
Total capital assets being depreciated/amortized 764,108,711 45,705,322 (3,643,230) 806,170,803
Less accumulated depreciation: Buildings 45,785,519 2,804,817 - 48,590,336 Machinery and equipment 43,504,888 4,614,084 (2,247,588) 45,871,384 Improvements other than buildings 252,544,433 18,799,556 (1,394,554) 269,949,435 Water rights - impound fee 13,464,649 924,827 - 14,389,476
Total accumulated depreciation/amortization 355,299,489 27,143,284 (3,642,142) 378,800,631
Total capital assets being depreciated/amortized, net 408,809,222 18,562,038 (1,088) 427,370,172
Total capital assets, net $ 488,950,939 68,545,567 (14,668,456) 542,828,050
Primary Government
DRAFT

66
City of Waco, Texas
Notes to Financial Statements (Continued)
IV. Detail Notes on All Funds (continued)
C. Capital Assets (continued)
Depreciation expense was charged to functions/programs as follows:
Governmental activities:General government $ 1,138,207 Public works 9,673,334 Public safety 3,689,723 Culture and recreation 4,394,525 Public health 69,499
Total depreciation expense - governmental activities $ 18,965,288
Depreciation/amortization expense was charged to functions/programs as follows:
Business-type activitiesWater $ 10,912,032 Wastewater 6,838,111 Solid waste 3,540,654 Airport 2,820,553 Convention services 914,634 Ranger Hall of Fame 158,348 Cameron Park Zoo 1,060,836 Transit services 727,572 Cottonwood Creek Golf Course 170,544 Total depreciation/amortization expense - business-type activities $ 27,143,284
Construction commitments
The City has active construction projects as of September 30, 2020. At year-end the City’s commitments with contractors are as follows:
Spent RemainingProject to Date Commitments
Street projects $ 20,017,255 12,726,391 Water projects 29,459,353 23,860,019 Wastewater projects 61,544,778 25,954,779 Solid waste 3,521,508 1,686,015 Other projects 6,274,636 25,773,279
Total $ 120,817,530 90,000,483
DRAFT

67
City of Waco, Texas
Notes to Financial Statements (Continued)
IV. Detail Notes on All Funds (continued) D. Interfund Receivables, Payables and Transfers
The composition of interfund balances as of September 30, 2020 is as follows:
Due to/from other funds
Receivable Fund Payable Fund Amount
Nonmajor governmental General $ 7,905,000 General Nonmajor governmental 1,125,051 General Nonmajor business-type 1,878,223 Internal service General 754,352 Nonmajor governmental Nonmajor governmental 2,684,316
$ 14,346,942
All balances resulted from the time lag between the dates that (1) interfund goods and services are provided or reimbursable expenditures occur, (2) transactions are recorded in the accounting system, and (3) payments between funds are made. Advances to/from other funds
Receivable Fund Payable Fund Amount
Water Nonmajor business-type $ 525,336 Nonmajor governmental Nonmajor business-type 168,368
$ 693,704
All advances resulted from loans to Cottonwood Creek Golf Course Fund made for operating and capital improvements since the City took over management responsibilities. Amounts are not expected to be paid within the next fiscal year.
DRAFT

68
City of Waco, Texas
Notes to Financial Statements (Continued)
IV. Detail Notes on All Funds (continued) D. Interfund Receivables, Payables and Transfers (continued)
Interfund transfers
Nonmajor NonmajorGeneral Water Wastewater Governmental Enterprise Total
Transfers out: General $ - - - 20,785,107 6,026,114 26,811,221 Water 3,635,062 - - - - 3,635,062 Wastewater 1,029,531 - - - - 1,029,531 Solid waste 420,161 - - - - 420,161 Nonmajor governmental 2,107,725 250,000 250,000 3,595,326 - 6,203,051 Nonmajor enterprise - - - - 150,000 150,000
Total transfers $ 7,192,479 250,000 250,000 24,380,433 6,176,114 38,249,026
Transfers in
Transfers are used to (1) move revenues from the fund responsible for collecting them to the fund responsible for expending them as required by statute or budget, (2) move receipts restricted to debt service from the funds collecting the receipts to the debt service fund as debt service payments become due, (3) move unrestricted revenues collected in the general fund to finance various programs accounted for in other funds in accordance with budgetary authorizations, and (4) move unspent interest earnings on certificates of obligation from the capital projects fund to enterprise funds. In the year ended September 30, 2020, the City made payments from various funds to the general fund in lieu of taxes. The City reported these payments as transfers. Transfers were made from the following funds in the following amounts.
Water $ 3,635,062 Wastewater 1,029,531 Solid waste 420,161
E. Leases
Operating leases The government leases building and office facilities and other equipment under noncancelable operating leases. Total costs for such leases were $867,908 for the year ended September 30, 2020. The future minimum lease payments for these leases are as follows:
DRAFT

69
City of Waco, Texas
Notes to Financial Statements (Continued)
IV. Detail Notes on All Funds (continued)
E. Leases (continued) Operating leases (continued)
Year Ending
September 30,
2021 $ 644,9682022 239,5452023 201,4622024 94,0482025 68,184
2026-2028 169,360
Total $ 1,417,567
F. Long-term Debt General obligation bonds
The City issues general obligation bonds to provide funds for the acquisition and construction of major capital facilities. General obligation bonds have been issued for both governmental and business-type activities. These bonds are reported in the proprietary funds if they are expected to be repaid from proprietary fund revenue.
General obligation bonds are direct obligations and pledge the full faith and credit of the government. These bonds generally are issued as twenty-year serial bonds with equal amounts of principal maturing each year. General obligation bonds currently outstanding are as follows:
Interest Rates Amount
2.00% - 5.00% $ 83,015,000 Governmental activities - refunding 2.00% - 5.00% 42,410,000 Business-type activities 2.00% - 5.00% 243,840,000 Business-type activities - refunding 2.00% - 5.00% 122,355,000
$ 491,620,000
Purpose
Governmental activities
DRAFT

70
City of Waco, Texas
Notes to Financial Statements (Continued)
F. Long-term Debt (continued) General obligation bonds (continued)
Annual debt service requirements to maturity for general obligation bonds are as follows:
Year EndingSeptember 30, Principal Interest Principal Interest
2021 $ 8,780,000 5,200,766 21,970,000 13,795,617 2022 8,990,000 4,456,819 21,900,000 12,428,562 2023 9,160,000 4,029,850 21,930,000 11,439,995 2024 9,405,000 3,584,669 22,255,000 10,430,391 2025 9,675,000 3,129,506 20,790,000 9,453,497
2026-2030 37,210,000 9,711,730 103,680,000 34,538,189 2031-2035 24,710,000 4,320,097 106,580,000 15,614,084 2036-2040 17,495,000 1,014,464 47,090,000 2,256,367
Total $ 125,425,000 35,447,901 366,195,000 109,956,702
Governmental Activities Business-type Activities
Notes payable The City has entered into an agreement with the City of West, Texas to supply water for 40 years pursuant to an agreed-upon rate structure. As part of the agreement, the City purchased a pump station and water transmission line for $12,814 monthly for 18 years and $6,632 monthly for 22 years. Interest is imputed at 4.35% over the term of the agreement.
DRAFT

71
City of Waco, Texas
Notes to Financial Statements (Continued)
IV. Detail Notes on All Funds (continued)
F. Long-term Debt (continued)
Year Ending
September 30, Principal Interest
2021 $ 94,166 59,596 2022 98,348 55,414 2023 96,535 51,046 2024 31,325 48,257 2025 32,716 46,866
2026-2030 186,711 211,199 2031-2035 232,021 165,889 2036-2040 288,328 109,582 2041-2045 351,666 39,612
Total $ 1,411,816 787,461
Note Payable
The City has entered into an agreement with the State of Texas acting through the Texas Department of Transportation to contribute right of way funds for highway improvements on certain sections of FM 1637 and U.S. Highway 84. The total of the payments is $994,740, with $833,318 paid through 2020. The final payment for this agreement will be made in fiscal year 2021. Other long-term debt information Proceeds from general obligation bonds are subject to arbitrage rebate regulations. Estimated rebatable arbitrage has been recorded as a reduction to interest on investments. During 1985, the City entered into a development agreement which provided that the City repay $830,000 for public improvements at an interest rate not to exceed 8%. Repayment of principal and accrual of interest will not begin until revenue is received from the area designated in the development agreement. Annual requirements will be based on the revenue generated from future developments, which cannot be reasonably estimated at September 30, 2020.
DRAFT

72
City of Waco, Texas
Notes to Financial Statements (Continued)
IV. Detail Notes on All Funds (continued)
F. Long-term Debt (continued)
Other long-term debt information (continued)
There is no specific maximum debt limit established by law for the City; therefore, the limit is governed by the City’s ability to levy and collect taxes. The City’s maximum legal rate is $1.85 per $100 valuation; the current tax rate is $0.776232 per $100 valuation. The various bond obligations contain certain financial limitations and restrictions. The ordinances authorizing the issuance of general obligation bonds created an interest and sinking fund (general debt service fund). The ordinances require the City to ascertain a rate and amount of tax which will be sufficient to pay interest as it comes due and provide a reserve fund which is adequate to meet principal as it matures. The City is in compliance with all such significant financial restrictions. Refundable contracts The City maintains a policy of refunding to subdivision developers certain costs for the construction of water and wastewater improvements and streets and drainage facilities, applicable to single family housing developments. The policy was created to encourage the construction of single family residences within the corporate limits of the City. Amounts under contract which have not yet been refunded of $1,364,378 have been recorded as a liability in the accompanying statement of net position. Changes in long-term liabilities Long-term liability activity (shown in thousands of dollars) for the year ended September 30, 2020 was as follows:
DRAFT

73
City of Waco, Texas
Notes to Financial Statements (Continued)
IV. Detail Notes on All Funds (continued)
F. Long-term Debt (continued)
Changes in long-term liabilities (continued)
Beginning Ending Due WithinBalance Additions Reductions Balance One Year
Governmental activitiesBonds payable: General obligation bonds $ 106,805 26,210 7,590 125,425 8,780 Plus: premium on bonds 6,930 2,552 1,780 7,702 -
Total bonds payable 113,735 28,762 9,370 133,127 8,780
Contracts payable 830 - - 830 - Refundable contracts 80 - - 80 - Estimated claims and judgments 3,056 14,441 14,183 3,314 3,314 Note payable 323 - 161 162 162 Compensated absences 17,318 13,245 11,623 18,940 12,815 Net pension liability 74,565 41,515 70,367 45,713 - OPEB liability 1,527 465 59 1,933 -
Total other long-term liabilities 97,699 69,666 96,393 70,972 16,291
Governmental activity long-term liabilities $ 211,434 98,428 105,763 204,099 25,071
Beginning Ending Due WithinBalance Additions Reductions Balance One Year
Business-type activities:Bonds payable: General obligation bonds $ 354,345 32,500 20,650 366,195 21,970 Plus: premium on bonds 16,147 3,161 3,818 15,490 -
Total bonds payable 370,492 35,661 24,468 381,685 21,970
Refundable contracts 1,354 461 531 1,284 531 Estimated landfill closure 5,961 293 - 6,254 - Note payable 1,502 - 90 1,412 94 Compensated absences 3,014 2,659 1,981 3,692 2,075 Net pension liability 12,138 6,759 11,455 7,442 -
Total other long-term liabilities 23,969 10,172 14,057 20,084 2,700
Business-type activity long-term liabilities $ 394,461 45,833 38,525 401,769 24,670
DRAFT

74
City of Waco, Texas
Notes to Financial Statements (Continued)
IV. Detail Notes on All Funds (continued)
F. Long-term Debt (continued)
Changes in long-term liabilities (continued)
Internal service funds predominantly serve the governmental funds. Accordingly,
long-term liabilities for them are included as part of the above totals for governmental activities. At year-end, $353,471 and $3,314,131 of internal service funds’ compensated absences and estimated claims and judgments, respectively, are included in the above governmental amounts. Also, for the governmental activities, compensated absences, net pension liability, other post-employment benefits, and capital leases are generally liquidated by the general fund. Refundable contracts are liquidated by the street and drainage refundable contracts debt service fund.
G. Restricted Assets The balances of the restricted asset accounts in the enterprise funds are as follows:
Customer deposits $ 3,117,477 Bond construction account 136,999,184 Capital grants and contributions 122,413
Total restricted assets $ 140,239,074
H. Risk Management The City is exposed to various risks of losses related to torts; theft of, damage to, and
destruction of assets; errors and omissions; and natural disasters for which the government carries commercial insurance and participates in a joint self-insured program. The City has established the insurance fund and health insurance fund (internal services funds) to account for and finance its risk management activities. All funds participate in these programs and make payments to these funds based on actuarial estimates of the amounts needed to pay prior and current-year claims and to establish reserves for catastrophic losses. The reserves for catastrophic losses were approximately $12,500,000 at September 30, 2020.
Liabilities of the funds are reported when it is probable that a loss has occurred and
the amount of the loss can be reasonably estimated. Liabilities include an amount for claims that have been incurred but not reported (IBNRs). The result of the process to estimate the claims liability is not an exact amount as it depends on many complex factors, such as inflation, federal and state mandated programs, changes in legal
DRAFT

75
City of Waco, Texas
Notes to Financial Statements (Continued)
IV. Detail Notes on All Funds (continued)
H. Risk Management (continued)
doctrines, damage awards (including frequency and amount of payouts), and economic and social trends. Accordingly, claims are reevaluated periodically to consider the effects of such factors.
The estimate of the claims liability also includes amounts for incremental claim adjustment expenses related to specific claims and other claim adjustment expenses regardless of whether allocated to specific claims. Estimated recoveries, for example from salvage or subrogation, are another component of the claims liability estimate.
The insurance fund provides coverage for up to a maximum of $500,000 for each non-civil service workers’ compensation claim and $600,000 for each civil service workers’ compensation claim. The City purchases commercial insurance for workers’ compensation claims in excess of coverage provided by the fund. For general liability claims prior to fiscal year 2002, the insurance fund provided coverage for up to $250,000 for each individual and $500,000 aggregate for general liability claims and up to $100,000 for each property damage claim. Beginning with fiscal year 2002, the insurance fund participants in a joint self-insured program for each general liability or property damage claim. The City purchases coverage for claims in excess of $50,000. The commercial liability coverage limits are $1,000,000 per occurrence for general liability with a $2,000,000 annual aggregate, except for law enforcement liability for which the limits are $5,000,000 per occurrence and $10,000,000 annual aggregate. The coverage limits for the City’s property are: $10,000,000 aggregate for automobile catastrophe, $437,352,761 aggregate for real and personal property, $12,085,637 aggregate for mobile equipment and $5,000,000 per accident for boiler and machinery.
Effective January 1, 2006, the City began to self-insure for health insurance claims. The City purchases unlimited stop-loss protection for individual claims exceeding $250,000, as well as unlimited aggregate protection for claims exceeding 125% of expected annual claims.
There have been no claim settlements in excess of the insurance and stop loss coverages that have been procured in 2020, 2019, or 2018. Changes in the amounts of estimated unpaid liability, workers’ compensation and health insurance claims during the past two years are as follows (shown in thousands of dollars):
2020 2019
Unpaid claims, beginning of fiscal year $ 3,056 2,967 Incurred claims (including IBNRs) 14,441 14,830 Claim payments (14,183) (14,741)
Unpaid claims, end of fiscal year $ 3,314 3,056
DRAFT

76
City of Waco, Texas
Notes to Financial Statements (Continued)
IV. Detail Notes on All Funds (continued)
I. Contingent Liabilities Amounts received or receivable from grant agencies are subject to audit and
adjustment by grantor agencies, principally the federal government. Any disallowed claims, including amounts already collected, may constitute a liability of the applicable funds. The amount, if any, of expenditures that may be disallowed by the grantor cannot be determined at this time, although the City expects such amounts, if any to be immaterial.
There are currently several claims and lawsuits pending against the City. It is the
opinion of the City Attorney and management that there is no pending litigation against the City that, if decided against the City, would have a material adverse effect upon the operations of the City or that would exceed the contingency amounts set aside for such purpose.
J. Commitments
The City Council has approved $1,047,647 to be refunded to subdivision developers
for certain costs for the construction of water improvements once applicable contract requirements are met. During 2015, the City Council determined that the City shall not enter into any new water refund contracts for any subdivisions or developments for which construction plans had not been submitted to the City by May 12, 2015.
In August 2012, the City Council approved an amendment to the project/financing
plan for reinvestment zone number one to provide partial funding via a grant of up to $35,060,340 to assist with infrastructure improvements for the new McLane Stadium at Baylor University. A total of $29,048,272 had been funded through 2020. This annual grant funding is limited to tax increment revenue collected each year from the reinvestment zone number one as follows:
Year Amount
2021 $ 3,006,034 2022 3,006,034
DRAFT

77
City of Waco, Texas
Notes to Financial Statements (Continued)
IV. Detail Notes on All Funds (continued)
K. Postemployment Benefits Other Than Pensions (OPEB) Benefits provided. The City administers a single-employer defined benefit life
insurance plan. The plan provides $2,500 of life insurance to each qualified retiree. An optional $5,000 in life insurance is available at the retiree’s expense. According to the City’s personnel policy, retirees who have retired under the Texas Municipal Retirement System (TMRS) with a minimum of twenty years of service are eligible for postretirement life insurance benefits. There are no plan assets, as this is a pay-as-you go plan.
Employees covered by benefit terms. At December 31, 2019, the following employees
were covered by the benefit terms:
Inactive plan members or beneficiaries currently receiving benefits 652 Active plan members 1,429
2,081
Total OPEB Liability
The actuarial valuation was performed as of December 31, 2019.
Actuarial assumptions and other inputs. The total OPEB liability in the December 31, 2019 actuarial valuation was determined using the following actuarial assumptions and other inputs, applied to all periods included in the measurement, unless otherwise specified:
Valuation Date: December 31, 2019
Methods and Assumptions:
Actuarial Cost Method Individual Entry Age Normal
Discount Rate 2.75% as of December 31, 2019
Inflation 2.50%
Salary Increases 3.50% to 11.50%, including inflation
Demographic Assumptions Based on the experience study covering the four-year period ending December 31, 2018 as conducted for TMRS
Mortality For healthy retirees, the gender-distinct 2019 Municipal Retirees of Texas mortality tables are used. The rates are projected on a fully generational basis using the ultimate mortality improvement rates in the MP tables to account for future mortality improvements.
DRAFT
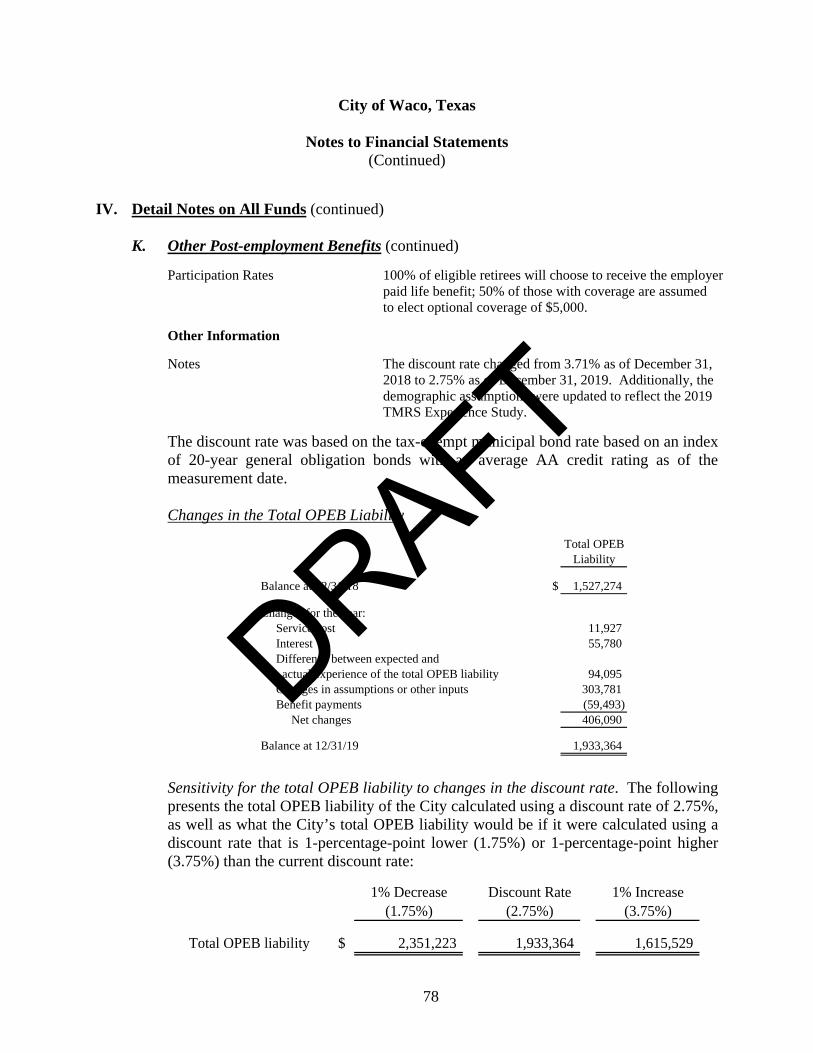
78
City of Waco, Texas
Notes to Financial Statements (Continued)
IV. Detail Notes on All Funds (continued)
K. Other Post-employment Benefits (continued)
Participation Rates 100% of eligible retirees will choose to receive the employer paid life benefit; 50% of those with coverage are assumed to elect optional coverage of $5,000.
Other Information
Notes The discount rate changed from 3.71% as of December 31, 2018 to 2.75% as of December 31, 2019. Additionally, the demographic assumptions were updated to reflect the 2019 TMRS Experience Study.
The discount rate was based on the tax-exempt municipal bond rate based on an index of 20-year general obligation bonds with an average AA credit rating as of the measurement date.
Changes in the Total OPEB Liability
Total OPEBLiability
Balance at 12/31/18 $ 1,527,274
Changes for the year: Service cost 11,927 Interest 55,780 Difference between expected and actual experience of the total OPEB liability 94,095 Changes in assumptions or other inputs 303,781 Benefit payments (59,493) Net changes 406,090
Balance at 12/31/19 1,933,364
Sensitivity for the total OPEB liability to changes in the discount rate. The following presents the total OPEB liability of the City calculated using a discount rate of 2.75%, as well as what the City’s total OPEB liability would be if it were calculated using a discount rate that is 1-percentage-point lower (1.75%) or 1-percentage-point higher (3.75%) than the current discount rate:
1% Decrease Discount Rate 1% Increase(1.75%) (2.75%) (3.75%)
Total OPEB liability $ 2,351,223 1,933,364 1,615,529
DRAFT
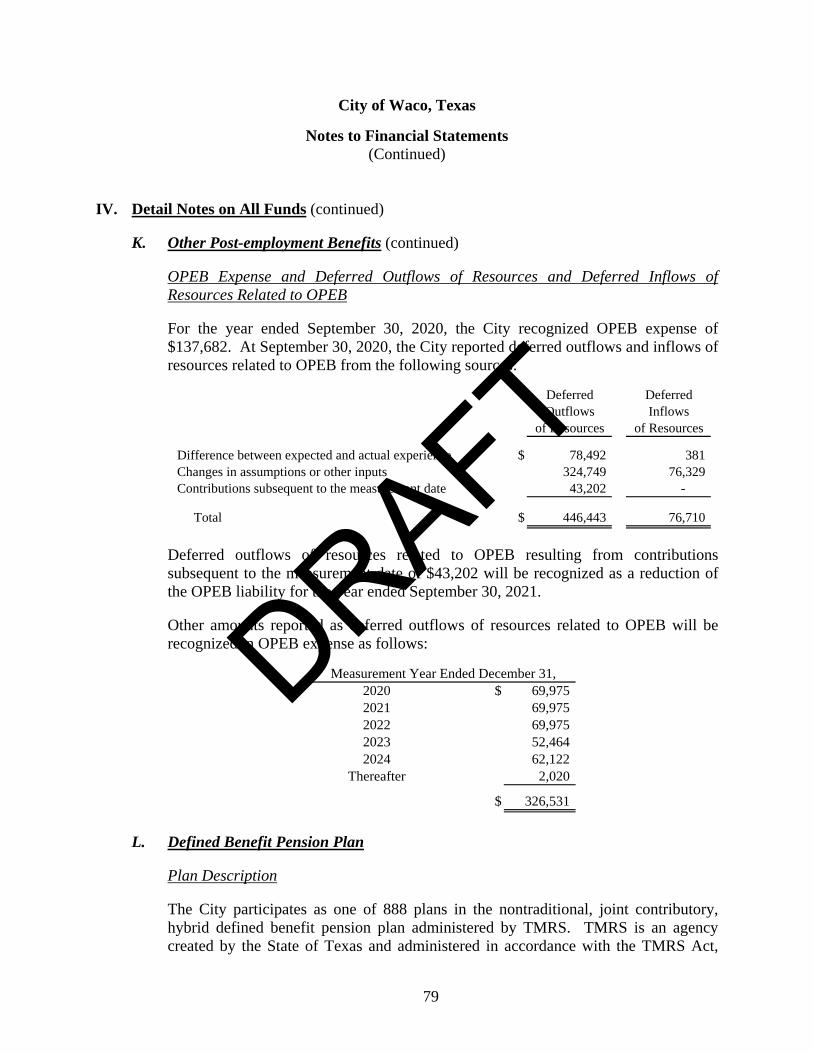
79
City of Waco, Texas
Notes to Financial Statements (Continued)
IV. Detail Notes on All Funds (continued)
K. Other Post-employment Benefits (continued) OPEB Expense and Deferred Outflows of Resources and Deferred Inflows of
Resources Related to OPEB For the year ended September 30, 2020, the City recognized OPEB expense of
$137,682. At September 30, 2020, the City reported deferred outflows and inflows of resources related to OPEB from the following sources:
Deferred DeferredOutflows Inflows
of Resources of Resources
Difference between expected and actual experience $ 78,492 381 Changes in assumptions or other inputs 324,749 76,329 Contributions subsequent to the measurement date 43,202 -
Total $ 446,443 76,710
Deferred outflows of resources related to OPEB resulting from contributions subsequent to the measurement date of $43,202 will be recognized as a reduction of the OPEB liability for the year ended September 30, 2021.
Other amounts reported as deferred outflows of resources related to OPEB will be recognized in OPEB expense as follows:
2020 $ 69,975 2021 69,975 2022 69,975 2023 52,464 2024 62,122
Thereafter 2,020
$ 326,531
Measurement Year Ended December 31,
L. Defined Benefit Pension Plan Plan Description The City participates as one of 888 plans in the nontraditional, joint contributory,
hybrid defined benefit pension plan administered by TMRS. TMRS is an agency created by the State of Texas and administered in accordance with the TMRS Act,
DRAFT

80
City of Waco, Texas
Notes to Financial Statements (Continued)
IV. Detail Notes on All Funds (continued)
L. Defined Benefit Pension Plan (continued) Plan Description (continued)
Subtitle G, Title 8, Texas Government Code (the TMRS Act) as an agent multiple-employer retirement system for municipal employees in the State of Texas. The TMRS Act places the general administration and management of the System with a six-member Board of Trustees. Although the Governor, with the advice and consent of the Senate, appoints the Board, TMRS is not fiscally dependent on the State of Texas. TMRS’s defined benefit pension plan is a tax-qualified plan under Section 401(a) of the Internal Revenue Code. TMRS issues a publicly available comprehensive annual financial report (CAFR) that can be obtained at www.tmrs.com.
All eligible employees of the City are required to participate in TMRS. Benefits Provided
TMRS provides retirement, disability, and death benefits. Benefit provisions are adopted by the governing body of the City, within the options available in the state statutes governing TMRS.
At retirement, the benefit is calculated as if the sum of the employee’s contributions,
with interest, and the City-financed monetary credits with interest were used to purchase an annuity. Members may choose to receive their retirement benefit in one of seven payment options. Members may also choose to receive a portion of their benefit as a Partial Lump Sum Distribution in an amount equal to 12, 24, or 36 monthly payments, which cannot exceed 75% of the member’s deposits and interest.
Employees covered by benefit terms: At the December 31, 2019 valuation and
measurement date, the following employees were covered by the benefit terms:
Inactive employees or beneficiaries current receiving benefits 1,093 Inactive employees entitled to but not yet receiving benefits 643 Active employees 1,449
3,185
Contributions
The contribution rates for employees in TMRS are either 5%, 6%, or 7% of employee gross earnings, and the City matching percentages are either 100%, 150%, or 200%, both as adopted by the governing body of the City. Under the state law governing
DRAFT

81
City of Waco, Texas
Notes to Financial Statements (Continued)
IV. Detail Notes on All Funds (continued)
L. Defined Benefit Pension Plan (continued)
Contributions (continued) TMRS, the contribution rate for each city is determined annually by the actuary,
using the Entry Age Normal (EAN) actuarial cost method. The actuarially determined rate is the estimated amount necessary to finance the cost of benefits earned by employees during the year, with an additional amount to finance any unfunded accrued liability.
Employees for the City of Waco were required to contribute 7.0% of their annual
gross earnings during the fiscal year. The contribution rates for the City of Waco were 14.02% and 14.33% in calendar years 2019 and 2020, respectively. The City’s contributions to TMRS for the year ended September 30, 2020 were $13,700,810 and were in excess of the required contributions.
Net Pension Liability The City’s Net Pension Liability (NPL) was measured as of December 31, 2019, and
the Total Pension Liability (TPL) used to calculate the Net Pension Liability was determined by an actuarial valuation as of that date.
Actuarial assumptions: The Total Pension Lability in the December 31, 2019
actuarial valuation was determined using the following actuarial assumptions:
Inflation 2.50% per year Overall payroll growth 2.75% per year, adjusted down for population declines, if any Investment rate of return 6.75%, net of pension plan investment expense, including inflation
Salary increases were based on a service-related table. Mortality rates for active members are based on the PUB(10) mortality tables with the Public Safety table used for males and the General Employee table used for females. Mortality rates for healthy retirees and beneficiaries are based on the Gender-distinct 2019 Municipal Retirees of Texas mortality tables. The rates for actives, healthy retirees and beneficiaries are projected on a fully generational basis by Scale UMP to account for future mortality improvements. For disabled annuitants, the same mortality tables for healthy retirees used with a 4-year set-forward for males and a 3-year set-forward for females. In addition, a 3.5% and 3.0% minimum mortality rate is applied, for males and females respectively, to reflect the impairment for younger members who become disabled. The rates are projected on a fully generational basis by Scale UMP to account for future mortality improvements subject to the floor.
DRAFT

82
City of Waco, Texas
Notes to Financial Statements (Continued)
IV. Detail Notes on All Funds (continued)
L. Defined Benefit Pension Plan (continued)
Net Pension Liability (continued) The actuarial assumptions were developed primarily from the actuarial investigation
of the experience of TMRS over the four year period from December 31, 2014 to December 31, 2018. They were adopted in 2019 and first used in the December 31, 2019 actuarial valuation. The post-retirement mortality assumption for Annuity Purchase Rate (APRs) is based on the Mortality Experience Investigation Study covering 2009 through 2011 and dated December 31, 2013. Plan assets are managed on a total return basis with an emphasis on both capital appreciation as well as the production of income, in order to satisfy the short-term and long-term funding needs of TMRS.
The long-term expected rate of return on pension plan investments was determined
using a building-block method in which best estimate ranges of expected future real rates of return (expected returns, net of pension plan investment expense and inflation) are developed for each major asset class. These ranges are combined to produce the long-term expected rate of return by weighting the expected future real rates of return by the target asset allocation percentage and by adding expected inflation. In determining their best estimate of a recommended investment return assumption under the various alternative asset allocation portfolios, GRS focused on the area between (1) arithmetic mean (aggressive) without an adjustment for time (conservative) and (2) the geometric mean (conservative) with an adjustment for time (aggressive). The target allocation and best estimates of arithmetic real rates of return for each major asset class in fiscal year 2020 are summarized in the following table:
Long-Term Expected RealAsset Class Rate of Return (Arithmetic)
Global Equity 30.0% 5.3%Core Fixed Income 10.0% 1.25%Non-Core Fixed Income 20.0% 4.14%Real Return 10.0% 3.85%Real Estate 10.0% 4.00%Absolute Return 10.0% 3.48%Private Equity 10.0% 7.75% Total 100.0%
Target Allocation
DRAFT

83
City of Waco, Texas
Notes to Financial Statements (Continued)
IV. Detail Notes on All Funds (continued)
L. Defined Benefit Pension Plan (continued) Net Pension Liability (continued) Discount Rate: The discount rate used to measure the Total Pension Liability was
6.75%. The projection of cash flows used to determine the discount rate assumed that employee and employer contributions will be made at the rates specified in statute. Based on that assumption, the pension plan’s Fiduciary Net Position was projected to be available to make all projected future benefit payments of current active and inactive employees. Therefore, the long-term expected rate of return on pension plan investments was applied to all periods of projected benefit payments to determine the Total Pension Liability.
Changes in the Net Pension Liability
Total Pension Plan Fiduciary Net PensionLiability Net Position Liability
(a) (b) (a) - (b)
Balance at December 31, 2018 $ 508,588,361 421,885,037 86,703,324
Changes for the year: Service cost 12,631,699 - 12,631,699 Interest 33,835,653 - 33,835,653 Difference between expected and actual experience 2,546,787 - 2,546,787 Changes of assumptions 1,426,701 - 1,426,701 Contributions - employer - 13,084,126 (13,084,126) Contributions - employee - 6,105,921 (6,105,921) Net investment income - 65,178,854 (65,178,854) Benefit payments, including refunds of employee contributions (27,270,560) (27,270,560) - Administrative expense - (368,538) 368,538 Other changes - (11,069) 11,069 Net changes 23,170,280 56,718,734 (33,548,454)
Balance at December 31, 2019 $ 531,758,641 478,603,771 53,154,870
Increase (Decrease)
Sensitivity of the net pension liability to changes in the discount rate: The following presents the net pension liability of the City, calculated using the discount rate of 6.75%, as well as what the City’s net pension liability would be if it were calculated
DRAFT

84
City of Waco, Texas
Notes to Financial Statements (Continued)
IV. Detail Notes on All Funds (continued)
L. Defined Benefit Pension Plan (continued) using a discount rate that is one percentage point lower (5.75%) or one percentage
point higher (7.75%) than the current rate:
Current1% Decrease in Discount 1% Increase inDiscount Rate Rate Discount Rate
(5.75%) (6.75%) (7.75%)
City's net pension liability (asset) $ 118,713,524 53,154,870 (1,733,249)
Pension Plan Fiduciary Net Position: Detailed information about the pension plan’s Fiduciary Net Position is available in a separately-issued TMRS financial report. That report may be obtained on the Internet at www.tmrs.com. Pension Expense and Deferred Outflows of Resources and Deferred Inflows of Resources Related to Pensions For the year ended September 30, 2020, the City recognized pension expense of $15,399,185. At September 30, 2020, the City reported deferred outflows of resources and deferred inflows of resources related to pensions from the following sources:
Deferred DeferredOutflows of Inflows ofResources Resources
Differences between expected and actual experience $ 3,301,411 118,221 Changes in actuarial assumptions 1,075,297 - Net difference between projected and actual earnings on pension plan investments - 14,667,394 Contributions subsequent to the measurement date 10,003,438 -
Total $ 14,380,146 14,785,615
Deferred outflows of resources related to pensions resulting from contributions subsequent to the measurement date of $10,003,438 will be recognized as a reduction of the net pension liability for the year ending September 30, 2021. Other amounts
DRAFT

85
City of Waco, Texas
Notes to Financial Statements (Continued)
IV. Detail Notes on All Funds (continued)
L. Defined Benefit Pension Plan (continued)
Pension Expense and Deferred Outflows of Resources and Deferred Inflows of Resources Related to Pensions (continued)
reported as deferred outflows and inflows of resources related to pensions will be
recognized in pension expense as follows:
MeasurementYear Ended
December 31:
2020 $ (2,804,090)2021 (2,775,990)2022 2,452,771 2023 (7,281,598)
$ (10,408,907)
M. Fire and Police One-half Pay Pension The City funded on a pay-as-you-go basis and administered a one-half single-
employer defined benefit pension plan for employees who were not eligible to participate when TMRS was adopted. Any policeman, fireman or fire alarm operator employed by the City prior to September 12, 1950, and their named dependents are entitled to benefits under this plan. Employees were able to retire after 25 years of service. The City Council passed an ordinance for pension pay equal to one-half of the salary for each employee at the time of retirement.
There are two retired firemen’s dependents remaining under this plan. An actuarial valuation has not been performed on this plan due to its small relative
size. The estimated unfunded liability based on the present value of future benefits with a 7.5 percent interest rate assumption is $74,344 at September 30, 2020.
These benefits are budgeted and recorded in the general fund as expenditures in the
year paid. Total costs of these paid benefits for the three years ended September 30, are as follows:
2020 $ 18,444 2019 18,444 2018 23,394
DRAFT

86
City of Waco, Texas
Notes to Financial Statements (Continued)
IV. Detail Notes on All Funds (continued)
N. Solid Waste Landfill Closure and Post-closure Care Cost
State and federal laws and regulations require that the City place a final cover on its landfill when closed and perform certain maintenance and monitoring functions at the landfill site for thirty years after closure. In addition to operating expenses related to current activities of the landfill, an expense provision and related liability are being recognized based on the future closure and post-closure care costs that will be incurred near or after the date the landfill no longer accepts waste. The recognition of these landfill closure and post-closure care costs is based on the amount of usage of the landfill to date. The estimated liability for landfill closure and post-closure care costs included in accrued liabilities is $6,254,242 as of September 30, 2020, which is based on 87.5% usage (filled) of the landfill. It is estimated that an additional $892,849 will be recognized as closure and post-closure care expenses between the date of the statement of net position and the date the landfill is expected to be filled to capacity (2024). The estimated total current cost of the landfill closure and post-closure care ($7,147,091) is based on the amount that would be paid if all equipment, facilities, and services required to close, monitor and maintain the landfill were acquired as of September 30, 2020. However, the actual cost of closure and postclosure care may change due to inflation, changes in technology, or changes in landfill laws and regulations.
O. Waco Public Improvement District #2
Waco Public Improvement District No. 2 transactions are recorded in an agency fund as the City acts as an agent for the property owner in collecting assessments and forwarding the collections to the bondholders. However, the City is not obligated in any manner for repayment of these special assessments. As of September 30, 2020, such special assessment debt outstanding totaled $430,000.
P. Termination of Undivided Interest in Waco Metropolitan Area Regional Sewer System
During 2004, the City entered into an agreement with four other participating cities to acquire the facilities and operations of the Waco Metropolitan Area Regional Sewer System (the System or WMARSS) from Brazos River Authority (the Authority). Prior to the acquisition, the cities were “tenants in common” of the System owned by the Authority, and funded the System through payments to the Authority based on the amount of wastewater treated. The City’s initial purchase included an 84.47% undivided interest in the System; however, the City subsequently sold portions of its undivided interest to other cities.
DRAFT

87
City of Waco, Texas
Notes to Financial Statements (Continued)
IV. Detail Notes on All Funds (continued)
P. Termination Undivided Interest in Waco Metropolitan Area Regional Sewer System (continued)
Effective October 1, 2019, the City executed a termination agreement with the six
participating cities in WMARSS. The agreement terminated the operation and management agreements, discontinued all WMARSS operations, accepted the conveyance of WMARSS assets to the City, and allowed the conveyance of certain WMARSS easements to the City and the City of Lorena. Simultaneously, the City executed wholesale wastewater contracts with each of the cities of Bellmead, Hewitt, Lacy Lakeview, Lorena, Robinson and Woodway for each of the cities to become a customer of the City’s solely-owned wastewater system. The City did not pay cash consideration or assume bonded indebtedness of the participating cities in return of the transfer of ownership interests. Under the previous arrangement WMARSS member cities shared in percentages of operations and maintenance and capital project expenditures. Under the new arrangement, costs are recovered through rates set for operations and maintenance, capital improvements, and capacity expansion. The impact of this termination on the City is a special item gain of $29,769,651 recognized in the wastewater fund and business-type activities.
Q. Related Organization Waco Education Finance Corporation is a related organization to which the City
appoints board members but for which the City has no significant financial accountability.
R. Tax Abatements
The City of Waco negotiates property tax abatements on an individual basis. All abatements are governed by Section 312 of the Texas Tax Code and the City of Waco Guidelines and Policy Statement which are revised and adopted every two years in accordance with state law. These guidelines permit the City to abate property taxes for a variety of economic development purposes such as business relocation, retention, and expansion and include abatements for real and personal property improvements.
DRAFT

88
City of Waco, Texas
Notes to Financial Statements (Continued)
IV. Detail Notes on All Funds (continued)
R. Tax Abatements (continued) City guidelines generally limit abatements to periods of five to seven years. Abatements may be granted for 5% to 90% of taxable values through a direct reduction of the applicant’s property tax bill based upon the location of the property, square footage of the property, and/or the type of economic development commitments made to the City. Each abatement is supported by an agreement that enumerates the criteria under which compliance will be assessed annually and the manner in which tax revenue may be recaptured if the stated criteria are not met. Examples of compliance requirements and related commitments by recipients include addition of total minimum number of full-time jobs and minimum number of jobs for residents of the City as well as property improvement values. The City has not made any commitments as part of the agreements other than to reduce taxes, and they are not subject to any tax abatement agreements entered into by other governmental entities or by component units. Gross dollar amounts by which the City’s tax revenues were reduced during the fiscal year as a result of tax abatement agreements were as follows:
Abatement ProgramAbatements
Granted Commercial - Real Property $ 68,102,595 Commercial - Personal Property 9,462,433 Residential 2,694,565
$ 80,259,593
S. Authoritative Pronouncements Not Yet Effective
A summary of pronouncements issued by the Governmental Accounting Standards Board (GASB) which may impact the City but are not yet effective follows. The City has not yet determined the effects of the adoption of these pronouncements on the financial statements.
DRAFT
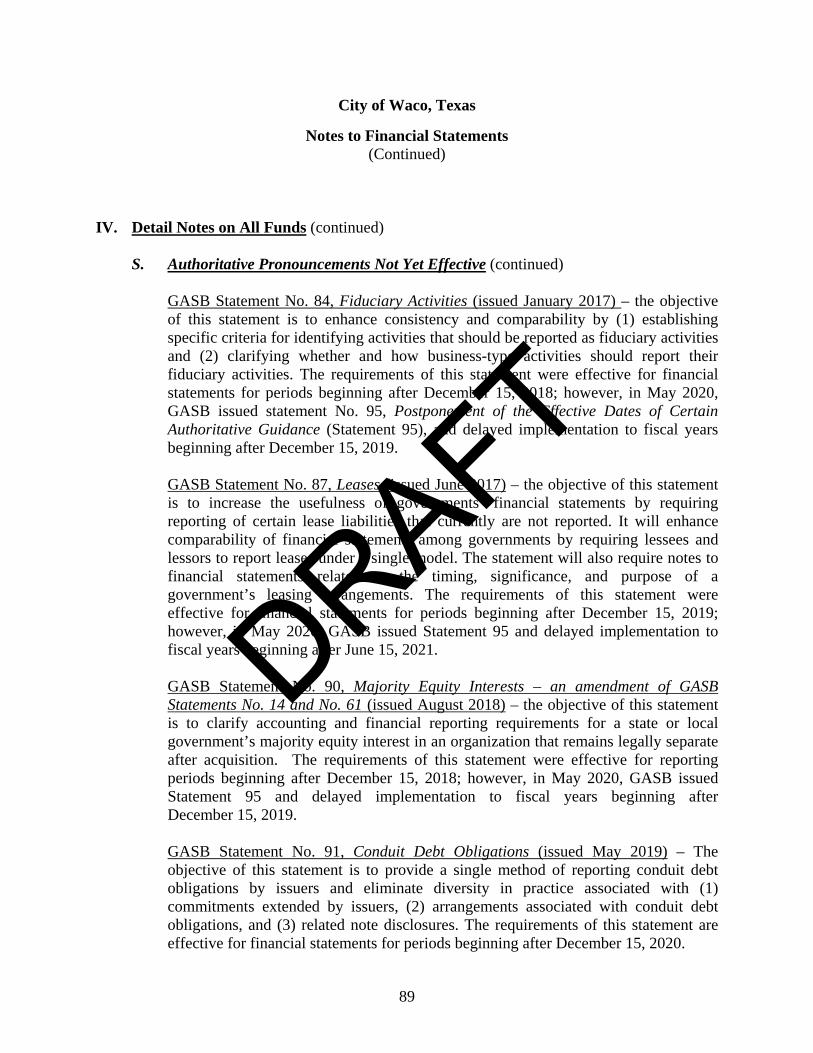
89
City of Waco, Texas
Notes to Financial Statements (Continued)
IV. Detail Notes on All Funds (continued)
S. Authoritative Pronouncements Not Yet Effective (continued)
GASB Statement No. 84, Fiduciary Activities (issued January 2017) – the objective of this statement is to enhance consistency and comparability by (1) establishing specific criteria for identifying activities that should be reported as fiduciary activities and (2) clarifying whether and how business-type activities should report their fiduciary activities. The requirements of this statement were effective for financial statements for periods beginning after December 15, 2018; however, in May 2020, GASB issued statement No. 95, Postponement of the Effective Dates of Certain Authoritative Guidance (Statement 95), and delayed implementation to fiscal years beginning after December 15, 2019.
GASB Statement No. 87, Leases (issued June 2017) – the objective of this statement
is to increase the usefulness of governments’ financial statements by requiring reporting of certain lease liabilities that currently are not reported. It will enhance comparability of financial statements among governments by requiring lessees and lessors to report leases under a single model. The statement will also require notes to financial statements related to the timing, significance, and purpose of a government’s leasing arrangements. The requirements of this statement were effective for financial statements for periods beginning after December 15, 2019; however, in May 2020, GASB issued Statement 95 and delayed implementation to fiscal years beginning after June 15, 2021.
GASB Statement No. 90, Majority Equity Interests – an amendment of GASB Statements No. 14 and No. 61 (issued August 2018) – the objective of this statement is to clarify accounting and financial reporting requirements for a state or local government’s majority equity interest in an organization that remains legally separate after acquisition. The requirements of this statement were effective for reporting periods beginning after December 15, 2018; however, in May 2020, GASB issued Statement 95 and delayed implementation to fiscal years beginning after December 15, 2019. GASB Statement No. 91, Conduit Debt Obligations (issued May 2019) – The objective of this statement is to provide a single method of reporting conduit debt obligations by issuers and eliminate diversity in practice associated with (1) commitments extended by issuers, (2) arrangements associated with conduit debt obligations, and (3) related note disclosures. The requirements of this statement are effective for financial statements for periods beginning after December 15, 2020.
DRAFT

90
City of Waco, Texas
Notes to Financial Statements (Continued)
IV. Detail Notes on All Funds (continued)
T. Authoritative Pronouncements Not Yet Effective (continued) GASB Statement No. 96, Subscription-Based Information Technology Arrangements (issued May 2020) – The objective of this statement is to provide guidance for subscription based information technology arrangements (SBITA). It will define SBITA contracts, provide guidance on the accounting for the SBITAs, and require disclosures regarding the SBITAs. The requirements of this statement are effective for financial statements for fiscal years beginning after June 15, 2022.
DRAFT

91
Required Supplemental Information
DRAFT

92
DRAFT
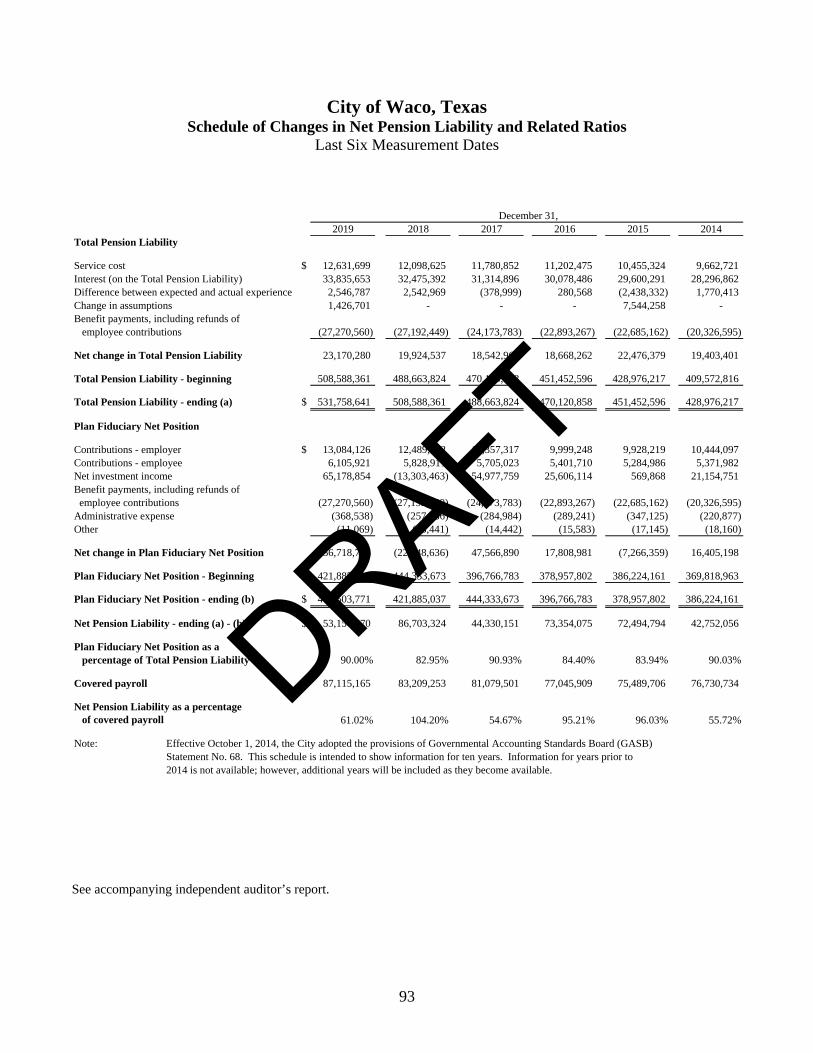
93
City of Waco, Texas Schedule of Changes in Net Pension Liability and Related Ratios
Last Six Measurement Dates
2019 2018 2017 2016 2015 2014Total Pension Liability
Service cost $ 12,631,699 12,098,625 11,780,852 11,202,475 10,455,324 9,662,721 Interest (on the Total Pension Liability) 33,835,653 32,475,392 31,314,896 30,078,486 29,600,291 28,296,862 Difference between expected and actual experience 2,546,787 2,542,969 (378,999) 280,568 (2,438,332) 1,770,413 Change in assumptions 1,426,701 - - - 7,544,258 - Benefit payments, including refunds of employee contributions (27,270,560) (27,192,449) (24,173,783) (22,893,267) (22,685,162) (20,326,595)
Net change in Total Pension Liability 23,170,280 19,924,537 18,542,966 18,668,262 22,476,379 19,403,401
Total Pension Liability - beginning 508,588,361 488,663,824 470,120,858 451,452,596 428,976,217 409,572,816
Total Pension Liability - ending (a) $ 531,758,641 508,588,361 488,663,824 470,120,858 451,452,596 428,976,217
Plan Fiduciary Net Position
Contributions - employer $ 13,084,126 12,489,042 11,357,317 9,999,248 9,928,219 10,444,097 Contributions - employee 6,105,921 5,828,911 5,705,023 5,401,710 5,284,986 5,371,982 Net investment income 65,178,854 (13,303,463) 54,977,759 25,606,114 569,868 21,154,751 Benefit payments, including refunds of employee contributions (27,270,560) (27,192,449) (24,173,783) (22,893,267) (22,685,162) (20,326,595)Administrative expense (368,538) (257,236) (284,984) (289,241) (347,125) (220,877)Other (11,069) (13,441) (14,442) (15,583) (17,145) (18,160)
Net change in Plan Fiduciary Net Position 56,718,734 (22,448,636) 47,566,890 17,808,981 (7,266,359) 16,405,198
Plan Fiduciary Net Position - Beginning 421,885,037 444,333,673 396,766,783 378,957,802 386,224,161 369,818,963
Plan Fiduciary Net Position - ending (b) $ 478,603,771 421,885,037 444,333,673 396,766,783 378,957,802 386,224,161
Net Pension Liability - ending (a) - (b) $ 53,154,870 86,703,324 44,330,151 73,354,075 72,494,794 42,752,056
Plan Fiduciary Net Position as a percentage of Total Pension Liability 90.00% 82.95% 90.93% 84.40% 83.94% 90.03%
Covered payroll $ 87,115,165 83,209,253 81,079,501 77,045,909 75,489,706 76,730,734
Net Pension Liability as a percentage of covered payroll 61.02% 104.20% 54.67% 95.21% 96.03% 55.72%
Note: Effective October 1, 2014, the City adopted the provisions of Governmental Accounting Standards Board (GASB) Statement No. 68. This schedule is intended to show information for ten years. Information for years prior to2014 is not available; however, additional years will be included as they become available.
December 31,
See accompanying independent auditor’s report.
DRAFT

94
City of Waco, Texas Schedule of Pension Contributions
Fiscal Years Ended
2020 2019 2018 2017 2016 2015
Actuarially determined contribution $ 12,999,559 12,034,470 11,797,668 10,942,485 9,918,113 9,999,116 Contributions in relation to the actuarially determined contribution 13,700,810 12,836,559 12,249,630 10,942,485 9,918,113 9,999,116
Contribution deficiency (excess) $ (701,251) (802,089) (451,962) - - -
Covered payroll $ 91,247,898 85,461,415 82,982,040 79,821,678 76,215,914 75,315,307
Contributions as a percentage of covered payroll 15.02% 15.02% 14.77% 13.71% 13.01% 13.28%
September 30,
Notes to Schedule of Pension Contributions
Valuation Date:
Note Actuarially determined contribution rates are calculated as of December 31 and become effective in January, 13 months later.
Methods and Assumptions Used to Determine Contribution Rates:
Actuarial Cost Method Entry Age Normal
Amortization Method Level Percentage of Payroll, Closed
Remaining Amortization Period 26 years
Asset Valuation Method 10 Year smoothed market; 12% soft corridor
Inflation 2.5%
Salary Increases 3.5% to 11.5%, including inflation
Investment Rate of Return 6.75%
Retirement Age Experience-based table of rates that are specific to the City’s plan of benefits. Last updated for the 2019 valuation pursuant to an experience study of the period 2014 – 2018
Mortality Post-retirement: 2019 Municipal Retirees of Texas Mortality Tables. The rates are projected on a fully generational basis with scale UMP. Pre-retirement: PUB(10) mortality tables, with the Public Safety table Used for males and the General Employee Table used for females. The rates are projected on a fully generational basis with scale UMP.
Other Information There were no benefit changes during the year.
The City implemented GASB Statement No. 68, Accounting and Financial Reporting for Pensions, An Amendment of GASB Statement No. 27, effective October 1, 2014. Information for years prior to 2015 is not available.
See accompanying independent auditor’s report.
DRAFT

95
City of Waco, Texas Schedule of Changes in Total
OPEB Liability and Related Ratios Last Three Measurement Dates
2019 2018 2017Total OPEB liability
Service cost $ 11,927 14,881 11,106 Interest 55,780 53,178 55,396 Difference between expected and actual experience 94,095 (563) - Changes in assumptions or other inputs 303,781 (112,575) 137,980 Benefit payments (59,493) (53,608) (53,860)
Net change in Total OPEB Liability 406,090 (98,687) 150,622
Total OPEB Liability - beginning 1,527,274 1,625,961 1,475,339
Total OPEB Liability - ending $ 1,933,364 1,527,274 1,625,961
Covered-employee payroll $ 87,115,165 83,209,248 76,362,199
Total OPEB liability as a percentage of covered-employee payroll 2.22% 1.84% 2.13%
December 31,
Notes to Schedule of Changes in Total OPEB Liability and Related Ratios
Valuation Date: December 31, 2019
Methods and Assumptions:
Actuarial Cost Method Individual Entry Age Normal
Discount Rate 2.75% as of December 31, 2019
Inflation 2.50%
Salary Increases 3.50% to 11.50%, including inflation
Demographic Assumptions Based on the experience study covering the four-year period ending December 31, 2018 as conducted for the Texas Municipal Retirement System (TMRS)
Mortality For healthy retirees, the gender-distinct 2019 Municipal Retirees of Texas Mortality Tables are used. The rates are projected on a fully generational basis using the ultimate mortality improvement rates in the MP tables to account for future mortality improvements.
Participation Rates 100% of eligible retirees will choose to receive the employer paid life benefit; 50% of those with coverage are assumed to elect optional coverage of $5,000.
Other Information:
Notes Changes of assumptions reflect the effects of changes in the discount rate each period. The following are the discount rates used in each period:
2019 2.75%2018 3.71%2017 3.31%2016 3.81%
There are no assets accumulated in a trust to pay related benefits.
Additionally, the demographic assumptions were updated to reflect the 2019 TMRS Experience Study. The City implemented GASB Statement No. 75, Accounting and Financial Reporting for Postemployment Benefits Other than Pensions, effective October 1, 2017. Information for years prior to 2017 is not available.
DRAFT

96
DRAFT

97
Combining and Individual Fund Statements and Schedules
DRAFT

98
DRAFT

99
General Fund
DRAFT

100
DRAFT

2020 2019AssetsCash and investments $ 89,482,027 $ 83,105,533 Accounts receivable, net of allowances 3,847,978 3,630,048 Due from other funds 3,003,274 2,623,568 Taxes 9,819,239 9,538,625 Intergovernmental receivable 6,032,811 74,843 Inventory 1,025,496 963,711 Real estate held for resale 6,160 6,160
Total assets $ 113,216,985 $ 99,942,488
LiabilitiesAccounts payable $ 2,266,223 $ 2,647,599 Accrued liabilities 6,379,201 5,640,687 Unearned revenue 152,042 20,869 Due to other funds 8,659,352 623,514 Deposits 804,266 646,445 Escrow funds 427,524 460,087
Total liabilities 18,688,608 10,039,201
Deferred inflows of resourcesUnavailable revenue-property taxes 1,980,080 2,126,578 Unavailable revenue court fines 452,891 452,891
Total deferred inflow of resources 2,432,971 2,579,469
Total liabilities and deferred inflows of resources 21,121,579 12,618,670
Fund balance (deficit)Nonspendable
Inventory 1,025,496 963,711 Real estate held for resale 6,160 6,160
Restricted for:Municipal information 1,471,560 1,318,309
Committed to:Economic development 14,496,364 13,688,936
Assigned to:Capital improvements 12,917,754 25,476,197 Culture and recreation 8,236 340,878 Economic development 3,958,032 8,274,949 Other 1,138,853 1,045,887 Public safety 757,889 699,653 Public works 245,706 566,574 Subsequent year's budget appropriation 7,979,534 4,403,230
Unassigned 48,089,822 30,539,334 Total fund balance (deficit) $ 92,095,406 $ 87,323,818
Total liabilities, deferred inflows of resources, and fund balance $ 113,216,985 $ 99,942,488
See accompanying independent auditor's report.
September 30, 2020 and 2019
City of Waco, Texas
General Fund
Comparative Balance SheetsGovernmental Funds
101
DRAFT

2020 2019Revenues:Taxes $ 107,848,201 $ 104,837,511 Business and occupation fees 14,480,403 14,590,418 Permits, licenses and fees 1,980,690 1,875,782 Fines 1,281,770 1,607,374 Charges for services 1,921,824 2,101,940 Investment earnings 1,175,429 2,470,954 Contributions 779,925 677,457 Intergovernmental 9,631,875 2,121,293 Other 13,293,399 15,339,935
Total revenues 152,393,516 145,622,664
Expenditures:Current:
General government 27,574,920 22,288,315 Public works 7,264,287 6,613,207 Public safety 77,593,423 74,909,796 Culture and recreation 15,189,397 15,171,835 Housing and community development 381,159 315,545
Total expenditures 128,003,186 119,298,698 Excess (deficiency) of revenues over expenditures 24,390,330 26,323,966
Other financing sources (uses):Transfers in 7,192,479 5,111,669 Transfers out (26,811,221) (14,204,233)
Total other financing sources (uses) (19,618,742) (9,092,564)
Net change in fund balances 4,771,588 17,231,402 Fund balance, beginning of year 87,323,818 70,092,416 Fund balance, end of year $ 92,095,406 $ 87,323,818
See accompanying independent auditor's report.
City of Waco, TexasComparative Statements of Revenues, Expenditures, and Changes in Fund Balance
Years Ended September 30, 2020 and 2019
General Fund
Governmental Funds
102
DRAFT

103
Nonmajor Governmental Funds
Special Revenue Funds are used to account for specific revenues that are legally restricted to expenditures for particular purposes. Debt Service Funds are used to account for the accumulation of resources and payment of debt for governmental funds. Capital Project Funds are used to account for the acquisition and construction of major capital facilities other than those financed by proprietary funds and trust funds. Permanent Funds are used to report resources that are legally restricted to the extent that only earnings, not principal, may be used for purposes that support the City’s programs.
DRAFT

104
DRAFT

2020 2019AssetsCash and investments $ 49,026,065 $ 536,336 $ 65,585,193 $ 381,019 $ 115,528,613 $ 99,768,349 Accounts receivable, net of allowances 373,878 - - - 373,878 138,775 Due from other funds 540,000 - 10,049,316 - 10,589,316 1,044,045 Special assessments 9,128 - - - 9,128 5,460 Taxes receivable, net of allowance - 423,041 - - 423,041 375,793 Notes receivable 231,272 - - - 231,272 338,144 Advances to other funds - - 168,368 - 168,368 168,368 Intergovernmental receivable 3,551,360 - - - 3,551,360 1,863,206 Real estate held for resale 60,097 - - - 60,097 60,097
Total assets $ 53,791,800 $ 959,377 $ 75,802,877 $ 381,019 $ 130,935,073 $ 103,762,237
LiabilitiesAccounts payable $ 1,962,329 $ - $ 1,667,803 $ - $ 3,630,132 $ 5,786,965 Accrued liabilities 463,956 - 245,104 - 709,060 1,451,551 Due to other funds 1,665,051 - 2,144,316 - 3,809,367 1,181,566 Escrow funds 38,595 - 113,464 - 152,059 1,068,843
Total liabilities 4,129,931 - 4,170,687 - 8,300,618 9,488,925
Deferred inflows of resourcesUnavailable revenue-property taxes - 358,905 - - 358,905 354,015 Unavailable revenue-special assessments 9,128 - - - 9,128 5,460
Total deferred inflows of resources 9,128 358,905 - - 368,033 359,475
Total liabilities and deferred inflows of resources 4,139,059 358,905 4,170,687 - 8,668,651 9,848,400
Fund balances (deficits)Nonspendable:
Parks and cemetery care - - - 381,019 381,019 378,209 Restricted for:
Capital projects - - 50,835,124 - 50,835,124 35,639,375 Culture and recreation 169,374 - - - 169,374 153,891 Debt service - 600,472 - - 600,472 742,629 Housing and Community Development 246,965 - - - 246,965 325,423 Public works 636,582 - - - 636,582 1,142,535 Public safety 1,658,699 - - - 1,658,699 1,568,647 Tax increment zone activities 42,551,716 - - - 42,551,716 37,977,473 Waco Public Improvement District 1,148,686 - - - 1,148,686 1,006,241
Committed to:Capital projects - - 20,797,066 - 20,797,066 12,465,309 Public health 3,240,719 - - - 3,240,719 2,514,105
Total fund balances (deficits) $ 49,652,741 $ 600,472 $ 71,632,190 $ 381,019 $ 122,266,422 $ 93,913,837
Total liabilities, deferred inflows of resources, and fund balances (deficits) $ 53,791,800 $ 959,377 $ 75,802,877 $ 381,019 $ 130,935,073 $ 103,762,237
City of Waco, Texas
Special Revenue Funds
Total Nonmajor Governmental Funds
(With Comparative Totals for September 30, 2019)September 30, 2020
Nonmajor Governmental FundsCombining Governmental Balance Sheet
See accompanying independent auditor's report.
Permanent Funds
Capital Projects Funds
Debt Service Funds
105
DRAFT

2020 2019Revenues:
Taxes $ 14,042,607 $ 11,109,750 $ - $ - $ 25,152,357 $ 24,008,749 Special assessments 630,654 - - - 630,654 530,432 Permits, licenses and fees 986,740 - - - 986,740 1,081,246 Fines 368,246 - - - 368,246 448,254 Investment earnings 497,627 17,904 2,129,274 2,810 2,647,615 5,169,628 Contributions - - 50,000 - 50,000 394,921 Intergovernmental 10,318,776 - - - 10,318,776 7,313,711 Program income 227,685 - - - 227,685 194,820 Other 960,504 - - - 960,504 877,438
Total revenues 28,032,839 11,127,654 2,179,274 2,810 41,342,577 40,019,199
Expenditures:Current:
General government 11,396,502 - - - 11,396,502 8,563,343 Public safety 2,417,640 - - - 2,417,640 844,769 Public works 661,926 - - - 661,926 438,678 Culture and recreation 7,054 - - - 7,054 29,518 Housing and community development 2,544,250 - - - 2,544,250 2,934,790 Public health 8,813,617 - - - 8,813,617 8,944,992
Debt service:Principal - 7,590,000 - - 7,590,000 6,555,000 Interest and fiscal charges - 4,553,085 - - 4,553,085 4,016,921 Bond issuance costs - 123,993 - - 123,993 203,758
Capital outlay - - 21,821,248 - 21,821,248 25,302,918 Total expenditures 25,840,989 12,267,078 21,821,248 - 59,929,315 57,834,687
Excess (deficiency) of revenues over (under) expenditures 2,191,850 (1,139,424) (19,641,974) 2,810 (18,586,738) (17,815,488)
Other financing sources (uses):Refunding bonds issued - - - - - 9,365,000 Payment to refunded bond escrow agent - - - - - (10,434,176)Premium on refunding bonds - - - - - 1,065,159 General obligation bonds issued - 120,234 26,089,766 - 26,210,000 18,560,000 Premium on general obligation bonds - 11,707 2,540,234 - 2,551,941 1,583,439 Transfers in 4,145,627 865,326 19,369,480 - 24,380,433 13,759,451 Transfers out (1,373,051) - (4,830,000) - (6,203,051) (4,412,342)Total other financing sources (uses) 2,772,576 997,267 43,169,480 - 46,939,323 29,486,531
Net change in fund balances 4,964,426 (142,157) 23,527,506 2,810 28,352,585 11,701,043 Fund balances, beginning of year 44,688,315 742,629 48,104,684 378,209 93,913,837 82,212,794 Fund balances, end of year $ 49,652,741 $ 600,472 $ 71,632,190 $ 381,019 $ 122,266,422 $ 93,913,837
Nonmajor Governmental FundsCombining Statement of Revenues, Expenditures and Changes in Fund Balances
See accompanying independent auditor's report.
City of Waco, Texas
For the Year Ended September 30, 2020
Permanent Funds
Capital Projects Funds
(With Comparative Totals for Year Ended September 30, 2019)
Debt Service Funds
Special Revenue Funds
Totals
106
DRAFT

107
Nonmajor Special Revenue Funds
Special Revenue Funds are used to account for specific revenues that are legally restricted to expenditures for particular purposes.
Tax Increment Funds - These funds are used to account for the governmental activities of three tax increment districts - Reinvestment Zone Number One, Reinvestment Zone Number Two, and Reinvestment Zone Number Three Health Programs Fund - This fund is used to account for the activities of the City's health programs operated within McLennan County. Financing is provided from patients' fees, assessments from other governments, and other miscellaneous revenues and federal and state awards. Grant Funds - These funds are used to account for the activities of all grants not accounted for elsewhere. Waco Public Improvement District No. 1 Fund - This fund was created by the government as a means of authorizing the City to undertake improvements and services to a designated geographic area in the central business district/central city. Abandoned Motor Vehicle Fund - This fund is used to account for the activities of the City for handling abandoned motor vehicles picked up by the Police Department and sold at public auction. Article 1436-2, Section 5 of the Penal Code and Ordinance Number 2858, Section 28-42 control the handling of abandoned motor vehicles. Financing is provided from the sale of abandoned motor vehicles at public auction. Police Forfeitures Fund - This fund is used to account for the receipt and expenditure of revenues derived from crime seizures that are for police purposes. Court Security Fund - This fund is used to account for the receipt and expenditure of revenues from court fines restricted for court security. Court Technology Fund - This fund is used to account for the receipt and expenditure of revenues from court fines restricted for court technology. Hamilton Memorial Fund - This fund is used to account for earnings from principal used for improvements to Cameron Park Miss Nellie's Park Maintenance Fund - This fund is used to account for earnings from principal used to maintain Miss Nellie' Pretty Place.
DRAFT

Health Waco PublicTax Increment Tax Increment Tax Increment Programs Improvement
Fund No. 1 Fund No. 2 Fund No. 3 Fund Grant Funds District No. 1 FundAssetsCash and investments $ 41,060,076 $ 2,823,089 $ 72,639 $ 2,362,271 $ 254,242 $ 1,224,420 Accounts receivable, net of allowances 238,980 - - 26,095 98,324 10,479 Due from other funds - - - - 540,000 - Special assessments receivable - - - - - 9,128 Taxes receivable - - - - - - Notes receivable - - - - 231,272 - Intergovernmental receivable - - - 1,289,213 2,262,147 - Real estate held for resale - - - - 60,097 -
Total assets $ 41,299,056 $ 2,823,089 $ 72,639 $ 3,677,579 $ 3,446,082 $ 1,244,027
LiabilitiesAccounts payable $ 941,705 $ - $ - $ 165,576 $ 751,335 $ 86,213 Accrued liabilities 161,363 - - 232,689 69,904 - Due to other funds 540,000 - - - 1,125,051 - Escrow funds - - - 38,595 - -
Total liabilities 1,643,068 - - 436,860 1,946,290 86,213
Deferred inflows of resourcesUnavailable revenue-special assessments - - - - - 9,128
Total deferred inflows of resources - - - - - 9,128
Total liabilities and deferred inflows of resources 1,643,068 - - 436,860 1,946,290 95,341
Fund balances (deficits)Restricted for:
Culture and recreation - - - - 129,979 - Housing and community development - - - - 246,965 - Public works - - - - 636,582 - Public safety - - - - 486,266 - Tax increment zone activities 39,655,988 2,823,089 72,639 - - - Waco Public Improvement District - - - - - 1,148,686
Committed to:Public health - - - 3,240,719 - -
Total fund balances (deficits) $ 39,655,988 $ 2,823,089 $ 72,639 $ 3,240,719 $ 1,499,792 $ 1,148,686
Total liabilities, deferred inflows of resources, and fund balances (deficits) $ 41,299,056 $ 2,823,089 $ 72,639 $ 3,677,579 $ 3,446,082 $ 1,244,027
See accompanying independent auditor's report.
City of Waco, TexasNonmajor Special Revenue Funds
(With Comperative Totals for September 30, 2019)September 30, 2020
Combining Balance Sheet
108
DRAFT

Miss Nellie'sAbandoned Police Court Hamilton Park
Motor Forfeitures Court Security Technology Memorial MaintenanceVehicle Fund Fund Fund Fund Fund Fund 2020 2019
$ 644,803 $ 302,189 $ 132,702 $ 110,239 $ 10,076 $ 29,319 $ 49,026,065 43,706,212$ - - - - - - 373,878 138,775 - - - - - - 540,000 596,000 - - - - - - 9,128 5,460 - - - - - - - - - - - - - - 231,272 338,144 - - - - - - 3,551,360 1,863,206 - - - - - - 60,097 60,097 $ 644,803 $ 302,189 $ 132,702 $ 110,239 $ 10,076 $ 29,319 $ 53,791,800 46,707,894$
$ 14,750 $ 2,432 $ - $ 318 $ - $ - $ 1,962,329 $ 810,167 - - - - - - 463,956 433,572 - - - - - - 1,665,051 733,521 - - - - - - 38,595 36,859 14,750 2,432 - 318 - - 4,129,931 2,014,119
- - - - - - $ 9,128 $ 5,460 - - - - - - 9,128 5,460
. 14,750 2,432 - 318 - - 4,139,059 2,019,579
- - - - 10,076 29,319 $ 169,374 153,891$ - - - - - - 246,965 325,423 - - - - - - 636,582 1,142,535 630,053 299,757 132,702 109,921 - - 1,658,699 1,568,647 - - - - - - 42,551,716 37,977,473 - - - - - - 1,148,686 1,006,241
- - - - - - 3,240,719 2,514,105 $ 630,053 $ 299,757 $ 132,702 $ 109,921 $ 10,076 $ 29,319 $ 49,652,741 44,688,315$
$ 644,803 $ 302,189 $ 132,702 $ 110,239 $ 10,076 $ 29,319 $ 53,791,800 46,707,894$
Totals
109
DRAFT

Waco PublicHealth Improvement
Tax Increment Tax Increment Tax Increment Programs District No. 1Fund No. 1 Fund No. 2 Fund No. 3 Fund Grant Funds Fund
Revenues:Property taxes $ 13,850,647 $ 191,442 $ 518 $ - $ - $ - Special assessments - - - - - 630,654 Permits, licenses and fees - - - 986,740 - - Fines - - - - - - Investment earnings 425,141 27,718 750 26,730 - 12,348 Intergovernmental 1,309,802 18,539 29 3,905,589 5,084,817 - Program income - - - 151,986 75,699 - Other - - - 606,038 248,839 68,243
Total revenues 15,585,590 237,699 1,297 5,677,083 5,409,355 711,245
Expenditures:Current:
General government 10,385,017 - - - 442,685 568,800 Public safety - - - - 2,304,688 - Public works - - - - 661,926 - Culture and recreation - - - - 6,526 - Housing and community development - - - - 2,544,250 - Public health - - - 8,813,617 - -
Total expenditures 10,385,017 - - 8,813,617 5,960,075 568,800 Excess (deficiency) of revenues over (under) expenditures 5,200,573 237,699 1,297 (3,136,534) (550,720) 142,445
Other financing sources (uses):Transfers in - - - 3,863,148 282,479 - Transfers out (865,326) - - - - -
Total other financing sources (uses) (865,326) - - 3,863,148 282,479 -
Net change in fund balances 4,335,247 237,699 1,297 726,614 (268,241) 142,445 Fund balances, beginning of year 35,320,741 2,585,390 71,342 2,514,105 1,768,033 1,006,241 Fund balances, end of year $ 39,655,988 $ 2,823,089 $ 72,639 $ 3,240,719 $ 1,499,792 $ 1,148,686
See accompanying independent auditor's report.
City of Waco, Texas
Year Ended September 30, 2020Nonmajor Special Revenue Funds
Combining Statement of Revenues, Expenditures, and Changes in Fund Balances
(With Comparative Totals for September 30, 2019)
110
DRAFT

Miss Nellie'sAbandoned Police Court Hamilton Park
Motor Forfeitures Court Security Technology Memorial MaintenanceVehicle Fund Fund Fund Fund Fund Fund 2020 2019
$ - $ - $ - $ - $ - $ - $ 14,042,607 14,758,484$ - - - - - - 630,654 560,432 - - - - - - 986,740 1,081,246 303,951 - 31,911 32,384 - - 368,246 448,254 - 3,388 - - 208 1,344 497,627 971,855 - - - - - - 10,318,776 7,313,711 - - - - - - 227,685 194,820 - 37,384 - - - - 960,504 877,438 303,951 40,772 31,911 32,384 208 1,344 28,032,839 26,206,240
- - - - - - 11,396,502 8,563,343 15,218 66,538 9,629 21,567 - - 2,417,640 844,769 - - - - - - 661,926 438,678 - - - - - 528 7,054 29,518 - - - - - - 2,544,250 2,934,790 - - - - - - 8,813,617 8,944,992 15,218 66,538 9,629 21,567 - 528 25,840,989 21,756,090
288,733 (25,766) 22,282 10,817 208 816 2,191,850 4,450,150
- - - - - - 4,145,627 5,385,061 (420,522) - (87,203) - - - (1,373,051) (2,040,692) (420,522) - (87,203) - - - 2,772,576 3,344,369
(131,789) (25,766) (64,921) 10,817 208 816 4,964,426 7,234,087 761,842 325,523 197,623 99,104 9,868 28,503 44,688,315 37,454,228 $ 630,053 $ 299,757 $ 132,702 $ 109,921 $ 10,076 $ 29,319 $ 49,652,741 $ 44,688,315
Totals
111
DRAFT

112
DRAFT

113
Tax Increment Fund No. 1
DRAFT

2020 2019AssetsCash and investments $ 41,060,076 $ 36,171,808 Accounts receivable, net of allowances 238,980 7,736
Total assets $ 41,299,056 $ 36,179,544
LiabilitiesAccounts payable $ 941,705 $ 101,440 Accrued liabilities 161,363 161,363 Due to other funds 540,000 596,000
Total liabilities 1,643,068 858,803
Fund balance (deficit)Restricted for:
Tax increment zone activities 39,655,988 35,320,741 Total fund balance (deficit) $ 39,655,988 $ 35,320,741
Total liabilities and fund balance $ 41,299,056 $ 36,179,544
City of Waco, TexasComparative Balance Sheets
September 30, 2020 and 2019Nonmajor Special Revenue Funds
Tax Increment Fund No. 1
See accompanying independent auditor's report.
114
DRAFT

2020 2019Revenues:Property taxes $ 13,850,647 $ 13,996,581 Investment earnings 425,141 822,963 Intergovernmental 1,309,802 791,387
Total revenues 15,585,590 15,610,931
Expenditures:Current:
General government 10,385,017 7,495,664 Total expenditures 10,385,017 7,495,664
Excess (deficiency) of revenues over expenditures 5,200,573 8,115,267
Other financing sources (uses):Transfers out (865,326) (1,479,984)
Total other financing sources (uses) (865,326) (1,479,984)
Net change in fund balance 4,335,247 6,635,283 Fund balance, beginning of year 35,320,741 28,685,458
Fund balance, end of year $ 39,655,988 $ 35,320,741
See accompanying independent auditor's report.
City of Waco, TexasComparative Statements of Revenues, Expenditures and Changes in Fund Balance
Years Ended September 30, 2020 and 2019
Tax Increment Fund No. 1
Nonmajor Special Revenue Funds
115
DRAFT

116
DRAFT

117
Tax Increment Fund No. 2
DRAFT

2020 2019AssetsCash and investments $ 2,823,089 $ 2,585,390
Total assets $ 2,823,089 $ 2,585,390
Fund balance (deficit)Restricted for:
Tax increment zone activities $ 2,823,089 $ 2,585,390 Total fund balance (deficit) $ 2,823,089 $ 2,585,390
Total liabilities and fund balance $ 2,823,089 $ 2,585,390
See accompanying independent auditor's report.
Nonmajor Special Revenue Funds
City of Waco, TexasComparative Balance Sheets
September 30, 2020 and 2019
Tax Increment Fund No. 2
118
DRAFT
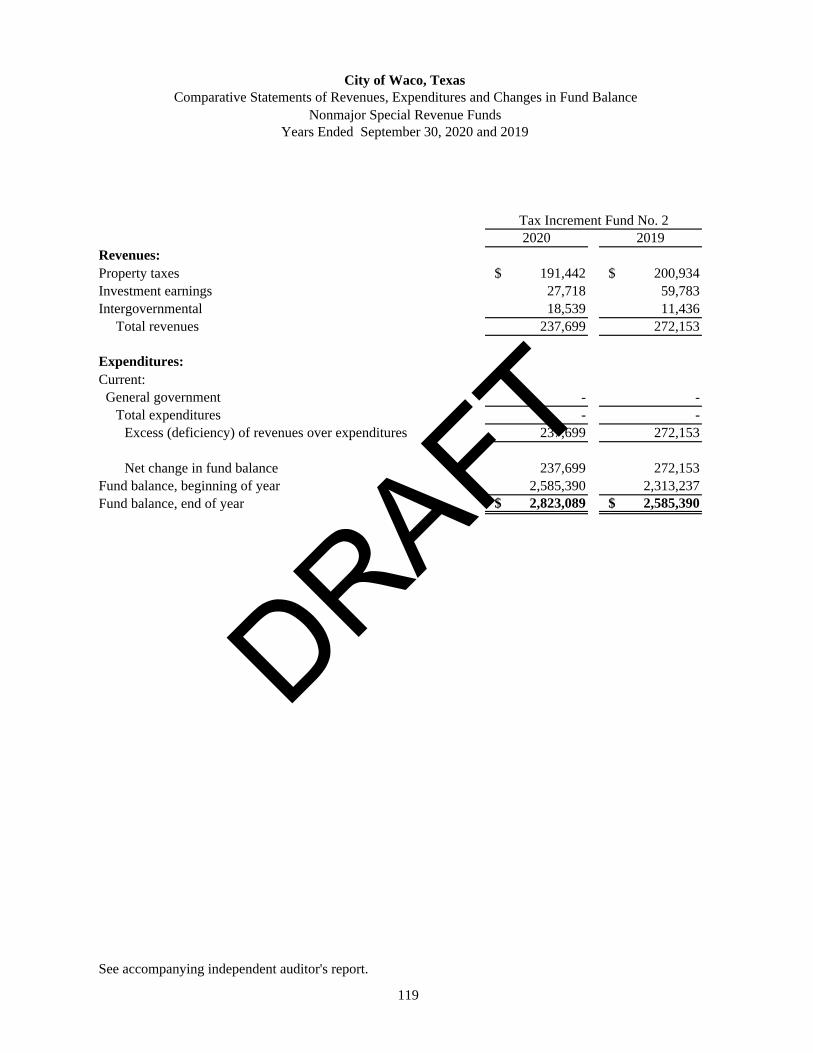
2020 2019Revenues:Property taxes $ 191,442 $ 200,934 Investment earnings 27,718 59,783 Intergovernmental 18,539 11,436
Total revenues 237,699 272,153
Expenditures:Current: General government - -
Total expenditures - - Excess (deficiency) of revenues over expenditures 237,699 272,153
Net change in fund balance 237,699 272,153 Fund balance, beginning of year 2,585,390 2,313,237 Fund balance, end of year $ 2,823,089 $ 2,585,390
See accompanying independent auditor's report.
City of Waco, TexasComparative Statements of Revenues, Expenditures and Changes in Fund Balance
Years Ended September 30, 2020 and 2019
Tax Increment Fund No. 2
Nonmajor Special Revenue Funds
119
DRAFT

120
DRAFT

121
Tax Increment Fund No. 3
DRAFT

2020 2019AssetsCash and investments $ 72,639 $ 71,342
Total assets $ 72,639 $ 71,342
Fund balance (deficit)Restricted for:
Tax increment zone activities $ 72,639 $ 71,342
Total fund balance (deficit) $ 72,639 $ 71,342
See accompanying independent auditor's report.
City of Waco, TexasComparative Balance Sheets
September 30, 2020 and 2019
Tax Increment Fund No. 3
Nonmajor Special Revenue Funds
122
DRAFT

2020 2019Revenues:Property taxes $ 518 $ 537 Investment earnings 750 1,701 Intergovernmental 29 31
Total revenues 1,297 2,269
Expenditures:Current:General government - -
Total expenditures - - Excess (deficiency) of revenues over expenditures 1,297 2,269
Net change in fund balance 1,297 2,269 Fund balance, beginning of year 71,342 69,073 Fund balance, end of year $ 72,639 $ 71,342
See accompanying independent auditor's report.
City of Waco, TexasComparative Statements of Revenues, Expenditures, and
Years Ended September 30, 2020 and 2019
Tax Increment Fund No. 3
Changes in Fund BalanceNonmajor Special Revenue Funds
123
DRAFT

124
DRAFT

125
Health Programs Fund
DRAFT
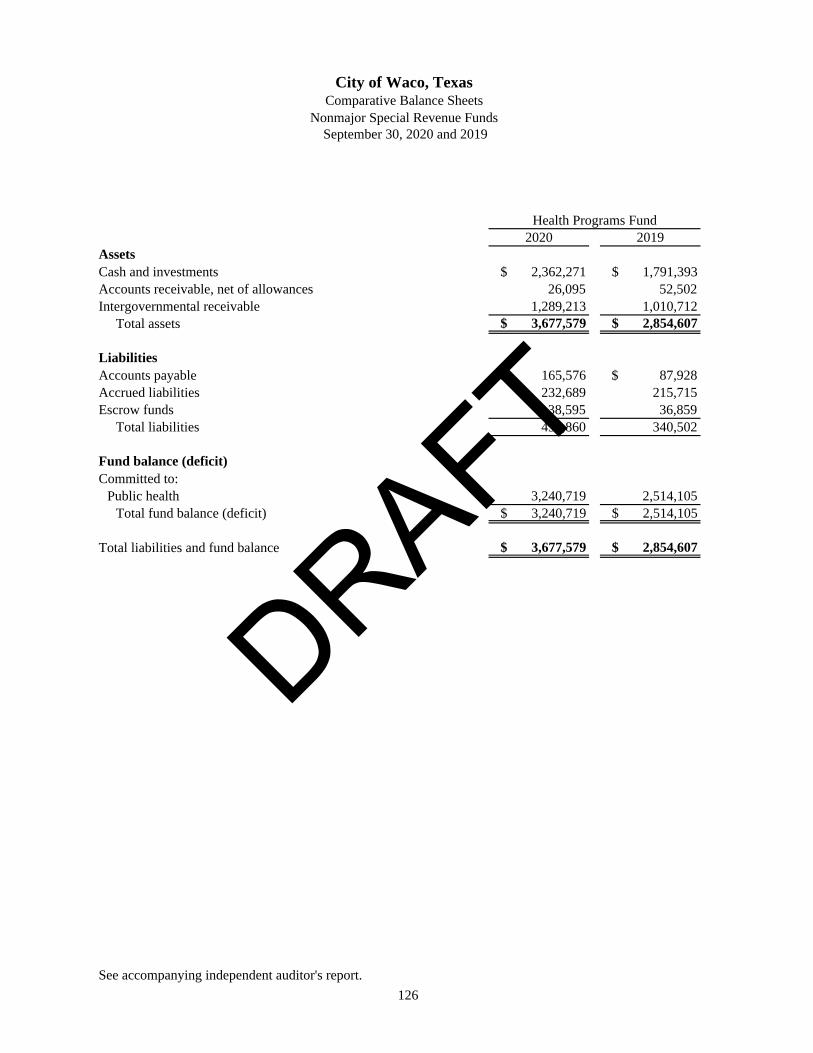
2020 2019AssetsCash and investments $ 2,362,271 $ 1,791,393 Accounts receivable, net of allowances 26,095 52,502 Intergovernmental receivable 1,289,213 1,010,712
Total assets $ 3,677,579 $ 2,854,607
LiabilitiesAccounts payable $ 165,576 $ 87,928 Accrued liabilities 232,689 215,715 Escrow funds 38,595 36,859
Total liabilities 436,860 340,502
Fund balance (deficit)Committed to:
Public health 3,240,719 2,514,105 Total fund balance (deficit) $ 3,240,719 $ 2,514,105
Total liabilities and fund balance $ 3,677,579 $ 2,854,607
See accompanying independent auditor's report.
City of Waco, TexasComparative Balance Sheets
September 30, 2020 and 2019
Health Programs Fund
Nonmajor Special Revenue Funds
126
DRAFT

2020 2019Revenues:Permits, licenses and fees $ 986,740 $ 1,081,246 Investment earnings 26,730 50,252 Intergovernmental 3,905,589 3,486,394 Program income 151,986 160,262 Other 606,038 676,337
Total revenues 5,677,083 5,454,491
Expenditures:Current:
Public health 8,813,617 8,944,992 Total expenditures 8,813,617 8,944,992
Excess (deficiency) of revenues over expenditures (3,136,534) (3,490,501)
Other financing sources (uses):Transfers in 3,863,148 3,837,160 Transfers out - (250,000)
Total other financing sources (uses) 3,863,148 3,587,160
Net change in fund balance 726,614 96,659 Fund balance, beginning of year 2,514,105 2,417,446
Fund balance, end of year $ 3,240,719 $ 2,514,105
City of Waco, TexasComparative Statements of Revenues, Expenditures, and Changes in Fund Balance
Years Ended September 30, 2020 and 2019
Health Programs Fund
Nonmajor Special Revenue Funds
See accompanying independent auditor's report.
127
DRAFT

2020 2019Actual Variance with Actual
Original Final Amounts Final Budget Amounts
Revenues:Health Administrative Services:
Death and birth certificates $ 253,088 253,088 237,184 (15,904) 322,047 Interest on investments 22,669 22,669 26,730 4,061 50,252 Intergovernmental 189,000 189,000 403,814 214,814 203,713 Revenue-other 533,040 533,040 532,333 (707) 442,925
Total 997,797 997,797 1,200,061 202,264 1,018,937
Environmental Health Services:Health and welfare fees 457,410 488,508 605,402 116,894 556,492 Intergovernmental 84,267 84,267 62,206 (22,061) 12,284 Revenue-other 100 100 68 (32) 77
Total 541,777 572,875 667,676 94,801 568,853
Health Nursing Services:Health and welfare fees 136,121 136,121 113,616 (22,505) 166,948 Revenue-other 34,993 34,993 10,812 (24,181) 112,085
Total 171,114 171,114 124,428 (46,686) 279,033
Sexually Transmitted Disease:Health and welfare fees 30,500 30,500 30,538 38 35,759
Total 30,500 30,500 30,538 38 35,759
HIV/AIDS Services:Revenue-other - - 36 36 18
Total - - 36 36 18
Public Health Services:Program income - 151,986 151,986 - 160,262 Intergovernmental - 3,439,569 3,439,569 - 3,270,397 Revenue-other - 62,789 62,789 - 121,232
Total - 3,654,344 3,654,344 - 3,551,891 -
Total revenue 1,741,188 5,426,630 5,677,083 250,453 5,454,491
Expenditures:Health Administrative Services:
Salaries and wages 609,922 554,922 487,381 67,541 523,246 Employee benefits 217,220 217,220 180,059 37,161 190,564 Purchased professional/technical services 73,724 128,724 143,836 (15,112) 111,136 Purchased property services 2,676 2,676 2,938 (262) 2,671 Maintenance 200 200 2,732 (2,532) 42,122 Other purchased services 19,626 19,626 22,671 (3,045) 31,931 Supplies 29,120 41,120 35,944 5,176 43,767 Contracts with others 1,155,930 1,155,930 1,110,499 45,431 1,129,942 Other 671,400 671,400 671,377 23 945,268
Total health administrative services 2,779,818 2,791,818 2,657,437 134,381 3,020,647
City of Waco, Texas
Health Programs FundSchedule of Revenues, Expenditures, and Changes in Fund Balance - Budget and Actual
(Continued)
Budgeted Amounts
Year Ended September 30, 2020(With Comparative Actual Amounts for Year Ended September 30, 2019)
128
DRAFT

2020 2019Actual Variance with Actual
Original Final Amounts Final Budget Amounts
City of Waco, Texas
Health Programs FundSchedule of Revenues, Expenditures, and Changes in Fund Balance - Budget and Actual
Budgeted Amounts
Year Ended September 30, 2020(With Comparative Actual Amounts for Year Ended September 30, 2019)
Environmental Health Services:Salaries and wages $ 375,680 375,680 494,119 (118,439) 465,746 Employee benefits 141,838 141,838 149,026 (7,188) 134,082 Purchased professional/technical services 20,600 20,600 2,812 17,788 22,924 Maintenance 13,694 13,694 15,283 (1,589) 7,947 Other purchased services 26,390 26,390 16,761 9,629 18,257 Supplies 79,968 79,968 65,790 14,178 69,444 Contracts with others - 31,098 31,098 - - Capital expenditures 25,000 25,000 20,967 4,033 -
Total environmental health services: 683,170 714,268 795,856 (81,588) 718,400
Health Nursing Services:Salaries and wages 792,676 772,676 497,993 274,683 611,279 Employee benefits 268,766 268,766 178,531 90,235 206,512 Purchased professional/technical services 17,710 37,710 109,283 (71,573) 5,413 Maintenance 6,920 6,920 3,558 3,362 1,072 Other purchased services 124,757 105,757 99,028 6,729 52,952 Supplies 277,770 287,711 183,298 104,413 202,884
Total public health nursing services 1,488,599 1,479,540 1,071,691 407,849 1,080,112
Sexually Transmitted Disease:Salaries and wages 252,172 252,172 252,875 (703) 236,271 Employee benefits 94,372 94,372 93,584 788 90,065 Purchased professional/technical services 11,160 11,160 12,001 (841) 12,504 Maintenance 1,170 1,170 185 985 659 Other purchased services 26,175 26,175 12,876 13,299 16,904 Supplies 20,960 20,960 22,808 (1,848) 21,197
Total sexually transmitted disease 406,009 406,009 394,329 11,680 377,600
HIV/AIDS Services:Salaries and wages 128,624 128,624 164,459 (35,835) 136,119 Employee benefits 45,154 45,154 55,342 (10,188) 48,568 Purchased professional/technical services 1,000 1,000 4,449 (3,449) - Other purchased services 14,838 14,838 8,073 6,765 8,135 Supplies 8,037 8,037 7,637 400 3,520
Total HIV/AIDS services 197,653 197,653 239,960 (42,307) 196,342
Public Health Services:Salaries and wages - 1,742,235 1,742,235 - 1,721,937 Employee benefits - 708,739 708,739 - 746,799 Purchased professional/technical services - 302,129 302,129 - 239,764 Purchased property services - 78,692 78,692 - 91,785 Maintenance - 44,123 44,123 - 40,755 Other purchased services - 314,202 314,202 - 311,910 Supplies - 265,120 265,120 - 194,932 Other - 199,104 199,104 - 204,009
Total public health services - 3,654,344 3,654,344 - 3,551,891
(Continued)
129
DRAFT

2020 2019Actual Variance with Actual
Original Final Amounts Final Budget Amounts
City of Waco, Texas
Health Programs FundSchedule of Revenues, Expenditures, and Changes in Fund Balance - Budget and Actual
Budgeted Amounts
Year Ended September 30, 2020(With Comparative Actual Amounts for Year Ended September 30, 2019)
Total expenditures $ 5,555,249 9,243,632 8,813,617 430,015 8,944,992
Excess (deficiency) ofrevenue over expenditures (3,814,061) (3,817,002) (3,136,534) 680,468 (3,490,501)
Other financing sources (uses):Transfers in 3,863,148 3,863,148 3,863,148 - 3,837,160 Transfers out - - - (250,000)
Total other financing sources (uses) 3,863,148 3,863,148 3,863,148 - 3,587,160
Net change in fund balance 49,087 46,146 726,614 680,468 96,659
Fund balance, beginning of year 2,514,105 2,514,105 2,514,105 - 2,417,446
Fund balance, end of year $ 2,563,192 2,560,251 3,240,719 680,468 2,514,105
See accompanying independent auditor's report.130
DRAFT

131
Grant Funds
DRAFT

AssetsCash and investments $ - $ - $ - $ 2,043 Accounts receivable, net of allowances - 97,727 - - Due from other funds - - - - Notes receivable 149,194 82,078 - - Intergovernmental receivable 141,325 1,034,307 106,241 - Real estate held for resale - 60,097 - -
Total assets $ 290,519 $ 1,274,209 $ 106,241 $ 2,043
LiabilitiesAccounts payable $ 267,672 $ 243,496 $ 8,816 $ - Accrued liabilities 1,907 28,427 8,456 - Due to other funds 20,426 297,250 88,969 -
Total liabilities 290,005 569,173 106,241 -
Fund balances (deficits)Restricted for:
Culture and recreation - - - - Housing and community development 514 237,698 - - Public works - - - - Public safety - 467,338 - 2,043
Total fund balances (deficits) $ 514 $ 705,036 $ - $ 2,043
Total liabilities and fund balances $ 290,519 $ 1,274,209 $ 106,241 $ 2,043
City of Waco, Texas
September 30, 2020Grant Funds
Sub-Combining Balance Sheet
Fire LEOSEHUD Home
ProgramHUD Lead
Hazard
(With Comparative Totals for September 30, 2019)
See accompanying independent auditor's report.
HUD Community
Development Block Grant
132
DRAFT

$ - $ 12,145 $ 8,753 $ 85,374 $ - $ - - - - - - - - - - - - - - - - - - - 1,394 - - - 18,568 - - - - - - - $ 1,394 $ 12,145 $ 8,753 $ 85,374 $ 18,568 $ -
$ - $ - $ - $ - $ - $ - - - - - 3,343 - 1,394 - - - 15,225 -
1,394 - - - 18,568 -
- - - 85,374 - - - - 8,753 - - - - - - - - - - 12,145 - - - -
$ - $ 12,145 $ 8,753 $ 85,374 $ - $ -
$ 1,394 $ 12,145 $ 8,753 $ 85,374 $ 18,568 $ -
Police LEOSE
HUD Continuum
of Care
Grande Clear Source Cable
OrdinanceHUD EDI
Grant
(Continued)
Justice Assistance
Grant COVID 2
HUD HMIS Grant 17
133
DRAFT

AssetsCash and investments $ - $ - $ - $ - Accounts receivable, net of allowances - - - 597 Due from other funds - - - - Notes receivable - - - - Intergovernmental receivable 573 - 21,273 88,517 Real estate held for resale - - - -
Total assets $ 573 $ - $ 21,273 $ 89,114
LiabilitiesAccounts payable $ - $ - $ - $ 9 Accrued liabilities - - - 16,004 Due to other funds 573 - 21,273 73,101
Total liabilities 573 - 21,273 89,114
Fund balances (deficits)Restricted for:
Culture and recreation - - - - Housing and community development - - - - Public works - - - - Public safety - - - -
Total fund balances (deficits) $ - $ - $ - $ -
Total liabilities and fund balances $ 573 $ - $ 21,273 $ 89,114
STEP Comprehensive
TXDOT MPO FHWASHSP 2019
HUD HMIS GRANT
2018
(With Comparative Totals for September 30, 2019)September 30, 2020
Grant Funds
See accompanying independent auditor's report.
Sub-Combining Balance SheetCity of Waco, Texas
134
DRAFT

$ - $ - $ 4,740 $ - $ - $ - - - - - - - - - - - - - - - - - - - 14,351 12,172 - 25,024 544,109 218,858 - - - - - - $ 14,351 $ 12,172 $ 4,740 $ 25,024 $ 544,109 $ 218,858
$ - $ - $ - $ 12,343 $ 141 $ 218,858 - 11,767 - - - - 14,351 405 - 12,681 543,968 -
14,351 12,172 - 25,024 544,109 218,858
- - - - - - - - - - - - - - - - - - - - 4,740 - - - $ - $ - $ 4,740 $ - $ - $ -
$ 14,351 $ 12,172 $ 4,740 $ 25,024 $ 544,109 $ 218,858
Tx Anti-Gang Grant 2020-2021
CJD Family Violence
2019-2020
Tx Anti-Gang Grant 2019-2020
National Incident Based
Reporting System
CJD Family Violence
2020-2021 Brownfields
(Continued)
135
DRAFT

AssetsCash and investments $ - $ - $ - $ 44,411 Accounts receivable, net of allowances - - - - Due from other funds - - - - Notes receivable - - - - Intergovernmental receivable 27,598 7,837 - - Real estate held for resale - - - -
Total assets $ 27,598 $ 7,837 $ - $ 44,411
LiabilitiesAccounts payable $ - $ - $ - $ - Accrued liabilities - - - - Due to other funds 27,598 7,837 - -
Total liabilities 27,598 7,837 - -
Fund balances (deficits)Restricted for:
Culture and recreation - - - 44,411 Housing and community development - - - - Public works - - - - Public safety - - - -
Total fund balances (deficits) $ - $ - $ - $ 44,411
- Total liabilities and fund balances $ 27,598 $ 7,837 $ - $ 44,411
See accompanying independent auditor's
Justice Assistance Grant 2019
Library Memorial
Fund
Justice Assistance
Grant COVID 1
(With Comparative Totals for September 30, 2019)September 30, 2020
Grant FundsSub-Combining Balance Sheet
City of Waco, Texas
Justice Assistance Grant 2018
136
DRAFT

2020 2019
$ 194 $ 96,582 $ - $ 254,242 $ 602,072 - - - 98,324 67,123 - - 540,000 540,000 596,000 - - - 231,272 338,144 - - - 2,262,147 852,494 - - - 60,097 60,097 $ 194 $ 96,582 $ 540,000 $ 3,446,082 $ 2,515,930
$ - $ - $ - $ 751,335 $ 553,882 - - - 69,904 56,494 - - - 1,125,051 137,521
- - - 1,946,290 747,897
194 - - 129,979 115,520 - - - 246,965 325,423 - 96,582 540,000 636,582 1,142,535 - - - 486,266 184,555 $ 194 $ 96,582 $ 540,000 $ 1,499,792 $ 1,768,033
$ 194 $ 96,582 $ 540,000 $ 3,446,082 $ 2,515,930
TXDOT TASA Gurley
LaneTXDOT
TASA ElmTotals
Shapley P Ross
Memorial Fund
137
DRAFT

Revenues:Intergovernmental $ 587,995 $ 1,538,277 193,727 $ 1,019 Program income 41,574 34,125 - - Other - 217,214 - -
Total revenues 629,569 1,789,616 193,727 1,019
Expenditures:Current:
General government - - - - Public safety - 100,556 - 673 Public works - - - - Culture and recreation - - - - Housing and community development 692,343 1,588,086 193,727 -
Total expenditures 692,343 1,688,642 193,727 673
Excess (deficiency) of revenues over (under) expenditures (62,774) 100,974 - 346
Other financing sources (uses):Transfers in - 175,000 - - Transfers out - - - -
Total other financing sources (uses) - 175,000 - -
Net change in fund balances (62,774) 275,974 - 346 Fund balances, beginning of year 63,288 429,062 - 1,697 Fund balances, end of year $ 514 $ 705,036 $ - $ 2,043
(With Comparative Totals for the Year Ended September 30, 2019)Year Ended September 30, 2020
HUD Lead Hazard
HUD Home Program
Fire LEOSE
HUD Community
Development Block Grant
Grant FundsSub-Combining Statement of Revenues, Expenditures, and Changes in Fund Balances
City of Waco, Texas
See accompanying independent auditor's report.
138
DRAFT

1,394 $ 14,687 $ - $ - $ 42,371 $ 763 - - - - - - - - - - - -
1,394 14,687 - - 42,371 763
- - - - - - 1,394 4,980 - - - -
- - - - - - - - - - - - - - - 42,371 763
1,394 4,980 - - 42,371 763
- 9,707 - - - -
- - - - - - - - - - - -
- - - - - -
- 9,707 - - - - - 2,438 8,753 85,374 - - $ - $ 12,145 $ 8,753 $ 85,374 $ - $ -
HUD Continuum of
Care
Grande Clear Source Cable
OrdinanceHUD EDI
GrantPolice
LEOSE
Justice Assistance Grant
COVID 2HUD HMIS
Grant 17
(Continued)
139
DRAFT

Revenues:Intergovernmental $ 16,320 $ 64,490 $ 107,731 $ 442,685 Program income - - - - Other 10,640 - - -
Total revenues 26,960 64,490 107,731 442,685
Expenditures:Current:
General government - - - 442,685 Public safety - 64,490 135,971 - Public works - - - - Culture and recreation - - - - Housing and community development 26,960 - - -
Total expenditures 26,960 64,490 135,971 442,685
Excess (deficiency) of revenues over (under) expenditures - - (28,240) -
Other financing sources (uses):Transfers in - - 28,240 - Transfers out - - - -
Total other financing sources (uses) - - 28,240 -
Net change in fund balances - - - - Fund balances, beginning of year - - - - Fund balances, end of year $ - $ - $ - $ -
SHSP 2019
TXDOT MPO
FHWASTEP
ComprehensiveHUD HMIS
Grant 18
(With Comparative Totals for the Year Ended September 30, 2019)Year Ended September 30, 2020
Grant FundsSub-Combining Statement of Revenues, Expenditures, and Changes in Fund Balances
City of Waco, Texas
See accompanying independent auditor's report.
140
DRAFT
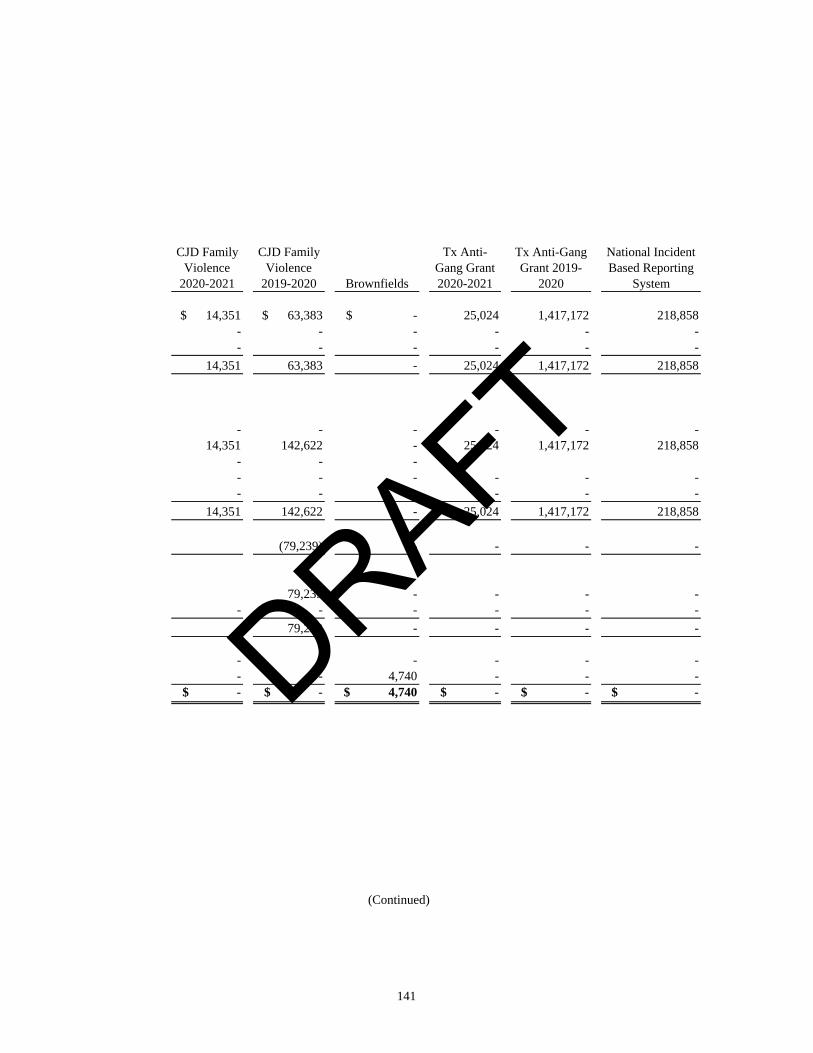
$ 14,351 $ 63,383 $ - 25,024 1,417,172 218,858 - - - - - - - - - - - -
14,351 63,383 - 25,024 1,417,172 218,858
- - - - - - 14,351 142,622 - 25,024 1,417,172 218,858 - - - - - - - - - - - - - - -
14,351 142,622 - 25,024 1,417,172 218,858
(79,239) - - - -
79,239 - - - - - - - - - -
79,239 - - - -
- - - - - - - - 4,740 - - - $ - $ - $ 4,740 $ - $ - $ -
CJD Family Violence
2020-2021
Tx Anti-Gang Grant 2019-
2020
National Incident Based Reporting
System
CJD Family Violence
2019-2020 Brownfields
Tx Anti-Gang Grant 2020-2021
(Continued)
141
DRAFT
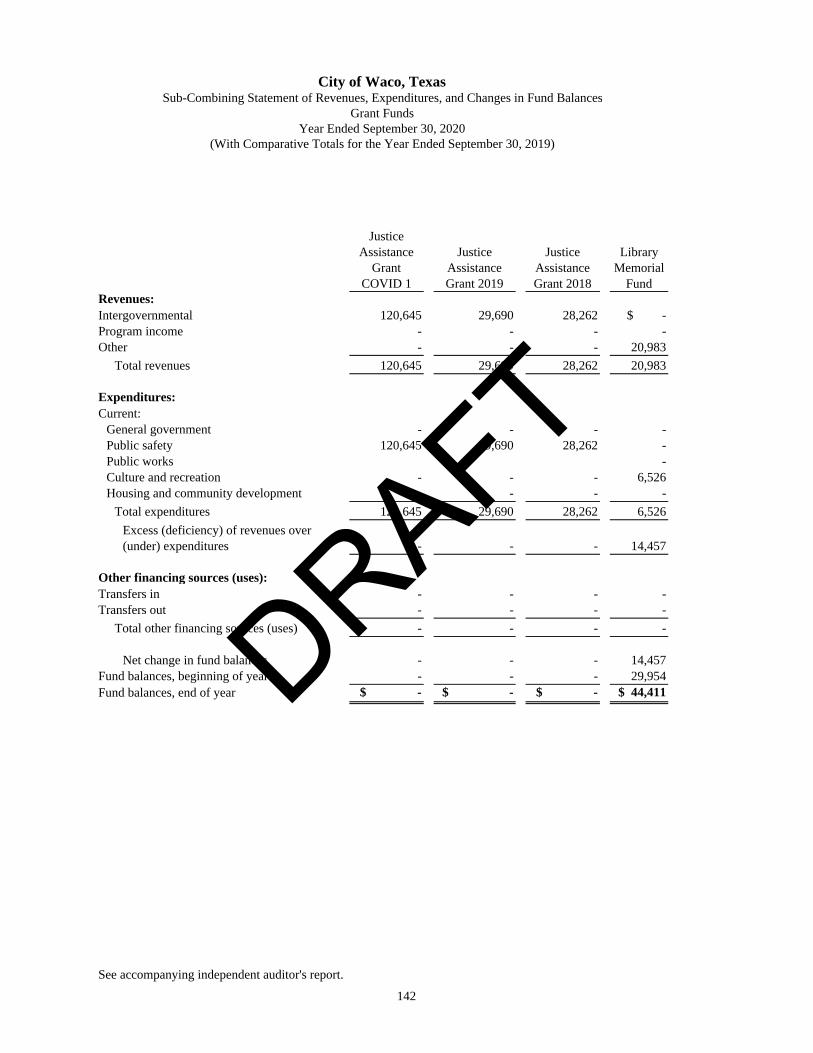
Revenues:Intergovernmental 120,645 29,690 28,262 $ - Program income - - - - Other - - - 20,983
Total revenues 120,645 29,690 28,262 20,983
Expenditures:Current:
General government - - - - Public safety 120,645 29,690 28,262 - Public works - Culture and recreation - - - 6,526 Housing and community development - - - -
Total expenditures 120,645 29,690 28,262 6,526
Excess (deficiency) of revenues over (under) expenditures - - - 14,457
Other financing sources (uses):Transfers in - - - - Transfers out - - - -
Total other financing sources (uses) - - - -
Net change in fund balances - - - 14,457 Fund balances, beginning of year - - - 29,954 Fund balances, end of year $ - $ - $ - $ 44,411
Library Memorial
Fund
Justice Assistance Grant 2018
Justice Assistance
Grant COVID 1
Justice Assistance Grant 2019
Sub-Combining Statement of Revenues, Expenditures, and Changes in Fund BalancesCity of Waco, Texas
See accompanying independent auditor's report.
(With Comparative Totals for the Year Ended September 30, 2019)Year Ended September 30, 2020
Grant Funds
142
DRAFT
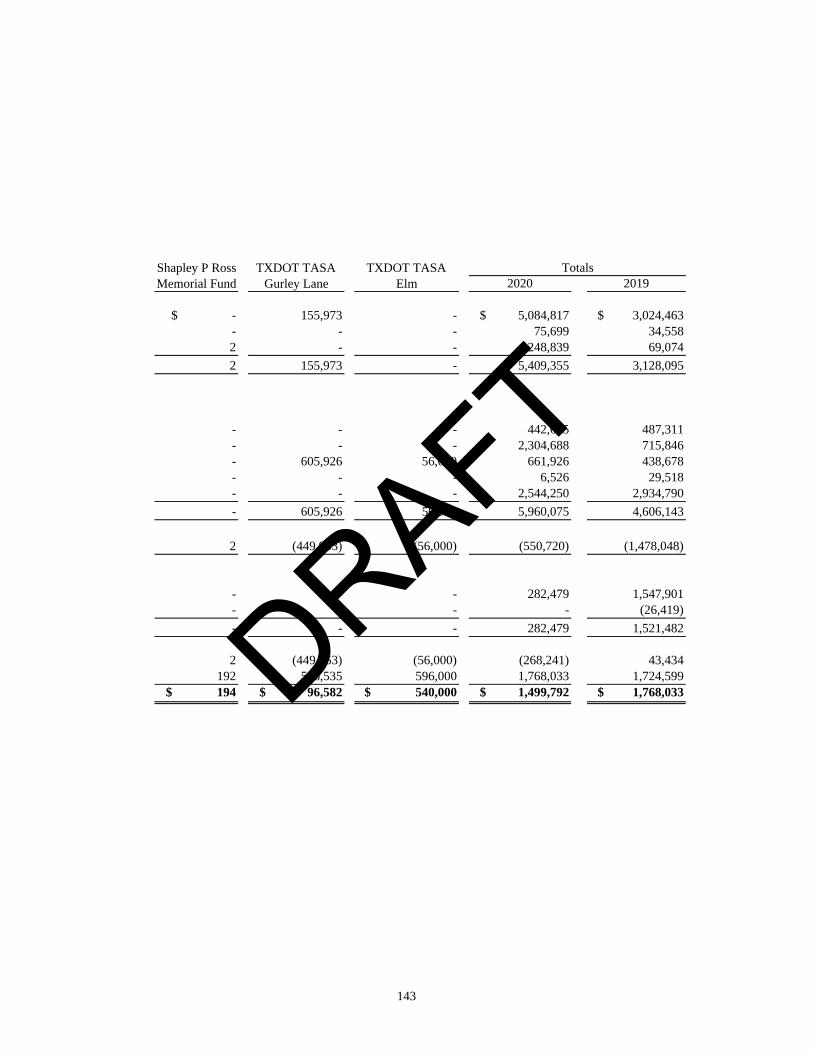
2020 2019
$ - 155,973 - $ 5,084,817 $ 3,024,463 - - - 75,699 34,558 2 - - 248,839 69,074
2 155,973 - 5,409,355 3,128,095
- - - 442,685 487,311 - - - 2,304,688 715,846 - 605,926 56,000 661,926 438,678 - - - 6,526 29,518 - - - 2,544,250 2,934,790
- 605,926 56,000 5,960,075 4,606,143
2 (449,953) (56,000) (550,720) (1,478,048)
- - - 282,479 1,547,901 - - - - (26,419)
- - - 282,479 1,521,482
2 (449,953) (56,000) (268,241) 43,434 192 546,535 596,000 1,768,033 1,724,599 $ 194 $ 96,582 $ 540,000 $ 1,499,792 $ 1,768,033
TXDOT TASA Gurley Lane
TXDOT TASA Elm
TotalsShapley P Ross Memorial Fund
143
DRAFT

144
DRAFT

145
Waco Public Improvement District No. 1 Fund
DRAFT

2020 2019AssetsCash and investments $ 1,224,420 $ 1,052,969 Accounts receivable, net of allowance 10,479 11,414 Special assessments receivable 9,128 5,460
Total assets $ 1,244,027 $ 1,069,843
LiabilitiesAccounts payable $ 86,213 $ 58,142
Total liabilities 86,213 58,142
Deferred inflows of resourcesUnavailable revenue-special assessments 9,128 5,460
Total deferred inflows of resources 9,128 5,460
Total liabilities and deferred inflows of resources 95,341 63,602
Fund balance (deficit)Restricted for:
Waco Public Improvement District 1,148,686 1,006,241
Total fund balance (deficit) $ 1,148,686 $ 1,006,241
Total liabilities, deferred inflows of resources, and fund balance $ 1,244,027 $ 1,069,843
See accompanying independent auditor's report.
City of Waco, TexasComparative Balance Sheets
September 30, 2020 and 2019
Waco Public Improvement District No. 1 Fund
Nonmajor Special Revenue Funds
146
DRAFT

2020 2019Revenues:Special assessments $ 630,654 $ 560,432 Investment earnings 12,348 26,032 Other 68,243 93,768
Total revenues 711,245 680,232
Expenditures:Current:
General government 568,800 580,368 Total expenditures 568,800 580,368
Excess (deficiency) of revenues over expenditures 142,445 99,864
Net change in fund balance 142,445 99,864 Fund balance, beginning of year 1,006,241 906,377
Fund balance, end of year $ 1,148,686 $ 1,006,241
See accompanying independent auditor's report.
City of Waco, TexasComparative Statements of Revenues, Expenditures, and Changes in Fund Balance
Years Ended September 30, 2020 and 2019
Waco Public Improvement District No. 1 Fund
Nonmajor Special Revenue Funds
147
DRAFT

148
DRAFT

149
Abandoned Motor Vehicle Fund
DRAFT

2020 2019AssetsCash and investments $ 644,803 $ 763,734
Total assets $ 644,803 $ 763,734
LiabilitiesAccounts payable $ 14,750 $ 1,892
Total liabilities 14,750 1,892
Fund balance (deficit)Restricted for:
Public safety 630,053 761,842 Total fund balance (deficit) $ 630,053 $ 761,842
Total liabilities and fund balance $ 644,803 $ 763,734
See accompanying independent auditor's report.
City of Waco, TexasComparative Balance Sheets
September 30, 2020 and 2019
Abandoned Motor Vehicle Fund
Nonmajor Special Revenue Funds
150
DRAFT
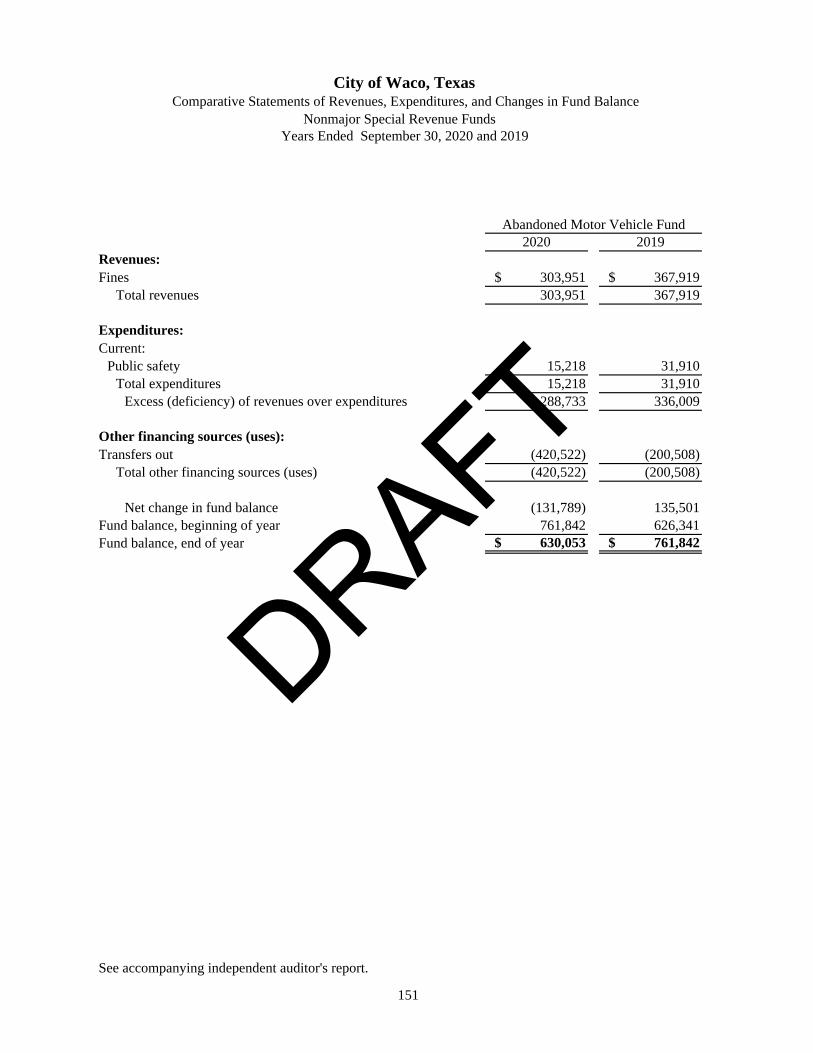
2020 2019Revenues:Fines $ 303,951 $ 367,919
Total revenues 303,951 367,919
Expenditures:Current:
Public safety 15,218 31,910 Total expenditures 15,218 31,910
Excess (deficiency) of revenues over expenditures 288,733 336,009
Other financing sources (uses):Transfers out (420,522) (200,508)
Total other financing sources (uses) (420,522) (200,508)
Net change in fund balance (131,789) 135,501 Fund balance, beginning of year 761,842 626,341 Fund balance, end of year $ 630,053 $ 761,842
City of Waco, TexasComparative Statements of Revenues, Expenditures, and Changes in Fund Balance
Years Ended September 30, 2020 and 2019
Abandoned Motor Vehicle Fund
Nonmajor Special Revenue Funds
See accompanying independent auditor's report.
151
DRAFT

152
DRAFT

153
Police Forfeitures Fund
DRAFT

2020 2019AssetsCash and investments $ 302,189 $ 332,406 Accounts receivable, net of allowance - -
Total assets $ 302,189 $ 332,406
LiabilitiesAccounts payable $ 2,432 $ 6,883
Total liabilities 2,432 6,883
Fund balance (deficit)NonspendableRestricted for:
Public safety 299,757 325,523 Total fund balance (deficit) $ 299,757 $ 325,523
Total liabilities and fund balance $ 302,189 $ 332,406
See accompanying independent auditor's report.
City of Waco, TexasComparative Balance Sheets
September 30, 2020 and 2019
Police Forfeitures Fund
Nonmajor Special Revenue Funds
154
DRAFT

2020 2019Revenues:Investment earnings $ 3,388 $ 7,577 Other 37,384 38,259
Total revenues 40,772 45,836
Expenditures:Current:
Public safety 66,538 22,170 Total expenditures 66,538 22,170
Excess (deficiency) of revenues over expenditures (25,766) 23,666
Net change in fund balance (25,766) 23,666 Fund balance, beginning of year 325,523 301,857 Fund balance, end of year $ 299,757 $ 325,523
See accompanying independent auditor's report.
City of Waco, TexasComparative Statements of Revenues, Expenditures, and Changes in Fund Balance
Years Ended September 30, 2020 and 2019
Police Forfeitures Fund
Nonmajor Special Revenue Funds
155
DRAFT

156
DRAFT

157
Court Security Fund
DRAFT

2020 2019AssetsCash and investments $ 132,702 $ 197,623
Total assets $ 132,702 $ 197,623
Fund balance (deficit)Restricted for:
Public safety $ 132,702 $ 197,623
Total fund balance (deficit) $ 132,702 $ 197,623
See accompanying independent auditor's report.
City of Waco, TexasComparative Balance Sheets
September 30, 2020 and 2019
Court Security Fund
Nonmajor Special Revenue Funds
158
DRAFT

2020 2019Revenues:Fines $ 31,911 $ 34,432
Total revenues 31,911 34,432
Expenditures:Current:
Public safety 9,629 60,008 Total expenditures 9,629 60,008
Excess (deficiency) of revenues over expenditures 22,282 (25,576)
Other financing sources (uses):Transfers out (87,203) (83,781)
Total other financing sources (uses) (87,203) (83,781)
Net change in fund balance (64,921) (109,357)Fund balance, beginning of year 197,623 306,980 Fund balance, end of year $ 132,702 $ 197,623
See accompanying independent auditor's report.
City of Waco, TexasComparative Statements of Revenues, Expenditures, and Changes in Fund Balance
Years Ended September 30, 2020 and 2019
Court Security Fund
Nonmajor Special Revenue Funds
159
DRAFT

160
DRAFT

161
Court Technology Fund
DRAFT
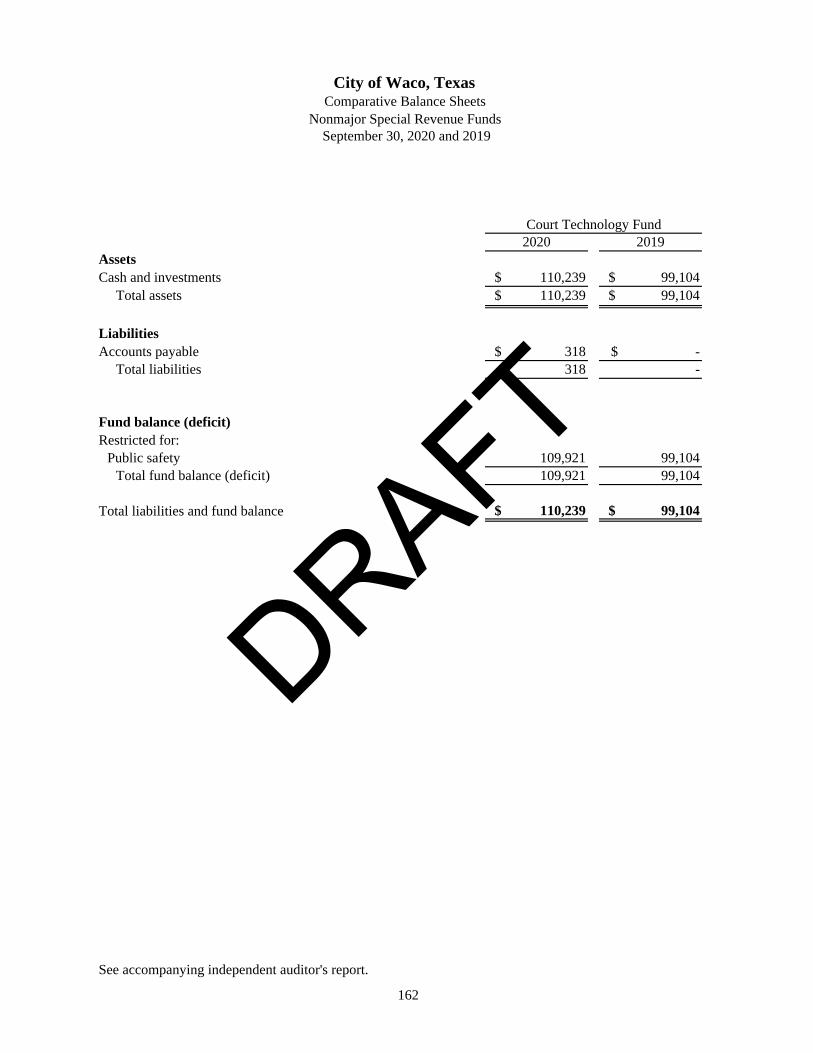
2020 2019AssetsCash and investments $ 110,239 $ 99,104
Total assets $ 110,239 $ 99,104
LiabilitiesAccounts payable $ 318 $ -
Total liabilities 318 -
Fund balance (deficit)Restricted for:
Public safety 109,921 99,104 Total fund balance (deficit) 109,921 99,104
Total liabilities and fund balance $ 110,239 $ 99,104
See accompanying independent auditor's report.
City of Waco, TexasComparative Balance Sheets
September 30, 2020 and 2019
Court Technology Fund
Nonmajor Special Revenue Funds
162
DRAFT

2020 2019Revenues:Fines $ 32,384 $ 45,903
Total revenues 32,384 45,903
Expenditures:Current:
Public safety 21,567 14,835 Total expenditures 21,567 14,835
Excess (deficiency) of revenues over expenditures 10,817 31,068
Net change in fund balance 10,817 31,068 Fund balance, beginning of year 99,104 68,036 Fund balance, end of year $ 109,921 $ 99,104
See accompanying independent auditor's report.
City of Waco, TexasComparative Statements of Revenues, Expenditures, and Changes in Fund Balance
Years Ended September 30, 2020 and 2019
Court Technology Fund
Nonmajor Special Revenue Funds
163
DRAFT

164
DRAFT

165
Hamilton Memorial Fund
DRAFT

2020 2019AssetsCash and investments $ 10,076 $ 9,868
Total assets $ 10,076 $ 9,868
Fund balance (deficit)Restricted for:
Culture and recreation $ 10,076 $ 9,868 Total fund balance (deficit) $ 10,076 $ 9,868
See accompanying independent auditor's report.
City of Waco, TexasComparative Balance Sheets
September 30, 2020 and 2019
Hamilton Memorial Fund
Nonmajor Special Revenue Funds
166
DRAFT
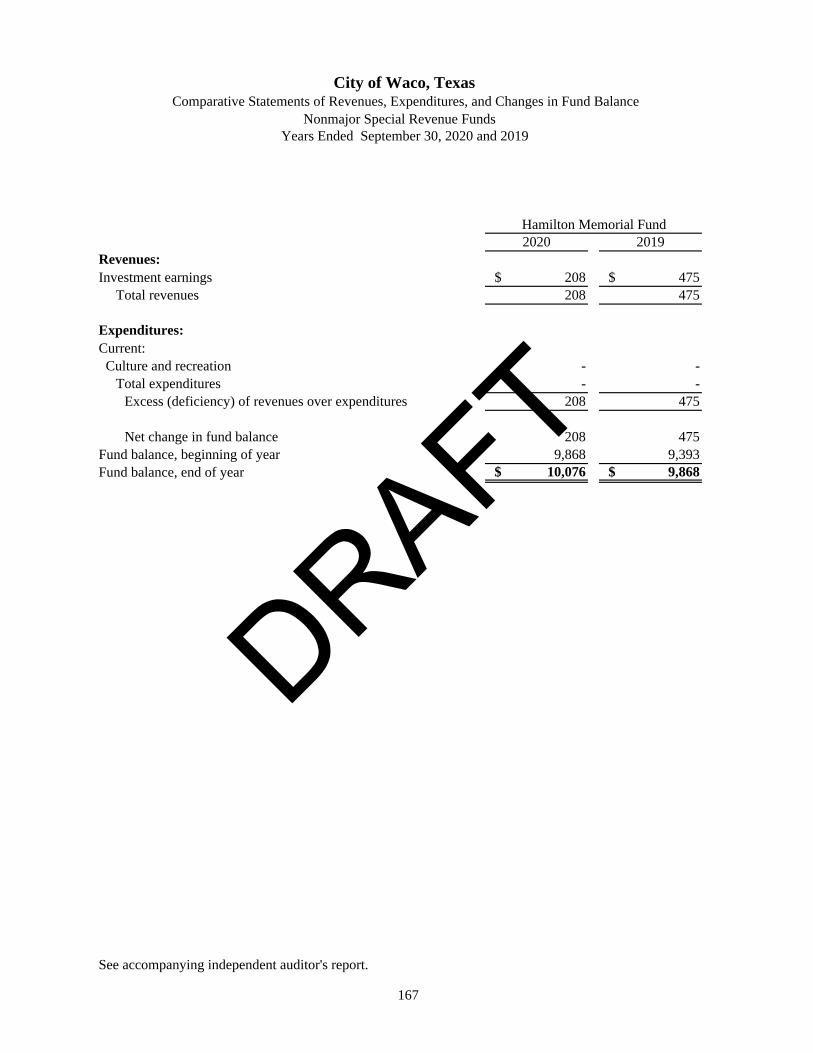
2020 2019Revenues:Investment earnings $ 208 $ 475
Total revenues 208 475
Expenditures:Current: Culture and recreation - -
Total expenditures - - Excess (deficiency) of revenues over expenditures 208 475
Net change in fund balance 208 475 Fund balance, beginning of year 9,868 9,393 Fund balance, end of year $ 10,076 $ 9,868
See accompanying independent auditor's report.
City of Waco, TexasComparative Statements of Revenues, Expenditures, and Changes in Fund Balance
Years Ended September 30, 2020 and 2019
Hamilton Memorial Fund
Nonmajor Special Revenue Funds
167
DRAFT

168
DRAFT

169
Miss Nellie’s Park Maintenance Fund
DRAFT

2020 2019AssetsCash and investments $ 29,319 $ 28,503
Total assets $ 29,319 $ 28,503
Fund balance (deficit)Restricted for:
Culture and recreation $ 29,319 $ 28,503 Total fund balance (deficit) $ 29,319 $ 28,503
See accompanying independent auditor's report.
City of Waco, TexasComparative Balance Sheets
September 30, 2020 and 2019
Miss Nellie's Park Maintenance Fund
Nonmajor Special Revenue Funds
170
DRAFT

2020 2019Revenues:Investment earnings $ 1,344 $ 3,072
Total revenues 1,344 3,072
Expenditures:Current:
Culture and recreation 528 - Total expenditures 528 -
Excess (deficiency) of revenues over expenditures 816 3,072
Net change in fund balance 816 3,072 Fund balance, beginning of year 28,503 25,431 Fund balance, end of year $ 29,319 $ 28,503
See accompanying independent auditor's report.
City of Waco, TexasComparative Statements of Revenues, Expenditures, and Changes in Fund Balance
Years Ended September 30, 2020 and 2019
Miss Nellie's Park Maintenance Fund
Nonmajor Special Revenue Funds
171
DRAFT

172
DRAFT

173
Nonmajor Debt Service Funds
Debt Service Funds are used to account for the accumulation of resources and payment of debt for governmental funds.
Street and Drainage Refundable Contracts Fund – This fund is used to account for the accumulation of resources and payment of street and drainage refundable contracts. General Obligation Debt Fund – This fund is used to account for the accumulation of resources and payment of general obligation principal and interest from governmental resources.
DRAFT

2020 2019AssetsCash and investments $ 4,204 $ 532,132 $ 536,336 $ 720,851 Taxes - 423,041 423,041 375,793
Total assets $ 4,204 $ 955,173 $ 959,377 $ 1,096,644
Deferred inflows of resourcesUnavailable revenue-property taxes $ - $ 358,905 $ 358,905 $ 354,015
Total deferred inflows of resources - 358,905 358,905 354,015
Fund balances (deficits)Restricted for:
Debt service 4,204 596,268 $ 600,472 742,629 Total fund balances (deficits) $ 4,204 $ 596,268 $ 600,472 $ 742,629
Total deferred inflows of resources and fund balances $ 4,204 $ 955,173 $ 959,377 $ 1,096,644
September 30, 2020(with Comparative Totals for September 30, 2019)
See accompanying independent auditor's report.
City of Waco, TexasCombining Balance Sheets
General Obligation Debt
Fund
Street and Drainage Refundable
Contracts FundTotals
Nonmajor Debt Service Funds
174
DRAFT

2020 2019Revenues:Taxes $ - $ 11,109,750 $ 11,109,750 $ 9,810,697 Investment earnings - 17,904 17,904 36,443
Total revenues - 11,127,654 11,127,654 9,847,140
Expenditures:Current:Debt service:
Principal - 7,590,000 7,590,000 6,555,000 Interest and fiscal charges - 4,553,085 4,553,085 4,016,921 Bond issuance costs - 123,993 123,993 203,758
Total expenditures - 12,267,078 12,267,078 10,775,679 Excess (deficiency) of revenues over expenditures - (1,139,424) (1,139,424) (928,539)
Other financing sources (uses):Refunding bonds issued - - - 9,365,000 Payment to refunded bond escrow agent - - - (10,434,176)Premium on refunding bonds - - - 1,065,159 General obligation bonds issued - 120,234 120,234 129,618 Premium on general obligation bonds - 11,707 11,707 11,058 Transfers in - 865,326 865,326 858,984
Total other financing sources (uses) - 997,267 997,267 995,643
Net change in fund balances - (142,157) (142,157) 67,104 Fund balances, beginning of year 4,204 738,425 742,629 675,525 Fund balances, end of year $ 4,204 $ 596,268 $ 600,472 $ 742,629
See accompanying independent auditor's report.
City of Waco, TexasCombining Statements of Revenues, Expenditures, and Changes in Fund Balances
(with Comparative Totals for September 30, 2019)
General Obligation Debt
Fund
Street and Drainage Refundable
Contracts FundTotals
Nonmajor Debt Service FundsYear Ended September 30, 2020
175
DRAFT

2020 2019Actual Variance with Actual
Original Final Amounts Final Budget Amounts
Revenues: Property taxes $ 11,215,356 11,215,356 11,109,750 (105,606) 9,810,697 Investment earnings 35,955 35,955 17,904 (18,051) 36,443 Total revenues 11,251,311 11,251,311 11,127,654 (123,657) 9,847,140
Expenditures: Debt service: Principal 7,590,000 7,590,000 7,590,000 - 6,555,000 Interest and fiscal charges 4,554,420 4,554,420 4,553,085 1,335 4,016,921 Bond issuance costs - 131,941 123,993 7,948 203,758 Total expenditures 12,144,420 12,276,361 12,267,078 9,283 10,775,679
Excess (deficiency) of revenues under expenditures (893,109) (1,025,050) (1,139,424) (114,374) (928,539)
Other financing sources (uses): Refunding bonds issued - - - - 9,365,000 Payment to refunded bond escrow agent - - - - (10,434,176) Premium on refunding bonds - - - - 1,065,159 General obligation bonds issued - 131,941 120,234 (11,707) 129,618 Premium on general obligation bonds - - 11,707 11,707 11,058 Transfers in 865,200 865,200 865,326 126 858,984 Total other financing sources (uses) 865,200 997,141 997,267 126 995,643
Net change in fund balance (27,909) (27,909) (142,157) (114,248) 67,104
Fund balance, beginning of year 738,425 738,425 738,425 - 671,321
Fund balance, end of year $ 710,516 710,516 596,268 (114,248) 738,425
See accompanying independent auditors' report.
General Obligation Debt Fund
City of Waco, Texas
Budgeted Amounts
(With Comparative Totals for the Year Ended September 30, 2019)For the Year Ended September 30, 2020
Schedule of Revenues, Expenditures and Changes in Fund Balance - Budget and Actual
176
DRAFT

177
Nonmajor Capital Projects Funds
Capital Projects Funds - are used to account for the acquisition and construction of major capital facilities other than those financed by proprietary funds and trust funds.
Capital Improvement Fund - This fund is used to account for the acquisition/renovation of buildings, rolling stock, computer equipment, and other City purposes. Equipment Replacement Fund - This fund is used to account for funding for future equipment replacement. Street Improvement Fund - This fund is used to account for the maintenance and reconstruction of City streets. 2020 Bond Issue Fund - This fund is used to account for the acquisition of materials and equipment for City buildings and other City purposes. 2019 Bond Issue Fund - This fund is used to account for the acquisition of materials and equipment for City buildings and other City purposes. 2018 Bond Issue Fund - This fund is used to account for the acquisition of materials and equipment for City buildings and other City purposes. 2017 Bond Issue Fund - This fund is used to account for the acquisition of materials and equipment for City buildings and other City purposes. 2016 Bond Issue Fund - This fund is used to account for the acquisition of materials and equipment for City buildings and other City purposes. 2015 Bond Issue Fund - This fund is used to account for the acquisition of materials and equipment for City buildings and other City purposes.
DRAFT
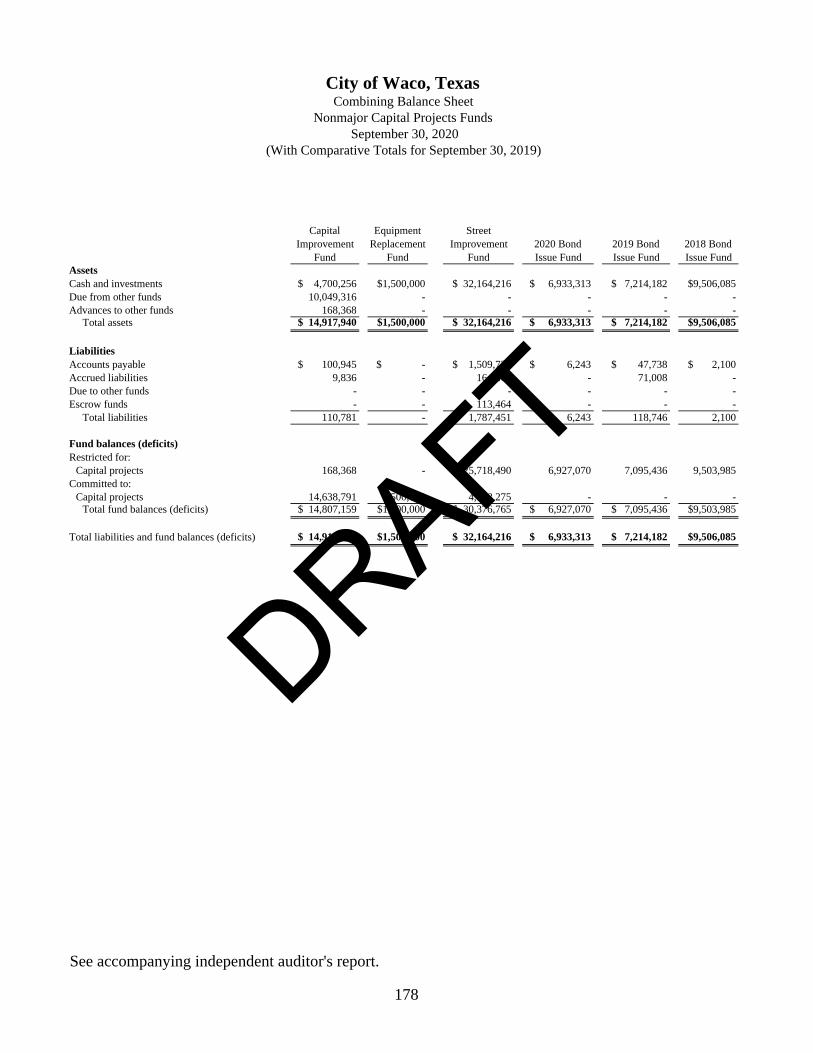
AssetsCash and investments $ 4,700,256 $1,500,000 $ 32,164,216 $ 6,933,313 $ 7,214,182 $9,506,085 Due from other funds 10,049,316 - - - - - Advances to other funds 168,368 - - - - -
Total assets $ 14,917,940 $1,500,000 $ 32,164,216 $ 6,933,313 $ 7,214,182 $9,506,085
LiabilitiesAccounts payable $ 100,945 $ - $ 1,509,727 $ 6,243 $ 47,738 $ 2,100 Accrued liabilities 9,836 - 164,260 - 71,008 - Due to other funds - - - - - - Escrow funds - - 113,464 - - -
Total liabilities 110,781 - 1,787,451 6,243 118,746 2,100
Fund balances (deficits)Restricted for:
Capital projects 168,368 - 25,718,490 6,927,070 7,095,436 9,503,985 Committed to:
Capital projects 14,638,791 1,500,000 4,658,275 - - - Total fund balances (deficits) $ 14,807,159 $1,500,000 $ 30,376,765 $ 6,927,070 $ 7,095,436 $9,503,985
Total liabilities and fund balances (deficits) $ 14,917,940 $1,500,000 $ 32,164,216 $ 6,933,313 $ 7,214,182 $9,506,085
September 30, 2020Nonmajor Capital Projects Funds
Combining Balance SheetCity of Waco, Texas
Capital Improvement
Fund
Equipment Replacement
Fund
Street Improvement
Fund
(With Comparative Totals for September 30, 2019)
2019 Bond Issue Fund
2018 Bond Issue Fund
See accompanying independent auditor's report.
2020 Bond Issue Fund
178
DRAFT

2020 2019
$2,031,481 $1,535,660 $ - $ 65,585,193 $ 54,963,077 - - - 10,049,316 448,045 - - - 168,368 168,368 $2,031,481 $1,535,660 $ - $ 75,802,877 $ 55,579,490
$ 1,050 $ - $ - $ 1,667,803 $ 4,976,798 - - - 245,104 1,017,979 714,316 1,430,000 - 2,144,316 448,045 - - - 113,464 1,031,984 715,366 1,430,000 - 4,170,687 7,474,806
1,316,115 105,660 - 50,835,124 35,639,375
- - - 20,797,066 12,465,309 $1,316,115 $ 105,660 $ - $ 71,632,190 $ 48,104,684
$2,031,481 $1,535,660 $ - $ 75,802,877 $ 55,579,490
2017 Bond Issue Fund
2016 Bond Issue Fund
Totals2015 Bond Issue Fund
179
DRAFT
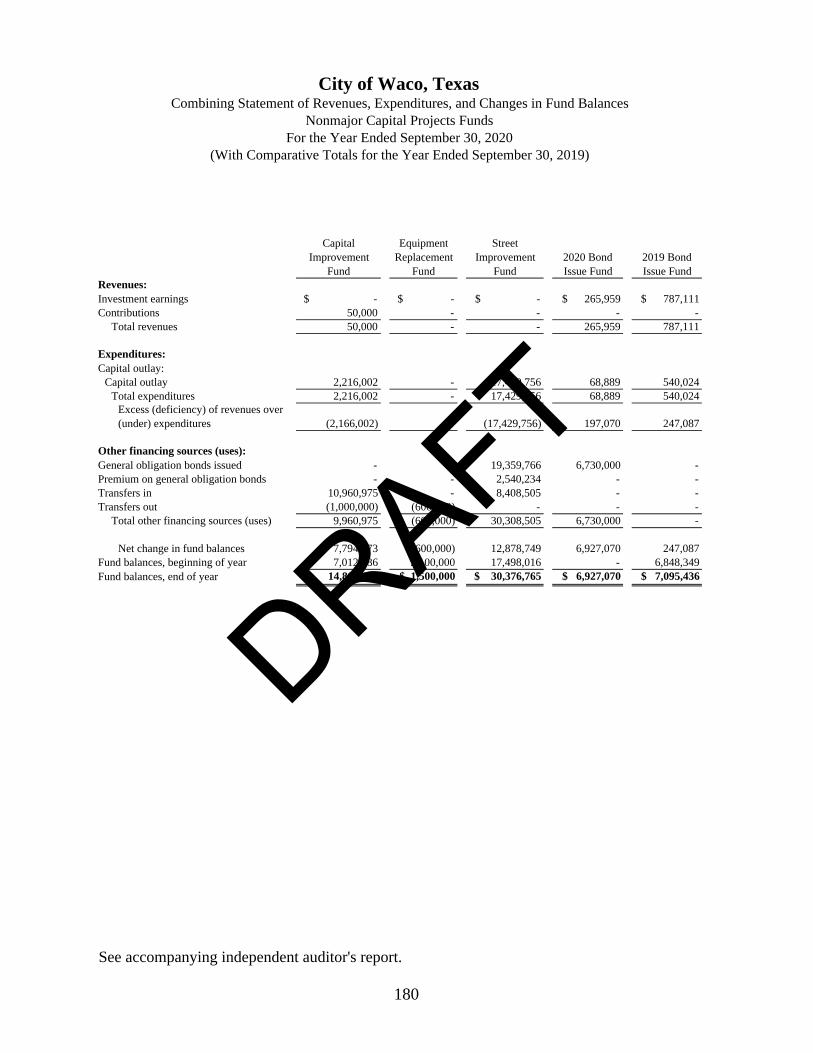
Revenues:Investment earnings $ - $ - $ - $ 265,959 $ 787,111 Contributions 50,000 - - - -
Total revenues 50,000 - - 265,959 787,111
Expenditures:Capital outlay:
Capital outlay 2,216,002 - 17,429,756 68,889 540,024 Total expenditures 2,216,002 - 17,429,756 68,889 540,024
Excess (deficiency) of revenues over (under) expenditures (2,166,002) - (17,429,756) 197,070 247,087
Other financing sources (uses):General obligation bonds issued - - 19,359,766 6,730,000 - Premium on general obligation bonds - - 2,540,234 - - Transfers in 10,960,975 - 8,408,505 - - Transfers out (1,000,000) (600,000) - - -
Total other financing sources (uses) 9,960,975 (600,000) 30,308,505 6,730,000 -
Net change in fund balances 7,794,973 (600,000) 12,878,749 6,927,070 247,087 Fund balances, beginning of year 7,012,186 2,100,000 17,498,016 - 6,848,349 Fund balances, end of year $ 14,807,159 $ 1,500,000 $ 30,376,765 $ 6,927,070 $ 7,095,436
Capital Improvement
Fund
Equipment Replacement
Fund
Street Improvement
Fund
For the Year Ended September 30, 2020Nonmajor Capital Projects Funds
Combining Statement of Revenues, Expenditures, and Changes in Fund BalancesCity of Waco, Texas
See accompanying independent auditor's report.
2020 Bond Issue Fund
2019 Bond Issue Fund
(With Comparative Totals for the Year Ended September 30, 2019)
180
DRAFT

2020 2019
$ 667,048 $ 178,071 $ 227,531 $ 3,554 $ 2,129,274 4,154,918 - - - - 50,000 394,921 667,048 178,071 227,531 3,554 2,179,274 4,549,839
480,917 1,076,335 9,325 - 21,821,248 25,302,918 480,917 1,076,335 9,325 - 21,821,248 25,302,918
186,131 (898,264) 218,206 3,554 (19,641,974) (20,753,079)
- - - - 26,089,766 18,430,382 - - - - 2,540,234 1,572,381 - - - - 19,369,480 7,515,406 - (1,171,000) (2,048,640) (10,360) (4,830,000) (2,371,650) - (1,171,000) (2,048,640) (10,360) 43,169,480 25,146,519
186,131 (2,069,264) (1,830,434) (6,806) 23,527,506 4,393,440 9,317,854 3,385,379 1,936,094 6,806 48,104,684 43,711,244 $ 9,503,985 $ 1,316,115 $ 105,660 $ - $ 71,632,190 $ 48,104,684
Totals2017 Bond Issue Fund
2015 Bond Issue Fund
2016 Bond Issue Fund
2018 Bond Issue Fund
181
DRAFT

182
DRAFT

183
Nonmajor Permanent Funds
Permanent Funds are used to report resources that are legally restricted to the extent that only earnings, not principal, may be used for purposes that support the City's programs.
Rosemound Cemetery Perpetual Fund - This fund is used to account for funds previously provided by the sale of cemetery lots. Hamilton Memorial Fund - This fund is used to account for funds provided by a private donor. Income from this fund is to be used for improvements to Cameron Park. Miss Nellie's Park Endowment Fund - This fund is used to account for funds provided by a private donor. Income from this fund is to be used to maintain Miss Nellie's Pretty Place.
DRAFT

2020 2019AssetsCash and investments $ 271,019 $ 10,000 $ 100,000 $ 381,019 $ 378,209
Total assets $ 271,019 $ 10,000 $ 100,000 $ 381,019 $ 378,209
Fund balances (deficits)Nonspendable:
Parks and cemetery care $ 271,019 $ 10,000 $ 100,000 $ 381,019 $ 378,209 Total fund balances (deficits) $ 271,019 $ 10,000 $ 100,000 $ 381,019 $ 378,209
See accompanying independent auditor's report.
Totals
City of Waco, TexasCombining Balance Sheet
Nonmajor Permanent Funds September 30, 2020
(With Comparative Totals for September 30, 2019)
Miss Nellie's Park
Endowment Fund
Hamilton Memorial
Fund
Rosemound Cemetery Perpetual
Fund
184
DRAFT
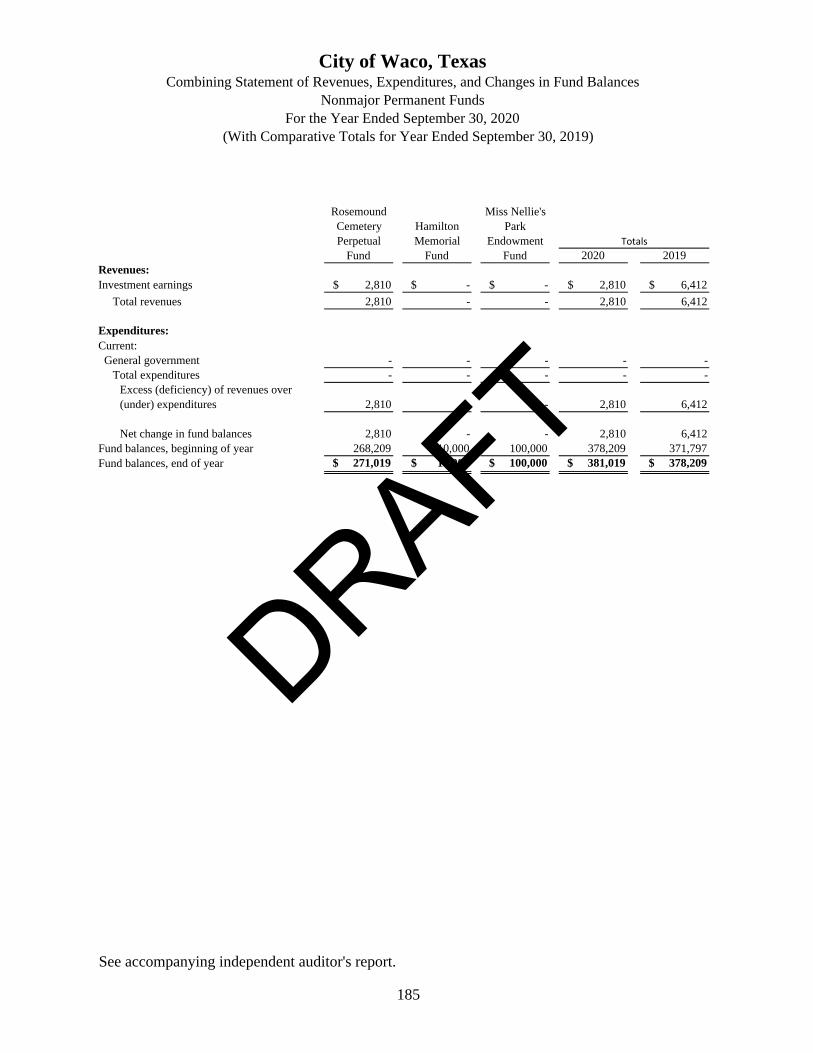
2020 2019Revenues:Investment earnings $ 2,810 $ - $ - $ 2,810 $ 6,412
Total revenues 2,810 - - 2,810 6,412
Expenditures:Current: General government - - - - -
Total expenditures - - - - - Excess (deficiency) of revenues over (under) expenditures 2,810 - - 2,810 6,412
Net change in fund balances 2,810 - - 2,810 6,412 Fund balances, beginning of year 268,209 10,000 100,000 378,209 371,797 Fund balances, end of year $ 271,019 $ 10,000 $ 100,000 $ 381,019 $ 378,209
See accompanying independent auditor's report.
Miss Nellie's Park
Endowment Fund
Hamilton Memorial
Fund
Rosemound Cemetery Perpetual
FundTotals
(With Comparative Totals for Year Ended September 30, 2019)For the Year Ended September 30, 2020
Nonmajor Permanent FundsCombining Statement of Revenues, Expenditures, and Changes in Fund Balances
City of Waco, Texas
185
DRAFT

186
DRAFT

187
Major Enterprise Funds
Enterprise Funds are used to account for those operations that are financed and operated in a manner similar to private business or where the City has decided that the determination of revenue earned, costs incurred and/or net income is necessary for management accountability.
Water Fund - This fund is used to account for the activities necessary for the provision of water services. Wastewater Fund - This fund is used to account for the activities necessary for the provision of sewer services. Solid Waste Fund - This fund is used to account for the activities necessary for the provision of sanitation services.
DRAFT

188
DRAFT

189
Water Fund
DRAFT

2020 2019AssetsCurrent assets:
Cash and investments $ 42,949,857 $ 37,603,199 Accounts receivable, net of allowance 6,519,460 7,320,151 Prepaid items 331,329 274,315 Intergovernmental receivable 491,962 233,385 Restricted cash and investments 6,632,529 5,671,724 Inventory 257,910 216,923
Total current assets 57,183,047 51,319,697 Noncurrent assets:
Restricted cash and investments 50,533,448 47,088,721 Advances to other funds 525,336 525,336 Capital assets:
Land 3,180,914 3,180,914 Buildings 10,073,953 10,024,595 Improvements other than buildings 345,850,339 333,430,604 Equipment 10,229,129 10,133,930 Construction work in progress 29,459,353 22,429,883 Intangible water rights 32,482,879 32,482,879 Less: accumulated depreciation and amortization (164,982,915) (156,014,655)
Total noncurrent assets 317,352,436 303,282,207 Total assets 374,535,483 354,601,904
Deferred outflows of resourcesDeferred losses on refundings of debt 1,948,620 2,226,663 Deferred outflows on pension liability 862,808 2,120,474
Total deferred outflows of resources 2,811,428 4,347,137 Total assets and deferred outflows of resources $ 377,346,911 $ 358,949,041
Water Fund
See accompanying independent auditor's report.
City of Waco, TexasComparative Statement of Net Position
Major Enterprise Funds September 30, 2020 and 2019
190
DRAFT

2020 2019LiabilitiesCurrent liabilities:
Accounts payable 761,059 598,870 Accrued liabilities 963,773 903,669 Compensated absences payable 773,237 733,533 Refundable contracts 530,653 595,903 Notes payable 94,166 90,162 Revenue bonds payable 12,235,000 11,495,000 Accrued interest payable 1,533,445 1,469,950
Current liabilities payable from restricted assets:Accounts payable 3,515,052 2,521,458 Customer deposits 3,117,477 3,150,266
Total current liabilities 23,523,862 21,558,811 Noncurrent liabilities:
Refundable contracts 561,176 566,044 Compensated absences payable 512,516 430,941 Bonds payable 198,858,649 192,470,131 Notes payable 1,317,650 1,411,816 Net pension liability 3,189,292 5,202,199
Total noncurrent liabilities 204,439,283 200,081,131 Total liabilities 227,963,145 221,639,942
Deferred inflows of resourcesDeferred inflows on pension liability 887,136 29,993
Total deferred inflows of resources 887,136 29,993 Total liabilities and deferred inflows of resources 228,850,281 221,669,935
Net positionNet investment in capital assets 105,178,426 98,354,478 Unrestricted 43,318,204 38,924,628
Total net position $ 148,496,630 $ 137,279,106
191
DRAFT

2020 2019Operating revenues:
Charges for services $ 52,383,210 $ 49,692,270 Other 727,621 593,032
Total operating revenues 53,110,831 50,285,302
Operating expenses:Salaries and wages 5,381,938 5,030,485 Employee benefits 2,283,371 2,503,579 Purchased professional/technical services 2,093,061 2,233,511 Purchased property services 168,856 164,182 Maintenance 3,285,735 2,934,946 Other purchased services 1,421,543 1,393,478 Supplies 4,557,168 4,283,515 Other 5,080,087 5,228,606 Depreciation/amortization 10,912,032 10,373,077
Total operating expenses 35,183,791 34,145,379 Operating income (loss) 17,927,040 16,139,923
Nonoperating revenues (expenses):Investment earnings 474,308 1,111,088 Other income 50 2,050 Intergovernmental revenue 258,577 4,771 Bond issuance costs (88,796) (215,706)Interest expense and fiscal charges (5,798,554) (5,479,925)
Total nonoperating revenues (expenses) (5,154,415) (4,577,722)Income (loss) before contributions and transfers 12,772,625 11,562,201
Capital contributions 1,829,961 100,043 Transfers in 250,000 - Transfers out (3,635,062) (3,451,820)
Change in net position 11,217,524 8,210,424 Total net position, beginning of year 137,279,106 129,068,682 Total net position, end of year $ 148,496,630 $ 137,279,106
Water Fund
See accompanying independent auditor's report.
City of Waco, TexasComparative Statement of Revenues, Expenditures, and Changes in Net Position
Major Enterprise FundsYears Ended September 30, 2020 and 2019
192
DRAFT

2020 2019Cash flows from operating activities:
Cash received from customers $ 53,878,733 $ 48,197,765 Cash paid to suppliers for goods and services (16,563,303) (16,376,158)Cash paid to employees for services (7,360,983) (7,091,359)
Net cash provided by (used for) operating activities 29,954,447 24,730,248
Cash flows from noncapital financing activities:Intergovernmental revenue 258,577 4,771 Intergovernmental expenses - (345,841)Contributions (258,577) - Transfers to other funds (3,635,062) (3,451,820)
Net cash provided by (used for) noncapital financing activities (3,635,062) (3,792,890)
Cash flows from capital and related financing activities:Acquisition and construction of capital assets (18,343,607) (25,540,527)Proceeds from sale of debt 20,507,116 21,128,688 Payments of refundable contracts (530,652) (440,883)Principal paid on debt (11,495,000) (10,680,000)Interest paid on debt (7,429,410) (6,960,649)Transfers from other funds 250,000 -
Net cash provided by (used for) capital and related financing activities (17,041,553) (22,493,371)
Cash flows from investing activities:Rental revenue 50 2,050 Investment earnings 474,308 1,111,088
Net cash provided by (used for) investing activities 474,358 1,113,138 Net increase (decrease) in cash and cash equivalents 9,752,190 (442,875)
Cash and cash equivalents, beginning of year 90,363,644 90,806,519 Cash and cash equivalents, end of year $ 100,115,834 $ 90,363,644
Reconciliation of operating income (loss) to net cash provided by operating activities:
Operating income (loss) $ 17,927,040 $ 16,139,923 Adjustments to reconcile operating income (loss) to net cashprovided by (used for) operating activities:
Provision for uncollectible accounts receivable 76,646 121,201 Depreciation/amortization 10,912,032 10,373,077 Changes in assets and liabilities:
Decrease (increase) in assets:Accounts receivable 724,045 (1,934,423)Prepaid items (57,014) (274,315)Inventory (40,987) 19,214
Increase (decrease) in liabilities:Accounts payable 162,189 52,134 Accrued liabilities 60,104 (119,452)Compensated absences payable 121,279 (52,555)Net pension liability 101,902 444,233 Customer deposits (32,789) (38,789)
Net cash provided by (used for) operating activities $ 29,954,447 $ 24,730,248
Schedule of Noncash capital and related financing activities: Assets acquired through refundable contracts $ 1,829,961 $ 100,043 Proceeds of refunding bonds used for bond issuance costs and payment to refunded bond escrow agent $ - $ 11,279,487
See accompanying independent auditor's report.
Water Fund
City of Waco, TexasComparative Statement of Cash Flows
Major Enterprise FundsYears Ended September 30, 2020 and 2019
193
DRAFT

194
DRAFT

195
Wastewater Fund
DRAFT

2020 2019AssetsCurrent assets:
Cash and investments $ 35,564,202 $ 30,691,589 Accounts receivable, net of allowance 4,553,629 4,431,078 Intergovernmental receivable 647,984 134,085 Restricted cash and investments 5,836,639 9,572,646 Inventory 27,754 14,327
Total current assets 46,630,208 44,843,725 Noncurrent assets:
Restricted cash and investments 73,759,311 77,542,439 Capital assets:
Land 3,361,999 2,691,723 Buildings 11,553,195 11,089,302 Improvements other than buildings 176,283,796 152,445,986 Equipment 13,585,073 12,166,624 Construction work in progress 61,544,778 37,489,356 Less: accumulated depreciation and amortization (78,290,443) (72,556,301)
Total noncurrent assets 261,797,709 220,869,129 Total assets 308,427,917 265,712,854
Deferred outflows of resourcesDeferred losses on refundings of debt 633,255 758,010 Deferred outflows on pension liability 575,206 1,413,648
Total deferred outflows of resources 1,208,461 2,171,658 Total assets and deferred outflows of resources $ 309,636,378 $ 267,884,512
Wastewater Fund
See accompanying independent auditor's report.
City of Waco, TexasComparative Statement of Net Position
Major Enterprise Funds September 30, 2020 and 2019
196
DRAFT

2020 2019LiabilitiesCurrent liabilities:
Accounts payable 1,061,548 832,117 Accrued liabilities 285,090 348,190 Compensated absences payable 309,283 357,884 Revenue bonds payable 8,540,000 8,120,000 Accrued interest payable 1,232,526 1,292,892
Current liabilities payable from restricted assets:Accounts payable 5,836,639 9,572,643
Total current liabilities 17,265,086 20,523,726 Noncurrent liabilities:
Refundable contracts 192,542 192,542 Compensated absences payable 178,361 6,114 Bonds payable 158,534,321 153,753,400 Net pension liability 2,126,194 3,468,132
Total noncurrent liabilities 161,031,418 157,420,188 Total liabilities 178,296,504 177,943,914
Deferred inflows of resourcesDeferred inflows on pension liability 591,425 19,994
Total deferred inflows of resources 591,425 19,994 Total liabilities and deferred inflows of resources 178,887,929 177,963,908
Net positionNet investment in capital assets 95,164,101 61,264,722 Unrestricted 35,584,348 28,655,882
Total net position $ 130,748,449 $ 89,920,604
197
DRAFT

2020 2019Operating revenues:
Charges for services $ 37,639,693 $ 33,868,919 Other 645,125 566,156
Total operating revenues 38,284,818 34,435,075
Operating expenses:Salaries and wages 3,594,631 3,051,733 Employee benefits 1,477,501 1,484,321 Purchased professional/technical services 2,049,031 2,057,079 Purchased property services 91,675 87,971 Maintenance 2,750,824 2,969,120 Other purchased services 354,744 556,220 Supplies 2,669,199 2,302,692 Other 4,913,635 4,692,833 Depreciation/amortization 6,838,111 5,536,080
Total operating expenses 24,739,351 22,738,049 Operating income (loss) 13,545,467 11,697,026
Nonoperating revenues (expenses):Investment earnings 412,060 577,365 Other income 24,547 - Intergovernmental revenue 513,898 - Bond issuance costs (64,953) (198,071)Interest expense and fiscal charges (4,480,133) (4,110,929)Gain (loss) on disposal of capital assets - (185,577)
Total nonoperating revenues (expenses) (3,594,581) (3,917,212)Income (loss) before contributions and transfers 9,950,886 7,779,814
Capital contributions 1,886,839 - Special item: Gain on termination of agreement 29,769,651 -
Transfers in 250,000 - Transfers out (1,029,531) (960,784)
Change in net position 40,827,845 6,819,030 Total net position, beginning of year 89,920,604 83,101,574 Total net position, end of year $ 130,748,449 $ 89,920,604
See accompanying independent auditor's report.
Wastewater Fund
City of Waco, TexasComparative Statement of Revenues, Expenditures, and Changes in Net Position
Major Enterprise FundsYears Ended September 30, 2020 and 2019
198
DRAFT

2020 2019Cash flows from operating activities:
Cash received from customers $ 38,162,267 $ 33,515,792 Cash paid to suppliers for goods and services (12,620,251) (16,117,744)Cash paid to employees for services (4,936,504) (4,309,377)
Net cash provided by (used for) operating activities 20,605,512 13,088,671
Cash flows from noncapital financing activities:Other nonoperating income 24,547 - Transfers to other funds (1,029,531) (960,784)
Net cash provided by (used for) noncapital financing activities (1,004,984) (960,784)
Cash flows from capital and related financing activities:Acquisition and construction of capital assets (23,629,334) (18,865,749)Proceeds from sale of debt 15,000,148 24,981,909 Transfer from other funds 250,000 - Principal paid on debt (8,120,000) (7,220,000)Interest paid on debt (6,159,924) (5,551,005)
Net cash provided by (used for) capital and related financing activities (22,659,110) (6,654,845)
Cash flows from investing activities:Investment earnings 412,060 579,524 Note payments from other entities - 354,751
Net cash provided by (used for) investing activities 412,060 934,275 Net increase (decrease) in cash and cash equivalents (2,646,522) 6,407,317
Cash and cash equivalents, beginning of year 117,806,674 111,399,357 Cash and cash equivalents, end of year $ 115,160,152 $ 117,806,674
Reconciliation of operating income (loss) to net cash provided by operating activities:
Operating income (loss) $ 13,545,467 $ 11,697,026 Adjustments to reconcile operating income (loss) to net cash provided by (used for) operating activities:
Provision for uncollectible accounts receivable 64,917 81,725 Depreciation/amortization 6,838,111 5,536,080 Changes in assets and liabilities:
Decrease (increase) in assets:Accounts receivable (187,468) (1,001,008)Inventory (13,427) (96)
Increase (decrease) in liabilities:Accounts payable 229,431 (3,074,666)Accrued liabilities (63,100) (352,801)Compensated absences payable 123,646 (93,744)Net pension liability 67,935 296,155
Net cash provided by (used for) operating activities $ 20,605,512 $ 13,088,671
Schedule of Noncash capital and related financing activities:Contributions of capital assets $ 1,886,839 $ -
Contributions of capital assets conveyance from termination of agreement $ 25,326,864 $ -
Proceeds of refunding bonds used for bond issuance costs and payment to refunded bond escrow agent $ - $ 3,384,750
See accompanying independent auditor's report.
Wastewater Fund
City of Waco, TexasComparative Statement of Cash Flows
Major Enterprise FundsYears Ended September 30, 2020 and 2019
199
DRAFT

200
DRAFT

201
Solid Waste Fund
DRAFT

2020 2019AssetsCurrent assets:
Cash and investments $ 15,296,490 $ 15,177,214 Accounts receivable, net of allowance 2,052,381 2,078,371
Total current assets 17,348,871 17,255,585 Noncurrent assets: Restricted cash and investments 237,257 237,257
Capital assetsLand 7,157,215 7,127,215 Buildings 1,370,137 1,370,137 Improvements other than buildings 30,876,058 30,876,058 Equipment 23,358,132 21,389,004 Construction work in progress 3,521,508 2,142,315 Less: accumulated depreciation and amortization (44,906,461) (41,819,568)
Total noncurrent assets 21,613,846 21,322,418 Total assets 38,962,717 38,578,003
Deferred outflows of resourcesDeferred outflows on pension liability 575,206 1,413,648
Total deferred outflows of resources 575,206 1,413,648 Total assets and deferred outflows of resources $ 39,537,923 $ 39,991,651
Solid Waste Fund
See accompanying independent auditor's report.
City of Waco, TexasComparative Statement of Net Position
Major Enterprise Funds September 30, 2020 and 2019
202
DRAFT

2020 2019LiabilitiesCurrent liabilities:
Accounts payable 1,066,799 477,411 Accrued liabilities 481,567 311,625 Compensated absences payable 406,301 318,018 Revenue bonds payable 1,195,000 1,035,000 Accrued interest payable 26,567 72,355
Total current liabilities 3,176,234 2,214,409
Noncurrent liabilities:Estimated landfill closure and post-closure care costs 6,254,242 5,960,892 Compensated absences payable 474,273 339,193 Bonds payable 2,322,461 3,618,242 Net pension liability 2,126,194 3,468,132
Total noncurrent liabilities 11,177,170 13,386,459 Total liabilities 14,353,404 15,600,868
Deferred inflows of resourcesDeferred gains on refundings of debt - 10,446 Deferred inflows on pension liability 591,425 19,994
Total deferred inflows of resources 591,425 30,440 Total liabilities and deferred inflows of resources 14,944,829 15,631,308
Net positionNet investment in capital assets 18,096,385 16,658,730 Unrestricted 6,496,709 7,701,613
Total net position $ 24,593,094 $ 24,360,343
203
DRAFT

2020 2019Operating revenues:
Charges for services $ 21,604,791 $ 20,213,771 Other 86,712 222,142
Total operating revenues 21,691,503 20,435,913
Operating expenses:Salaries and wages 4,001,338 3,407,141 Employee benefits 1,828,242 1,815,115 Purchased professional/technical services 2,996,754 2,889,010 Purchased property services 27,594 22,143 Maintenance 2,692,330 2,096,240 Other purchased services 227,312 1,596,277 Supplies 1,980,764 1,756,662 Other 4,028,028 3,974,085 Depreciation/amortization 3,540,654 3,006,878
Total operating expenses 21,323,016 20,563,551 Operating income (loss) 368,487 (127,638)
Nonoperating revenues (expenses):Investment earnings 160,680 406,788 Bond issuance costs - (20,415)Interest expense and fiscal charges (66,336) (19,402)Gain (loss) on disposal of capital assets 190,081 (264,611)
Total nonoperating revenues (expenses) 284,425 102,360 Income (loss) before contributions and transfers 652,912 (25,278)
Transfers out (420,161) (388,357)Change in net position 232,751 (413,635)
Total net position, beginning of year 24,360,343 24,773,978 Total net position, end of year $ 24,593,094 $ 24,360,343
Solid Waste Fund
See accompanying independent auditor's report.
City of Waco, TexasComparative Statement of Revenues, Expenditures, and Changes in Net Position
Major Enterprise FundsYears Ended September 30, 2020 and 2019
204
DRAFT

2020 2019Cash flows from operating activities:
Cash received from customers $ 21,717,493 $ 20,517,068 Cash paid to suppliers for goods and services (10,911,987) (11,765,997)Cash paid to employees for services (5,526,397) (5,180,957)
Net cash provided by (used for) operating activities 5,279,109 3,570,114
Cash flows from noncapital financing activities:Transfers to other funds (420,161) (388,357)
Net cash provided by (used for) noncapital financing activities (420,161) (388,357)
Cash flows from capital and related financing activities:Acquisition of capital assets (3,832,082) (10,097,945)Proceeds from disposal of capital assets 190,081 - Principal paid on debt (1,035,000) (535,000)Interest paid on debt (223,351) (95,166)Proceeds from sale of debt - 2,648,930
Net cash provided by (used for) capital and related financing activities (4,900,352) (8,079,181)
Cash flows from investing activities:Investment earnings 160,680 406,788
Net cash provided by (used for) investing activities 160,680 406,788 Net increase (decrease) in cash and cash equivalents 119,276 (4,490,636)
Cash and cash equivalents, beginning of year 15,414,471 19,905,107 Cash and cash equivalents, end of year $ 15,533,747 $ 15,414,471
Reconciliation of operating income (loss) to net cash provided by (used for) operating activities:
Operating income (loss) $ 368,487 $ (127,638)Adjustments to reconcile operating income (loss) to net cash provided by (used for) operating activities:
Provision for uncollectible accounts receivable 22,124 128,498 Depreciation/amortization 3,540,654 3,006,878 Changes in assets and liabilities:
Decrease (increase) in assets:Accounts receivable 3,866 (47,343)
Increase (decrease) in liabilities:Accounts payable 589,388 (48,199)Accrued liabilities 169,942 2,965 Estimated landfill closure and post-closure care costs 293,350 345,568 Compensated absences payable 223,363 13,230 Net pension liability 67,935 296,155
Net cash provided by (used for) operating activities $ 5,279,109 $ 3,570,114
Schedule of Noncash capital and related financing activities:Proceeds of refunding bonds used for bond issuance costs and payment to refunded bond escrow agent $ - $ 246,341
See accompanying independent auditor's report.
Solid Waste Fund
City of Waco, TexasComparative Statement of Cash Flows
Major Enterprise FundsYears Ended September 30, 2020 and 2019
205
DRAFT

206
DRAFT

207
Nonmajor Enterprise Funds
Enterprise Funds are used to account for those operations that are financed and operated in a manner similar to private business or where the City has decided that the determination of revenue earned, costs incurred and/or net income is necessary for management accountability.
Airport Fund - This fund is used to account for the provision of passenger and freight air services to the residents of the City and surrounding areas. Convention Services Fund - This fund is used to account for the provision of convention facilities. Ranger Hall of Fame Fund - This fund is used to account for the provision of this facility to the public. Cameron Park Zoo Fund - This fund is used to account for the provision of this facility to the public. Transit Services Fund - This fund is used to account for the provision of public transit services to the residents of the City. Cottonwood Creek Golf Course Fund - This fund is used to account for the provision of this facility to the public.
DRAFT

AssetsCurrent assets:
Cash and investments $ - $ 3,983,783 $ 1,107,375 Accounts receivable, net of allowances 56,245 276,225 - Intergovernmental receivable 2,864,595 - - Inventories - 55,370 90,672
Total current assets 2,920,840 4,315,378 1,198,047 Noncurrent assets:
Restricted cash and investments - - 122,413 Capital assets:
Land 2,977,470 - - Buildings 15,208,680 26,091,668 3,720,747 Improvements other than buildings 45,870,138 555,845 418,768 Equipment 2,525,747 1,582,120 452,159 Museum collections - - 2,274,424 Construction work in progress 752,540 778,467 - Less: accumulated depreciation (36,908,751) (12,987,844) (1,978,017)
Total noncurrent assets 30,425,824 16,020,256 5,010,494 Total assets $ 33,346,664 $ 20,335,634 $ 6,208,541
LiabilitiesCurrent liabilities:
Accounts payable 39,152 197,919 4,696 Accrued liabilities 51,871 79,481 50,359 Unearned revenue - 75,398 - Due to other funds 664,200 - - Compensated absences payable 51,710 159,568 86,332
Total current liabilities 806,933 512,366 141,387 Noncurrent liabilities:
Advances from other funds - - - Compensated absences payable 30,414 10,838 117,705
Total noncurrent liabilities 30,414 10,838 117,705 Total liabilities 837,347 523,204 259,092
Net positionNet investment in capital assets 30,425,824 16,020,256 4,888,081 Restricted for:
Capital projects 331,693 - 241,493 Unrestricted 1,751,800 3,792,174 819,875
Total net position $ 32,509,317 $ 19,812,430 $ 5,949,449
See accompanying independent auditor's report.
City of Waco, Texas
September 30, 2020Nonmajor Enterprise Funds
Combining Statement of Net Position
(With Comparative Totals for September 30, 2019)
Convention Services FundAirport Fund
Ranger Hall of Fame Fund
208
DRAFT

2020 2019
$ 1,427,572 $ - $ 999,083 $ 7,517,813 9,321,216$ - 223,719 - 556,189 768,862 - 2,725,303 - 5,589,898 3,089,065 100,203 531,934 241,857 1,020,036 1,001,867 1,527,775 3,480,956 1,240,940 14,683,936 14,181,010
- - - 122,413 107,851
- 423,284 - 3,400,754 2,202,595 9,421,759 6,919,608 713,389 62,075,851 62,024,556 19,080,351 244,951 2,017,246 68,187,299 68,157,299 679,529 13,664,682 1,340,725 20,244,962 18,517,737 - - - 2,274,424 2,264,424 25,926 - - 1,556,933 613,292
(21,164,206) (14,291,526) (3,290,468) (90,620,812) (84,908,965) 8,043,359 6,960,999 780,892 67,241,824 68,978,789 $ 9,571,134 $ 10,441,955 $ 2,021,832 $ 81,925,760 83,159,799$
71,621 44,371 41,303 399,062 414,221 161,206 232,004 651,742 1,226,663 1,352,023 53,589 41,250 - 170,237 284,372 - 1,214,023 - 1,878,223 2,486,047 229,163 - 59,596 586,369 571,287 515,579 1,531,648 752,641 4,260,554 5,107,950
- - 693,704 693,704 693,704 172,544 - 120,449 451,950 257,177 172,544 - 814,153 1,145,654 950,881 688,123 1,531,648 1,566,794 5,406,208 6,058,831
8,043,359 6,960,999 780,892 67,119,411 68,870,938
- 433,222 - 1,006,408 1,057,103 839,652 1,516,086 (325,854) 8,393,733 7,172,927 $ 8,883,011 $ 8,910,307 $ 455,038 $ 76,519,552 77,100,968$
TotalsCottonwood Creek Golf
Course FundTransit Services
FundCameron Park
Zoo Fund
209
DRAFT
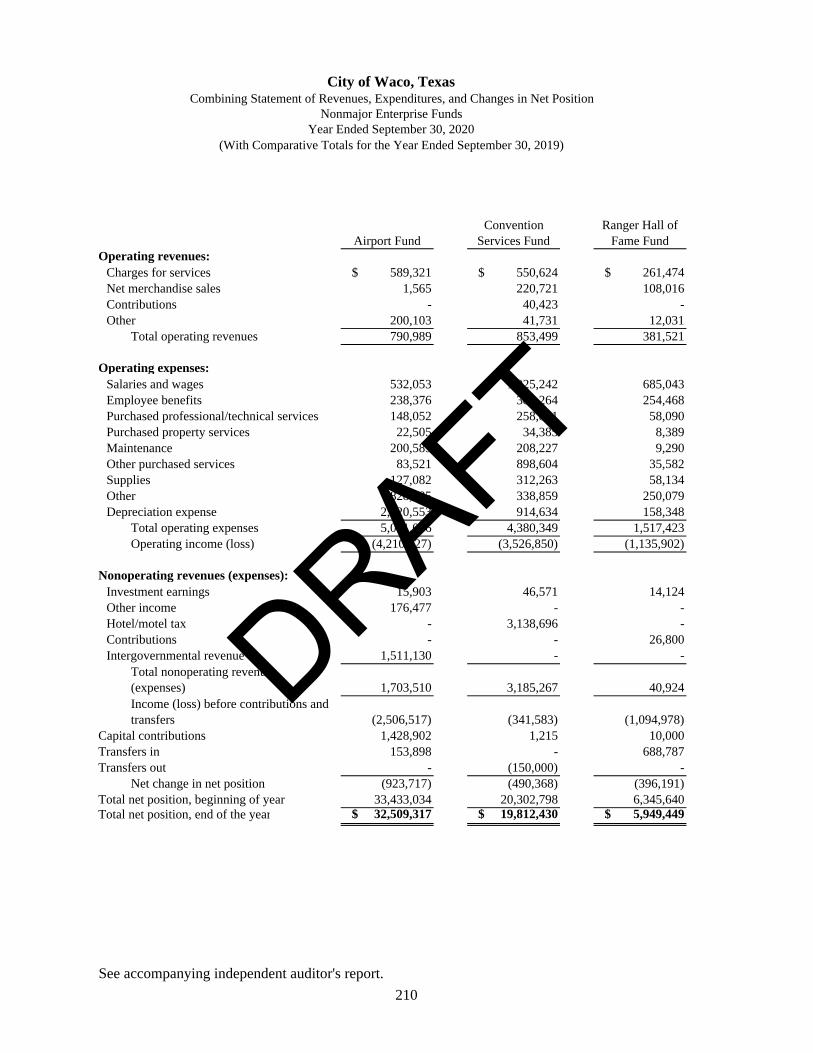
Operating revenues:Charges for services $ 589,321 $ 550,624 $ 261,474 Net merchandise sales 1,565 220,721 108,016 Contributions - 40,423 - Other 200,103 41,731 12,031
Total operating revenues 790,989 853,499 381,521
Operating expenses:Salaries and wages 532,053 1,025,242 685,043 Employee benefits 238,376 389,264 254,468 Purchased professional/technical services 148,052 258,871 58,090 Purchased property services 22,505 34,385 8,389 Maintenance 200,589 208,227 9,290 Other purchased services 83,521 898,604 35,582 Supplies 127,082 312,263 58,134 Other 828,285 338,859 250,079 Depreciation expense 2,820,553 914,634 158,348
Total operating expenses 5,001,016 4,380,349 1,517,423 Operating income (loss) (4,210,027) (3,526,850) (1,135,902)
Nonoperating revenues (expenses):Investment earnings 15,903 46,571 14,124 Other income 176,477 - - Hotel/motel tax - 3,138,696 - Contributions - - 26,800 Intergovernmental revenue 1,511,130 - -
Total nonoperating revenues (expenses) 1,703,510 3,185,267 40,924 Income (loss) before contributions and transfers (2,506,517) (341,583) (1,094,978)
Capital contributions 1,428,902 1,215 10,000 Transfers in 153,898 - 688,787 Transfers out - (150,000) -
Net change in net position (923,717) (490,368) (396,191)Total net position, beginning of year 33,433,034 20,302,798 6,345,640 Total net position, end of the year $ 32,509,317 $ 19,812,430 $ 5,949,449
City of Waco, Texas
See accompanying independent auditor's report.
Year Ended September 30, 2020Nonmajor Enterprise Funds
Combining Statement of Revenues, Expenditures, and Changes in Net Position
(With Comparative Totals for the Year Ended September 30, 2019)
Convention Services FundAirport Fund
Ranger Hall of Fame Fund
210
DRAFT

2020 2019
$ 1,392,809 $ 1,061,224 $ 1,354,570 $ 5,210,022 7,010,647$ 306,615 - 218,333 855,250 1,158,280 - - - 40,423 252,587 11,977 1,444,399 17,118 1,727,359 1,988,577 1,711,401 2,505,623 1,590,021 7,833,054 10,410,091
1,968,543 3,382,831 515,977 8,109,689 8,087,574 888,194 830,606 208,390 2,809,298 2,759,898 161,702 504,271 433,397 1,564,383 1,992,808 649,008 22,040 61,823 798,150 1,014,963 98,915 544,874 102,980 1,164,875 1,220,276 118,709 502,669 141,861 1,780,946 2,404,765 850,767 627,837 225,342 2,201,425 2,528,321 207,140 612,006 43,457 2,279,826 1,361,706 1,060,836 727,572 170,544 5,852,487 5,739,059 6,003,814 7,754,706 1,903,771 26,561,079 27,109,370
(4,292,413) (5,249,083) (313,750) (18,728,025) (16,699,279)
10,224 - 9,354 96,176 183,447 - 42,236 - 218,713 428,032 - - - 3,138,696 4,617,066 - - - 26,800 21,175 - 4,463,154 - 5,974,284 4,002,842
10,224 4,505,390 9,354 9,454,669 9,252,562
(4,282,189) (743,693) (304,396) (9,273,356) (7,446,717) 61,338 1,164,371 - 2,665,826 3,984,768 3,396,770 1,258,355 678,304 6,176,114 4,811,416 - - - (150,000) (680,000)
(824,081) 1,679,033 373,908 (581,416) 669,467 9,707,092 7,231,274 81,130 77,100,968 76,431,501 $ 8,883,011 $ 8,910,307 $ 455,038 $ 76,519,552 77,100,968$
Cottonwood Creek Golf
Course FundTransit Services
FundCameron Park
Zoo FundTotals
211
DRAFT

Cash flows from operating activities:
Cash received from customers $ 791,923 $ 844,238 $ 381,521
Cash paid to suppliers for goods and services (1,444,116) (1,995,294) (425,359)
Cash paid to employees for services (739,688) (1,414,317) (862,696)
Net cash provided by (used for) operating activities (1,391,881) (2,565,373) (906,534)
Cash flows from noncapital financing activities:
Intergovernmental revenue 87,815 - -
Contributions - - 26,800
Hotel/motel tax - 3,251,265 -
Passenger facility charges 176,477 - -
Transfers from other funds 153,898 - 688,787
Transfers to other funds - (150,000) -
Advances from other funds 664,200 - -
Net cash provided by (used for) noncapital financing activities 1,082,390 3,101,265 715,587
Cash flows from capital and related financing activities:
Acquisition of capital assets (1,534,055) (858,578) -
Capital contributions 167,312 - -
Proceeds from insurance recoveries - - -
Net cash provided by (used for) capital and related financing
activities (1,366,743) (858,578) -
Cash flows from investing activities:
Investment earnings 15,903 46,571 14,124
Net cash provided by (used for) investing activities 15,903 46,571 14,124
Net increase (decrease) in cash and cash equivalents (1,660,331) (276,115) (176,823)
Cash and cash equivalents, beginning of year 1,660,331 4,259,898 1,406,611
Cash and cash equivalents, end of year $ - $ 3,983,783 $ 1,229,788
Reconciliation of operating income (loss) to net cash used for
operating activities:
Operating income (loss) $ (4,210,027) $ (3,526,850) $ (1,135,902)
Adjustment to reconcile operating income (loss) to net cash used
for operating activities:
Depreciation 2,820,553 914,634 158,348
Changes in assets and liabilities:
Decrease (increase) in assets:
Accounts receivable 934 104,548 -
Inventory 2,589 (108) 4,073
Increase (decrease) in liabilities:
Accounts payable (37,870) 55,409 (3,345)
Accrued liabilities 12,440 (26,105) 5,458
Unearned revenue - (113,810) -
Compensated absences payable 19,500 26,908 64,834
Net cash provided by (used for) operating activities $ (1,391,881) $ (2,565,374) $ (906,534)
Noncash investing, capital and financing activities:
Contributions of capital assets $ 22,695 $ 1,215 $ 10,000
See accompanying independent auditor's report.
Airport Fund
City of Waco, Texas
For the Year Ended September 30, 2020
Nonmajor Enterprise Funds
Combining Statement of Cash Flows
(With Comparative Totals for September 30, 2019)
Convention
Services Fund
Ranger Hall of
Fame Fund
proprietary funds as compared to capital contributions from capital and related financing activities and noncash investing,
Additionally, variances in capital contributions per the statement of revenues, expenses and changes in net position -
capital and financing activities result from changes in the following item: intergovernmental accounts receivables, accounts
payable and accrued liabilities related to capital items.
212
DRAFT
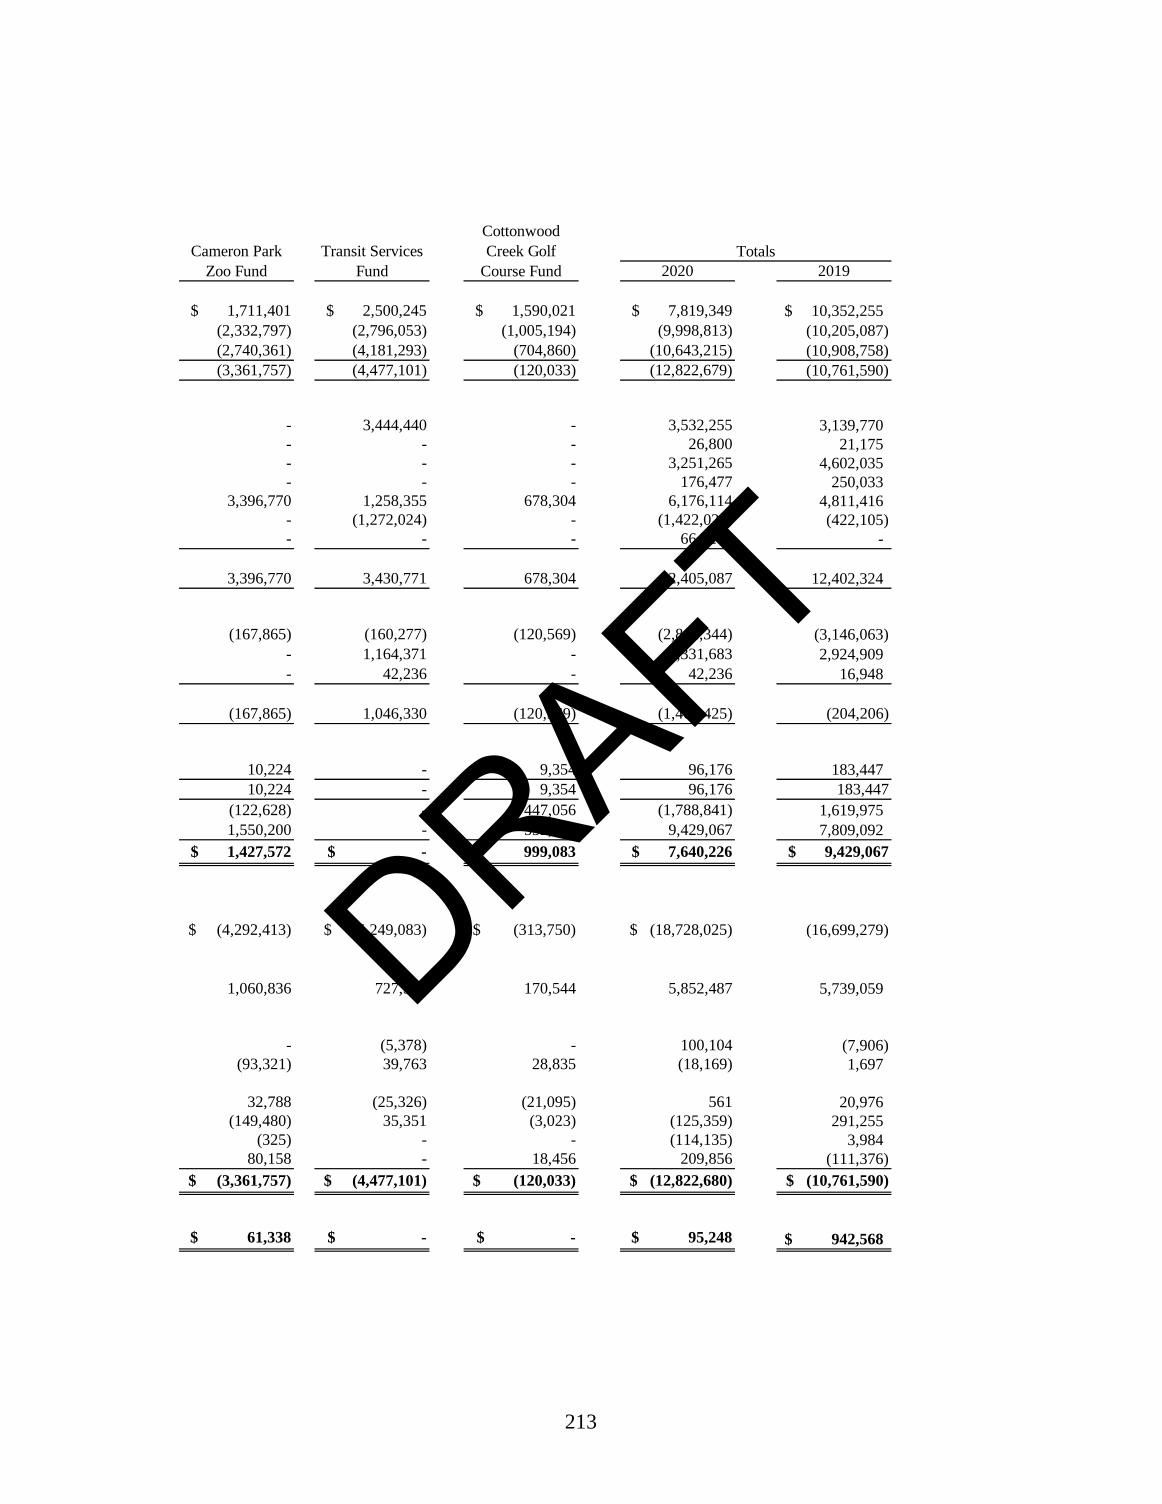
2020 2019
$ 1,711,401 $ 2,500,245 $ 1,590,021 $ 7,819,349 10,352,255$
(2,332,797) (2,796,053) (1,005,194) (9,998,813) (10,205,087)
(2,740,361) (4,181,293) (704,860) (10,643,215) (10,908,758)
(3,361,757) (4,477,101) (120,033) (12,822,679) (10,761,590)
- 3,444,440 - 3,532,255 3,139,770
- - - 26,800 21,175
- - - 3,251,265 4,602,035
- - - 176,477 250,033
3,396,770 1,258,355 678,304 6,176,114 4,811,416
- (1,272,024) - (1,422,024) (422,105)
- - - 664,200 -
3,396,770 3,430,771 678,304 12,405,087 12,402,324
(167,865) (160,277) (120,569) (2,841,344) (3,146,063)
- 1,164,371 - 1,331,683 2,924,909
- 42,236 - 42,236 16,948
(167,865) 1,046,330 (120,569) (1,467,425) (204,206)
10,224 - 9,354 96,176 183,447
10,224 - 9,354 96,176 183,447
(122,628) - 447,056 (1,788,841) 1,619,975
1,550,200 - 552,027 9,429,067 7,809,092
$ 1,427,572 $ - $ 999,083 $ 7,640,226 $ 9,429,067
$ (4,292,413) $ (5,249,083) $ (313,750) $ (18,728,025) (16,699,279)
1,060,836 727,572 170,544 5,852,487 5,739,059
- (5,378) - 100,104 (7,906)
(93,321) 39,763 28,835 (18,169) 1,697
32,788 (25,326) (21,095) 561 20,976
(149,480) 35,351 (3,023) (125,359) 291,255
(325) - - (114,135) 3,984
80,158 - 18,456 209,856 (111,376)
$ (3,361,757) $ (4,477,101) $ (120,033) $ (12,822,680) $ (10,761,590)
$ 61,338 $ - $ - $ 95,248 942,568$
Totals
Cottonwood
Creek Golf
Course Fund
Transit Services
Fund
Cameron Park
Zoo Fund
213
DRAFT

214
DRAFT

215
Airport Fund
DRAFT

2020 2019AssetsCurrent assets:
Cash and investments $ - $ 1,660,331 Accounts receivable, net of allowance 56,245 57,179 Intergovernmental receivable 2,864,595 218,105 Inventory - 2,589
Total current assets 2,920,840 1,938,204 Noncurrent assets:
Capital assets:Land 2,977,470 1,779,311 Buildings 15,208,680 15,189,938 Improvements other than buildings 45,870,138 45,870,138 Equipment 2,525,747 2,351,072 Construction work in progress 752,540 587,366 Less: accumulated depreciation and amortization (36,908,751) (34,088,198)
Total noncurrent assets 30,425,824 31,689,627 Total assets 33,346,664 33,627,831
LiabilitiesCurrent liabilities:
Accounts payable 39,152 92,742 Accrued liabilities 51,871 39,431 Due to other funds 664,200 - Compensated absences payable 51,710 49,943
Total current liabilities 806,933 182,116 Noncurrent liabilities:
Compensated absences payable 30,414 12,681 Total noncurrent liabilities 30,414 12,681 Total liabilities 837,347 194,797
Net positionNet investment in capital assets 30,425,824 31,689,627 Restricted for:
Capital projects 331,693 277,673 Unrestricted 1,751,800 1,465,734
Total net position $ 32,509,317 $ 33,433,034
See accompanying independent auditor's report.
Airport Fund
City of Waco, TexasComparative Statement of Net Position
Nonmajor Enterprise Funds September 30, 2020 and 2019
216
DRAFT

2020 2019Operating revenues:
Charges for services $ 589,321 $ 622,197 Net merchandise sales 1,565 5,219 Other income 200,103 279,310
Total operating revenues 790,989 906,726
Operating expenses:Salaries and wages 532,053 460,560 Employee benefits 238,376 197,814 Purchased professional/technical services 148,052 247,696 Purchased property services 22,505 20,077 Maintenance 200,589 112,432 Other purchased services 83,521 79,973 Supplies 127,082 121,845 Other 828,285 353,155 Depreciation/amortization 2,820,553 2,739,686
Total operating expenses 5,001,016 4,333,238 Operating income (loss) (4,210,027) (3,426,512)
Nonoperating revenues (expenses):Investment earnings 15,903 39,937 Other income 176,477 411,084 Intergovernmental revenue 1,511,130 97,138
Total nonoperating revenues (expenses) 1,703,510 548,159 Income (loss) before contributions and transfers (2,506,517) (2,878,353)
Capital contributions 1,428,902 2,530,094 Transfers in 153,898 453,898
Change in net position (923,717) 105,639 Total net position, beginning of year 33,433,034 33,327,395
Total net position, end of year $ 32,509,317 $ 33,433,034
Airport Fund
See accompanying independent auditor's report.
City of Waco, TexasComparative Statement of Revenues, Expenditures, and Changes in Net Position
Nonmajor Enterprise FundsYears Ended September 30, 2020 and 2019
217
DRAFT

2020 2019Cash flows from operating activities:
Cash received from customers $ 791,923 $ 905,428 Cash paid to suppliers for goods and services (1,444,116) (895,524)Cash paid to employees for services (739,688) (647,223)
Net cash provided by (used for) operating activities (1,391,881) (637,319)
Cash flows from noncapital financing activities:Intergovernmental revenue 87,815 95,993 Passenger facility charges 176,477 250,033 Transfers from other funds 153,898 453,898 Advances from other funds 664,200
Net cash provided by (used for) noncapital financing activities 1,082,390 799,924
Cash flows from capital and related financing activities:Acquisition of capital assets (1,534,055) (2,607,798)Capital contributions 167,312 2,412,803
Net cash provided by (used for) capital and related financing activities (1,366,743) (194,995)
Cash flows from investing activities:Investment earnings 15,903 39,937
Net cash provided by investing activities 15,903 39,937 Net increase (decrease) in cash and cash equivalents (1,660,331) 7,547
Cash and cash equivalents, beginning of year 1,660,331 1,652,784
Cash and cash equivalents, end of year $ - $ 1,660,331
Reconciliation of operating income (loss) to net cash provided by (used for) operating activities:
Operating income (loss) $ (4,210,027) $ (3,426,512)Adjustments to reconcile operating income (loss) to net cash provided (used) by operating activities:
Depreciation/amortization 2,820,553 2,739,686 Changes in assets and liabilities:
Decrease (increase) in assets:Accounts receivable 934 (1,298)Inventory 2,589 (587)
Increase (decrease) in liabilities:Accounts payable (37,870) 41,188 Accrued liabilities 12,440 3,438 Compensated absences payable 19,500 6,766
Net cash provided by (used for) operating activities $ (1,391,881) $ (637,319)
Noncash capital and related financing activities:Contributions of capital assets $ 22,695 $ -
Noncash investing, capital, and financing activities:
- proprietary funds as compared to capital contributions from capital and related financing activities and noncash
City of Waco, TexasComparative Statement of Cash Flows
Nonmajor Enterprise FundsYears Ended September 30, 2020 and 2019
See accompanying independent auditor's report.
Additionally, variances in capital contributions per the statement of revenues, expenses and changes in net position
investing, capital and financing activities result from changes in the following items: intergovernmental accounts receivable, accounts payable and accrued liabilities related to capital items.
Airport Fund
218
DRAFT

219
Convention Services Fund
DRAFT

2020 2019AssetsCurrent assets:
Cash and investments $ 3,983,783 $ 4,259,898 Accounts receivable, net of allowance 276,225 493,342 Inventory 55,370 55,262
Total current assets 4,315,378 4,808,502 Noncurrent assets:
Capital assets:Buildings 26,091,668 26,090,453 Improvements other than buildings 555,845 555,845 Equipment 1,582,120 1,502,010 Construction work in progress 778,467 - Less: accumulated depreciation and amortization (12,987,844) (12,073,209)
Total noncurrent assets 16,020,256 16,075,099 Total assets 20,335,634 20,883,601
LiabilitiesCurrent liabilities:
Accounts payable 197,919 142,510 Accrued liabilities 79,481 105,586 Unearned revenue 75,398 189,208 Compensated absences payable 159,568 143,499
Total current liabilities 512,366 580,803 Noncurrent liabilities:
Compensated absences payable 10,838 - Total noncurrent liabilities 10,838 - Total liabilities 523,204 580,803
Net positionNet investment in capital assets 16,020,256 16,075,099 Unrestricted 3,792,174 4,227,699
Total net position $ 19,812,430 $ 20,302,798
Convention Services Fund
See accompanying independent auditor's report.
City of Waco, TexasComparative Statement of Net Position
Nonmajor Enterprise Funds September 30, 2020 and 2019
220
DRAFT

2020 2019Operating revenues:
Charges for services $ 550,624 $ 1,077,997 Net merchandise sales 220,721 480,479 Contributions 40,423 206,466 Other 41,731 30,899
Total operating revenues 853,499 1,795,841
Operating expenses:Salaries and wages 1,025,242 1,261,020 Employee benefits 389,264 494,637 Purchased professional/technical services 258,871 644,415 Purchased property services 34,385 41,297 Maintenance 208,227 232,109 Other purchased services 898,604 1,560,389 Supplies 312,263 426,777 Other 338,859 116,903 Depreciation/amortization 914,634 907,029
Total operating expenses 4,380,349 5,684,576 Operating income (loss) (3,526,850) (3,888,735)
Nonoperating revenues (expenses):Investment earnings 46,571 84,558 Hotel/motel tax 3,138,696 4,617,066
Total nonoperating revenues (expenses) 3,185,267 4,701,624 Income (loss) before contributions and transfers (341,583) 812,889
Capital contributions 1,215 486,861 Transfers out (150,000) (680,000)
Change in net position (490,368) 619,750 Total net position, beginning of year 20,302,798 19,683,048
Total net position, end of year $ 19,812,430 $ 20,302,798
Convention Services Fund
See accompanying independent auditor's report.
City of Waco, TexasComparative Statement of Revenues, Expenditures, and Changes in Net Position
Nonmajor Enterprise FundsYears Ended September 30, 2020 and 2019
221
DRAFT

2020 2019Cash flows from operating activities:
Cash received from customers $ 844,238 $ 1,680,694 Cash paid to suppliers for goods and services (1,995,294) (3,035,842)Cash paid to employees for services (1,414,317) (1,777,598)
Net cash provided by (used for) operating activities (2,565,373) (3,132,746)
Cash flows from noncapital financing activities:Hotel/motel tax 3,251,265 4,602,035 Transfers to other funds (150,000) (680,000)
Net cash provided by (used for) noncapital financing activities 3,101,265 3,922,035
Cash flows from capital and related financing activities:Acquisition of capital assets (858,578) (454,589)
Net cash provided by (used for) capital and related financing activities (858,578) (454,589)
Cash flows from investing activities:Investment earnings 46,571 84,558
Net cash provided by investing activities 46,571 84,558 Net increase (decrease) in cash and cash equivalents (276,115) 419,258
Cash and cash equivalents, beginning of year 4,259,898 3,840,640
Cash and cash equivalents, end of year $ 3,983,783 $ 4,259,898
Reconciliation of operating income (loss) to net cash provided by (used for) operating activities:
Operating income (loss) $ (3,526,850) $ (3,888,735)Adjustments to reconcile operating income (loss) to net cash provided (used) by operating activities:
Depreciation/amortization 914,634 907,029 Changes in assets and liabilities:
Decrease (increase) in assets:Accounts receivable 104,548 (51,467)Inventory (108) (2,415)
Increase (decrease) in liabilities:Accounts payable 55,409 (11,975)Accrued liabilities (26,105) 15,705 Unearned revenue (113,810) (63,680)Compensated absences payable 26,908 (37,208)
Net cash provided by (used for) operating activities $ (2,565,374) $ (3,132,746)
Noncash capital and related financing activities:Contributions of capital assets $ 1,215 $ 486,861
Convention Services Fund
See accompanying independent auditor's report.
City of Waco, TexasComparative Statement of Cash Flows
Nonmajor Enterprise FundsYears Ended September 30, 2020 and 2019
222
DRAFT

223
Ranger Hall of Fame Fund
DRAFT

2020 2019AssetsCurrent assets:
Cash and investments $ 1,107,375 $ 1,298,760 Inventory 90,672 94,745
Total current assets 1,198,047 1,393,505 Noncurrent assets:
Restricted cash and investments 122,413 107,851 Capital assets:
Buildings 3,720,747 3,720,747 Improvements other than buildings 418,768 418,768 Equipment 452,159 452,159 Museum collections 2,274,424 2,264,424 Less: accumulated depreciation and amortization (1,978,017) (1,819,669)
Total noncurrent assets 5,010,494 5,144,280 Total assets 6,208,541 6,537,785
LiabilitiesCurrent liabilities:
Accounts payable 4,696 8,041 Accrued liabilities 50,359 44,901 Compensated absences payable 86,332 96,892
Total current liabilities 141,387 149,834 Noncurrent liabilities:
Compensated absences payable 117,705 42,311 Total noncurrent liabilities 117,705 42,311 Total liabilities 259,092 192,145
Net positionNet investment in capital assets 4,888,081 5,036,429 Restricted for:
Capital projects 241,493 228,166 Unrestricted 819,875 1,081,045
Total net position $ 5,949,449 $ 6,345,640
See accompanying independent auditor's report.
Ranger Hall of Fame Fund
City of Waco, TexasComparative Statement of Net Position
Nonmajor Enterprise Funds September 30, 2020 and 2019
224
DRAFT

2020 2019Operating revenues:
Charges for services $ 261,474 $ 547,886 Net merchandise sales 108,016 197,069 Other income 12,031 7,318
Total operating revenues 381,521 752,273
Operating expenses:Salaries and wages 685,043 645,207 Employee benefits 254,468 244,090 Purchased professional/technical services 58,090 40,583 Purchased property services 8,389 8,986 Maintenance 9,290 8,859 Other purchased services 35,582 49,258 Supplies 58,134 78,820 Other 250,079 166,763 Depreciation/amortization 158,348 162,103
Total operating expenses 1,517,423 1,404,669 Operating income (loss) (1,135,902) (652,396)
Nonoperating revenues (expenses):Investment earnings 14,124 29,893 Contributions 26,800 21,175
Total nonoperating revenues (expenses) 40,924 51,068 Income (loss) before contributions and transfers (1,094,978) (601,328)
Capital contributions 10,000 40,000 Transfers in 688,787 688,787
Change in net position (396,191) 127,459 Total net position, beginning of year 6,345,640 6,218,181
Total net position, end of year $ 5,949,449 $ 6,345,640
Ranger Hall of Fame Fund
See accompanying independent auditor's report.
City of Waco, TexasComparative Statement of Revenues, Expenditures, and Changes in Net Position
Nonmajor Enterprise FundsYears Ended September 30, 2020 and 2019
225
DRAFT
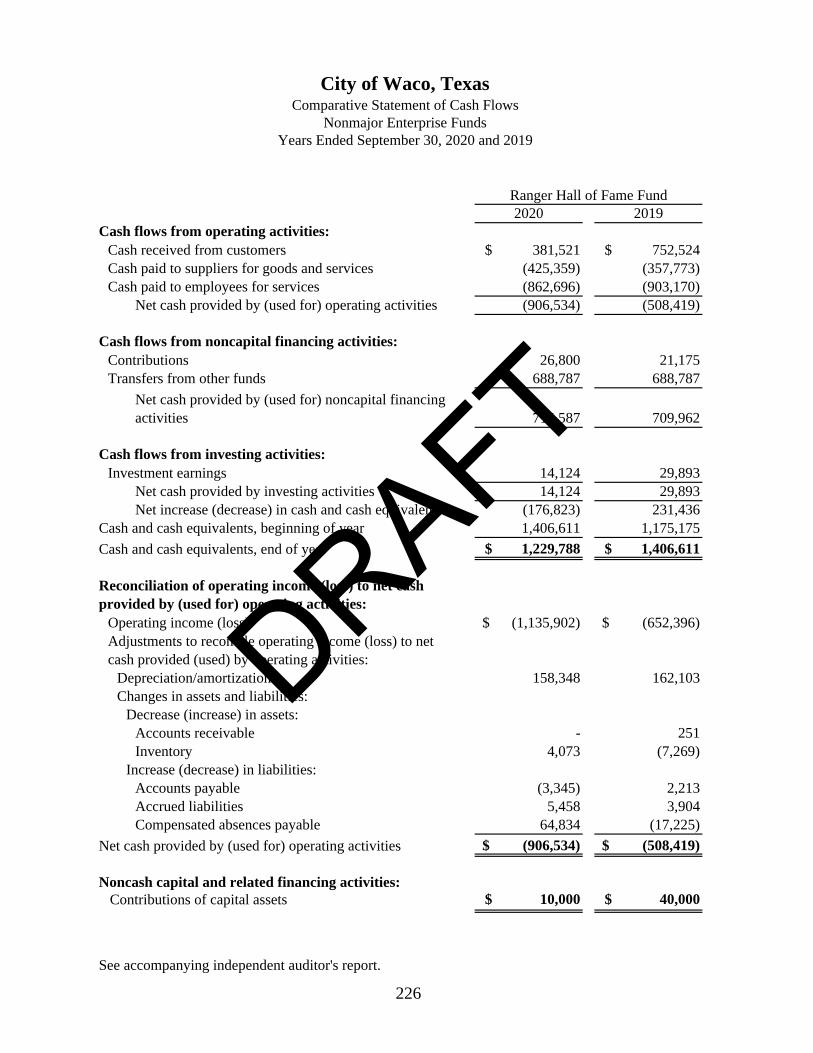
2020 2019Cash flows from operating activities:
Cash received from customers $ 381,521 $ 752,524 Cash paid to suppliers for goods and services (425,359) (357,773)Cash paid to employees for services (862,696) (903,170)
Net cash provided by (used for) operating activities (906,534) (508,419)
Cash flows from noncapital financing activities:Contributions 26,800 21,175 Transfers from other funds 688,787 688,787
Net cash provided by (used for) noncapital financing activities 715,587 709,962
Cash flows from investing activities:Investment earnings 14,124 29,893
Net cash provided by investing activities 14,124 29,893 Net increase (decrease) in cash and cash equivalents (176,823) 231,436
Cash and cash equivalents, beginning of year 1,406,611 1,175,175
Cash and cash equivalents, end of year $ 1,229,788 $ 1,406,611
Reconciliation of operating income (loss) to net cash provided by (used for) operating activities:
Operating income (loss) $ (1,135,902) $ (652,396)Adjustments to reconcile operating income (loss) to net cash provided (used) by operating activities:
Depreciation/amortization 158,348 162,103 Changes in assets and liabilities:
Decrease (increase) in assets:Accounts receivable - 251 Inventory 4,073 (7,269)
Increase (decrease) in liabilities:Accounts payable (3,345) 2,213 Accrued liabilities 5,458 3,904 Compensated absences payable 64,834 (17,225)
Net cash provided by (used for) operating activities $ (906,534) $ (508,419)
Noncash capital and related financing activities: Contributions of capital assets $ 10,000 $ 40,000
Ranger Hall of Fame Fund
See accompanying independent auditor's report.
City of Waco, TexasComparative Statement of Cash Flows
Nonmajor Enterprise FundsYears Ended September 30, 2020 and 2019
226
DRAFT

227
Cameron Park Zoo Fund
DRAFT

2020 2019AssetsCurrent assets:
Cash and investments $ 1,427,572 $ 1,550,200 Inventory 100,203 6,882
Total current assets 1,527,775 1,557,082 Noncurrent assets:
Capital assets:Buildings 9,421,759 9,390,421 Improvements other than buildings 19,080,351 19,050,351 Equipment 679,529 511,664 Construction work in progress 25,926 25,926 Less: accumulated depreciation and amortization (21,164,206) (20,103,370)
Total noncurrent assets 8,043,359 8,874,992 Total assets 9,571,134 10,432,074
LiabilitiesCurrent liabilities:
Accounts payable 71,621 38,833 Accrued liabilities 161,206 310,686 Unearned revenue 53,589 53,914 Compensated absences payable 229,163 197,808
Total current liabilities 515,579 601,241 Noncurrent liabilities:
Compensated absences payable 172,544 123,741 Total noncurrent liabilities 172,544 123,741 Total liabilities 688,123 724,982
Net positionNet investment in capital assets 8,043,359 8,874,992 Unrestricted 839,652 832,100
Total net position $ 8,883,011 $ 9,707,092
See accompanying independent auditor's report.
Cameron Park Zoo Fund
City of Waco, TexasComparative Statement of Net Position
Nonmajor Enterprise Funds September 30, 2020 and 2019
228
DRAFT

2020 2019Operating revenues:
Charges for services $ 1,392,809 $ 1,816,095 Net merchandise sales 306,615 218,926 Contributions - 46,121 Other income 11,977 4,179
Total operating revenues 1,711,401 2,085,321
Operating expenses:Salaries and wages 1,968,543 1,641,658 Employee benefits 888,194 748,656 Purchased professional/technical services 161,702 112,676 Purchased property services 649,008 643,878 Maintenance 98,915 70,770 Other purchased services 118,709 128,960 Supplies 850,767 802,433 Other 207,140 180,274 Depreciation/amortization 1,060,836 1,028,267
Total operating expenses 6,003,814 5,357,572 Operating income (loss) (4,292,413) (3,272,251)
Nonoperating revenues (expenses):Investment earnings 10,224 21,039
Total nonoperating revenues (expenses) 10,224 21,039 Income (loss) before contributions and transfers (4,282,189) (3,251,212)
Capital contributions 61,338 415,707 Transfers in 3,396,770 2,758,019
Change in net position (824,081) (77,486)Total net position, beginning of year 9,707,092 9,784,578
Total net position, end of year $ 8,883,011 $ 9,707,092
Cameron Park Zoo Fund
See accompanying independent auditor's report.
City of Waco, TexasComparative Statement of Revenues, Expenditures, and Changes in Net Position
Nonmajor Enterprise FundsYears Ended September 30, 2020 and 2019
229
DRAFT

2020 2019Cash flows from operating activities:
Cash received from customers $ 1,711,401 $ 2,090,055 Cash paid to suppliers for goods and services (2,332,797) (1,700,990)Cash paid to employees for services (2,740,361) (2,406,853)
Net cash provided by (used for) operating activities (3,361,757) (2,017,788)
Cash flows from noncapital financing activities:Transfers from other funds 3,396,770 2,758,019
Net cash provided by (used for) noncapital financing activities 3,396,770 2,758,019
Cash flows from capital and related financing activities:Acquisition of capital assets (167,865) -
Net cash provided by (used for) capital and related financing activities (167,865) -
Cash flows from investing activities:Investment earnings 10,224 21,039
Net cash provided by investing activities 10,224 21,039 Net increase (decrease) in cash and cash equivalents (122,628) 761,270
Cash and cash equivalents, beginning of year 1,550,200 788,930 Cash and cash equivalents, end of year $ 1,427,572 $ 1,550,200
Reconciliation of operating income (loss) to net cash provided by (used for) operating activities:
Operating income (loss) $ (4,292,413) $ (3,272,251)Adjustments to reconcile operating income (loss) to net cash provided (used) by operating activities:
Depreciation/amortization 1,060,836 1,028,267 Changes in assets and liabilities:
Decrease (increase) in assets:Accounts receivable - 4,734 Inventory (93,321) 935
Increase (decrease) in liabilities:Accounts payable 32,788 (8,031)Accrued liabilities (149,480) 215,362 Unearned revenues (325) 53,914 Compensated absences payable 80,158 (40,718)
Net cash provided by (used for) operating activities $ (3,361,757) $ (2,017,788)
Noncash capital and related financing activities:Contributions of capital assets $ 61,338 $ 415,707
Cameron Park Zoo Fund
See accompanying independent auditor's report.
City of Waco, TexasComparative Statement of Cash Flows
Nonmajor Enterprise FundsYears Ended September 30, 2020 and 2019
230
DRAFT

231
Transit Services Fund
DRAFT

2020 2019AssetsCurrent assets:
Accounts receivable, net of allowance $ 223,719 $ 218,341 Intergovernmental receivable 2,725,303 2,870,960 Inventory 531,934 571,697
Total current assets 3,480,956 3,660,998 Noncurrent assets:
Capital assets:Land 423,284 423,284 Buildings 6,919,608 6,919,608 Improvements other than buildings 244,951 244,951 Equipment 13,664,682 12,419,339 Less: accumulated depreciation and amortization (14,291,526) (13,643,259)
Total noncurrent assets 6,960,999 6,363,923 Total assets 10,441,955 10,024,921
LiabilitiesCurrent liabilities:
Accounts payable 44,371 69,697 Accrued liabilities 232,004 196,653 Unearned revenue 41,250 41,250 Due to other funds 1,214,023 2,486,047
Total current liabilities 1,531,648 2,793,647 Total liabilities 1,531,648 2,793,647
Net positionNet investment in capital assets 6,960,999 6,363,923 Restricted for:
Capital projects 433,222 551,264 Unrestricted 1,516,086 316,087
Total net position $ 8,910,307 $ 7,231,274
See accompanying independent auditor's report.
Transit Services Fund
City of Waco, TexasComparative Statement of Net Position
Nonmajor Enterprise Funds September 30, 2020 and 2019
232
DRAFT

2020 2019Operating revenues:
Charges for services $ 1,061,224 $ 1,455,631 Other 1,444,399 1,651,415
Total operating revenues 2,505,623 3,107,046
Operating expenses:Salaries and wages 3,382,831 3,573,439 Employee benefits 830,606 866,189 Purchased professional/technical services 504,271 480,203 Purchased property services 22,040 25,384 Maintenance 544,874 687,256 Other purchased services 502,669 458,195 Supplies 627,837 882,624 Other 612,006 521,869 Depreciation/amortization 727,572 739,824
Total operating expenses 7,754,706 8,234,983 Operating income (loss) (5,249,083) (5,127,937)
Nonoperating revenues (expenses):Other income 42,236 16,948 Intergovernmental revenue 4,463,154 3,905,704
Total nonoperating revenues (expenses) 4,505,390 3,922,652 Income (loss) before contributions and transfers (743,693) (1,205,285)
Capital contributions 1,164,371 512,106 Transfers in 1,258,355 482,408
Change in net position 1,679,033 (210,771)Total net position, beginning of year 7,231,274 7,442,045
Total net position, end of year $ 8,910,307 $ 7,231,274
See accompanying independent auditor's report.
Transit Services Fund
City of Waco, TexasComparative Statement of Revenues, Expenditures, and Changes in Net Position
Nonmajor Enterprise FundsYears Ended September 30, 2020 and 2019
233
DRAFT

2020 2019Cash flows from operating activities:
Cash received from customers $ 2,500,245 $ 3,160,670 Cash paid to suppliers for goods and services (2,796,053) (3,031,126)Cash paid to employees for services (4,181,293) (4,442,678)
Net cash provided by (used for) operating activities (4,477,101) (4,313,134)
Cash flows from noncapital financing activities:Intergovernmental revenue 3,444,440 3,043,777 Transfers from other funds 1,258,355 482,408 Transfers to other funds (1,272,024) 257,895
Net cash provided by (used for) noncapital financing activities 3,430,771 3,784,080
Cash flows from capital and related financing activities:Acquisitions of capital assets (160,277) - Capital contributions 1,164,371 512,106 Proceeds from insurance recoveries 42,236 16,948
Net cash provided by (used for) capital and related financing activities 1,046,330 529,054 Net increase (decrease) in cash and cash equivalents - -
Cash and cash equivalents, beginning of year - - Cash and cash equivalents, end of year $ - $ -
Reconciliation of operating income (loss) to net cash provided by (used for) operating activities:
Operating income (loss) $ (5,249,083) $ (5,127,937)Adjustments to reconcile operating income (loss) to net cash provided (used) by operating activities:
Depreciation/amortization 727,572 739,824 Changes in assets and liabilities:
Decrease (increase) in assets:Accounts receivable (5,378) 39,874 Inventory 39,763 52,780
Increase (decrease) in liabilities:Accounts payable (25,326) (19,362)Accrued liabilities 35,351 (12,063)Unearned revenue - 13,750
Net cash provided by (used for) operating activities $ (4,477,101) $ (4,313,134)
Transit Services Fund
See accompanying independent auditor's report.
City of Waco, TexasComparative Statement of Cash Flows
Nonmajor Enterprise FundsYears Ended September 30, 2020 and 2019
234
DRAFT

235
Cottonwood Creek Golf Course Fund
DRAFT

2020 2019AssetsCurrent assets:
Cash and investments $ 999,083 $ 552,027 Inventory 241,857 270,692
Total current assets 1,240,940 822,719 Noncurrent assets:
Capital assets:Buildings 713,389 713,389 Improvements other than buildings 2,017,246 2,017,246 Equipment 1,340,725 1,281,493 Less: accumulated depreciation and amortization (3,290,468) (3,181,260)
Total noncurrent assets 780,892 830,868 Total assets 2,021,832 1,653,587
LiabilitiesCurrent liabilities:
Accounts payable 41,303 62,398 Accrued liabilities 651,742 654,766 Compensated absences payable 59,596 83,145
Total current liabilities 752,641 800,309 Noncurrent liabilities:
Advances from other funds 693,704 693,704 Compensated absences payable 120,449 78,444
Total noncurrent liabilities 814,153 772,148 Total liabilities 1,566,794 1,572,457
Net positionNet investment in capital assets 780,892 830,868 Unrestricted (325,854) (749,738)
Total net position $ 455,038 $ 81,130
See accompanying independent auditor's report.
Cottonwood Creek Golf Course Fund
City of Waco, TexasComparative Statement of Net Position
Nonmajor Enterprise Funds September 30, 2020 and 2019
236
DRAFT

2020 2019Operating revenues:
Charges for services $ 1,354,570 $ 1,490,841 Net merchandise sales 218,333 256,587 Other 17,118 15,456
Total operating revenues 1,590,021 1,762,884
Operating expenses:Salaries and wages 515,977 505,690 Employee benefits 208,390 208,512 Purchased professional/technical services 433,397 467,235 Purchased property services 61,823 275,341 Maintenance 102,980 108,850 Other purchased services 141,861 127,990 Supplies 225,342 215,822 Other 43,457 22,742 Depreciation/amortization 170,544 162,150
Total operating expenses 1,903,771 2,094,332 Operating income (loss) (313,750) (331,448)
Nonoperating revenues (expenses):Investment earnings 9,354 8,020
Total nonoperating revenues (expenses) 9,354 8,020 Income (loss) before contributions and transfers (304,396) (323,428)
Transfers in 678,304 428,304 Change in net position 373,908 104,876
Total net position, beginning of year 81,130 (23,746)Total net position, end of year $ 455,038 $ 81,130
See accompanying independent auditor's report.
Cottonwood Creek Golf Course Fund
City of Waco, TexasComparative Statement of Revenues, Expenditures, and Changes in Net Position
Nonmajor Enterprise FundsYears Ended September 30, 2020 and 2019
237
DRAFT

2020 2019Cash flows from operating activities:
Cash received from customers $ 1,590,021 $ 1,762,884 Cash paid to suppliers for goods and services (1,005,194) (1,183,832)Cash paid to employees for services (704,860) (731,236)
Net cash provided by (used for) operating activities (120,033) (152,184)
Cash flows from noncapital financing activities:Transfers from other funds 678,304 428,304
Net cash provided by (used for) noncapital financing activities 678,304 428,304
Cash flows from capital and related financing activities:Acquisition of capital assets (120,569) (83,676)
Net cash provided by (used for) capital and related financing activities (120,569) (83,676)
Cash flows from investing activities:Investment earnings 9,354 8,020
Net cash provided by investing activities 9,354 8,020 Net increase (decrease) in cash and cash equivalents 447,056 200,464
Cash and cash equivalents, beginning of year 552,027 351,563
Cash and cash equivalents, end of year $ 999,083 $ 552,027
Reconciliation of operating income (loss) to net cash provided by (used for) operating activities:
Operating income (loss) $ (313,750) $ (331,448)Adjustments to reconcile operating income (loss) to net cash provided by (used for) operating activities:
Depreciation/amortization 170,544 162,150 Changes in assets and liabilities:
Decrease (increase) in assets:Inventory 28,835 (41,747)
Increase (decrease) in liabilities:Accounts payable (21,095) 16,943 Accrued liabilities (3,023) 64,909 Compensated absences payable 18,456 (22,991)
Net cash provided by (used for) operating activities $ (120,033) $ (152,184)
Cottonwood Creek Golf Course Fund
See accompanying independent auditor's report.
City of Waco, TexasComparative Statement of Cash Flows
Nonmajor Enterprise FundsYears Ended September 30, 2020 and 2019
238
DRAFT

239
Internal Service Funds
Internal Service Funds are used to account for the financing of goods and services provided by one department or agency to other departments or agencies of the City and to other government units on a cost reimbursement basis.
Insurance Fund - This fund is used to account for insurance and risk management activities of the City, other than health insurance. Health Insurance Fund - This fund is used to account for health insurance activities of the City. Engineering Fund - This fund is used to account for engineering services to other City departments. Fleet Services Fund - This fund is used to account for the repair and maintenance of motor vehicles for other City departments.
DRAFT

2020 2019AssetsCurrent assets:
Cash and investments $10,038,604 $ 5,385,885 $ 2,069,607 $ 587,268 $ 18,081,364 $ 15,486,217 Due from other funds - 754,352 - - 754,352 623,514 Inventories - - - 200,886 200,886 213,997
Total current assets 10,038,604 6,140,237 2,069,607 788,154 19,036,602 16,323,728
Noncurrent assets:Capital assets:
Land - - 24,400 14,400 38,800 38,800 Buildings - - - 920,153 920,153 920,153 Improvements other than buildings - - - 118,289 118,289 118,289 Equipment 26,659 - 694,379 1,051,418 1,772,456 1,588,748 Less: accumulated depreciation (25,317) - (339,191) (1,630,072) (1,994,580) (1,838,212)
Total capital assets 1,342 - 379,588 474,188 855,118 827,778
Total noncurrent assets 1,342 - 379,588 474,188 855,118 827,778
Total assets 10,039,946 6,140,237 2,449,195 1,262,342 19,891,720 17,151,506
LiabilitiesCurrent liabilities:
Accounts payable 51,475 3,586 31,906 43,309 130,276 255,168 Accrued liabilities 93,160 139,626 131,626 70,207 434,619 597,886 Compensated absences payable 18,864 - 161,193 85,027 265,084 255,018 Escrow funds - - 538 - 538 538 Claims and judgments payable 2,352,131 962,000 - - 3,314,131 3,055,714
Total current liabilities 2,515,630 1,105,212 325,263 198,543 4,144,648 4,164,324
Noncurrent liabilities:Compensated absences payable 29,778 - 58,609 - 88,387 17,317
Total noncurrent liabilities 29,778 - 58,609 - 88,387 17,317 Total liabilities 2,545,408 1,105,212 383,872 198,543 4,233,035 4,181,641
Net positionNet investment in capital assets 1,342 - 379,588 474,188 855,118 827,778 Unrestricted 7,493,196 5,035,025 1,685,735 589,611 14,803,567 12,142,087
Total net position $ 7,494,538 $ 5,035,025 $ 2,065,323 $ 1,063,799 $ 15,658,685 $ 12,969,865
Health Insurance
FundInsurance
Fund
See accompanying independent auditor's report.
City of Waco, TexasCombining Statement of Net Position
September 30, 2020(With Comparative Totals for September 30, 2019)
Totals
Internal Service Funds
Fleet Services Fund
Engineering Fund
240
DRAFT

2020 2019Operating revenues:
Charges for services $ 4,309,863 $ 14,606,615 $ 3,481,328 $ 2,244,300 $ 24,642,106 $ 24,099,231 Other - - 79,140 3,420 82,560 13,957
Total operating revenues 4,309,863 14,606,615 3,560,468 2,247,720 24,724,666 24,113,188
Operating expenses:Salaries and wages 126,823 68,569 1,822,310 965,999 2,983,701 2,891,544 Employee benefits 45,032 22,831 631,901 423,442 1,123,206 1,059,234 Purchased professional/technical services 427,654 812,803 397,659 10,787 1,648,903 2,113,634 Purchased property services - 900 53,186 6,321 60,407 62,352 Maintenance 37,591 - 100,830 37,227 175,648 156,446 Other purchased services 1,250,327 1,012 50,682 32,100 1,334,121 1,314,793 Supplies 4,961 16,551 111,658 51,667 184,837 149,841 Other 1,518,541 12,212,923 488,910 353,312 14,573,686 14,887,872 Depreciation expense 2,684 - 70,530 83,154 156,368 135,667
Total operating expenses 3,413,613 13,135,589 3,727,666 1,964,009 22,240,877 22,771,383
Operating income (loss) 896,250 1,471,026 (167,198) 283,711 2,483,789 1,341,805
Nonoperating revenues (expenses):Investment earnings 93,200 47,486 21,921 1,430 164,037 329,524
Total nonoperating revenues (expenses) 93,200 47,486 21,921 1,430 164,037 329,524
Income (loss) before contributions and transfers 989,450 1,518,512 (145,277) 285,141 2,647,826 1,671,329
Capital contributions - - 40,994 - 40,994 34,344 Transfers in - - - - - 415,000
Net change in net position 989,450 1,518,512 (104,283) 285,141 2,688,820 2,120,673
Total net position, beginning of year 6,505,088 3,516,513 2,169,606 778,658 12,969,865 10,849,192 Total net position, end of year $ 7,494,538 $ 5,035,025 $ 2,065,323 $ 1,063,799 $ 15,658,685 $ 12,969,865
Health Insurance
FundInsurance
Fund
See accompanying independent auditor's report.
City of Waco, TexasCombining Statement of Revenues, Expenditures, and Changes in Net Position
Internal Service FundsFor the Year Ended September 30, 2020
(With Comparative Totals for Year Ended September 30, 2019)
TotalsFleet
Services Fund
Engineering Fund
241
DRAFT

2020 2019Cash flows from operating activities:
Cash received from customers $ 4,309,863 $ 14,606,615 $ 3,560,468 $ 2,247,720 $ 24,724,666 $ 24,113,660 Cash paid to suppliers for goods and services (3,162,531) (13,180,015) (1,208,571) (443,116) (17,994,233) (18,528,228)Cash paid to employees for services (162,925) (91,400) (2,409,928) (1,361,518) (4,025,771) (3,993,416)
Net cash provided by (used for) operating activities 984,407 1,335,200 (58,031) 443,086 2,704,662 1,592,016
Cash flows from noncapital financing activities:Transfers from other funds - - - - - 415,000 Transfers to other funds - (130,838) - - (130,838) (68,099)
Net cash provided by (used for) noncapital financing activities - (130,838) - - (130,838) 346,901
Cash flows from capital and related financing activities:
Acquisition of capital assets - - (142,714) - (142,714) (157,993)Net cash provided by (used for) capital and related financing activities - - (142,714) - (142,714) (157,993)
Cash flows from investing activities:Investment earnings 93,200 47,486 21,921 1,430 164,037 329,524
Net cash provided by (used for) investing activities 93,200 47,486 21,921 1,430 164,037 329,524
Net increase (decrease) in cash and cash equivalents 1,077,607 1,251,848 (178,824) 444,516 2,595,147 2,110,448 Cash and cash equivalents, beginning of year 8,960,997 4,134,037 2,248,431 142,752 15,486,217 13,375,769 Cash and cash equivalents, end of year $10,038,604 $ 5,385,885 $ 2,069,607 $ 587,268 $ 18,081,364 $ 15,486,217
Reconciliation of operating income (loss) to net cash provided by (used for) operating activities:Operating income (loss) $ 896,250 $ 1,471,026 $ (167,198) $ 283,711 $ 2,483,789 $ 1,341,805 Adjustments to reconcile operating income (loss) to net cash provided by (used for) operating activities:
Depreciation 2,684 - 70,530 83,154 156,368 135,667 Changes in assets and liabilities:
(Increase) decrease in assets:Accounts receivable - - - - - 472 Inventories - - - 13,111 13,111 1,550 Increase (decrease) in liabilities:Accounts payable (135,630) (283) (9,701) 20,722 (124,892) 52,398 Accrued liabilities (67,244) (114,543) 4,055 14,465 (163,267) 14,073 Compensated absences payable 8,930 - 44,283 27,923 81,136 (42,638)Estimated claims and judgements 279,417 (21,000) - - 258,417 88,689
Net cash provided by (used for) operating activities $ 984,407 $ 1,335,200 $ (58,031) $ 443,086 $ 2,704,662 $ 1,592,016
Noncash investing, capital and financing activities:Contributions of capital assets $ - $ - $ 40,994 $ - $ 40,994 $ 34,344
Health Insurance Fund
Insurance Fund
See accompanying independent auditor's report.
City of Waco, TexasCombining Statement of Cash Flows
Internal Service FundsFor the Year Ended September 30, 2020
Totals
(With Comparative Totals for Year Ended September 30, 2019)
Fleet Services
FundEngineering
Fund
242
DRAFT

243
Insurance Fund
DRAFT
2020 2019AssetsCurrent assets:
Cash and investments $ 10,038,604 $ 8,960,997 Total current assets 10,038,604 8,960,997
Noncurrent assets:Capital assets:
Equipment 26,659 26,659 Less: accumulated depreciation and amortization (25,317) (22,633)
1,342 4,026
Total noncurrent assets 1,342 4,026
Total assets 10,039,946 8,965,023
LiabilitiesCurrent liabilities:
Accounts payable 51,475 187,105 Accrued liabilities 93,160 160,404 Compensated absences payable 18,864 22,395 Claims and judgments payable 2,352,131 2,072,714
Total current liabilities 2,515,630 2,442,618
Noncurrent liabilities:Compensated absences payable 29,778 17,317
Total noncurrent liabilities 29,778 17,317
Total liabilities 2,545,408 2,459,935
Net positionNet investment in capital assets 1,342 4,026 Unrestricted 7,493,196 6,501,062
Total net position $ 7,494,538 $ 6,505,088
Insurance Fund
See accompanying independent auditor's report.
City of Waco, TexasInternal Service Funds
Comparative Statement of Net Position September 30, 2020 and 2019
244
DRAFT

2020 2019Operating revenues:
Charges for services $ 4,309,863 $ 4,126,923 Total operating revenues 4,309,863 4,126,923
Operating expenses:Salaries and wages 126,823 178,445 Employee benefits 45,032 63,718 Purchased professional/technical services 427,654 1,008,514 Maintenance 37,591 409 Other purchased services 1,250,327 1,206,658 Supplies 4,961 3,012 Other 1,518,541 1,260,629 Depreciation/amortization 2,684 2,685
Total operating expenses 3,413,613 3,724,070 Operating income (loss) 896,250 402,853
Nonoperating revenues (expenses):Investment earnings 93,200 203,550
Total nonoperating revenues (expenses) 93,200 203,550
Change in net position 989,450 606,403
Total net position, beginning of year 6,505,088 5,898,685 Total net position, end of year $ 7,494,538 $ 6,505,088
Insurance Fund
See accompanying independent auditor's report.
City of Waco, TexasInternal Service Funds
Comparative Statement of Revenues, Expenditures, and Changes in Net PositionFor the Years Ended September 30, 2020 and 2019
245
DRAFT

2020 2019Cash flows from operating activities:
Cash received from customers $ 4,309,863 $ 4,127,395 Cash paid to suppliers for goods and services (3,162,531) (3,247,721)Cash paid to employees for services (162,925) (233,523)
Net cash provided by (used for) operating activities 984,407 646,151
Cash flows from investing activities:Investment earnings 93,200 203,550
Net cash provided by (used for) investing activities 93,200 203,550 Net increase (decrease) in cash and cash equivalents 1,077,607 849,701 Cash and cash equivalents, beginning of year 8,960,997 8,111,296 Cash and cash equivalents, end of year $ 10,038,604 $ 8,960,997
Reconciliation of operating income (loss) to net cash provided by (used for) operating activities:
Operating income (loss) $ 896,250 $ 402,853 Adjustment to reconcile operating income (loss) to net cash provided by (used for) operating activities:
Depreciation 2,684 2,685 Changes in assets and liabilities:(Increase) decrease in assets:
Accounts receivable - 472 Increase (decrease) in liabilities:
Accounts payable (135,630) 128,354 Accrued liabilities (67,244) 14,458 Compensated absences payable 8,930 8,640 Estimated claims and judgements 279,417 88,689
Net cash provided by (used for) operating activities $ 984,407 $ 646,151
See accompanying independent auditor's report.
City of Waco, TexasInternal Service Funds
Comparative Statement of Cash FlowsFor the Years Ended September 30, 2020 and 2019
Insurance Fund
246
DRAFT

247
Health Insurance Fund
DRAFT
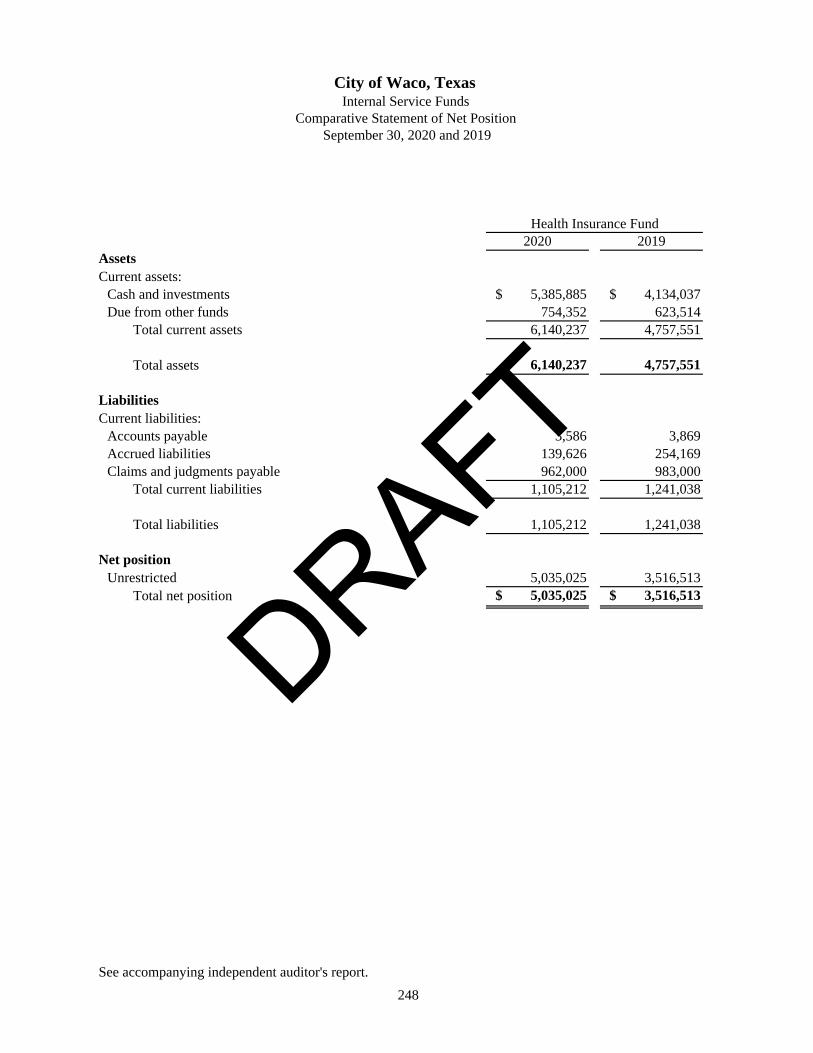
2020 2019AssetsCurrent assets:
Cash and investments $ 5,385,885 $ 4,134,037 Due from other funds 754,352 623,514
Total current assets 6,140,237 4,757,551
Total assets 6,140,237 4,757,551
LiabilitiesCurrent liabilities:
Accounts payable 3,586 3,869 Accrued liabilities 139,626 254,169 Claims and judgments payable 962,000 983,000
Total current liabilities 1,105,212 1,241,038
Total liabilities 1,105,212 1,241,038
Net positionUnrestricted 5,035,025 3,516,513
Total net position $ 5,035,025 $ 3,516,513
Health Insurance Fund
See accompanying independent auditor's report.
City of Waco, TexasInternal Service Funds
Comparative Statement of Net Position September 30, 2020 and 2019
248
DRAFT

2020 2019Operating revenues:
Charges for services $ 14,606,615 $ 14,657,213 Total operating revenues 14,606,615 14,657,213
Operating expenses:Salaries and wages 68,569 66,290 Employee benefits 22,831 22,297 Purchased professional/technical services 812,803 965,821 Purchased property services 900 3,292 Other purchased services 1,012 2,828 Supplies 16,551 29,937 Other 12,212,923 12,737,996
Total operating expenses 13,135,589 13,828,461 Operating income (loss) 1,471,026 828,752
Nonoperating revenues (expenses):Investment earnings 47,486 82,366
Total nonoperating revenues (expenses) 47,486 82,366
Change in net position 1,518,512 911,118
Total net position, beginning of year 3,516,513 2,605,395 Total net position, end of year $ 5,035,025 $ 3,516,513
Health Insurance Fund
See accompanying independent auditor's report.
City of Waco, TexasInternal Service Funds
Comparative Statement of Revenues, Expenditures, and Changes in Net PositionFor the Years Ended September 30, 2020 and 2019
249
DRAFT

2020 2019Cash flows from operating activities:
Cash received from customers $ 14,606,615 $ 14,657,213 Cash paid to suppliers for goods and services (13,180,015) (13,783,596)Cash paid to employees for services (91,400) (88,587)
Net cash provided by (used for) operating activities 1,335,200 785,030
Cash flows from noncapital financing activities:Transfers to other funds (130,838) (68,099)
Net cash provided by (used for) noncapital financing activities (130,838) (68,099)
Cash flows from investing activities:Investment earnings 47,486 82,366
Net cash provided by (used for) investing activities 47,486 82,366 Net increase (decrease) in cash and cash equivalents 1,251,848 799,297 Cash and cash equivalents, beginning of year 4,134,037 3,334,740 Cash and cash equivalents, end of year $ 5,385,885 $ 4,134,037
Reconciliation of operating income (loss) to net cash provided by (used for) operating activities:
Operating income (loss) $ 1,471,026 $ 828,752 Adjustment to reconcile operating income (loss) to net cash provided by (used for) operating activities:
Increase (decrease) in liabilities:Accounts payable (283) 1,512 Accrued liabilities (114,543) (45,234)Estimated claims and judgements (21,000) -
Net cash provided by (used for) operating activities $ 1,335,200 $ 785,030
See accompanying independent auditor's report.
City of Waco, TexasInternal Service Funds
Comparative Statement of Cash FlowsFor the Years Ended September 30, 2020 and 2019
Health Insurance Fund
250
DRAFT

251
Engineering Fund
DRAFT

2020 2019AssetsCurrent assets:
Cash and investments $ 2,069,607 $ 2,248,431
Total current assets 2,069,607 2,248,431
Noncurrent assets:Capital assets:
Land 24,400 24,400 Equipment 694,379 510,671 Less: accumulated depreciation and amortization (339,191) (268,661)
379,588 266,410
Total noncurrent assets 379,588 266,410
Total assets 2,449,195 2,514,841
LiabilitiesCurrent liabilities:
Accounts payable 31,906 41,607 Accrued liabilities 131,626 127,571 Compensated absences payable 161,193 175,519 Escrow funds 538 538
Total current liabilities 325,263 345,235
Noncurrent liabilities:Compensated absences payable 58,609 -
Total noncurrent liabilities 58,609 -
Total liabilities 383,872 345,235
Net positionNet investment in capital assets 379,588 266,410 Unrestricted 1,685,735 1,903,196
Total net position $ 2,065,323 $ 2,169,606
Engineering Fund
See accompanying independent auditor's report.
City of Waco, TexasInternal Service Funds
Comparative Statement of Net Position September 30, 2020 and 2019
252
DRAFT

2020 2019Operating revenues:
Charges for services $ 3,481,328 $ 3,869,153 Other 79,140 7,447
Total operating revenues 3,560,468 3,876,600
Operating expenses:Salaries and wages 1,822,310 1,717,997 Employee benefits 631,901 581,169 Purchased professional/technical services 397,659 131,700 Purchased property services 53,186 52,611 Maintenance 100,830 102,894 Other purchased services 50,682 73,060 Supplies 111,658 60,530 Other 488,910 594,465 Depreciation/amortization 70,530 56,877
Total operating expenses 3,727,666 3,371,303 Operating income (loss) (167,198) 505,297
Nonoperating revenues (expenses):Investment earnings 21,921 43,236
Total nonoperating revenues (expenses) 21,921 43,236 Income (loss) before contributions and transfers (145,277)
Capital contributions 40,994 -
Change in net position (104,283) 548,533
Total net position, beginning of year 2,169,606 1,621,073 Total net position, end of year $ 2,065,323 $ 2,169,606
Engineering Fund
See accompanying independent auditor's report.
City of Waco, TexasInternal Service Funds
Comparative Statement of Revenues, Expenditures, and Changes in Net PositionFor the Years Ended September 30, 2020 and 2019
253
DRAFT

2020 2019Cash flows from operating activities:
Cash received from customers $ 3,560,468 $ 3,876,600 Cash paid to suppliers for goods and services (1,208,571) (928,459)Cash paid to employees for services (2,409,928) (2,326,484)
Net cash provided by (used for) operating activities (58,031) 621,657
Cash flows from capital and related financing activities:Acquisition of capital assets (142,714) (85,329)
Net cash provided by (used for) capital and related financing activities (142,714) (85,329)
Cash flows from investing activities:Investment earnings 21,921 43,236
Net cash provided by (used for) investing activities 21,921 43,236 Net increase (decrease) in cash and cash equivalents (178,824) 579,564 Cash and cash equivalents, beginning of year 2,248,431 1,668,867 Cash and cash equivalents, end of year $ 2,069,607 $ 2,248,431
Reconciliation of operating income (loss) to net cash provided by (used for) operating activities:
Operating income (loss) $ (167,198) $ 505,297 Adjustment to reconcile operating income (loss) to net cash provided by (used for) operating activities:
Depreciation 70,530 56,877 Increase (decrease) in liabilities:
Accounts payable (9,701) 35,000 Accrued liabilities 4,055 51,801 Compensated absences payable 44,283 (27,318)
Net cash provided by (used for) operating activities $ (58,031) $ 621,657
Noncash investing, capital and financing activities:Contributions of capital assets $ 40,994 $ -
City of Waco, TexasInternal Service Funds
Comparative Statement of Cash FlowsFor the Years Ended September 30, 2020 and 2019
See accompanying independent auditor's report.
Engineering Fund
254
DRAFT

255
Fleet Services Fund
DRAFT

2020 2019AssetsCurrent assets:
Cash and investments $ 587,268 $ 142,752 Inventory 200,886 213,997
Total current assets 788,154 356,749
Noncurrent assets:Capital assets:
Land 14,400 14,400 Buildings 920,153 920,153 Improvements other than buildings 118,289 118,289 Equipment 1,051,418 1,051,418 Less: accumulated depreciation and amortization (1,630,072) (1,546,918)
474,188 557,342
Total noncurrent assets 474,188 557,342
Total assets 1,262,342 914,091
LiabilitiesCurrent liabilities:
Accounts payable 43,309 22,587 Accrued liabilities 70,207 55,742 Compensated absences payable 85,027 57,104
Total current liabilities 198,543 135,433
Net positionNet investment in capital assets 474,188 557,342 Unrestricted 589,611 221,316
Total net position $ 1,063,799 $ 778,658
See accompanying independent auditor's report.
Fleet Services Fund
City of Waco, TexasInternal Service Funds
Comparative Statement of Net Position September 30, 2020 and 2019
256
DRAFT

2020 2019Operating revenues:
Charges for services $ 2,244,300 $ 1,445,942 Other 3,420 6,510
Total operating revenues 2,247,720 1,452,452
Operating expenses:Salaries and wages 965,999 928,812 Employee benefits 423,442 392,050 Purchased professional/technical services 10,787 7,599 Purchased property services 6,321 6,449 Maintenance 37,227 53,143 Other purchased services 32,100 32,247 Supplies 51,667 56,362 Other 353,312 294,782 Depreciation/amortization 83,154 76,105
Total operating expenses 1,964,009 1,847,549 Operating income (loss) 283,711 (395,097)
Nonoperating revenues (expenses):Investment earnings 1,430 372
Total nonoperating revenues (expenses) 1,430 372 Income (loss) before contributions and transfers 285,141 (394,725)
Capital contributions - 34,344 Transfers in - 415,000
Change in net position 285,141 54,619
Total net position, beginning of year 778,658 724,039 Total net position, end of year $ 1,063,799 $ 778,658
Fleet Services Fund
See accompanying independent auditor's report.
City of Waco, TexasInternal Service Funds
Comparative Statement of Revenues, Expenditures, and Changes in Net PositionFor the Years Ended September 30, 2020 and 2019
257
DRAFT

2020 2019Cash flows from operating activities:
Cash received from customers $ 2,247,720 $ 1,452,452 Cash paid to suppliers for goods and services (443,116) (568,452)Cash paid to employees for services (1,361,518) (1,344,822)
Net cash provided by (used for) operating activities 443,086 (460,822)
Cash flows from noncapital financing activities:Transfer from other funds - 415,000
Net cash provided by noncapital financing activities - 415,000
Cash flows from capital and related financing activities:Acquisition of capital assets - (72,664)
Net cash provided by (used for) capital and related financing activities - (72,664)
Cash flows from investing activities:Investment earnings 1,430 372
Net cash provided by (used for) investing activities 1,430 372 Net increase (decrease) in cash and cash equivalents 444,516 (118,114)Cash and cash equivalents, beginning of year 142,752 260,866 Cash and cash equivalents, end of year $ 587,268 $ 142,752
Reconciliation of operating income (loss) to net cash provided by (used for) operating activities:
Operating income (loss) $ 283,711 $ (395,097)Adjustment to reconcile operating income (loss) to net cash used provided by (used for) operating activities:
Depreciation 83,154 76,105 Changes in assets and liabilities:(Increase) decrease in assets:
Inventory 13,111 1,550 Increase (decrease) in liabilities:
Accounts payable 20,722 (112,468)Accrued liabilities 14,465 (6,952)Compensated absences payable 27,923 (23,960)
Net cash provided by (used for) operating activities $ 443,086 $ (460,822)
Noncash investing, capital and financing activities:Contributions of capital assets $ - $ 34,344
See accompanying independent auditor's report.
City of Waco, TexasInternal Service Funds
Comparative Statement of Cash FlowsFor the Years Ended September 30, 2020 and 2019
Fleet Service Fund
258
DRAFT

259
Agency Funds Urban Renewal Agency Fund - This fund is used to account for receipts and disbursements related to land sales for the Urban Renewal Agency. Heart of Texas Housing Finance Corporation Fund - This fund is used to account for receipts and disbursements for the Heart of Texas Housing Finance Corporation established as a mechanism to issue tax-exempt debt. Waco Public Improvement District No. 2 Fund - This fund is used to account for receipts and disbursements of funds on behalf of property owners related to drainage infrastructure improvements in the District. Rural Transit Services Fund - This fund is used to account for receipts and disbursements under the terms of an interlocal agreement with McLennan County Rural Transit District to provide public transportation within McLennan County.
DRAFT

Balance
Beginning of
Year Additions Deductions
Balance
End of
Year
Urban Renewal Agency Fund
Assets:
Cash and investments 61,107$ 641 - 61,748
Liabilities:
Accrued liabilities 61,107$ 641 - 61,748
Heart of Texas Housing Finance Corporation Fund
Assets:
Cash and investments 2,581,985$ 311,431 222,080 2,671,336
Liabilities:
Accrued liabilities 2,581,985$ 311,431$ 222,080$ 2,671,336$
Waco Public Improvement District No. 2 Fund
Assets:
Cash and investments 27,161$ 186,490 184,015 29,636
Liabilities:
Accrued liabilities 27,161$ 186,490$ 184,015$ 29,636$
Rural Transit Services Fund
Assets:Cash and investments 535,217$ 2,182,448$ 2,008,871$ 708,794 Accounts receivable - 1,282 1,282 -
Intergovernmental receivable 399,830 1,998,807 2,093,563 305,074
Total assets 935,047$ 4,182,537 4,103,716 1,013,868
Liabilities:
Accrued liabilities 935,047$ 4,182,537$ 4,103,716$ 1,013,868$
All Agency Funds
Assets:Cash and investments 3,205,470 2,681,010 2,414,966 3,471,514 Accounts receivable - 1,282 1,282 -
Intergovernmental receivable 399,830 1,998,807 2,093,563 305,074
Total assets 3,605,300$ 4,681,099 4,509,811 3,776,588
Liabilities:
Accrued liabilities 3,605,300$ 4,681,099$ 4,509,811$ 3,776,588$
See accompanying notes to financial statements
City of Waco, TexasCombining Statement of Changes in Fiduciary Net Position
Agency FundsYear Ended September 30, 2020
260
DRAFT

261
Statistical Section
The Statistical Section presents detailed information as a context for understanding what the information in the financial statements and not disclosures says about the City’s overall financial health
Financial Trends (Tables I through IV) – These schedules contain trend information to help the reader understand how the City’s financial performance and well-being have changed over time.
Revenue Capacity (Tables V through VIII) – These schedules contain information to help the reader assess the City’s most significant local revenue source, the property tax.
Debt Capacity (Tables IX through XII) – These schedules present information to help the reader assess the affordability of the City’s current levels of outstanding debt and the City’s ability to issue additional debt in the future.
Demographic and Economic Information (Tables XIII through XIV) – These schedules offer demographic and economic indicators to help the reader understand the environment within which the City’s financial activities take place.
Operating Information (Tables XV through XVII) – These schedules contain service and infrastructure data to help the reader understand how the information in the City’s financial report relates to the services the City provides and the activities it performs. DRAFT

262
City of Waco, Texas Net Position by Component
(Unaudited) Last Ten Fiscal Years
(Accrual Basis of Accounting)
2011 2012 2013 2014
Governmental activities Net investment in capital assets $ 174,645,915 $ 178,295,347 $ 180,902,677 $ 180,508,096 Restricted 19,687,245 22,291,256 19,391,804 18,895,396 Unrestricted 22,550,132 24,430,892 28,460,006 34,063,949
Total governmental activities net position $ 216,883,292 $ 225,017,495 $ 228,754,487 $ 233,467,441
Business-type activities Net investment in capital assets $ 213,553,436 $ 219,663,969 $ 215,231,053 $ 211,696,699 Restricted 388,651 6,834 1,180,611 1,274,319 Unrestricted 45,769,895 48,873,949 60,118,510 65,792,573
Total business-type activities net position $ 259,711,982 $ 268,544,752 $ 276,530,174 $ 278,763,591
Primary government Net investment in capital assets $ 388,199,351 $ 397,959,316 $ 396,133,730 $ 392,204,795 Restricted 20,075,896 22,298,090 20,572,415 20,169,715 Unrestricted 68,320,027 73,304,841 88,578,516 99,856,522
Total primary government net position $ 476,595,274 $ 493,562,247 $ 505,284,661 $ 512,231,032
Source: Comprehensive Annual Financial Reports
Note: The City implemented GASB Statement No. 65, "Items Previously Reported as Assets and Liabilities", in fiscal year 2014. Fiscal year 2013 amounts were restated to conform to the new statement requirements. Also, in fiscal year 2015, the City implemented the provisions of GASB Statement No. 68, "Accounting and
reported prospectively.Financial Reporting for Pensions, an Amendment of GASB Statement No. 27," and the changes are
DRAFT

263
Table I
Fiscal Year2015 2016 2017 2018 2019 2020
$ 183,090,881 $ 195,340,533 $ 206,699,045 $ 216,259,979 $ 227,983,027 $ 243,043,416 20,655,062 23,224,157 28,463,123 36,749,778 43,936,163 48,213,632 30,545,855 29,764,431 30,980,557 40,300,435 52,477,775 63,521,354
$ 234,291,798 $ 248,329,121 $ 266,142,725 $ 293,310,192 $ 324,396,965 $ 354,778,402
214,329,030 218,895,017 224,211,909 231,095,661 245,071,453 285,558,323 1,370,154 700,480 867,925 943,463 1,057,103 1,006,408
63,820,011 68,398,739 73,188,454 81,336,611 82,532,465 93,792,994
$ 279,519,195 $ 287,994,236 $ 298,268,288 $ 313,375,735 $ 328,661,021 $ 380,357,725
$ 397,419,911 $ 414,235,550 $ 430,910,954 $ 447,355,640 $ 473,054,480 $ 528,601,739 22,025,216 23,924,637 29,331,048 37,693,241 44,993,266 49,220,040 94,365,866 98,163,170 104,169,011 121,637,046 135,010,240 157,314,348
$ 513,810,993 $ 536,323,357 $ 564,411,013 $ 606,685,927 $ 653,057,986 $ 735,136,127
DRAFT

264
City of Waco, Texas Changes in Net Position
(Unaudited) Last Ten Fiscal Years
(Accrual Basis of Accounting)
2011 2012 2013 2014
ExpensesGovernmental activities: General government $ 12,378,019 $ 14,177,640 $ 20,039,649 $ 16,223,167 Public works 13,227,404 11,844,356 13,699,976 12,205,449 Public safety 61,291,317 57,664,131 62,592,351 66,630,254 Culture and recreation 15,636,875 15,694,840 16,544,389 16,922,912 Public health 7,417,771 7,184,384 7,388,363 7,314,101 Housing and community development 3,339,613 3,664,525 2,255,720 2,974,293 Interest on long-term debt 4,313,467 4,098,714 3,798,174 3,631,452 Total governmental activities expenses 117,604,466 114,328,590 126,318,622 125,901,628
Business-type activities: Water 34,186,629 33,311,059 33,038,145 32,998,874 Wastewater 17,522,331 17,634,339 18,432,230 19,263,583 Solid waste 16,201,178 15,854,254 16,033,246 15,794,559 Airport 2,503,823 2,937,967 3,083,925 3,284,396 Convention services 2,861,523 3,372,280 3,941,005 3,957,683 Ranger Hall of Fame 1,193,004 1,209,145 1,343,575 1,326,695 Cameron Park Zoo 4,315,032 4,396,640 4,318,267 4,494,173 Transit services 7,904,160 7,970,314 8,046,015 8,177,708 Cottonwood Creek Golf Course 1,691,790 1,864,426 1,782,963 1,810,707 Total business-type activities expenses 88,379,470 88,550,424 90,019,371 91,108,378
Total primary government expenses 205,983,936 202,879,014 216,337,993 217,010,006
Program RevenuesGovernmental activities: Charges for services: General government 342,830 243,137 277,810 192,402 Public works 2,550 385 1,537 2,257 Public safety 3,478,363 3,050,804 3,703,991 5,520,650 Culture and recreation 1,415,791 1,078,390 1,054,216 1,404,877 Public health 1,184,937 1,252,049 1,260,587 1,154,091 Operating grants and contributions 9,720,348 11,640,290 11,500,355 10,924,393 Capital grants and contributions 6,061,358 6,883,729 7,256,153 3,272,066 Total governmental activities program revenues 22,206,177 24,148,784 25,054,649 22,470,736
DRAFT
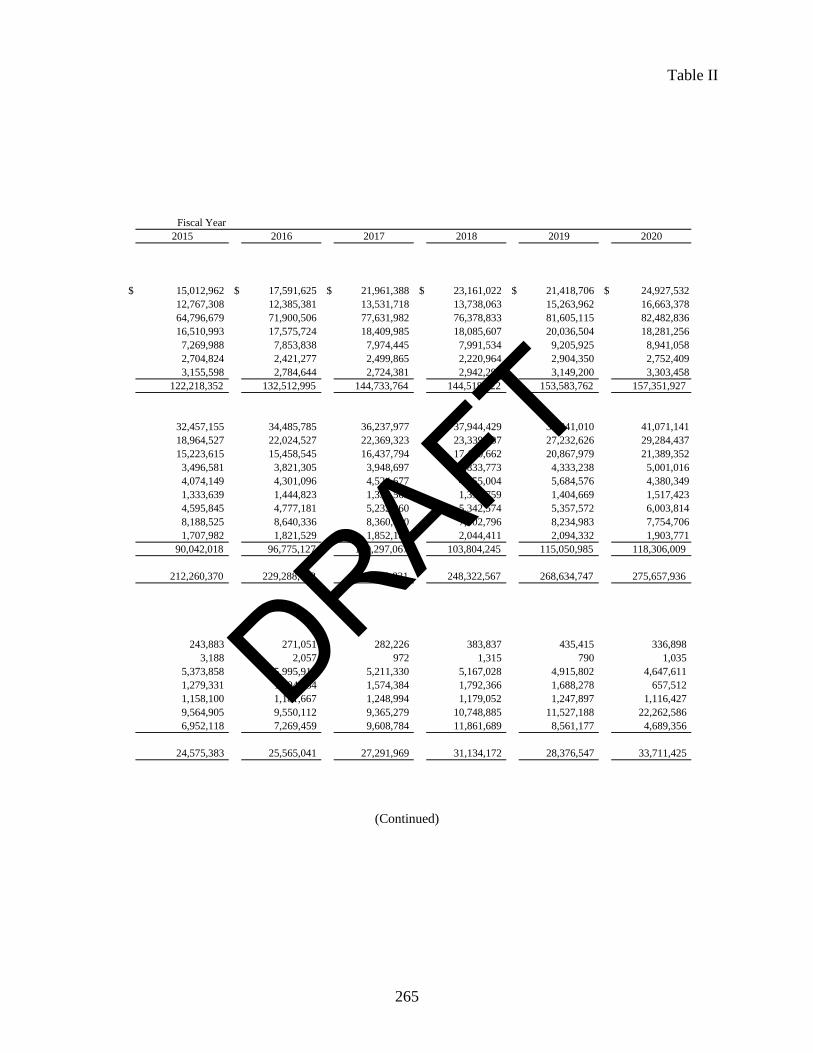
265
Table II
Fiscal Year2015 2016 2017 2018 2019 2020
$ 15,012,962 $ 17,591,625 $ 21,961,388 $ 23,161,022 $ 21,418,706 $ 24,927,53212,767,308 12,385,381 13,531,718 13,738,063 15,263,962 16,663,37864,796,679 71,900,506 77,631,982 76,378,833 81,605,115 82,482,83616,510,993 17,575,724 18,409,985 18,085,607 20,036,504 18,281,256
7,269,988 7,853,838 7,974,445 7,991,534 9,205,925 8,941,0582,704,824 2,421,277 2,499,865 2,220,964 2,904,350 2,752,4093,155,598 2,784,644 2,724,381 2,942,299 3,149,200 3,303,458
122,218,352 132,512,995 144,733,764 144,518,322 153,583,762 157,351,927
32,457,155 34,485,785 36,237,977 37,944,429 39,841,010 41,071,14118,964,527 22,024,527 22,369,323 23,339,837 27,232,626 29,284,43715,223,615 15,458,545 16,437,794 17,150,662 20,867,979 21,389,352
3,496,581 3,821,305 3,948,697 3,833,773 4,333,238 5,001,0164,074,149 4,301,096 4,524,677 4,855,004 5,684,576 4,380,3491,333,639 1,444,823 1,333,563 1,390,759 1,404,669 1,517,4234,595,845 4,777,181 5,232,360 5,342,574 5,357,572 6,003,8148,188,525 8,640,336 8,360,490 7,902,796 8,234,983 7,754,7061,707,982 1,821,529 1,852,186 2,044,411 2,094,332 1,903,771
90,042,018 96,775,127 100,297,067 103,804,245 115,050,985 118,306,009
212,260,370 229,288,122 245,030,831 248,322,567 268,634,747 275,657,936
243,883 271,051 282,226 383,837 435,415 336,898 3,188 2,057 972 1,315 790 1,035
5,373,858 5,995,911 5,211,330 5,167,028 4,915,802 4,647,611 1,279,331 1,294,784 1,574,384 1,792,366 1,688,278 657,512 1,158,100 1,181,667 1,248,994 1,179,052 1,247,897 1,116,427 9,564,905 9,550,112 9,365,279 10,748,885 11,527,188 22,262,586 6,952,118 7,269,459 9,608,784 11,861,689 8,561,177 4,689,356
24,575,383 25,565,041 27,291,969 31,134,172 28,376,547 33,711,425
(Continued)
DRAFT

266
City of Waco, Texas Changes in Net Position
(Unaudited) (Continued)
2011 2012 2013 2014Business-type activities: Charges for services: Water $ 43,094,944 $ 38,759,662 $ 40,713,824 $ 38,600,073 Wastewater 21,619,018 21,542,770 21,718,912 21,343,556 Solid waste 15,948,286 16,531,734 16,489,195 16,866,587 Airport 1,054,550 1,065,157 1,079,297 1,142,240 Convention services 523,983 771,773 1,018,086 1,213,798 Ranger Hall of Fame 465,324 448,449 410,728 420,414 Cameron Park Zoo 1,575,223 1,602,554 1,618,495 1,582,279 Transit services 3,414,289 3,582,781 3,540,047 3,373,782 Cottonwood Creek Golf Course 1,578,174 1,226,374 1,615,885 1,549,328 Operating grants and contributions 3,514,732 3,415,770 3,419,959 3,869,760 Capital grants and contributions 4,014,798 3,786,143 4,836,705 1,682,452 Total business-type activities program revenues 96,803,321 92,733,167 96,461,133 91,644,269
Total primary government program revenues 119,009,498 116,881,951 121,515,782 114,115,005
Net (Expense)/Revenue Governmental activities (95,398,289) (90,179,806) (101,263,973) (103,430,892) Business-type activities 8,423,851 4,182,743 6,441,762 535,891 Total primary government net expense (86,974,438) (85,997,063) (94,822,211) (102,895,001)
General Revenues and Other Changes in Net PositionGovernmental activities: Taxes: Property taxes 48,387,467 49,373,010 51,184,254 51,585,835 Tax increment financing tax 4,660,231 5,004,192 5,916,309 5,573,984 Sales taxes 28,003,416 29,186,254 31,075,760 33,487,659 Franchise taxes 13,587,114 13,682,123 13,405,186 14,181,593 Other taxes 679,232 650,815 676,254 785,905 Unrestricted investment earnings 481,791 360,561 308,603 323,760 Miscellaneous 678,741 882,450 2,153,305 1,196,841 Gain on disposal of capital assets - 1,730,200 290,376 105,278 Transfers (5,848,585) (2,555,596) 81,051 902,991 Total governmental activities 90,629,407 98,314,009 105,091,098 108,143,846
Business-type activities: Hotel/motel taxes 1,754,730 1,897,865 2,095,987 2,403,171 Unrestricted investment earnings 183,254 196,566 159,463 197,346 Gain on disposal of capital assets - - - -
Special item: Gain on termination of agreement - - - - Transfers 5,848,585 2,555,596 (81,051) (902,991) Total business-type activities 7,786,569 4,650,027 2,174,399 1,697,526
Total primary government 98,415,976 102,964,036 107,265,497 109,841,372
Change in Net PositionGovernmental activities (4,768,882) 8,134,203 3,827,125 4,712,954 Business-type activities 16,210,420 8,832,770 8,616,161 2,233,417
Total primary government $ 11,441,538 $ 16,966,973 $ 12,443,286 $ 6,946,371
Source: Comprehensive Annual Financal Reports
Note: The City implemented GASB Statement No. 65, "Items Previously Reported as Assets and Liabilities", in fiscal year 2014. Fiscal year 2013 amounts were restated to conform to the new statement requirements. Also, in fiscal year 2015, the City implemented the provisions of GASB Statement No. 68, "Accounting and
reported prospectively.Financial Reporting for Pensions, an Amendment of GASB Statement No. 27," and the changes are
DRAFT
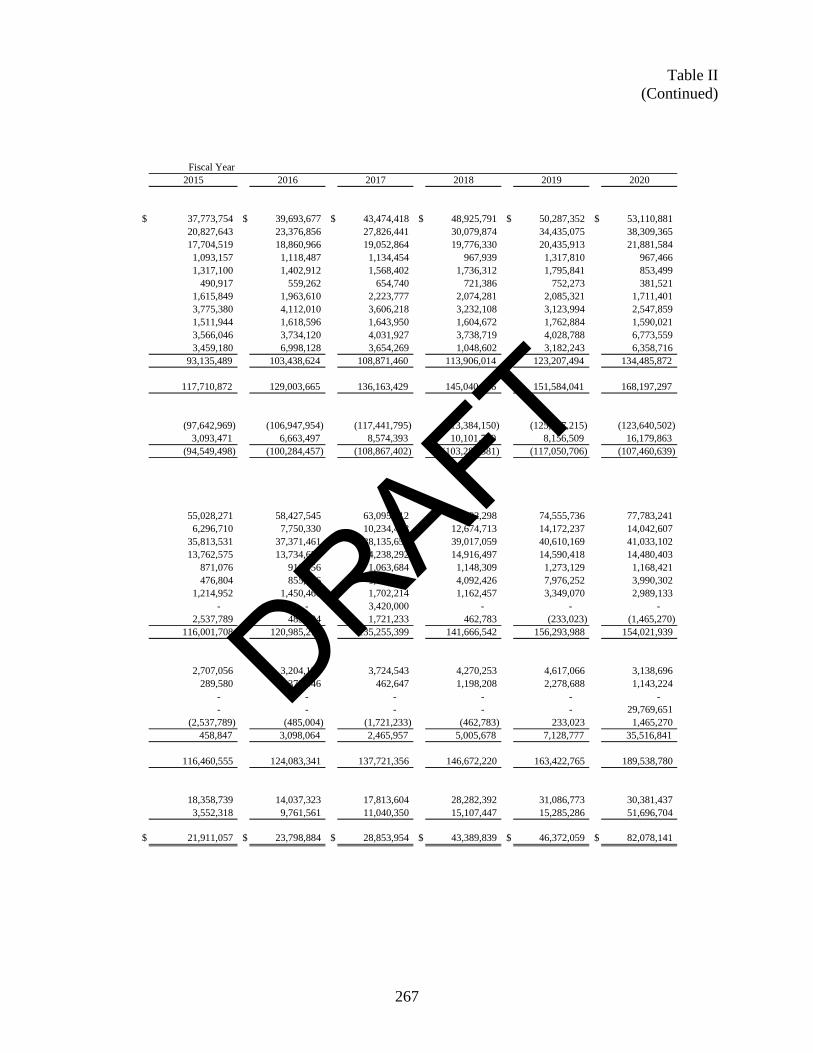
267
Table II (Continued)
Fiscal Year2015 2016 2017 2018 2019 2020
$ 37,773,754 $ 39,693,677 $ 43,474,418 $ 48,925,791 $ 50,287,352 $ 53,110,881 20,827,643 23,376,856 27,826,441 30,079,874 34,435,075 38,309,365 17,704,519 18,860,966 19,052,864 19,776,330 20,435,913 21,881,584 1,093,157 1,118,487 1,134,454 967,939 1,317,810 967,466 1,317,100 1,402,912 1,568,402 1,736,312 1,795,841 853,499
490,917 559,262 654,740 721,386 752,273 381,521 1,615,849 1,963,610 2,223,777 2,074,281 2,085,321 1,711,401 3,775,380 4,112,010 3,606,218 3,232,108 3,123,994 2,547,859 1,511,944 1,618,596 1,643,950 1,604,672 1,762,884 1,590,021 3,566,046 3,734,120 4,031,927 3,738,719 4,028,788 6,773,559 3,459,180 6,998,128 3,654,269 1,048,602 3,182,243 6,358,716
93,135,489 103,438,624 108,871,460 113,906,014 123,207,494 134,485,872
117,710,872 129,003,665 136,163,429 145,040,186 151,584,041 168,197,297
(97,642,969) (106,947,954) (117,441,795) (113,384,150) (125,207,215) (123,640,502) 3,093,471 6,663,497 8,574,393 10,101,769 8,156,509 16,179,863
(94,549,498) (100,284,457) (108,867,402) (103,282,381) (117,050,706) (107,460,639)
55,028,271 58,427,545 63,095,312 68,192,298 74,555,736 77,783,241 6,296,710 7,750,330 10,234,498 12,674,713 14,172,237 14,042,607
35,813,531 37,371,461 38,135,659 39,017,059 40,610,169 41,033,102 13,762,575 13,734,655 14,238,292 14,916,497 14,590,418 14,480,403
871,076 910,456 1,063,684 1,148,309 1,273,129 1,168,421 476,804 855,366 1,644,507 4,092,426 7,976,252 3,990,302
1,214,952 1,450,460 1,702,214 1,162,457 3,349,070 2,989,133 - - 3,420,000 - - -
2,537,789 485,004 1,721,233 462,783 (233,023) (1,465,270)116,001,708 120,985,277 135,255,399 141,666,542 156,293,988 154,021,939
2,707,056 3,204,122 3,724,543 4,270,253 4,617,066 3,138,696 289,580 378,946 462,647 1,198,208 2,278,688 1,143,224
- - - - - - - - - - - 29,769,651
(2,537,789) (485,004) (1,721,233) (462,783) 233,023 1,465,270 458,847 3,098,064 2,465,957 5,005,678 7,128,777 35,516,841
116,460,555 124,083,341 137,721,356 146,672,220 163,422,765 189,538,780
18,358,739 14,037,323 17,813,604 28,282,392 31,086,773 30,381,437 3,552,318 9,761,561 11,040,350 15,107,447 15,285,286 51,696,704
$ 21,911,057 $ 23,798,884 $ 28,853,954 $ 43,389,839 $ 46,372,059 $ 82,078,141
DRAFT

268
City of Waco, Texas Fund Balances of Governmental Funds
(Unaudited) Last Ten Fiscal Years
(Modified Accrual Basis of Accounting)
2011 2012 2013 2014
General Fund Nonspendable: Advances to other funds $ 683,391 $ 48,388 $ - $ - Inventory 529,830 504,736 536,785 734,557 Real estate held for resale 6,160 6,160 6,160 6,160 Restricted for: Municipal information equipment - 1,350 636,993 703,924 Culture and recreation - 365,900 689,343 918,377 Public safety - - 377,841 83,856 Economic development - - 100,996 - Committed to: Economic development 8,394,212 7,597,032 8,719,518 9,532,164 Culture and recreation 2,500,000 - - - Assigned to: Capital improvements 2,061,231 3,838,635 9,073,859 15,050,171 Economic development 1,137,659 2,810,428 6,078,636 3,048,263 Housing and community development 1,040,666 45,000 25,000 25,000 Public works - 14,942 470,084 4,677 Public safety 297,238 262,804 10,173 140,595 Culture and recreation 151,913 47,622 15,305 16,230 Subsequent year's budget appropriation of fund balances - - - - Other 67,868 120,684 124,312 490,289 Unreserved/Unassigned 17,850,409 21,984,507 19,604,248 21,043,396
Total general fund $ 34,720,577 $ 37,648,188 $ 46,469,253 $ 51,797,659
DRAFT

269
Table III
Fiscal Year2015 2016 2017 2018 2019 2020
$ - $ - $ - $ - $ - $ - 849,594 925,826 855,118 962,267 963,711 1,025,496
6,160 6,160 6,160 6,160 6,160 6,160
751,247 971,345 1,006,021 1,271,408 1,318,309 1,471,560 755,927 365,900 - - - - 119,629 - - - - -
- - - - - -
9,722,702 10,288,673 10,645,045 10,933,118 13,688,936 14,496,364 - - - - - -
4,810,928 11,891,042 14,880,555 17,425,920 25,476,197 12,917,754 5,740,957 4,753,144 4,491,067 7,354,149 8,274,949 3,958,032
142,117 3,822 - 44,600 - - 352,180 300,048 109,472 240,959 566,574 245,706 189,501 237,645 507,585 753,506 699,653 757,889 150,601 141,888 129,850 130,993 340,878 8,236
7,108,799 2,140,199 2,868,343 3,588,211 4,403,230 7,979,534 220,123 268,004 264,776 416,224 1,045,887 1,138,853
23,392,619 23,778,234 25,058,680 26,964,901 30,539,334 48,089,822
$ 54,313,084 $ 56,071,930 $ 60,822,672 $ 70,092,416 $ 87,323,818 $ 92,095,406
(Continued)
DRAFT

270
City of Waco, Texas Fund Balances of Governmental Funds
(Unaudited) (Continued)
2011 2012 2013 2014All Other Governmental Funds: Nonspendable: Parks and cemetery care $ 474,415 $ 475,431 $ 477,891 $ 478,848 Real estate held for sale 40,061 40,061 40,061 40,061 Inventory - - - - Restricted for: Debt service 373,263 230,130 238,053 185,902 Capital projects 38,873,017 23,348,990 15,531,634 11,828,967 Tax increment zone activities 12,411,165 14,565,233 10,960,465 10,891,785 Housing and community development 175,114 193,495 2,676,979 2,333,652 Public works - - - - Public safety 1,439,842 2,314,311 1,831,495 1,406,274 Culture and recreation 1,186,432 1,194,942 755,434 1,302,930 Waco Public Improvement District 413,153 520,765 611,577 645,008 Committed to: Capital projects 1,029,132 1,308,537 1,443,453 2,582,281 Public health - 157,585 351,412 561,880 Unassigned (97,276) - - -
Total all other governmental funds $ 56,318,318 $ 44,349,480 $ 34,918,454 $ 32,257,588
Source: Comprehensive Annual Financial Reports
Note: The City implemented GASB Statement No. 65 "Items Previously Reported as Assets and Liabilities" in fiscal year 2014. Fiscal year 2013 amounts restated to conform to the new statement requirements. Also, infiscal year 2015, the City implemented the provisions of GASB Statement No. 68, "Accounting and FinancialReporting for Pensions, an Amendment of GASB Statement No. 27," and the changes are reported prospectively.
DRAFT

271
Table III
Fiscal Year2015 2016 2017 2018 2019 2020
$ 466,997 $ 366,560 $ 368,115 $ 371,797 $ 378,209 $ 381,019 46,705 - - - - -
131,805 138,360 85,685 - - -
491,257 598,145 528,707 675,525 742,629 600,472 7,184,956 4,631,102 12,754,861 29,469,813 35,639,375 50,835,124
13,579,596 16,822,186 22,732,032 31,067,768 37,977,473 42,551,716 2,059,972 2,037,017 1,570,574 1,314,573 325,423 246,965
- - - - 1,142,535 636,582 1,442,749 1,224,262 1,208,289 1,556,260 1,568,647 1,658,699
450,821 347,288 581,442 191,804 153,891 169,374 716,835 755,292 888,323 906,377 1,006,241 1,148,686
15,665,156 13,223,176 14,236,424 14,241,431 12,465,309 20,797,066 820,811 1,050,924 1,741,422 2,417,446 2,514,105 3,240,719
- - - - - -
$ 43,057,660 $ 41,194,312 $ 56,695,874 $ 82,212,794 $ 93,913,837 $ 122,266,422
DRAFT

272
City of Waco, Texas Changes in Fund Balances of Governmental Funds
(Unaudited) Last Ten Fiscal Years
(Modified Accrual Basis of Accounting)
2011 2012 2013 2014Revenues: Taxes: Sales $ 28,003,416 $ 29,186,254 $ 31,075,760 $ 33,487,659 Property 52,307,731 53,698,407 56,769,973 56,383,515 Interest and penalty 545,059 558,497 864,693 507,622
Special assessments 279,322 296,835 323,153 300,940 Business and occupation fees 13,587,115 13,682,123 13,405,186 14,181,593 Permits, licenses and fees 1,682,153 2,069,365 2,361,710 2,519,019 Fines 1,815,418 1,647,361 1,915,904 2,555,149 Charges for services 1,779,213 1,501,983 1,643,861 1,639,054 Investment earnings 440,229 325,873 285,712 296,370 Contributions 350,827 269,577 504,130 883,815 Intergovernmental 11,001,361 9,625,197 10,888,461 10,278,693 Program income 521,371 608,810 297,998 338,265 Other 8,832,941 9,166,618 10,327,351 10,028,613 Total revenues 121,146,156 122,636,900 130,663,892 133,400,307
Expenditures: General government 18,067,565 19,881,170 27,395,172 24,937,624 Public works 2,753,649 2,051,156 3,214,854 2,583,490 Public safety 56,363,026 55,143,283 60,765,347 62,521,778 Culture and recreation 12,932,267 14,773,781 12,792,566 13,998,629 Housing and community development 3,321,373 3,469,303 3,088,943 3,160,091 Public health 7,155,606 6,993,107 7,271,899 7,267,366 Capital outlay 20,198,033 23,954,367 14,814,436 10,002,288 Debt service: Principal 6,967,663 7,090,342 5,912,954 5,340,143 Interest and fiscal charges 4,192,140 4,194,170 3,946,312 3,788,820 Bond issuance costs 500 68,981 35,891 26,107 Total expenditures 131,951,822 137,619,660 139,238,374 133,626,336
Excess (deficiency) of revenues over (under) expenditures (10,805,666) (14,982,760) (8,574,482) (226,029)
Other financing sources (uses): General obligation bonds issued 7,285,000 3,480,000 2,175,000 1,645,000 Refunding bonds issued - 6,465,000 1,700,000 - Capital leases - 145,351 - - Premiums on general obligation bonds 54,583 10,594 168,544 59,040 Premiums on refunding bonds - 792,695 316,832 - Payments to refunded bond escrow agent - (7,243,886) (1,999,938) - Transfers in 12,781,678 15,015,607 14,935,710 17,504,831 Transfer out (12,047,501) (14,513,914) (13,145,858) (16,420,580) Proceeds from sale of capital assets - 1,790,086 290,376 105,278 Total other financing sources 8,073,760 5,941,533 4,440,666 2,893,569
Net change in fund balances $ (2,731,906) $ (9,041,227) $ (4,133,816) $ 2,667,540
Debt service as a percentage of noncapital expenditures 9.28% 9.85% 7.94% 7.49%
Source: Comprehensive Annual Financial Reports
Note: The City implemented GASB Statement No. 65 "Items Previously Reported as Assets and Liabilities" in fiscal year 2014. Fiscal year 2013 amounts restated to conform to the new statement requirements.
DRAFT

273
Table IV
Fiscal Year2015 2016 2017 2018 2019 2020
$ 35,813,531 $ 37,371,461 $ 38,135,659 $ 39,017,059 $ 40,610,169 $ 41,033,102 60,851,059 65,630,088 72,678,709 80,168,586 87,622,628 91,162,296
598,772 620,805 620,791 636,115 613,463 805,160 326,760 358,421 482,959 535,505 560,432 630,654
13,762,575 13,734,655 14,238,292 14,916,497 14,590,418 14,480,403 2,454,494 2,739,022 2,618,623 2,482,683 2,957,028 2,967,430 2,506,051 2,569,317 2,054,255 1,883,191 2,055,628 1,650,016 1,749,690 1,834,544 1,939,164 2,104,779 2,101,940 1,921,824
436,017 825,795 1,574,399 3,921,246 7,640,582 3,823,044 3,490,258 1,419,645 1,244,774 861,550 1,072,378 829,925 9,968,503 9,175,975 11,344,302 9,590,294 9,435,004 19,950,651
289,272 298,107 222,053 246,593 194,820 227,685 10,971,694 11,238,248 11,080,269 12,156,194 16,217,373 14,253,903
143,218,676 147,816,083 158,234,249 168,520,292 185,671,863 193,736,093
22,826,332 25,611,309 28,421,391 30,108,527 30,851,658 38,971,422 1,405,812 1,879,964 1,643,939 5,119,496 7,051,885 7,926,213
62,557,857 67,172,300 70,051,351 73,673,507 75,754,565 80,011,063 13,543,825 13,427,467 17,688,310 14,216,289 15,201,353 15,196,451
2,897,236 2,370,097 2,576,675 2,908,249 3,250,335 2,925,409 7,247,059 7,533,938 7,588,586 7,906,760 8,944,992 8,813,617
14,758,838 26,453,338 13,884,468 11,595,064 25,302,918 21,821,248
5,585,000 5,895,000 6,685,000 6,660,000 6,555,000 7,590,000 3,437,349 3,283,750 3,240,961 3,440,471 4,016,921 4,553,085
250,679 99,402 84,655 140,293 203,758 123,993 134,509,987 153,726,565 151,865,336 155,768,656 177,133,385 187,932,501
8,708,689 (5,910,482) 6,368,913 12,751,636 8,538,478 5,803,592
1,695,000 3,805,000 11,465,000 19,840,000 18,560,000 26,210,000 34,125,000 1,945,000 - - 9,365,000 -
- - - - - - 57,044 334,219 451,335 1,180,056 1,583,439 2,551,941
6,804,247 136,375 - - 1,065,159 - (40,676,302) (2,055,353) - - (10,434,176) - 26,296,892 23,677,980 22,351,642 13,552,009 18,871,120 31,572,912
(23,695,073) (22,037,241) (20,384,586) (12,537,037) (18,616,575) (33,014,272)- - - - - -
4,606,808 5,805,980 13,883,391 22,035,028 20,393,967 27,320,581
$ 13,315,497 $ (104,502) $ 20,252,304 $ 34,786,664 $ 28,932,445 $ 33,124,173
7.49% 7.24% 7.31% 7.04% 7.09% 7.77%
DRAFT

274
City of Waco, Texas Assessed Value and Estimated Actual Value of Taxable Property
(Unaudited) Last Ten Fiscal Years
Category 2020 2019 2018 2017
Real - residential single family $ 5,045,208,989 $ 4,689,727,622 $ 4,103,208,707 $ 3,666,787,394
Real - residential multi-family 1,204,270,853 1,156,809,421 1,036,321,000 854,447,458
Real - platted lots & residential inventory 254,696,041 241,199,487 225,165,345 216,913,884
Real - acreage, land only 101,075,715 95,061,274 75,960,194 77,014,810
Real - improved farm & ranch 49,625,414 47,626,117 41,117,522 34,974,967
Real - commercial & industrial 2,931,146,517 2,831,537,753 2,652,184,099 2,444,560,582
Real and tangible personal - utilities 229,487,770 217,987,430 202,093,432 192,815,272
Tangible personal - business 2,131,366,180 2,037,021,720 1,940,142,010 1,926,700,880
Tangible personal - other 2,699,122 2,370,660 2,334,390 2,325,700
Total market value 11,949,576,601 11,319,341,484 10,278,526,699 9,416,540,947
Less total exemptions 1,254,695,579 1,253,765,578 1,073,765,249 943,172,583
Taxable assessed value $ 10,694,881,022 $ 10,065,575,906 $ 9,204,761,450 $ 8,473,368,364
Total direct tax rate per $100 of taxable assessed value $ 0.776232 $ 0.776232 $ 0.776232 $ 0.776232
Estimated actual taxable value $ 11,949,576,601 $ 11,319,341,484 $ 10,278,526,699 $ 9,416,540,947
Taxable assessed value as a percentage of actual taxable value 89.5% 88.9% 89.6% 90.0%
Source: McLennan County Appraisal District, except total direct tax rates which were obtained from the City of Waco Budget Office.
DRAFT

275
Table V
2016 2015 2014 2013 2012 2011
$ 3,442,331,305 $ 3,330,608,637 $ 3,193,078,012 $ 3,145,755,030 $ 2,964,790,976 $ 2,899,061,978
710,274,847 600,033,734 552,903,404 540,947,926 530,246,728 527,542,939
179,995,100 192,366,941 185,737,380 161,765,042 159,734,533 158,194,756
69,022,094 74,636,662 66,466,703 73,968,631 73,351,221 72,134,192
29,242,020 32,499,555 28,871,288 18,486,406 19,298,600 19,050,487
2,221,110,921 2,051,472,009 1,885,152,286 1,839,811,136 1,820,432,553 1,769,330,218
202,959,032 177,491,413 147,349,253 140,452,424 138,700,708 142,912,428
1,844,415,017 1,724,904,133 1,674,043,041 1,667,295,558 1,566,759,638 1,473,384,230
2,406,350 2,424,330 2,328,520 2,236,139 2,442,607 2,054,003
8,701,756,686 8,186,437,414 7,735,929,887 7,590,718,292 7,275,757,564 7,063,665,231
939,650,349 916,313,922 927,340,793 938,850,655 829,201,392 783,127,564
$ 7,762,106,337 $ 7,270,123,492 $ 6,808,589,094 6,651,867,637 $ 6,446,556,172 $ 6,280,537,667
$ 0.776232 $ 0.776232 $ 0.776232 $ 0.786232 $ 0.786232 0.786232
$ 8,701,756,686 $ 8,186,437,414 $ 7,735,929,887 7,590,718,292 $ 7,275,757,564 $ 7,063,665,231
89.2% 88.8% 88.0% 87.6% 88.6% 88.9%
Fiscal Year
DRAFT

276
City of Waco, Texas Property Tax Rates – Direct and Overlapping Governments
(Per $100 of Assessed Value) (Unaudited)
Last Ten Fiscal Years
Waco China Spring LaVegaIndependent Independent Independent McLennan
Fiscal Operating/ Debt Total School School School CommunityYear General Service Direct District District District College
2011 0.611239 0.174993 0.786232 1.364750 1.407000 1.365000 0.1563062012 0.613251 0.172981 0.786232 1.360998 1.411400 1.365000 0.1528232013 0.637434 0.148798 0.786232 1.355180 1.374402 1.420000 0.1515302014 0.639191 0.137041 0.776232 1.354800 1.540000 1.420000 0.1515302015 0.646744 0.129488 0.776232 1.353240 1.538834 1.465000 0.1495302016 0.653858 0.122374 0.776232 1.400000 1.516068 1.459000 0.1497242017 0.662094 0.114138 0.776232 1.400000 1.421381 1.422100 0.1488982018 0.660723 0.115509 0.776232 1.302450 1.387194 1.413532 0.1503462019 0.673581 0.102651 0.776232 1.410000 1.358720 1.394040 0.1476962020 0.665656 0.110576 0.776232 1.302450 1.294110 1.290269 0.147696
Note: A typical property tax bill would consist of City, school district, community college, and county taxes.
City Direct Rates
DRAFT

277
Table VI
Overlapping RatesConnally Midway Bosqueville Lorena Robinson McGregor
Independent Independent Independent Independent Independent IndependentMcLennan School School School School School School
County District District District District District District
0.442710 1.288824 1.320000 1.545259 1.270000 1.315000 1.1900000.442710 1.281105 1.320000 1.537596 1.290000 1.315000 1.1900000.460573 1.269091 1.320000 1.478460 1.310000 1.315000 1.1850000.535293 1.265653 1.320000 1.487914 1.620000 1.315000 1.3550000.535293 1.274394 1.320000 1.478175 1.640000 1.510000 1.3550000.535293 1.281628 1.320000 1.507102 1.640000 1.510000 1.3550000.525293 1.251212 1.320000 1.441544 1.579090 1.470000 1.3338000.505293 1.374409 1.320000 1.429973 1.554090 1.406135 1.3300000.485293 1.367955 1.320000 1.379229 1.534000 1.406135 1.3300000.485293 1.266457 1.250000 1.322389 1.435210 1.286700 1.276100
DRAFT

278
City of Waco, Texas Principal Property Taxpayers
(Unaudited) Current Year and Nine Years Ago
TaxableAssessed
Taxpayers Value
Mars Snackfood US L.L.C $ 131,502,484 1.23 %
Allergan, Inc 98,374,926 0.92 %
Coca Cola Company 95,751,647 0.90 %
Sanderson Farms, Inc 70,572,293 0.66 %
L-3 Communications Integrated Systems L.P. 67,869,000 0.63 %
Sherwin Williams CO Inc. 65,286,365 0.61 %
Oncor Electric Delivery CO L.L.C 63,624,000 0.59 %
3503 RP Waco Central L.P. 62,219,025 0.58 %
Owens-Brockway Glass Container Inc. 55,063,707 0.51 %
Atmos Energy/Mid-Tex Distribut 49,261,540 0.46 %
Total $ 759,524,987 7.09 %
Source: McLennan County Appraisal District
Valuation
Fiscal Year 2020
Percentage ofTotal Taxable
Assessed
DRAFT

279
Table VII
TaxableAssessed
Taxpayers Value
MasterFoods USA (M & M Mars) $ 105,022,239 1.67 %
Coca Cola Company 99,996,861 1.59 %
L-3 Communications Corp. 72,485,013 1.15 %
Allergan, Inc. 53,164,216 0.85 %
Inland Western Waco Central, L.P. 51,745,953 0.82 %
Oncor Electric Delivery Co. 49,154,540 0.78 %
CBL/Richland Mall, L.P. 40,200,878 0.64 %
Pilgrim's Pride Corp. 32,253,826 0.51 %
Cargill Meat Solutions Corp. 28,789,268 0.46 %
Sherwin Williams Co. Inc. 27,916,184 0.44 %
Total $ 560,728,978 8.93 %
AssessedTotal TaxablePercentage of
Fiscal Year 2011
Valuation
DRAFT

280
City of Waco, Texas Property Tax Levies and Collections
(Unaudited) Last Ten Fiscal Years
Tax Levy City Tax Levy Adjustmentsfor City for Tax Total Tax to Levy in
Operations Increment Levy for SubsequentFiscal Year and Debt Financing Fiscal Year Years
2011 48,078,029 1,247,577 49,325,606 (121,741)
2012 49,428,253 1,516,082 50,944,335 (504,046)
2013 50,896,824 1,541,926 52,438,750 (286,175)
2014 51,208,846 1,582,983 52,791,829 (14,813)
2015 54,676,069 1,792,277 56,468,346 (210,315)
2016 58,055,153 2,224,388 60,279,541 (348,272)
2017 62,891,323 3,094,279 65,985,602 (821,394)
2018 67,536,896 3,506,068 71,042,964 (248,792)
2019 73,976,108 3,864,376 77,840,484 (486,877)
2020 79,178,817 3,942,081 83,120,898 (744,206)
Source: McLennan County Tax Office
DRAFT

281
Table VIII
Adjusted DelinquentTax Levy for TaxFiscal Year Amount Collections Amount
49,203,865 48,312,012 98.19 802,592 49,114,604 99.82
50,440,289 49,634,551 98.40 701,970 50,336,521 99.79
52,152,575 51,511,537 98.77 544,453 52,055,990 99.81
52,777,016 52,019,615 98.56 644,480 52,664,095 99.79
56,258,031 55,622,582 98.87 506,065 56,128,647 99.77
59,931,269 59,465,589 99.22 323,946 59,789,535 99.76
65,164,208 64,907,474 99.61 80,342 64,987,816 99.73
70,794,172 70,504,465 99.59 51,390 70,555,855 99.66
77,353,607 76,906,987 99.42 34,316 76,941,303 99.47
82,376,692 81,374,389 98.78 - 81,374,389 98.78
Collected within theFiscal Year of the Levy
of AdjustedLevy
of AdjustedLevy
Total CollectionsPercentage Percentage
DRAFT

282
City of Waco, Texas Ratio of Outstanding Debt by Type
(Unaudited) Last Ten Fiscal Years
General General GeneralFiscal Obligation Capital Obligation Contracts Refundable Note ObligationYear Bonds (1) Leases Bonds (2) Payable Contracts Payable Bonds
2011 98,019,198 - 1,224,455 830,000 80,007 - 220,721,649
2012 94,657,316 109,814 813,366 830,000 80,007 - 207,205,507
2013 91,155,603 61,608 615,000 830,000 80,007 - 228,080,781
2014 87,989,551 12,443 550,000 830,000 80,007 - 223,017,008
2015 86,321,896 - 370,000 830,000 80,007 968,532 223,050,091
2016 83,778,284 - 345,000 830,000 80,007 807,110 295,326,024
2017 88,004,702 - 285,000 830,000 80,007 645,688 314,046,707
2018 92,942,378 - 8,505,000 830,000 80,007 484,266 343,297,379
2019 105,635,153 - 8,100,000 830,000 80,007 322,844 370,491,773
2020 125,567,359 - 7,560,000 830,000 80,007 161,422 381,685,431
Note 1: Details regarding the City's outstanding debt can be found in the notes to the financial statements.Note 2: Personal income information is not available at the City level. In lieu of this ratio, the percentage of total debt to actual taxable value of property is provided.
(1) Includes unamortized premium.(2) General obligation bonds payable from tax increment financing sources.(3) See Table V for property value data.
Source: Estimated population provided by the City of Waco Planning Office.
Governmental Activities
DRAFT

283
Table IX
Percentage ofTotal Actual Taxable
Notes Refundable Contracts Primary Value Population PopulationPayable Contracts Payable Government of Property (3) of City Per Capita
17,098,108 1,808,894 - 339,782,311 5.41% 125,971 2,697
17,034,421 1,818,363 - 322,548,794 5.00% 127,018 2,539
1,967,906 1,795,178 - 324,586,083 4.88% 128,125 2,533
1,898,437 1,952,243 - 316,329,689 4.65% 129,241 2,448
1,825,882 1,572,435 - 315,018,843 4.33% 130,533 2,413
1,750,105 1,513,751 1,306,512 385,736,793 4.97% 132,889 2,903
1,670,963 1,615,828 845,390 408,024,285 4.82% 135,557 3,010
1,588,306 1,390,948 345,841 449,464,125 4.88% 137,048 3,280
1,501,978 1,354,489 - 488,316,244 4.85% 139,454 3,502
1,411,816 1,284,371 - 518,580,406 5.15% 141,127 3,675
Business-Type Activities
DRAFT

284
Table X City of Waco, Texas
Ratio of General Bonded Debt Outstanding (Unaudited)
Last Ten Fiscal Years
General Less: Amounts Percentage ofBonded Available in Actual Taxable
Fiscal Debt Debt Service Value of Population PerYear Outstanding (1) Fund Total Property (2) of City (3) Capita
2011 319,965,302 49,695 319,915,607 5.09% 125,971 2,540
2012 302,676,189 33,913 302,642,276 4.69% 127,018 2,383
2013 319,851,384 - 319,851,384 4.76% 128,125 2,496
2014 311,556,559 - 311,556,559 4.58% 129,241 2,411
2015 309,741,987 259,739 309,482,248 4.26% 130,533 2,371
2016 379,449,308 310,501 379,138,807 4.88% 132,889 2,853
2017 402,336,409 147,618 402,188,791 4.75% 135,557 2,967
2018 444,744,757 104,018 444,640,739 4.83% 137,048 3,244
2019 484,226,926 120,072 484,106,854 4.81% 139,454 3,471
2020 514,812,790 - 514,812,790 4.81% 141,127 3,648
Note: Details regarding the City's outstanding debt can be found in thenotes to the financial statements.
(1) General bonded debt of both governmental and business-type activities, including unamortized premium, paid from property tax levy and revenues of the Water Fund, Wastewater Fund, Solid Waste Fund and Tax Increment Fund No. 1.
(2) See Table V for property value data.(3) See Table IX for population data.
DRAFT

285
Table XI City of Waco, Texas
Direct and Overlapping Governmental Activities Debt (Unaudited)
September 30, 2020
EstimatedEstimated Share of Debt
Debt Percentage OverlappingTaxing Authority Outstanding Applicable (1) Debt
Debt repaid with property taxes:Waco Independent School District $ 141,440,000 95.65% $ 135,287,360 Bosqueville Independent School District 7,520,000 79.29% 5,962,608 McLennan Community College 52,080,000 56.54% 29,446,032 McLennan County 52,410,000 56.54% 29,632,614 Midway Independent School District 205,045,000 53.04% 108,755,868 LaVega Independent School District 44,604,739 43.24% 19,287,089 China Spring Independent School District 33,064,986 39.91% 13,196,236 Connally Independent School District 12,485,000 17.98% 2,244,803 Lorena Independent School District 27,098,973 1.98% 536,560
Subtotal, overlapping debt $ 575,748,698 $ 344,349,170
City direct debt:City of Waco direct debt $ 125,567,359 100.00% $ 125,567,359 Tax increment financing 7,560,000 100.00% 7,560,000 Other 1,071,429 100.00% 1,071,429
Subtotal, direct debt $ 134,198,788 $ 134,198,788
Total direct and overlapping debt $ 709,947,486 $ 478,547,958
(1) The percentage of overlapping debt applicable is estimated using taxable assessed values that were obtained from the McLennan County Appraisal District. Applicable percentages were estimated bydetermining the portion of the taxing authorities' taxable assessed values that are within the City's boundaries and dividing it by the taxing authorities' total taxable assessed values.
Sources: McLennan County Appraisal District and the Municipal Advisory Council of Texas as of September 30, 2020.
DRAFT

286
City of Waco, Texas Pledged-Revenue Coverage
(Unaudited) Last Ten Fiscal Years
Water andLess: Net Revenue
Gross Operating Available forFiscal Year Revenue (1) Expenses (2) Debt Service
2011 (4) 65,111,936 34,030,334 31,081,602
2012 (4) 60,733,168 32,836,116 27,897,052
2013 (4) 62,795,257 34,036,064 28,759,193
2014 (4) 60,346,778 35,497,646 24,849,132
2015 (4) 59,514,895 36,477,205 23,037,690
2016 (4) 64,908,762 37,994,953 26,913,809
2017 (4) 72,367,283 39,791,567 32,575,716
2018 (4) 80,691,818 40,693,841 39,997,977
2019 (4) 86,515,694 45,386,875 41,128,819
2020 (4) 93,579,089 46,837,592 46,741,497
(1) Total revenue including interest.(2) Total operating expenses exclusive of depreciation.(3) Includes principal and interest of general obligation bonds reported in the water and wastewater funds.(4) Although City has no outstanding revenue bonds, a limited pledge (not to exceed $1,000) of surplus revenues of the City's water and wastewater system is used for security for certificates of obligation.
Source: Comprehensive Annual Financial Reports
DRAFT

287
Table XII
Wastewater Funds
Debt Service Requirements (3)Principal Interest Total
10,997,337 10,431,335 21,428,672 1.45 %
11,614,658 10,078,055 21,692,713 1.29 %
11,067,045 9,203,092 20,270,137 1.42 %
10,699,857 8,698,336 19,398,193 1.28 %
11,085,000 8,363,187 19,448,187 1.18 %
11,555,000 8,142,857 19,697,857 1.37 %
13,715,000 11,827,630 25,542,630 1.28 %
15,955,000 11,139,566 27,094,566 1.48 %
17,900,000 12,511,654 30,411,654 1.35 %
19,615,000 13,589,334 33,204,334 1.41 %
Coverage
DRAFT

288
DRAFT
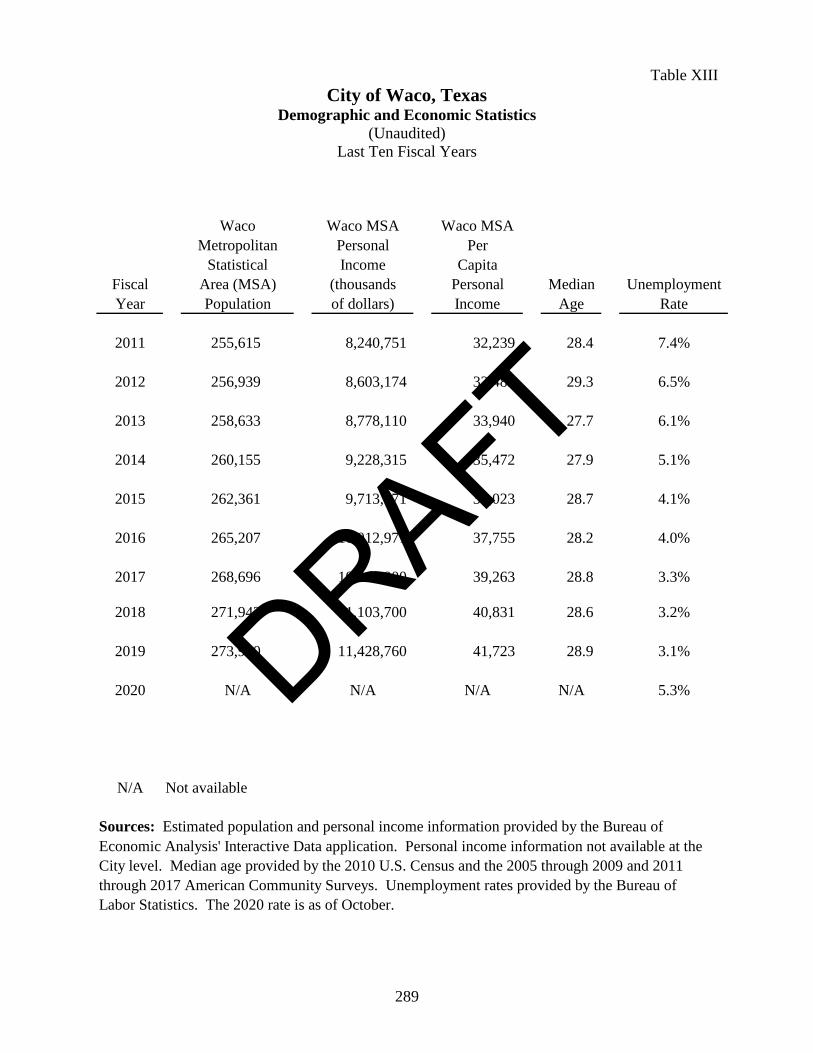
289
Table XIII City of Waco, Texas
Demographic and Economic Statistics (Unaudited)
Last Ten Fiscal Years
Waco Waco MSA Waco MSAMetropolitan Personal Per
Statistical Income CapitaFiscal Area (MSA) (thousands Personal Median UnemploymentYear Population of dollars) Income Age Rate
2011 255,615 8,240,751 32,239 28.4 7.4%
2012 256,939 8,603,174 33,483 29.3 6.5%
2013 258,633 8,778,110 33,940 27.7 6.1%
2014 260,155 9,228,315 35,472 27.9 5.1%
2015 262,361 9,713,471 37,023 28.7 4.1%
2016 265,207 10,012,971 37,755 28.2 4.0%
2017 268,696 10,549,900 39,263 28.8 3.3%
2018 271,942 11,103,700 40,831 28.6 3.2%
2019 273,920 11,428,760 41,723 28.9 3.1%
2020 N/A N/A N/A N/A 5.3%
N/A Not available
Sources: Estimated population and personal income information provided by the Bureau ofEconomic Analysis' Interactive Data application. Personal income information not available at theCity level. Median age provided by the 2010 U.S. Census and the 2005 through 2009 and 2011through 2017 American Community Surveys. Unemployment rates provided by the Bureau ofLabor Statistics. The 2020 rate is as of October.
DRAFT
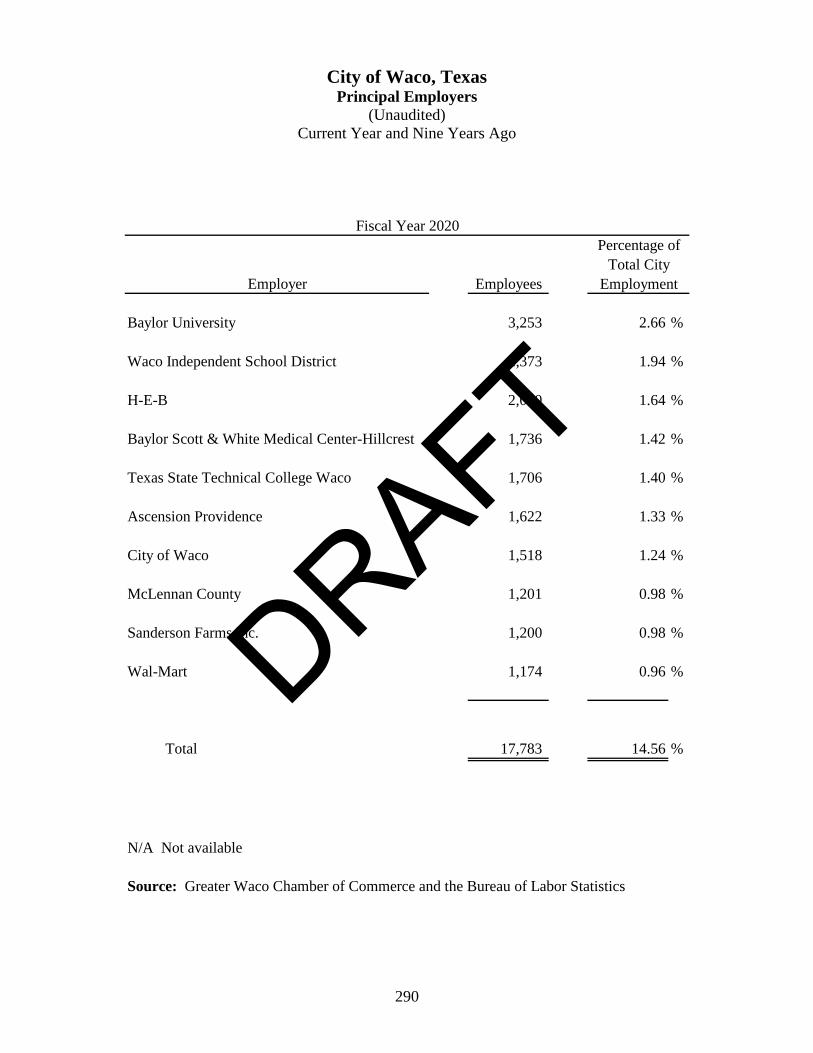
290
City of Waco, Texas Principal Employers
(Unaudited) Current Year and Nine Years Ago
Employer Employees
Baylor University 3,253 2.66 %
Waco Independent School District 2,373 1.94 %
H-E-B 2,000 1.64 %
Baylor Scott & White Medical Center-Hillcrest 1,736 1.42 %
Texas State Technical College Waco 1,706 1.40 %
Ascension Providence 1,622 1.33 %
City of Waco 1,518 1.24 %
McLennan County 1,201 0.98 %
Sanderson Farms Inc. 1,200 0.98 %
Wal-Mart 1,174 0.96 %
Total 17,783 14.56 %
N/A Not available
Source: Greater Waco Chamber of Commerce and the Bureau of Labor Statistics
Fiscal Year 2020Percentage of
EmploymentTotal City
DRAFT

291
Table XIV
Employer Employees
Providence Health Center 2,618 2.24 %
Baylor University 2,583 2.21 %
Wal-Mart Stores 2,561 2.19 %
Waco Independent School District 2,276 1.94 %
L-3 Platform Integration 2,079 1.78 %
Hillcrest Health System 1,793 1.53 %
City of Waco 1,506 1.29 %
H.E.B. Stores 1,500 1.28 %
Midway Independent School District 1,067 0.91 %
Sanderson Farms, Inc 1,041 0.89 %
Total 19,024 16.25 %
Percentage ofFiscal Year 2011
EmploymentTotal City
DRAFT

292
City of Waco, Texas Full-Time Equivalent City Government Employees by Function
(Unaudited) Last Ten Fiscal Years
2011 2012 2013 2014Function: General Government 128.73 129.26 142.78 144.80 Public Works 58.00 56.00 59.00 59.00 Public Safety 605.93 603.43 604.75 610.25 Culture and Recreation 196.31 189.18 185.45 185.45 Housing and Community Development 22.45 20.18 19.48 19.48 Public Health 86.75 86.55 82.55 83.00 Water 122.75 122.25 126.25 125.25 Wastewater/WMARSS 69.25 68.75 71.75 72.75 Solid Waste 103.00 101.00 99.00 96.00 Airport 13.77 13.77 13.77 13.77 Convention Services 34.38 33.63 33.20 35.71 Ranger Hall of Fame 15.50 15.50 15.50 15.50 Cameron Park Zoo 51.16 51.16 51.11 51.10 Cottonwood Creek Golf Course 15.96 15.96 15.96 13.00 Insurance/Risk Management 8.00 8.00 8.00 8.00 Engineering 24.00 24.00 24.00 24.00 Fleet Services 25.00 25.00 25.00 27.00
Total 1,580.94 1,563.62 1,577.55 1,584.06
General Government:City Manager's Office, Budget/Audit, Animal Shelter, City Secretary, Finance, Purchasing, Information Technology, Legal, Planning, Human Resources, Municipal Information, Facilities
Public WorksStreets and Street Reconstruction
Public SafetyMunicipal Court, Inspections, Traffic, Emergency Management, Fire, Police
Culture and RecreationLibrary, Parks and Recreation
HousingHousing, Neighborhoods, Community Development
Source: City of Waco Budget Office
DRAFT

293
Table XV
Fiscal Year
2015 2016 2017 2018 2019 2020
147.80 160.48 163.43 166.15 168.60 168.60 57.00 53.00 46.00 42.05 39.05 41.05
622.95 620.12 618.23 628.32 630.945 637.950 185.41 188.22 189.90 190.2226 189.8576 189.8576
20.19 19.62 19.04 18.38 19.78 19.78 81.50 80.50 81.50 81.50 87.20 88.20
123.25 123.68 123.31 119.795 120.49 120.49 72.75 73.32 74.83 76.34 76.51 76.51 93.50 90.00 91.39 90.0767 90.7167 90.7167 13.52 13.52 13.40 12.40 12.40 12.40 35.70 34.95 34.96 34.95 34.95 34.95 15.50 15.50 15.14 15.125 15.125 15.125 51.36 51.36 50.82 48.95 58.6462 61.5827 13.00 13.00 13.00 13.00 13.00 13.00 6.00 6.00 5.00 5.00 4.00 4.00
24.00 23.00 25.90 30.1133 32.1833 32.1833 27.00 27.00 29.00 28.95 28.95 28.95
1,590.43 1,593.27 1,594.85 1,601.32 1,622.40 1,635.35
DRAFT

294
City of Waco, Texas Operating Indicators by Function
(Unaudited) Last Ten Fiscal Years
2011 2012 2013 2014Function:Public Safety
PoliceNumber of Sworn Employees - Budgeted 245 245 246 247 Number of Traffic Citations 9,676 9,632 14,439 21,995 Number of Class "C" Citations 2,413 2,793 3,203 3,042 Calls Dispatched 106,233 109,216 113,593 109,718
FireNumber of Sworn Employees - Budgeted 195 195 195 201 Number of Fire Responses 9,257 9,657 9,565 8,893
Public WorksStreet Resurfacing (miles) 9.60 11.50 25.20 18.33
Culture and RecreationParks and Recreation
Number of Teams in Athletic Leagues 353 359 330 322 Number of Participants in Track/Field Events 292 210 305 340 Number of Participants in After School 3,586 3,758 4,060 4,391
LibraryVolumes in Collection 309,439 313,596 318,633 331,674
Water Number of Water Connections 43,078 43,297 44,336 44,912 Average Daily Water Consumption (gallons) 32,351,000 28,107,000 28,920,000 24,035,699 Maximum Storage Capacity (gallons) 42,150,000 42,150,000 42,150,000 42,150,000
Solid Waste (Residential)Refuse Collected (tons) 47,512 51,257 52,890 54,477 Bulky/Brush Pickups (tons) 6,956 7,940 5,847 7,381 Recyclables Collected (tons) 2,580 2,619 3,011 3,302
Golf CourseNumber of Paid Rounds Played 42,824 34,760 39,894 38,232
N/A Not available
Source: City of Waco Departments
DRAFT

295
Table XVI
Fiscal Year2015 2016 2017 2018 2019 2020
247 249 253 253 253 260 13,626 10,903 10,682 11,918 15,152 12,819
2,432 2,642 2,005 1,845 2,184 1,667 114,494 109,785 102,938 97,239 102,503 102,438
204 204 204 204 204 204 9,424 9,208 13,336 15,369 19,010 19,662
9.96 23.32 37.70 11.70 50.74 115.00
283 254 352 367 378 - 311 324 288 315 342 -
4,941 4,532 4,779 3,267 2,994 -
345,903 326,883 336,667 324,082 337,566 363,903
45,042 45,914 46,543 46,691 47,964 48,537 27,645,000 26,502,074 26,374,910 26,933,400 26,494,200 26,350,000 42,150,000 42,150,000 42,150,000 42,150,000 44,025,000 43,565,000
59,596 58,732 60,494 79,756 79,417 63,569 14,397 13,599 13,931 12,870 13,191 4,258
3,422 3,104 2,618 3,420 4,275 4,084
38,571 37,881 39,878 43,079 40,884 40,527
DRAFT

296
City of Waco, Texas Capital Asset Statistics by Function
(Unaudited) Last Ten Fiscal Years
2011 2012 2013 2014Function: Public safety Police: Stations 1 1 1 1 Staffed substations 4 4 3 3 Patrol units - equipped for arrest use 71 71 71 71 Fire stations 14 14 14 14
Highways and streets Streets - paved (miles) 600 599 603 604 Traffic control signals 194 195 198 198 Traffic beacons and flashers 102 105 108 110
Culture and recreation Parks acreage 1,235 1,235 1,271 1,271 Parks 46 46 46 56 Swimming pools 1 - - 1 Tennis courts 36 36 34 29 Community centers 5 5 5 5
Water Water mains (miles) 885 1,021 1,035 1,043 Fire hydrants 5,165 5,229 5,362 5,398 Maximum daily capacity (thousands of gallons) 75,000 75,000 75,000 75,000
Wastewater Sanitary sewers (miles) 747 843 846 850 Storm sewers (miles) 345 347 351 355 Maximum daily capacity (thousands of gallons) 37,800 46,500 46,500 46,500
N/A Not available
Source: City of Waco Departments
DRAFT

297
Table XVII
Fiscal Year2015 2016 2017 2018 2019 2020
1 1 1 1 1 1 2 2 2 2 2 2
74 80 90 71 76 76 14 14 13 13 13 13
605 609 612 620 624 628 198 182 182 197 190 185 116 100 106 100 85 95
1,266 1,266 1,655 1,655 1,655 1,748 56 56 56 56 56 66 1 1 3 3 3 3
29 29 29 28 28 30 5 5 6 6 6 6
1,042 1,051 1,076 1,087 1,091 1,110 5,457 5,522 5,663 5,744 5,778 5,851
75,000 75,000 75,000 75,000 75,000 75,000
852 866 874 884 887 891 358 362 367 371 372 384
46,500 46,500 46,500 46,500 46,500 46,500
DRAFT

298
DRAFT

City of Waco, Texas Compliance and Internal Control Reports
Under Government Auditing Standards, the Uniform Guidance, and Uniform Grant Management Standards of the State of Texas
Schedules of Expenditures of Federal and State Awards September 30, 2020
Discus
sion D
raft

City of Waco, Texas
Table of Contents
Page Independent Auditor’s Report on Internal Control Over Financial Reporting and on Compliance and Other Matters Based on an Audit of Financial Statements Performed in Accordance with Government Auditing Standards 1 Independent Auditor’s Reports on Compliance for Each Major Federal and State Program; on Internal Control Over Compliance; and on the Schedules of Federal and State Awards Required by the Uniform Guidance and Uniform Grant Management Standards of the State of Texas 3 Schedule of Findings and Questioned Costs 6 Summary Schedule of Prior Audit Findings 8 Schedule of Expenditures of Federal Awards 9 Schedule of Expenditures of State Awards 13 Notes to Schedules of Expenditures of Federal and State Awards 14
Discus
sion D
raft

1
INDEPENDENT AUDITOR’S REPORT ON INTERNAL CONTROL OVER FINANCIAL REPORTING AND ON COMPLIANCE AND OTHER MATTERS
BASED ON AN AUDIT OF FINANCIAL STATEMENTS PERFORMED IN ACCORDANCE WITH GOVERNMENT AUDITING STANDARDS
To the Honorable Mayor and Members of the City Council City of Waco, Texas: We have audited, in accordance with auditing standards generally accepted in the United States of America and the standards applicable to financial audits contained in Government Auditing Standards issued by the Comptroller General of the United States, the financial statements of the governmental activities, the business-type activities, the aggregate discretely presented component units, each major fund, and the aggregate remaining fund information of the City of Waco, Texas (the “City”), as of and for the year ended September 30, 2020, and the related notes to the financial statements, which collectively comprise the City’s basic financial statements, and have issued our report thereon dated February 9, 2021. The financial statements of Baylor Waco Stadium Authority (“BWSA”) were not audited in accordance with Government Auditing Standards, and accordingly, this report does not include reporting on internal control over financial reporting or compliance and other matters associated with BWSA. Internal Control Over Financial Reporting In planning and performing our audit of the financial statements, we considered the City’s internal control over financial reporting (“internal control”) as a basis for designing audit procedures that are appropriate in the circumstances for the purpose of expressing our opinions on the financial statements, but not for the purpose of expressing an opinion on the effectiveness of the City’s internal control. Accordingly, we do not express an opinion on the effectiveness of the City’s internal control. A deficiency in internal control exists when the design or operation of a control does not allow management or employees, in the normal course of performing their assigned functions, to prevent, or detect and correct, misstatements on a timely basis. A material weakness is a deficiency, or combination of deficiencies, in internal control, such that there is a reasonable possibility that a material misstatement of the City’s financial statements will not be prevented, or detected and corrected, on a timely basis. A significant deficiency is a deficiency, or a combination of deficiencies, in internal control that is less severe than a material weakness, yet important enough to merit attention by those charged with governance.
Discus
sion D
raft

2
Our consideration of internal control was for the limited purpose described in the first paragraph of this section and was not designed to identify all deficiencies in internal control that might be material weaknesses or significant deficiencies. Given these limitations, during our audit we did not identify any deficiencies in internal control that we consider to be material weaknesses. However, material weaknesses may exist that have not been identified. Compliance and Other Matters As part of obtaining reasonable assurance about whether the City’s financial statements are free from material misstatement, we performed tests of its compliance with certain provisions of laws, regulations, contracts, and grant agreements, noncompliance with which could have a direct and material effect on the financial statements. However, providing an opinion on compliance with those provisions was not an objective of our audit, and accordingly, we do not express such an opinion. The results of our tests disclosed no instances of noncompliance or other matters that are required to be reported under Government Auditing Standards. Purpose of this Report The purpose of this report is solely to describe the scope of our testing of internal control and compliance and the results of that testing, and not to provide an opinion on the effectiveness of the City’s internal control or on compliance. This report is an integral part of an audit performed in accordance with Government Auditing Standards in considering the City’s internal control and compliance. Accordingly, this communication is not suitable for any other purpose.
February 9, 2021
Discus
sion D
raft

3
INDEPENDENT AUDITOR’S REPORTS ON COMPLIANCE FOR EACH MAJOR FEDERAL AND STATE PROGRAM; ON INTERNAL CONTROL OVER COMPLIANCE; AND ON THE SCHEDULES OF EXPENDITURES
OF FEDERAL AND STATE AWARDS REQUIRED BY THE UNIFORM GUIDANCE AND UNIFORM GRANT MANAGEMENT STANDARDS OF THE STATE OF TEXAS
To the Honorable Mayor and Members of the City Council City of Waco, Texas: Report on Compliance for Each Major Federal and State Program We have audited the compliance of the City of Waco, Texas (the “City”) with the types of compliance requirements described in the U.S. Office of Management and Budget (“OMB”) Compliance Supplement and the Uniform Grant Management Standards of the State of Texas that could have a direct and material effect on each of the City’s major federal and state programs for the year ended September 30, 2020. The City’s major federal and state programs are identified in the summary of auditor’s results section of the accompanying schedule of findings and questioned costs.
Management’s Responsibility Management is responsible for compliance with federal and state statutes, regulations, and the terms and conditions of its federal and state awards applicable to its federal and state programs.
Auditor’s Responsibility Our responsibility is to express an opinion on compliance for each of the City’s major federal and state programs based on our audit of the types of compliance requirements referred to above. We conducted our audit of compliance in accordance with auditing standards generally accepted in the United States of America; the standards applicable to financial audits contained in Government Auditing Standards, issued by the Comptroller General of the United States; the audit requirements of Title 2 U.S. Code of Federal Regulations Part 200, Uniform Administrative Requirements, Cost Principles, and Audit Requirements for Federal Awards (“Uniform Guidance”), and the Uniform Grant Management Standards of the State of Texas. Those standards and the Uniform Guidance require that we plan and perform the audit to obtain reasonable assurance about whether noncompliance with the types of compliance requirements referred to above that could have a direct and material effect on a major federal or state program occurred. An audit includes examining, on a test basis, evidence about the City’s compliance with those requirements and performing such other procedures as we considered necessary in the circumstances.
Discus
sion D
raft

4
We believe that our audit provides a reasonable basis for our opinion on compliance for each major federal and state program. However, our audit does not provide a legal determination of the City’s compliance. Opinion on Each Major Federal and State Program In our opinion, the City complied, in all material respects, with the types of compliance requirements referred to above that could have a direct and material effect on each of its major federal and state programs for the year ended September 30, 2020. Report on Internal Control Over Compliance Management of the City is responsible for establishing and maintaining effective internal control over compliance with the types of compliance requirements referred to above. In planning and performing our audit of compliance, we considered the City’s internal control over compliance with the types of requirements that could have a direct and material effect on each major federal or state program to determine the auditing procedures that are appropriate in the circumstances for the purpose of expressing an opinion on compliance for each major federal and state program, and to test and report on internal control over compliance in accordance with the Uniform Guidance and Uniform Grant Management Standards of the State of Texas, but not for the purpose of expressing an opinion on the effectiveness of internal control over compliance. Accordingly, we do not express an opinion on the effectiveness of the City’s internal control over compliance. A deficiency in internal control over compliance exists when the design or operation of a control over compliance does not allow management or employees, in the normal course of performing their assigned functions, to prevent, or detect and correct, noncompliance with a type of compliance requirement of a federal or state program on a timely basis. A material weakness in internal control over compliance is a deficiency, or combination of deficiencies, in internal control over compliance, such that there is a reasonable possibility that material noncompliance with a type of compliance requirement of a federal or state program will not be prevented, or detected and corrected, on a timely basis. A significant deficiency in internal control over compliance is a deficiency, or a combination of deficiencies, in internal control over compliance with a type of compliance requirement of a federal or state program that is less severe than a material weakness in internal control over compliance, yet important enough to merit attention by those charged with governance. Our consideration of internal control over compliance was for the limited purpose described in the first paragraph of this section and was not designed to identify all deficiencies in internal control over compliance that might be material weaknesses or significant deficiencies. We did not identify any deficiencies in internal control over compliance that we consider to be material weaknesses. However, material weaknesses may exist that have not been identified. The purpose of this report on internal control over compliance is solely to describe the scope of our testing of internal control over compliance and the results of that testing based on the requirements of the Uniform Guidance and Uniform Grant Management Standards of the State of Texas. Accordingly, this report is not suitable for any other purpose.
Discus
sion D
raft

5
Report on Schedules of Expenditures of Federal and State Awards Required by the Uniform Guidance and Uniform Grant Management Standards of the State of Texas We have audited the financial statements of the governmental activities, the business-type activities, the aggregate discretely presented component units, each major fund, and the aggregate remaining fund information of the City of Waco, Texas, as of and for the year ended September 30, 2020, and the related notes to the financial statements, which collectively comprise the City’s basic financial statements. We have issued our report thereon dated February 9, 2021, which contained unmodified opinions on those financial statements. Our audit was conducted for the purpose of forming opinions on the financial statements that collectively comprise the basic financial statements. The accompanying schedules of expenditures of federal and state awards are presented for purposes of additional analysis as required by the Uniform Guidance and Uniform Grant Management Standards of the State of Texas, and are not a required part of the basic financial statements. Such information is the responsibility of management and was derived from and relates directly to the underlying accounting and other records used to prepare the basic financial statements. The information has been subjected to the auditing procedures applied in the audit of the financial statements and certain additional procedures, including comparing and reconciling such information directly to the underlying accounting and other records used to prepare the basic financial statements or to the basic financial statements themselves, and other additional procedures in accordance with auditing standards generally accepted in the United States of America. In our opinion, the schedules of expenditures of federal and state awards are fairly stated, in all material respects, in relation to the basic financial statements as a whole. February 9, 2021
Discus
sion D
raft

6
City of Waco, Texas
Schedule of Findings and Questioned Costs
Year Ended September 30, 2020
(1) Summary of Auditors' Results
Financial Statements
Type of auditor's report issued: unmodifiedInternal control over financial reporting: о Material weakness(es) identified? yes x no о Significant deficiency(ies) identified? yes x none reportedNoncompliance material to financial statements noted? yes x no
Federal Awards
Internal control over major programs: о Material weakness(es) identified? yes x no о Significant deficiency(ies) identified? yes x none reportedType of auditor's report issued on compliance for major programs: unmodifiedAny audit findings disclosed that are required to be reported in accordance with 2 CFR 200.516(a) ? yes x no
State Awards
Internal control over major programs: о Material weakness(es) identified? yes x no о Significant deficiency(ies) identified? yes x none reportedType of auditor's report issued on compliance for major programs: unmodifiedAny audit findings disclosed that are required to be reported in accordance with the Uniform Grant Management Standards? yes x no
Identification of major federal programs:
Name of Federal Program or ClusterAirport Improvement ProgramCOVID-19 - Airport Improvement ProgramCOVID-19 - Coronavirus Relief Fund
CFDA Number20.106
21.01920.106
Discus
sion D
raft

7
City of Waco, Texas
Schedule of Findings and Questioned Costs (Continued)
(1) Summary of Auditors' Results (continued)Identification of major state programs:
Name of State Program or ClusterTexas Anti-Gang ProgramTexas Anti-Gang Program
Dollar threshold used to distinguish between type A and type B federal programs: $Dollar threshold used to distinguish between type A and type B state programs: $
Auditee qualified as federal low-risk auditee? x yes noAuditee qualified as state low-risk auditee? x yes no
750,000
300,000
Grant Number
37482023748201
(2) Financial Statement Findings None noted.
(3) Federal Award Findings and Questioned Costs None noted.
(4) State Award Findings and Questioned Costs None noted.
Discus
sion D
raft

8
City of Waco, Texas
Summary Schedule of Prior Audit Findings
September 30, 2020 None
Discus
sion D
raft

9
City of Waco, Texas
Schedule of Expenditures of Federal Awards
Year Ended September 30, 2020
Passed TotalGrantor/Pass-Through CFDA Grantor / Pass Through Through to FederalGrantor/Program or Cluster/Title Number Grantor Identifying Number Subrecipients Expenditures
U.S. Department of Agriculture Passed through the Texas Health and Human Services Commission: Supplemental Food Program for Women, Infants and Children 10.557 2017-049805-001 $ - $ 1,078,819 Peer for Women, Infants and Children 10.557 2017-049805-001 - 135,180 Extra for Women, Infants and Children 10.557 2017-049805-001 - 154,166 COVID-19 10.557 2017-049805-001 - 9,816 Registered Dietician 10.557 2017-049805-001 - 104,047 Clinical Lactation Practicum 10.557 2017-049805-001 - 61,729 Total passed through the Texas Health and Human Services Commission - 1,543,757
Supplemental Nutrition Assistance Program (SNAP) Cluster: Passed through the Texas Health and Human Services Commission: SNAP-ED for Women, Infants, and Children 10.561 2017-049805-001 - 20,000
Passed through the Texas Department of State Health Services Obesity Prevention Program 10.561 HHS000743500006 - 11,371 Total SNAP Cluster - 31,371
Total U.S. Department of Agriculture - 1,575,128
U.S. Department of Housing and Urban Development Direct Programs: CDBG - Entitlement Grants Cluster: COVID-19 Community Development Block Grant 14.218 B20MW480029 - 237,817 Community Development Block Grant 14.218 B-15,16,17, 18,19-MC-48-0029 525,592 1,322,837 Total CDBG Entitlement Grants Cluster 525,592 1,560,654
HOME Investment Partnership Program 14.239 M-15,16,17, 18,19-MC-48-0202 323,735 642,823 HOME Investment Partnership Program 14.239 loan program - non cash assistance - 3,059,480
323,735 3,702,303
Continuum of Care Grant: Continuum of Care 14.267 TX0240L6T041810 - 16,320 Continuum of Care 14.267 TX0240L6T041709 - 763
- 17,083
Lead Based Paint Hazard Reduction 14.900 TXLHB0703-18 - 193,727
Total Direct Programs 849,327 5,473,767
Passed through the Brazos Valley Council of Governments: Housing Opportunities for Persons with AIDS (HOPWA) 14.241 5607/4-553-01 - 3,777 Housing Opportunities for Persons with AIDS (HOPWA) 14.241 5607/3-553-03 - 33,148 Total passed through the Brazos Valley Council of Governments - 36,925
Passed through the Heart of Texas Homeless Coalition: Continuum of Care 2018 14.267 TX0527L6T041800 - 40,959 Continuum of Care 2017 14.267 TX0499L6T041700 - 1,412 Total passed through the Heart of Texas Homeless Coalition - 42,371
Total U.S. Department of Housing and Urban Development 849,327 5,553,063
U.S. Department of Justice Direct Programs: COVID-19 - JAG 2020 Coronavirus Emergency Assistance 16.034 2020-VD-BX-0718 - 120,645
- 120,645
JAG 2018 Byrne Justice Assistance 16.738 2018-DJ-BX-0861 1,121 28,262 JAG 2019 Byrne Justice Assistance 16.738 2019-DJ-BX-0366 7,837 29,690
8,958 57,952
Total Direct Programs 8,958 178,597
Discus
sion D
raft

10
City of Waco, Texas
Schedule of Expenditures of Federal Awards (Continued)
Passed TotalGrantor/Pass-Through CFDA Grantor / Pass Through Through to FederalGrantor/Program or Cluster/Title Number Grantor Identifying Number Subrecipients Expenditures
U.S. Department of Justice (continued) Passed through the State Governor's Office - Criminal Justice Division: COVID-19 - Coronavirus Emergency Supplemental Funding Program 16.034 4158801 $ - $ 1,394 JAG DJ Edward Byrne Memorial 16.738 3951301 - 218,858 Waco Family Violence Unit Detectives & Coordinator 16.588 2868005 - 63,383 Waco Family Violence Unit Detectives & Coordinator/18 16.588 2868006 - 14,351 Total passed through the State Governor's Office - Criminal Justice Division - 297,986
Total U.S. Department of Justice 8,958 476,583
U.S. Department of Transportation Direct Programs: Airport Improvement Program (FAA) 20.106 3-48-0220-042-2019 - 29,267 Airport Improvement Program (FAA) 20.106 3-48-0220-044-2019 - 1,078,343 Airport Improvement Program (FAA) 20.106 3-48-0220-045-2020 - 28,367 COVID-19 - Airport Improvement Program (FAA) 20.106 3-48-0220-046-2020 - 1,499,915 Airport Improvement Program (FAA) 20.106 3-48-0020-039-2018 - 43,496 Airport Improvement Program (FAA) 20.106 3-48-0220-040-2018 - 10,486 Airport Improvement Program (FAA) 20.106 3-48-0220-041-2018 - 67,195
- 2,757,069
Federal Transit Cluster: COVID-19 - Federal Transit Urbanized Area Formula Grant 20.507 TX-2020-174-00 - 2,666,240 Federal Transit Urbanized Area Formula Grant 20.507 TX-2020-079-00 - 1,147,724 Federal Transit Urbanized Area Formula Grant 20.507 TX-2018-088-00 - 48,362 Federal Transit Bus and Bus Facilities Program 20.526 TX-2019-099-00 - 1,158,020
- 5,020,346
Total Direct Programs - 7,777,415
Passed through the Texas Department of Transportation: Highway Planning and Construction Cluster: Metropolitan Planning Grant - FHWA-PL 112 20.205 50-20XF0007 - 442,685 11th/12th St Gurley Lane Bike/Ped Infrastructure 20.205 CSJ#0909-22-181 - 155,973 Total Highway Planning and Construction Cluster - 598,658
Transit Services Programs Cluster: Enhanced Mobility of Seniors - Individuals with Disabilities 20.513 ED2021(09) 074_19 - 6,606 Enhanced Mobility of Seniors - Individuals with Disabilities 20.513 ED1903(09) 059_18 - 11,939 Enhanced Mobility of Seniors - Individuals with Disabilities 20.513 ED1906(09) 054_17 - 231,269 Total Transit Services Program Cluster - 249,814
Highway Safety Cluster: Selective Traffic Enforcement Program 20.600 2020-WACOPD-S-1YG-00022 - 107,731 Total Highway Safety Cluster - 107,731
Total passed through Texas Department of Transportation - 956,203
Total U.S. Department of Transportation - 8,733,618
Discus
sion D
raft

11
City of Waco, Texas
Schedule of Expenditures of Federal Awards (Continued)
Passed Total
Grantor/Pass-Through CFDA Grantor / Pass Through Grantor Through to FederalGrantor/Program or Cluster/Title Number Identifying Number Subrecipients Expenditures
U.S. Department of Treasury Passed through the Texas Division of Emergency Management: COVID-19 - Texas Intrastate Fire Mutual Aid System 21.019 200085 $ - $ 19,491
COVID-19 - Coronavirus Relief Fund 21.019 245 - 7,662,820
Total passed through the Texas Division of Emergency Management - 7,682,311
Total U.S. Department of Treasury - 7,682,311
Institute of Museum and Library Services Passed through the Texas State Library & Archives Commission:
Interlibrary Loan Reimbursement Program 45.310 901562 - 13,665
Total passed through the Texas State Library & Archives Commission - 13,665
Total Institute of Murseum and Library Services - 13,665
U.S. Department of Health and Human Services Passed through the Texas Department of State Health Services:
CPS-Bioterrorism Preparedness 93.069 537-18-0150-00001 - 132,909 CPS-Bioterrorism Preparedness 93.069 537-18-0150-00001 #4 - 44,214 CPS-Bioterrorism Preparedness 93.074 537-18-0150-00001 - 3,581
- 180,704
Tuberculosis Prevention and Control - Federal 93.116 HHS000686100026 - 18,539 Tuberculosis Prevention and Control - Federal 93.116 HHS000036000018 - 9,106
- 27,645
Immunizations Branch - Locals 93.268 HHS0000119700015 Amend#2 - 26,668 Immunizations Branch - Locals 93.268 HHS0000119700015 Amend#1 - 118,204
- 144,872
COVID-19 - CPS 93.354 HHS000772300001 - 109,882 - 109,882
TEXAS Healthy Communities 93.758 HHS000438400008 Amend #1 - 4,037 TEXAS Healthy Communities 93.758 HHS000438400008 - 40,609
- 44,646
HIV Prevention 93.940 HHS000077800025 - 117,946 - 117,946
RLSS - Local Public Health System 93.991 HHS000485600005 - 23,209 RLSS - Local Public Health System 93.991 HHS000485600005 - 80,460
- 103,669
Healthy Babies 93.994 537-18-0364-00001 Amend #2 - 88,453 - 88,453
Total passed through the Texas Department of State Health Services - 817,817
Passed through the Brazos Valley Council of Governments: Ryan White Part B Service Delivery (RWSD) 93.917 5608/3-553-04 - 203,576 Ryan White Part B Service Delivery (RWSD) 93.917 5608/4-553-01 - 157,248 State-R 93.917 5608/SR2-553-01 - 63,024 COVID-19 - Ryan White CARES 93.917 5608/4-553-01C - 15,810 State-R 93.917 5608/SR-553-02 - 59,917 Total passed through the Brazos Valley Council of Governments - 499,575
Discus
sion D
raft

12
City of Waco, Texas
Schedule of Expenditures of Federal Awards (Continued)
Passed TotalGrantor/Pass-Through CFDA Grantor / Pass Through Grantor Through to FederalGrantor/Program or Cluster/Title Number Identifying Number Subrecipients Expenditures
U.S. Department of Health and Human Services (continued) Passed through Texas Health and Human Services Commission: Medicaid Cluster: Title XIX Medicaid Administrative Claiming 93.778 HHS000537900178 $ - $ 198,874
Total passed through Texas Health and Human Services Commission - 198,874
Total U.S. Department of Health and Human Services - 1,516,266
U. S. Department of Homeland Security Passed through the State Department of Public Safety: Emergency Management Performance Grant 97.042 EMT-2020-EP-00004 - 50,908
Total passed through the State Department of Public Safety - 50,908
Passed through the Texas Office of the Governor Homeland Security Grants Division: 2019 State Homeland Security Program 97.067 3725701 - 34,300 2019 State Homeland Security Program 97.067 EMW 2019 SS 00034 S01 - 30,191 Total passed through the Texas Office of the Governor Homeland Security Grants Division - 64,491
Total U.S. Department of Homeland Security - 115,399
Total Expenditures of Federal Awards $ 858,285 $ 25,666,033
See accompanying notes to schedules of expenditures of federal and state awards.
Discus
sion D
raft
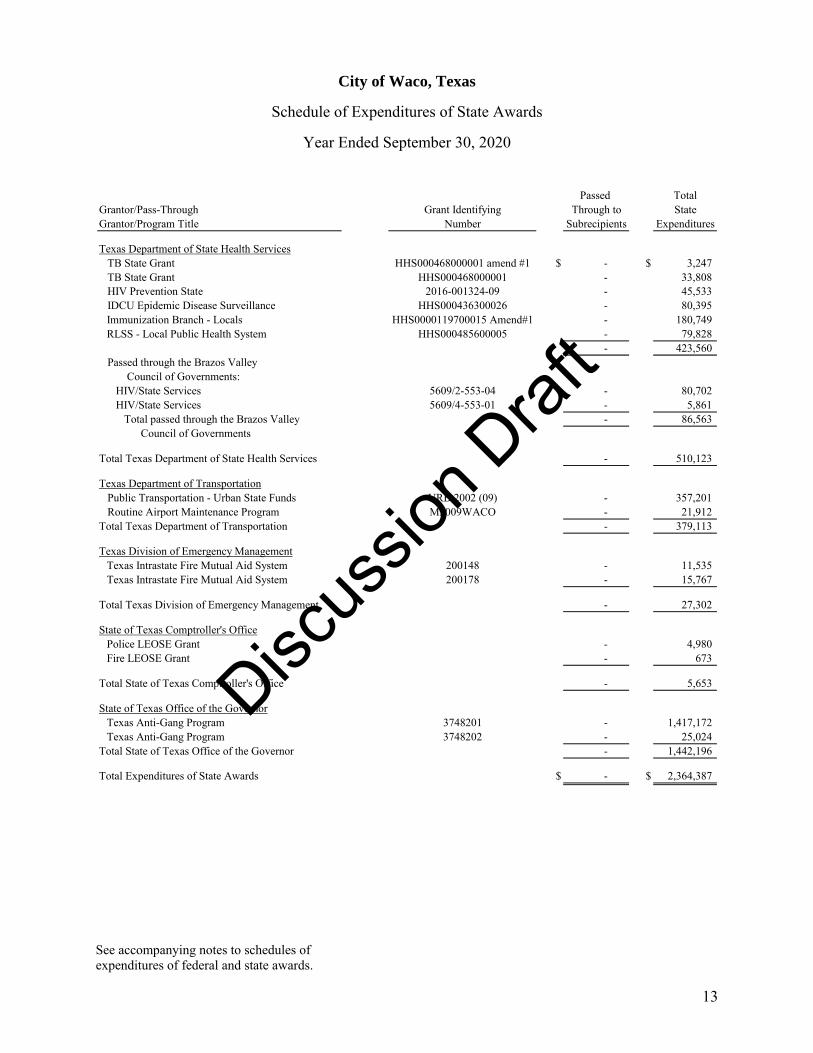
13
City of Waco, Texas
Schedule of Expenditures of State Awards
Year Ended September 30, 2020
Passed TotalGrantor/Pass-Through Grant Identifying Through to StateGrantor/Program Title Number Subrecipients Expenditures
Texas Department of State Health Services TB State Grant HHS000468000001 amend #1 $ - $ 3,247 TB State Grant HHS000468000001 - 33,808 HIV Prevention State 2016-001324-09 - 45,533 IDCU Epidemic Disease Surveillance HHS000436300026 - 80,395
Immunization Branch - Locals HHS0000119700015 Amend#1 - 180,749 RLSS - Local Public Health System HHS000485600005 - 79,828
- 423,560 Passed through the Brazos Valley Council of Governments: HIV/State Services 5609/2-553-04 - 80,702 HIV/State Services 5609/4-553-01 - 5,861 Total passed through the Brazos Valley - 86,563 Council of Governments
Total Texas Department of State Health Services - 510,123
Texas Department of Transportation Public Transportation - Urban State Funds URB 2002 (09) - 357,201 Routine Airport Maintenance Program M2009WACO - 21,912 Total Texas Department of Transportation - 379,113
Texas Division of Emergency ManagementTexas Intrastate Fire Mutual Aid System 200148 - 11,535 Texas Intrastate Fire Mutual Aid System 200178 - 15,767
Total Texas Division of Emergency Management - 27,302
State of Texas Comptroller's OfficePolice LEOSE Grant - 4,980 Fire LEOSE Grant - 673
Total State of Texas Comptroller's Office - 5,653
State of Texas Office of the GovernorTexas Anti-Gang Program 3748201 - 1,417,172 Texas Anti-Gang Program 3748202 - 25,024
Total State of Texas Office of the Governor - 1,442,196
Total Expenditures of State Awards $ - $ 2,364,387
See accompanying notes to schedules of expenditures of federal and state awards.
Discus
sion D
raft

14
City of Waco, Texas
Notes to Schedules of Expenditures of Federal and State Awards
Year Ended September 30, 2020
(1) Basis of Presentation The accompanying schedules of expenditures of federal and state awards (the “Schedules”)
include the federal and state award activity of the City of Waco, Texas (the “City”) under programs of federal and state governments for the year ended September 30, 2020. The information in these Schedules is presented in accordance with the requirements of Title 2 U.S. Code of Federal Regulations Part 200, Uniform Administrative Requirements, Cost Principles, and Audit Requirements for Federal Awards (“Uniform Guidance”), and Uniform Grant Management Standards of the State of Texas. Because the Schedules present only a selected portion of the operations of the City, they are not intended to and do not present the financial position, changes in net position, or cash flows of the City.
(2) Summary of Significant Accounting Policies Expenditures reported in the accompanying Schedules are reported on the accrual basis of
accounting. Such expenditures are recognized following the cost principles contained in Uniform Guidance, and “frequently asked questions” (“FAQs”) and other guidance issued by the U.S. Department of the Treasury, wherein certain types of expenditures are not allowable or limited as to reimbursement. Negative amounts shown on the schedule represent adjustments or credits made in the normal course of business to amounts reported as expenditures in prior years. Grantor and pass-through grantor identifying numbers are presented where available.
(3) Indirect Cost Rate The City has elected not to use the 10% de minimis indirect cost rate allowed under the
Uniform Guidance. (4) Federal Loan Program The federal loan program listed as non-cash assistance on the accompanying schedule of
federal awards is administered directly by the City, and balances and transactions relating to this program are included in the City’s basic financial statements. Loans outstanding at the beginning of the year and loans made during the year are included in the federal expenditures presented in the Schedules. The balance of loans outstanding at September 30, 2020 consists of the following:
Discus
sion D
raft

15
City of Waco, Texas
Notes to Schedules of Expenditures of Federal and State Awards (Continued)
(4) Federal Loan Program (continued)
OutstandingBalance at
CFDA Number Program Name September 30, 2020
14.239 HOME Investment Partnership Program 2,941,950$
Discus
sion D
raft

City of Waco, Texas Independent Auditor’s Report on Compliance and
Report on Internal Control over Compliance in Accordance with the Passenger Facility Charge
Audit Guide for Public Agencies Schedule of Passenger Facility
Charges Collected and Expended September 30, 2020
DRAFT

City of Waco, Texas
Table of Contents
Page Independent Auditor’s Report on Compliance and on Internal Control Over Compliance in Accordance with the Passenger Facility Charge Audit Guide for Public Agencies 1 Schedule of Passenger Facility Charges Collected and Expended 4 Notes to Schedule of Passenger Facility Charges Collected and Expended 7 Passenger Facility Charge Audit Summary 10
DRAFT

INDEPENDENT AUDITOR’S REPORT ON COMPLIANCE AND ON INTERNAL CONTROL OVER COMPLIANCE
IN ACCORDANCE WITH THE PASSENGER FACILITY CHARGE AUDIT GUIDE FOR PUBLIC AGENCIES
To the Honorable Mayor and Members of the City Council City of Waco, Texas: Report on Compliance for Passenger Facility Charge Program We have audited the City of Waco, Texas’ (the “City”) compliance with the types of compliance requirements described in the Passenger Facility Charge Audit Guide for Public Agencies (the “Guide”), issued by the Federal Aviation Administration, that could have a direct and material effect on its passenger facility charge program for the year ended September 30, 2020. Management’s Responsibility Management is responsible for compliance with the requirements of laws, regulations, contracts, and grants applicable to the passenger facility charge program. Auditor’s Responsibility Our responsibility is to express an opinion on compliance for the City’s passenger facilities charge program based on our audit of the types of compliance requirements referred to above. We conducted our audit of compliance in accordance with auditing standards generally accepted in the United States of America; the standards applicable to financial audits contained in Government Auditing Standards, issued by the Comptroller General of the United States; and the Guide. Those standards and the Guide require that we plan and perform the audit to obtain reasonable assurance about whether noncompliance with the types of compliance requirements referred to above that could have a direct and material effect on the passenger facility charge program occurred. An audit includes examining, on a test basis, evidence about the City’s compliance with those requirements and performing such other procedures as we considered necessary in the circumstances.
DRAFT

2 Auditor’s Responsibility (continued) We believe that our audit provides a reasonable basis for our opinion on compliance for the City’s passenger facilities charge program. However our audit does not provide a legal determination on the City’s compliance. Opinion In our opinion, the City complied, in all material respects, with the compliance requirements referred to above that could have a direct and material effect on its passenger facility charge program for the year ended September 30, 2020. Report on Internal Control over Compliance Management of the City is responsible for establishing and maintaining effective internal control over compliance with the types of compliance requirements referred to above. In planning and performing our audit of compliance, we considered the City’s internal control over compliance with the types of requirements that could have a direct and material effect on the passenger facility charge program to determine the auditing procedures that are appropriate in the circumstances for the purpose of expressing an opinion on compliance and to test and report on internal control over compliance in accordance with the Guide, but not for the purpose of expressing an opinion on the effectiveness of internal control over compliance. Accordingly, we do not express an opinion on the effectiveness of the City’s internal control over compliance. A deficiency in internal control over compliance exists when the design or operation of a control over compliance does not allow management or employees, in the normal course of performing their assigned functions, to prevent, or detect and correct, noncompliance with a type of compliance requirement on a timely basis. A material weakness in internal control over compliance is a deficiency, or combination of deficiencies, in internal control over compliance, such that there is a reasonable possibility that material noncompliance with a type of compliance requirement will not be prevented, or detected and corrected, on a timely basis. A significant deficiency in internal control over compliance is a deficiency, or a combination of deficiencies, in internal control over compliance with a type of compliance requirement that is less severe than a material weakness in internal control over compliance, yet important enough to merit attention by those charged with governance. Our consideration of internal control over compliance was for the limited purpose described in the first paragraph of this section and was not designed to identify all deficiencies in internal control over compliance that might be material weaknesses or significant deficiencies. We did not identify any deficiencies in internal control over compliance that we consider to be material weaknesses. However, material weaknesses may exist that have not been identified. The purpose of this report on internal control over compliance is solely to describe the scope of our testing of internal control over compliance and the results of that testing based on the Guide. Accordingly, this report is not suitable for any other purpose.
DRAFT

3 Report on Schedule of Passenger Facility Charges Collected and Expended, and the Passenger Facility Charge Audit Summary We have audited the financial statements of the governmental activities, the business-type activities, the aggregate discretely presented component units, each major fund, and the aggregate remaining fund information of the City as of and for the year ended September 30, 2020, and have issued our report thereon dated February 9, 2021. Our audit was performed for the purpose of forming opinions on the financial statements that collectively comprise the City’s basic financial statements. The accompanying schedule of passenger facility charges collected and expended on pages 4 through 6 is presented for purposes of additional analysis as specified in the Guide and is not a required part of the basic financial statements. Such information is the responsibility of management and was derived from and relates directly to the underlying accounting and other records used to prepare the basic financial statements. The information has been subjected to the auditing procedures applied in the audit of the financial statements and certain additional procedures, including comparing and reconciling such information directly to the underlying accounting and other records used to prepare the basic financial statements or to the basic financial statements themselves, and other additional procedures in accordance with auditing standards generally accepted in the United States of America. In our opinion, the schedule of passenger facility charges collected and expended is fairly stated in all material respects in relation to the basic financial statements taken as whole. The passenger facility charge audit summary on page 10 has not been subjected to the auditing procedures applied in the audit of the basic financial statements and, accordingly, we express no opinion on it.
February 9, 2021 DRAFT

4
Cumulative CumulativeProgram Total Program Total
Through Quarter 1 Quarter 2 Quarter 3 Quarter 4 Year Ended ThroughSeptember 30, Oct. - Dec. Jan. - Mar. Apr. - June July - Sept. September 30, September 30,
2019 2019 2020 2020 2020 2020 2020
Receipts: Collections $ $5,661,551 $71,590 $52,216 $38,923 $13,748 176,477 5,838,028 Interest $13,498 $76 $470 $39 $45 630 14,128
Total receipts 5,675,049 71,666 52,686 38,962 13,793 177,107 5,852,156
Disbursements: Total for Application 95-01-C-00-ACT (closed) 581,258 - - - - - 581,258
Application 98-02-C-00-ACT (closed) Project 2.1 - Terminal Renovation and Expansion 1,831,793 - - - - - 1,831,793 Project 2.2 - PFC Administrative Costs 25,400 - - - - - 25,400 Total for Application 98-02-C-00-ACT (closed) 1,857,193 - - - - - 1,857,193
Application 07-03-C-00-ACT (closed)Project 3.01 - Rehabilitate Apron 75,325 - - - - - 75,325 Project 3.02 - Rehabilitate Parking Lot 31,219 - - - - - 31,219 Project 3.03 - Acquire ARFF Vehicle 46,502 - - - - - 46,502 Project 3.04 - Acquire ARFF Building 180,910 - - - - - 180,910 Project 3.05 - Improve Runway Safety Area 133,652 - - - - - 133,652 Project 3.06 - Improve Access Road 9,000 - - - - - 9,000 Project 3.07 - Improve Airport Drainage 24,765 - - - - - 24,765 Project 3.08 - Install Runway Guidance System 898 - - - - - 898 Project 03.09 - Improve Pass.Terminal 25,800 - - - - - 25,800 Project 03.10 - Expand Aircraft Apron 27,991 - - - - - 27,991 Project 03.11 - Strenghten Runway 3,817 - - - - - 3,817 Project 03.12 - Enhance Airport Security 80,376 - - - - - 80,376 Project 03.14 - PFC Application 28,000 - - - - - 28,000
Total for Application 07-03-C-00-ACT (closed) 668,255 - - - - - 668,255
City of Waco, Texas
Schedule of Passenger Facility Charges Collected and Expended
Year Ended September 30, 2020
DRAFT

5
Cumulative CumulativeProgram Total Program Total
Through Quarter 1 Quarter 2 Quarter 3 Quarter 4 Year Ended ThroughSeptember 30, Oct. - Dec. Jan. - Mar. Apr. - June July - Sept. September 30, September 30,
2019 2019 2020 2020 2020 2020 2020
Application 09-04-C-00-ACTProject 04-001 - Holdroom Expansion $ 148,023 - - - - - 148,023 Project 04-002 - Runway Safety Area 499,716 - - - - - 499,716 Project 04-003 - Passenger Boarding Bridges 59,748 - - - - - 59,748 Project 04-004 - ARFF Suit Purchase 11,429 - - - - - 11,429 Project 04-005 - PFC Preparation 30,000 - - - - - 30,000
Total for Application 09-04-C-00-ACT 748,916 - - - - - 748,916
Application 12-05-C-00-ACTProject 05-001 - Passenger Loading Bridges 10,929 - - - - - 10,929 Project 05-002 - Taxiway Rehabilitation - Phase 1 120,780 - - - - - 120,780 Project 05-003 - Apron Rehabilitation - Phase 1 59,130 - - - - - 59,130 Project 05-004 - PFC Preparation 37,000 - - - - - 37,000 Project 05-005 - Taxiway Rehabilitation - Phase 2 233,333 - - - - - 233,333 Project 05-006 - Apron Rehabilitation - Phase 2 366,342 - - - - - 366,342
Total for Application 12-05-C-00-ACT 827,514 - - - - - 827,514
Application 15-06-C-00-ACTProject 06-001-Design Taxiway Bravo Realignment 41,815 - - - - - 41,815 Project 06-002-Construct Taxiway Bravo-Phase 1 631,806 - - - - - 631,806 Project 06-003-PFC Application Cost 19,000 - - - - - 19,000
Total for Application 15-06-C-00-ACT 692,621 - - - - - 692,621
Application 18-07-C-00-ACTProject 07-001-ARFF Vehicle 84,798 1,646 - - - 1,646 86,444 Project 07-002-Recon Apron, Phase III Design 22,490 1,547 - - (755) 792 23,282 Project 07-003-PFC Update (Application & Admin) 25,500 - - - - - 25,500
Total for Application 18-07-C-00-ACT 132,788 3,193 - - (755) 2,438 135,226
Application 19-08-C-00-ACTProject 08-001 Land - PRZ RW 14 - - - 34,610 4,727 39,337 39,337 Project 08-002 Rehab Terminal (Electric Design) - - - - - - - Project 08-003 Construct Service Road 166,504 68,473 52,686 4,352 - 125,511 292,015
Schedule of Passenger Facility Charges Collected and Expended(Continued)
City of Waco, Texas
DRAFT

6
Cumulative CumulativeProgram Total Program Total
Through Quarter 1 Quarter 2 Quarter 3 Quarter 4 Year Ended ThroughSeptember 30, Oct. - Dec. Jan. - Mar. Apr. - June July - Sept. September 30, September 30,
2019 2019 2020 2020 2020 2020 2020 Application 19-08-C-00-ACT (continued)
Project 08-004 Extend Service Road - - - - - - - Project 08-005 Pavement Management Program - - - - - - - Project 08-006 Rehab Terminal (Electric Constr) - - - - - - - Project 08-007 Reconst Taxiway C (Design) - - - - - - - Project 08-008 Impr Drainage Phase I (Design) - - - - - - - Project 08-009 Impr Drainage Phase I (Constr) - - - - - - - Project 08-010 Airside Emergency Gen (Design) - - - - - - - Project 08-011 Airside Emergency Gen (Constr) - - - - - - - Project 08-012 Land - PRZ RW 19 - - - - 9,821 9,821 9,821 Project 08-013 Rehab Term Build (HVAC&Roof) - - - - - - - Project 08-014 PFC update (Appl & Admin) - - - - - - -
Totals for Application 19-08-C-00-ACT 166,504 68,473 52,686 38,962 14,548 174,669 341,173
Total disbursements 5,675,049 71,666 52,686 38,962 13,793 177,107 5,852,156
Net receipts over (under) disbursements $ - - - - - - -
PFC account balance $ - - - - - - -
See accompanying notes to schedule of passenger facility charges collected and expended.
Schedule of Passenger Facility Charges Collected and Expended(Continued)
City of Waco, Texas
DRAFT

7 City of Waco, Texas
Notes to Schedule of Passenger Facility Charges Collected and Expended
September 30, 2020 (1) Basis of Presentation The accompanying schedule of passenger facility charges collected and expended includes
the passenger facility charge (“PFC”) activity of the Waco Regional Airport of the City of Waco, Texas (the “City”). The information in this schedule is presented as required by the Federal Aviation Administration of the U.S. Department of Transportation to implement Sections 9110 and 9111 of the Aviation Safety and Capacity Expansion Act of 1990. Because the schedule presents only a selected portion of the operations of the City, it is not intended to and does not present the financial position, change in net assets or cash flows of the City of Waco, Texas.
(2) Summary of Significant Accounting Policies The City reports disbursements on the schedule of passenger facility charges collected and
expended as reimbursements (to the extent of PFCs actually collected) of costs incurred by the City during the current and prior fiscal years. Therefore, amounts presented in this schedule may differ from amounts presented in, or used in the preparation of, the basic financial statements of the City of Waco, Texas. The following presents cumulative data for PFC eligible costs incurred and PFC collections applied through September 30, 2020:
CumulativeCumulative PFC and PFC Project
Total PFC Project Interest Costs NotImpose Costs Applied Reimbursedand Use Through Through Through
Authority September 30, September 30, September 30,Project Description Approved 2020 2020 2020
Application #1 95-01-C-00-ACT (closed) $ 581,258 581,258 581,258 -
Application #2 98-02-C-00-ACT (closed): Terminal renovation and expansion 1,831,793 1,831,793 1,831,793 - PFC administrative costs 25,400 25,400 25,400 -
1,857,193 1,857,193 1,857,193 -
Application #3 07-03-C-00-ACT (closed): Rehabilitate apron 75,325 75,325 75,325 - Rehabilitate parking lot 31,219 31,219 31,219 - Acquire ARFF vehicle 46,502 46,502 46,502 - Improve ARFF building 180,910 180,910 180,910 - Improve runway safety areas 133,652 133,652 133,652 - Improve access road 9,000 9,000 9,000 -
DRAFT

8 City of Waco, Texas
Notes to Schedule of Passenger Facility Charges Collected and Expended (Continued)
(2) Summary of Significant Accounting Policies (continued)
CumulativeCumulative PFC and PFC Project
Total PFC Project Interest Costs NotImpose Costs Applied Reimbursedand Use Through Through Through
Authority September 30, September 30, September 30,Project Description Approved 2020 2020 2020
Application #3 07-03-C-00-ACT (closed): Improve airport drainage $ 24,765 24,765 24,765 - Install runway guidance system 898 898 898 - Improve passenger terminal 25,800 25,800 25,800 - Expand aircraft apron 27,991 27,991 27,991 - Strengthen runway 2,314 2,314 2,314 - Enhance airport security 50,458 50,458 50,458 - Misc. planning studies 31,421 31,421 31,421 - PFC administrative costs 28,000 28,000 28,000 -
668,255 668,255 668,255 -
Application #4 09-04-C-00-ACT: Holdroom expansion 148,023 148,023 148,023 - Runway safety area 504,953 499,716 499,716 - Passenger boarding bridges 59,748 59,748 59,748 - ARFF suit purchase 11,429 11,429 11,429 - PFC administrative costs 30,000 30,000 30,000 -
754,153 748,916 748,916 -
Application #5 12-05-C-00-ACT: Passenger loading bridges 10,929 10,929 10,929 - Taxiway Rehabilitation - Phase 1 126,288 120,780 120,780 - Apron Rehabilitation - Phase 1 61,413 59,130 59,130 - PFC preparation 37,000 37,000 37,000 - Taxiway Rehabilitation - Phase 2 233,333 233,333 233,333 - Apron Rehabilitation - Phase 2 366,342 366,342 366,342 -
835,305 827,514 827,514 -
Application #6 15-06-C-00-ACT: Design Taxiway Bravo 41,815 41,815 41,815 - Construct Taxiway Bravo Phase 1 631,806 631,806 631,806 - PFC Application Costs 19,000 19,000 19,000 -
692,621 692,621 692,621 -
DRAFT

9 City of Waco, Texas
Notes to Schedule of Passenger Facility Charges Collected and Expended (Continued)
(2) Summary of Significant Accounting Policies (continued)
CumulativeCumulative PFC and PFC Project
Total PFC Project Interest Costs NotImpose Costs Applied Reimbursedand Use Through Through Through
Authority September 30, September 30, September 30,Project Description Approved 2020 2020 2020
Application # 07 18-07-C-00-ACT: ARFF vehicle 90,000 90,000 86,444 3,556 Recondition Apron, Phase III Design 27,400 23,282 23,282 - PFC update (Application & Admin) 25,500 25,500 25,500 -
142,900 138,782 135,226 3,556
Application # 08 19-08-C-00-ACT: Land - RPZ RW 14 39,550 39,337 39,337 - Rehabilitate Terminal (Electric Design) 9,000 438 - 438 Construct Service Road 297,519 292,015 292,015 - Extend Service Road 1,500 1,500 - 1,500 Pavement Management Program 9,821 9,821 - 9,821 Rehabilitate Terminal (Electric Construct) 47,000 - - - Reconstruct Taxiway C (Design) 21,763 20,163 - 20,163 Improve Drainage Phase I (Design) 21,000 2,814 - 2,814 Improve Drainage Phase I (Construct) 122,500 - - - Airside Emergency Gen (Design) 1,000 971 - 971 Airside Emergency Gen (Construct) 10,000 - - - Land - RPZ RW 19 100,000 89,655 9,821 79,834 Rehabilitate Terminal Building (HVAC&Roof) 140,000 - - - PFC update (Application and Admin) 21,500 21,500 - 21,500
842,153 478,214 341,173 137,041
$ 6,373,838 5,992,753 5,852,156 140,597
DRAFT

1 Qualified and No responses must have additional clarification within the audit report.
10 City of Waco, Texas
Passenger Facility Charge Audit Summary
(Unaudited)
1. Type of report issued on PFC financial statements. 1 Unmodified QualifiedX None Issued
2. Type of report issued on PFC compliance. 1 X Unmodified Qualified
3. Quarterly revenue and disbursements reconcile with submitted quarterly reports and reported unliquidated revenue matches actual amounts. X Yes No N/A
4. PFC revenue and interest are accurately reported on FAA Form 5100-127. X Yes No N/A
5. The Public Agency maintains a separate financial accounting record for each application. X Yes No N/A
6. Funds disbursed were for PFC eligible items as identified in the FAA decision to pay only for the allowable costsof the projects X Yes No N/A
7. Monthly carrier receipts were reconciled with quarterlycarrier reports. X Yes No N/A
8. PFC revenues were maintained in a separate interest-bearing capital account or commingled only with other interest-bearing airport capital funds X Yes No N/A
9. Serving carriers were notified of PFC program actions/changes approved by the FAA X Yes No N/A
10. Quarterly reports were transmitted (or available viawebsite) to remitting carriers X Yes No N/A
11. The Public Agency is in compliance with Assurances 5, 6, 7 and 8. X Yes No N/A
12. Project design and implementation is carried out inaccordance with Assurance 10. X Yes No N/A
13. Program administration is carried out in accordancewith Assurance 9. X Yes No N/A
14. For those public agencies with excess revenue, a plan for the use of this revenue has been submitted to the FAA for review and concurrence. Yes No X N/A
DRAFT