Embed Size (px)
Citation preview

J. theor. Biol. (2002) 219, 153–175doi:10.1006/yjtbi.3079, available online at http://www.idealibrary.com on
+
C
m
0
A Mathematical Model for Germinal Centre Kinetics andAffinity Maturation
Dagmar Iber*w and Philip K. Mainiw
wCentre for Mathematical Biology, Mathematical Institute, 24-29 St Giles, Oxford OX1 3LB, U.K.
(Received on 7 December 2001, Accepted in revised form on 13 May 2002)
We present a mathematical model which reproduces experimental data on the germinalcentre (GC) kinetics of the primed primary immune response and on affinity maturationobserved during the reaction. We show that antigen masking by antibodies which areproduced by emerging plasma cells can drive affinity maturation and provide a feedbackmechanism by which the reaction is stable against variations in the initial antigen amountover several orders of magnitude. This provides a possible answer to the long-standingquestion of the role of antigen reduction in driving affinity maturation. By comparing modelpredictions with experimental results, we propose that the selection probability of centrocytesand the recycling probability of selected centrocytes are not constant but vary during the GCreaction with respect to time. It is shown that the efficiency of affinity maturation is highest ifclones with an affinity for the antigen well above the average affinity in the GC leave the GCfor either the memory or plasma cell pool. It is further shown that termination of somatichypermutation several days before the end of the germinal centre reaction is beneficial foraffinity maturation. The impact on affinity maturation of simultaneous initiation of memorycell formation and somatic hypermutation vs. delayed initiation of memory cell formation isdiscussed.
r 2002 Elsevier Science Ltd. All rights reserved.
Introduction
Affinity maturation refers to the increase inaffinity of the antibodies for antigen producedduring the course of an immune response (Jane-way & Travers, 1997). This is achieved bymutation of the genes encoding for the antibodyand subsequent selection of those B cells whichexpress B cell receptors with the highest affinityfor antigen (MacLennan et al., 2000). Howmutation and selection are regulated is currently
*Corresponding author. Tel.: +44-1223-402250; fax:44 -1223-412178wPresent address: MRC-LMB, Hills Road, CambridgeB2 2QH, U.K.E-mail addresses: [email protected] (D. Iber), [email protected] (P.K. Maini).
022-5193/02/$35.00/0
unknown. Both processes are believed to takeplace in the germinal centres of secondarylymphoid organs (Berek et al., 1991; Jacobet al., 1991).
Upon immunization (infection) the antigen isconcentrated in the secondary lymphoid organswhere a small subset of all B cells recognize it(Goodnow, 1997). After successful presentationsof antigen fragments to T cells, B cells enter theblast state (MacLennan et al., 2000). A subsetof the antigen-specific B and T cells enter thefollicle and continue dividing about 4 times aday (Liu et al., 1991). After about 3 days B blastsdifferentiate into centroblasts which still divideevery 6–7 hr and after 4 days a spatial reorga-nization can be observed. It has been shown that
r 2002 Elsevier Science Ltd. All rights reserved.

D. IBER AND P. K. MAINI154
centrocytes are the progenitors of centroblasts(Liu et al., 1991). Centrocytes express B cellreceptors on their surface and are believed to besubject to selection by antigen in the form thatthey need to bind, internalize and presentantigen to T cells (Lanzavecchia, 1985) in ordernot to undergo apoptosis (MacLennan, 1994).Those centrocytes that successfully interact withT cells can either differentiate into memory orplasma cells (MacLennan, 1994). There is sub-stantial experimental evidence for a third differ-entiation pathway back into the centroblast state(de Vinuesa et al., 2000; Han et al., 1995; Liuet al., 1991).
Soon after the first differentiation of centro-blasts into centrocytes, somatic hypermutationstarts to act on centroblasts and leads to achange in the affinity of the B cell receptors forantigen. About half of the mutations ð53%Þ havebeen estimated to be of a silent nature notleading to any change in affinity (Shannon &Mehr, 1999). About 28% have been estimated tolead to B cell death which is in good agreementwith the apoptotic cells observed in the darkzone where centroblasts proliferate (Hardie et al.,1993; Liu et al., 1991). Nineteen percent of allmutations have been estimated to have an effecton affinity. This effect can either be of animproving nature and drive affinity maturation,or of worsening or specificity changing characterwhich may even lead to the formation ofautoreactive clones. Selection is therefore clearlyneeded. It is currently unclear how exactly the
Tabl
GC kinetics in the primed
Days Action
1 ImmunizationFirst 3 B blast proliferation with 1 division within 6–7 hr3 First apoptosis (no memory cells yet)3–4 Differentiation of B blasts into centroblasts
Onset of somatic hypermutation(at 96 hr already two generations of mutations)Start of memory cell formation
4 GC formation: centroblast (dark zone) andcentrocytes (light zone)GC biggest now
5 Mutated plasma cells can be found (may havealready appeared earlier)
21 GC reaction finishes
read-out may work. Several studies support theconcept that antigen is presented on the surfaceof follicular dendritic cells (FDCs) (Liu et al.,1989) and that this membrane presentation maylower the affinity threshold (Batista & Neuber-ger, 2000) and the required amount of depositedantigen (Batista et al., 2001) such that earlyclones of low affinity can also successfullyextract and present antigen. The threshold needsto be dynamic with respect to time in order todrive affinity maturation. This dynamic naturemay derive from increasing competition betweencentrocytes for free antigen which is probablyreduced by antigen extraction (Batista et al.,2001) and masking through antibodies producedby early plasma cells (Ridderstad & Tarlinton,1998; Tarlinton & Smith, 2000). In Table 1, wesummarize the key stages of the primed primaryimmune response.
How activation of B cells by antigen and Tcells determines their fate, for example, whetherthey differentiate into either centroblasts, mem-ory or plasma cells, is currently unknown andthere is no experimental system available toinvestigate this. A mathematical model is there-fore helpful for investigating hypotheses andchecking their compatibility with available data.
Before investigating affinity maturation wefirst need to construct a model of the germinalcentre (GC) kinetics which reproduces all avail-able data on the relevant population dynamicsthat are related to the GC reaction. Into thismodel the model of affinity maturation can then
e 1primary immune response
References
Liu et al., (1991)MacLennan (pers. comm., 2001)Liu et al. (1991)
MacLennan (pers. comm., 2001)Liu et al. (1991) and MacLennan (pers. comm., 2001)Jacob et al. (1991), Jacob & Kelsoe (1992) andLiu et al. (1991)Liu et al. (1991)MacLennan (pers. comm., 2001)
Jacob et al. (1991), Jacob & Kelsoe (1992) andLiu et al. (1991)

A MODEL FOR GC KINETICS 155
be embedded. Previous mathematical modelsof the process were very complex and unableto reproduce all data on the germinal centrereaction. An important condition for being ableto construct a good model is the availability ofa large body of reliable experimental data. Themodel presented below is therefore constructedfor the primed, instead of for the true, primaryimmune response, since more (and also moreaccurate) data are available for the former. Inthe primed primary immune response an animalis first immunized with a precipitated carrierprotein that activates T cells. A month later theanimal is again immunized with the carrierprotein but this time it is conjugated to a hapten.A hapten is an agent that is too small to raise animmune response but, when conjugated to acarrier protein, it is recognized by the immunesystem and raises an immune response. It isimportant to note that the hapten–carrierprotein complex can be injected in soluble form.This leads to a faster clearance of the antigenfrom the body and a sharper response whichallows a more accurate description of the processand therefore yields better data. The problem ofmodelling the true primary immune responsealready begins with deciding on the exact timeof onset of the immune response, since this issmeared over a time span of several days becausethe antigen needs to be injected in precipitatedform and dissolves slowly. A drawback ofmodelling the primed instead of the true primaryimmune response is that due to the priming,T cell help is non-limiting and the immuneresponse against the hapten is faster andstronger than in the unprimed case. This is anunfortunate side effect since the mechanisms ofthe two responses may therefore be different andan understanding of the artificial primed primaryimmune response does not directly imply anunderstanding of the true primary immuneresponse. Many features will however be similaralthough the kinetics differ (Liu et al., 1991) andan understanding of the primed primary immuneresponse may therefore facilitate an understand-ing of the true primary immune response. In thefollowing, a simplistic mathematical model isdevised with which all available data can bereproduced and predictions can be made con-cerning selection strategies and the regulation of
the differentiation of selected centrocytes intoeither memory, plasma cells or centroblasts.
The Basic Model
Calculations based on the emergence ofantigen-specific B cells led to the suggestion thatfollicles are seeded during the first hours ofinfection (immunization in experiments) andthat each follicle soon becomes dominated byfive (or fewer) clones (Jacob et al., 1991; Kroeseet al., 1987; Liu et al., 1991). In the model it istherefore assumed that the GCs are seededby three clones which give rise to 12288 B blastswithin 3 days if we use the proliferation rate r ¼246:5 ln 2 day�1 for centroblasts determined by Liuand co-workers (Liu et al., 1991). At day 3, Bblasts differentiate into centroblasts and themain GC reaction starts. The model, presentedschematically in Fig. 1, takes the form
dB
dt¼ prrCs � rB; ð1Þ
dC
dt¼ 2rmB � mC with m ¼ ds þ dcð1� sÞ; ð2Þ
dCs
dt¼ dsC � rCs; ð3Þ
dM
dt¼ ð1� prÞrCs ð4Þ
and is derived in the following way. There is noexperimental work on the regulative mechanismfor differentiation of centroblasts into centro-cytes. In a previous model, Kesmir and de Boer(1999) assumed that centroblasts differentiateinto centrocytes after a set number of genera-tions n; which is larger than 4. One can show thatother mechanisms, such as time-dependent orcell-density-dependent centroblast–centrocyteconversion, cannot satisfy all experimental dataon population dynamics of certain B cellsubpopulations. In the case of a cell-density-dependent conversion mechanism, we find anon-trivial stable steady state which is rapidlyattained and prohibits termination of the re-sponse. This problem was encountered beforeby Oprea and Perelson who got around it by

B blastBb
Centro-blast
B
memorycells &AFC
APOPTOSIS
APOPTOSIS
selectedCentro-
cyteC
Centro-cyteC
day 3
prρ
ρ
(1-pr)
d s
δc(1-s)
2ρ (1-m)
2ρ m
Fig. 1. Scheme of the model for the primed primary immune response. Abbreviations are explained in Table 2.
D. IBER AND P. K. MAINI156
introducing a sudden emigration of GC cells atthe time when biologists measured the dissolu-tion of germinal centres (Oprea & Perelson,1997). This is, however, a phenomenologicalapproach that cannot explain the underlyingmechanism. The steady state can be circum-vented in the time-dependent conversion modelbut only at the expense of losing another GCfeature: the model then does not reproduce thesudden loss of GCs when recycling is impaired(de Vinuesa et al., 2000). In this model wetherefore assume generation-dependent centro-blast differentiation and it will be shown laterthat agreement with the experimental observa-tions of MacLennan and co-workers (MacLen-nan et al., 1990) only occurs if we assume thatcentroblasts already differentiate into centro-cytes after one cell division.
The conversion of centroblasts into centro-cytes could involve only one or both daughtercells. However, in the former case we wouldnot obtain the observed GC kinetics since thecentroblast pool could only increase but notdecrease since no net outflux term would be
included and the GC reaction would neverterminate. Hence, in the model it is assumedthat centroblast division directly leads to differ-entiation of both daughter cells into centrocytesand we therefore have the term �r B in eqn (1).Due to somatic hypermutation only the propor-tion m survives the cell division and differenti-ates into centrocytes while the remainingproportion ð1� mÞ of dividing centroblasts isassumed to die at the same rate as the survivingpart differentiates. The death rate of centroblastsmay well be smaller than the conversion rate.Such a possible difference cannot, however, beexpected to change the modelled kinetics sub-stantially if we assume that centroblasts, oncecommitted to apoptosis, cannot take part in thenormal cell division process. A smaller deathrate would therefore only lead to a slower decayof the total cell number. The surviving centro-blast proportion gives rise to the term 2rmBin eqn (2). The factor 2 comes in since onecentroblast gives rise to two centrocytes anddivision of centroblasts is assumed to leaddirectly to differentiation into centrocytes.

Table 2Parameters for the minimal model
B CentroblastsC CentrocytesCs Centrocytes that have been selectedM Memory cellsAFC Antibody forming cellsr ¼ 24
6:5 ln 2 Maximum proliferation rate of centroblast ðday�1Þ Liu et al. (1991)
m ¼ 0:72 Probability of non-deleterious mutation Shannon & Mehr (1999)d ¼ 12 ln 2 Rate of running through the selection
process ðday�1ÞLiu et al. (1991)
dc ¼ 1:5 ln 2 Death rate of centrocytes ðday�1Þ MacLennan et al. (1990)sA½0; 1� Selection probability of centrocytesprA½0; 1� Probability of recyclingk ¼ 108 Production rate of high affinity antibodies that are
retained within the GC ðantibody=day� cellÞkon ¼ 5� 10�13 Antibody–antigen effective association rate
ðday�1 particle�1ÞBatista & Neuberger (1998) and Neri et al. (1995)
A MODEL FOR GC KINETICS 157
Part of the centrocyte population ðsCÞ be-comes selected into the pool Cs at a rate d (Liuet al., 1991) via interaction with antigen and Tcells (whose dynamics are not included in thisfirst simple model). This generates the term dsCin eqn (3). The other part ðð1� sÞCÞ undergoesapoptosis with rate dc (MacLennan et al., 1990)and the outflux from the centrocyte pool istherefore in total ðds þ dcð1� sÞÞC; which iswritten as mC in eqn (2). The selected centrocytesðCsÞ can then take either of two routes: they may,with probability ð1� prÞ; differentiate into mem-ory ðMÞ or antibody-forming plasma cells ðAFCÞ(at this stage we do not differentiate betweenthese two cell types and denote both populationsby M); or they may, with probability pr; recycleand replenish the centroblast pool. The timeneeded to recycle is assumed to be, on average,about 6 hr and therefore we again use r as a rateconstant, leading to the term prrCs in eqn (1).We further assume that selected centrocytesdifferentiate at the same rate into memory orplasma cells as they recycle so that the netoutflux term from the pool of selected centro-cytes is given by �rCs in eqn (3). By the sameargument, the influx into the memory pool (4) isgiven by ð1� prÞrCs: A different efflux rate fromthe GC would only change the total number ofcells fluxing into the memory and plasma cellpool. Both numbers are currently unknown anddifficult to measure since both memory andplasma cells emigrate from the follicles and arethen difficult to track.
Non-dimensionalization of the model does notlead to any new insight since the form of theequations remains unchanged (that is, there areno small parameters that we can exploit see Table2). We note that the M equation is decoupledfrom the rest of the system, so we analyze the firstthree equations of the model system. This systemalways has a trivial equilibrium point. A non-trivial equilibrium point, exists if
m ¼ mc ¼ 2prmsd: ð5Þ
At the equilibrium point, s therefore takes thevalue
sc ¼dc
dð2prm � 1Þ þ dc
: ð6Þ
Given that the selection factor s can only takevalues between 0 and 1 in the model, we obtainas a further condition on the denominator
prmX0:5 ð7Þ
in order to attain the equilibrium state within thepossible parameter range. Due to somatichypermutation the survival rate m has beencalculated to be about 0.72 (Shannon & Mehr,1999) or 0:75 (Allen et al., 1987). Other sourcesare more pessimistic and consider m ¼ 0:5(Kepler & Perelson, 1993). For the latterparameter value of m we would need pr ¼ 1 inorder to meet condition (7). pr; however, cannotattain value 1 since then no memory cell

D. IBER AND P. K. MAINI158
formation would be possible, [eqn (4)]. Wetherefore have m40:5 as a necessary conditionfor a non-trivial equilibrium state. For mp0:5we have m4mc for all parameters in the para-meter range. Simple analysis shows that thesolution blows up for momc while for m4mc ittends to the trivial equilibrium point. If we usem ¼ 0:72 on the other hand, we only needprX0:69 in order to attain a non-trivial equili-brium state.
Results and Predictions
TERMINATION OF SOMATIC HYPERMUTATION
AT DAY 16 REQUIRES ENHANCEMENT IN THE
STRINGENCYOF SELECTION
Experimental observations show that theoverall shape of the GC kinetics during theprimed primary immune response (Liu et al.,1991) is characterized by an exponential increasein cell numbers until day 3 or day 4, when thenumber of cells reaches about 1–1:5� 104
(Kuppers et al., 1993; Liu et al., 1991) followedby a halving of cell numbers until day 7. Afterday 7 cell numbers decline more slowly until theGC reaction finishes at about day 21 (Liu et al.,1991).
In order to model the decrease in cell numberswe have to determine the set of parameters forwhich the model attains the trivial equilibriumstate. It is generally believed that the decrease incell population during the GC reaction is mainlydue to non-selected centrocytes which are dying(MacLennan et al., 2000). It is further believedthat selection is critically dependent on theamount of available antigen, which can bereduced during the reaction by antigen extrac-tion (Batista et al., 2001) and antigen maskingthrough soluble antibody produced by earlyplasma cells (Ridderstad & Tarlinton, 1998;Tarlinton & Smith, 2000). From the latter itfollows that the value of the selection factor willonly decrease during the GC reaction. Theweaker decrease in cell numbers after day 7must therefore be due to the increase of the otherundetermined parameter, the recycling probabil-ity pr: This assumption can be justified by theexperimental result that early clones of highaffinity have been observed to preferentiallyleave the GC reaction. We will come back to
this point later. At this stage it is sufficient toassume that those centrocytes which receive avery strong activation signal compared to theaverage centrocyte population preferentiallyleave the GC reaction. Given that B cell andsubsequent T cell activation (interleukin-2production) is dependent on the availability ofantigen (Batista et al., 2001), and given furtherthat the curve of T cell activation as a functionof antigen density is of sigmoidal shape (Batistaet al., 2001), the behaviour can best be modelledby the use of a Hill function. We use
pr ¼ 0:6þ 0:2Agn
min
Agn þ Agnmin
; ð8Þ
where Ag is antigen density, Agmin ¼ 7500 andn ¼ 50: The parameters Agmin and n are chosensuch that the experimental kinetics can bereproduced.
The amount of unbound antigen decreasesduring the GC reaction due to antigen consump-tion and masking by high-affinity soluble anti-gen. The latter will be included once we havemodelled affinity maturation. At this stage weonly consider antigen reduction by extractionthrough centrocytes. The initial number ofantigen complexes in the lymph node has beenestimated to be 5� 108 (Tew & Mandel, 1979)although this number will vary between immuneresponses (MacLennan, Pers. comm., 2001).Given that every GC consists of about 1:5�105 lymphoid cells and every spleen about5–7� 107 lymphoid cells, the number of GCscan be estimated to be about 300–500. So thereare at least 106 antigen molecules per GC. If wefollow the estimate in Kesmir & de Boer (1999)there are 100 FDCs per GC and therefore onaverage 104 antigen molecules per FDC.
The natural decay of antigen is more or lessirrelevant since this natural decay is much slowerthan all active processes. The antigen decay istherefore probably mainly due to antigen ex-traction by centrocytes. It is reasonable toassume that the more the extraction, the morethe centrocytes interact with antigen and thehigher is the antigen density on FDCs, since thismay facilitate extraction. Assuming further, forsimplicity, a linear influence, we are left with�uCsAg as the term modelling the extraction by
A MODEL FOR GC KINETICS 159
selected centrocytes, where Ag is the antigendensity. Given that centrocytes which do notmanage to become selected may extract antigenas well, we also need to take this proportion ofnon-selected centrocytes into account. This cellproportion is taken to be kðC � CsÞ and wetherefore obtain the second term modelling theantigen dynamics to be �ukðC � CsÞAg yieldingin total for the antigen dynamics
dAg
dt¼ �ðukC þ uCsð1� kÞÞAg: ð9Þ
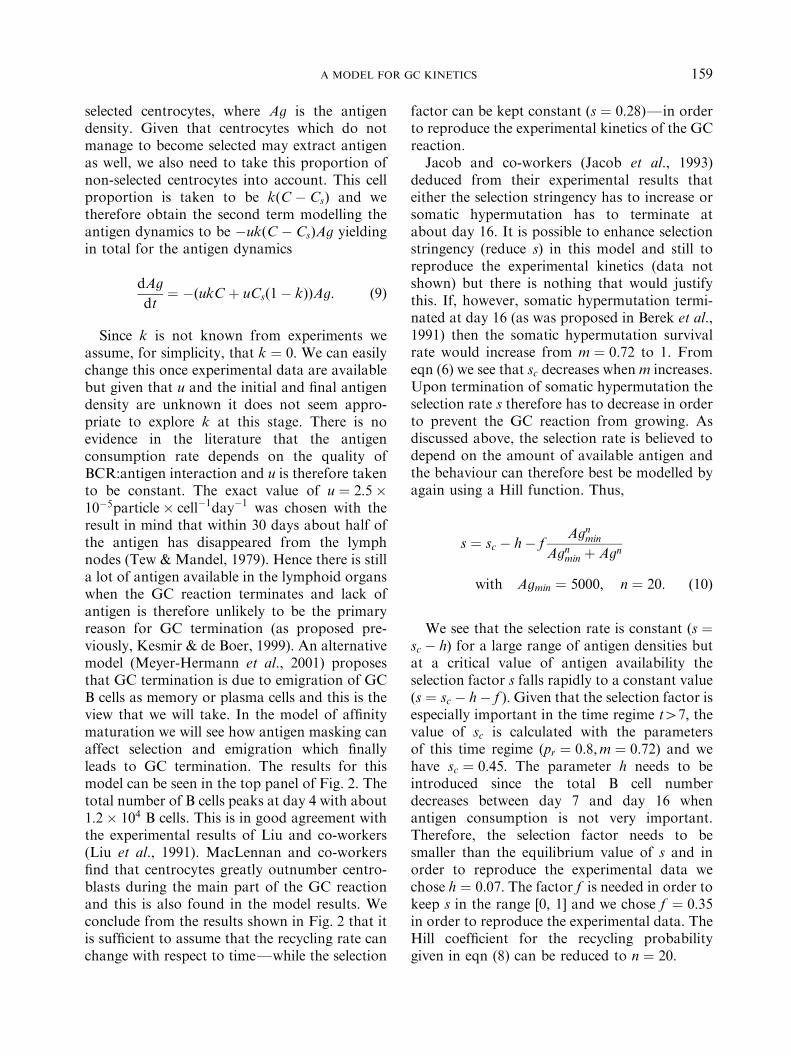
Since k is not known from experiments weassume, for simplicity, that k ¼ 0: We can easilychange this once experimental data are availablebut given that u and the initial and final antigendensity are unknown it does not seem appro-priate to explore k at this stage. There is noevidence in the literature that the antigenconsumption rate depends on the quality ofBCR:antigen interaction and u is therefore takento be constant. The exact value of u ¼ 2:5�10�5particle� cell�1day�1 was chosen with theresult in mind that within 30 days about half ofthe antigen has disappeared from the lymphnodes (Tew & Mandel, 1979). Hence there is stilla lot of antigen available in the lymphoid organswhen the GC reaction terminates and lack ofantigen is therefore unlikely to be the primaryreason for GC termination (as proposed pre-viously, Kesmir & de Boer, 1999). An alternativemodel (Meyer-Hermann et al., 2001) proposesthat GC termination is due to emigration of GCB cells as memory or plasma cells and this is theview that we will take. In the model of affinitymaturation we will see how antigen masking canaffect selection and emigration which finallyleads to GC termination. The results for thismodel can be seen in the top panel of Fig. 2. Thetotal number of B cells peaks at day 4 with about1:2� 104 B cells. This is in good agreement withthe experimental results of Liu and co-workers(Liu et al., 1991). MacLennan and co-workersfind that centrocytes greatly outnumber centro-blasts during the main part of the GC reactionand this is also found in the model results. Weconclude from the results shown in Fig. 2 that itis sufficient to assume that the recycling rate canchange with respect to timeFwhile the selection
factor can be kept constant ðs ¼ 0:28ÞFin orderto reproduce the experimental kinetics of the GCreaction.
Jacob and co-workers (Jacob et al., 1993)deduced from their experimental results thateither the selection stringency has to increase orsomatic hypermutation has to terminate atabout day 16. It is possible to enhance selectionstringency (reduce s) in this model and still toreproduce the experimental kinetics (data notshown) but there is nothing that would justifythis. If, however, somatic hypermutation termi-nated at day 16 (as was proposed in Berek et al.,1991) then the somatic hypermutation survivalrate would increase from m ¼ 0:72 to 1. Fromeqn (6) we see that sc decreases when m increases.Upon termination of somatic hypermutation theselection rate s therefore has to decrease in orderto prevent the GC reaction from growing. Asdiscussed above, the selection rate is believed todepend on the amount of available antigen andthe behaviour can therefore best be modelled byagain using a Hill function. Thus,
s ¼ sc � h � fAgn
min
Agnmin þ Agn
with Agmin ¼ 5000; n ¼ 20: ð10Þ
We see that the selection rate is constant ðs ¼sc � hÞ for a large range of antigen densities butat a critical value of antigen availability theselection factor s falls rapidly to a constant valueðs ¼ sc � h � f Þ: Given that the selection factor isespecially important in the time regime t47; thevalue of sc is calculated with the parametersof this time regime ðpr ¼ 0:8;m ¼ 0:72Þ and wehave sc ¼ 0:45: The parameter h needs to beintroduced since the total B cell numberdecreases between day 7 and day 16 whenantigen consumption is not very important.Therefore, the selection factor needs to besmaller than the equilibrium value of s and inorder to reproduce the experimental data wechose h ¼ 0:07: The factor f is needed in order tokeep s in the range ½0; 1� and we chose f ¼ 0:35in order to reproduce the experimental data. TheHill coefficient for the recycling probabilitygiven in eqn (8) can be reduced to n ¼ 20:
0 5 10 15 20 25 300
5000
10000
15000
t [days]
cell
num
ber/
GC
(a)
B blasts centrocytes GC efflux cells total B cells Ag/FDC [particle/cell]
0 5 10 15 20 25 300
5000
10000
15000
t [days]
cell
num
ber/
GC
(b)
B blasts centrocytes GC efflux cells total B cells Ag/FDC [particle/cell]
0 5 10 15 20 25 300
0.5
1
t [days](c)
Selection Factor (s) Recycling Probability (pr)
Fig. 2. (a) GC kinetics without termination of somatic hypermutation. The recycling probability is chosen as given ineqn (8). The selection factor s ¼ 0:28 is chosen constant. (b) GC kinetics with termination of somatic hypermutation at day16. The final number of GC efflux cells is 2:1� 104: The recycling probability used is given in eqn (8) with n ¼ 20; and theselection rate is given in eqn (10). (c) The selection factor s and the recycling probability pr as in (b).
D. IBER AND P. K. MAINI160
The Hill coefficient n is a measure of thecooperativity of a process and a Hill coefficientof 3 is already considered high (Stryer, 1995).The reason such large values of the Hillcoefficient had to be chosen in this model is thatthe selection rate and the recycling probabilityneed to change rapidly and we see from Fig. 2that there is no alternative if we want to satisfythe kinetic data. We have therefore to assumethat the fall of the selection factor is almost anon/off response where signalling is changedrapidly when the antigen density and affinityreaches a certain threshold. If we understand therapid decrease in the selection proportion as aneffect of a signalling cascade with many ampli-fication steps, a high Hill coefficient, whichwould not be justifiable for single molecule–molecule interactions, can still be realistic. Sucha rapid change, however, makes the model veryunstable against small variations in the initial
conditions. When we include affinity maturationwe will be able to model the selection factor andthe recycling probability more mechanisticallywithout having to use Hill functions, thus thisproblem will not arise.
The middle panel in Fig. 2 shows the results ofthe model which compare even more closely withthe experimental data (Liu et al., 1991) than theresults in the top panel, which were obtained forcontinuous somatic hypermutation and constantselection rate. In the following we will furtherexamine the benefits of termination of somatichypermutation well before the end of the GCreaction with respect to affinity maturation.
CENTROBLASTS DIFFERENTIATE INTO CENTROCYTES
AFTERONE GENERATION
After having introduced the basic model forone centroblast generation and having shown

A MODEL FOR GC KINETICS 161
that it reproduces, reasonably well, kinetic dataon the primed primary immune response, wenow introduce a multi-generation model andshow by comparison with experimental data thata one-generation model agrees best with experi-mental data. Up to day 3 the general multi-generation model is the same as before, but afterday 3 it is given by
dB0
dt¼ prrCs � rB0; ð11Þ
dB j
dt¼ 2rmB j�1 � rBj for j ¼ 1;y; n; ð12Þ
dC
dt¼ 2rmB n � mC with ð13Þ
m ¼ ds þ dcð1� sÞ;
0 5 100
0.5
1.0
1.5
2.0x 10⁴
t [
cell
num
ber/
GC
(a)
0 5 100
0.5
1.0
1.5
2.0
2.5
t [
cell
num
ber/
GC
(b)
x 104
Fig. 3. GC kinetics of the primed primary immune resprecycling ðprÞ is dependent on antigen density, and somatic hypThe dynamics of all cell populations behave as described inpopulations behave as described in Fig. 2 except that the centr
dCs
dt¼ dsC � rCs; ð14Þ
dM
dt¼ ð1� prÞrCs; ð15Þ
where the upper indices indicate the numberof divisions the centroblast has already gonethrough. It is sufficient to numerically solve theproblem for the one- and two-generation case inorder to see why only the one-generation modelis consistent with experimental data. While inthis model centrocytes greatly outnumber cen-troblasts during the main part of the reaction[Fig. 3(a)] as observed by MacLennan and co-workers (MacLennan et al., 1990), this is not thecase in the two-generation model [Figure 3(b)].The situation is even worse for more generations.Thus, only the one-generation model is consis-tent with experimental observations.
15 20 25 30days]
Bblasts centrocytes GC efflux cells total B cells Ag/FDC [particle/cell]
15 20 25 30
days]
Bblasts centrocytes GC efflux cells total B cells Ag/FDC [particle/cell]
onse in the one-generation model where selection ðsÞ andermutation terminates at day 16. (a) One-generation model:Fig. 2. (b) Two-generation model: The dynamics of all celloblast and the centrocyte population are of similar size.

D. IBER AND P. K. MAINI162
EXTENSION OF THE BASIC MODELTO INCLUDE
AFFINITY MATURATION
From the simple model for the GC reaction wenow know that centroblasts probably differenti-ate into centrocytes after one cell division. Withrespect to the timing of somatic hypermutationwe have seen from experiments that a termina-tion at about day 16 still allows the model toreproduce GC kinetics. We now turn to model-ling affinity maturation and in this context wewill investigate possible benefits of terminatingsomatic hypermutation well before the end of theGC reaction.
Given that in the experimental work onaffinity maturation on which we base this modelonly low-middle- and high-affinity clones aredistinguished (Smith et al., 1997), it is sensible atthis stage to restrict ourselves to two species,namely high- and low-affinity clones. We keeptrack of the cell populations in these affinityclasses by using vectors of size two where thefirst argument refers to the number of cells withlow affinity of the given cell species and thesecond argument to the number of cells withhigh affinity. The two components are denotedby subscripts. Mutation is modelled by applyinga mutation matrix M and m is therefore replacedby mM in eqn (2). We study and compare twoscenarios, one with somatic hypermutationtermination at about day 16 and one withoutsuch termination. During times when somatichypermutation is active we have m ¼ 0:72 and M
as given in eqn (34). For all other times we havem ¼ 1 and M is the unit matrix. The constantsdiffer for high- and low-affinity clones and aretherefore written as pairs of numbers where thefirst argument refers to the constant for low-affinity clones and the second argument to theconstant for high-affinity clones. In explicit formthe system which we are going to solve looks asfollows:
For tp3
dB
dt¼ rB: ð16Þ
For t43
dB1
dt¼ pr1rCs1 � rB1; ð17Þ
dB2
dt¼ pr2rCs2 � rB2; ð18Þ
dC1
dt¼ 2rmðM11B1 þM12B2Þ � m1C1; ð19Þ
dC2
dt¼ 2rmðM21B1 þM22B2Þ � m2C2 ð20Þ
dCs1
dt¼ ds1C1 � rCs1 ; ð21Þ
dCs2
dt¼ ds2C2 � rCs2 ; ð22Þ
dM1
dt¼ ð1� pr1ÞCs1 ; ð23Þ
dM2
dt¼ ð1� pr2ÞCs2 ð24Þ
with mi ¼ dsi þ dcð1� siÞ:The biological relevance of the different
entries of M is as follows:
M11 F proportion of low-affinity cells thatremain low affinity;M12 F proportion of high-affinity cells that
become low affinity;M21 F proportion of low-affinity cells that
become high affinity;M22 F proportion of high-affinity cells that
remain high affinity.Given that the total number of cells does not
change, the proportions need to sum to 1, soM11 þM21 ¼ 1 and M12 þM22 ¼ 1:
Affinity bins and mutation matrices have beenused before in models of affinity maturation(Kepler & Perelson, 1993) although somatichypermutation is believed to be a somewhatrandom process. The existence of hot spots(Neuberger et al., 1998) and the large number ofcells justify a deterministic modelling approach.The use of affinity bins can be justified by thelimited resolution of measurements.

A MODEL FOR GC KINETICS 163
ANALYSIS OF THE AFFINITY MATURATION MODEL
Stability Analysis and the PossibleParameter Range of the Selection Factor s
and the Recycling Probability pr
In order to reproduce the experimental resultsthe solution needs to tend to the trivialequilibrium point after day 4. The set ofparameters for which this is achieved wasdetermined by considering the quasistatic casewhen the selection rate s and the recyclingprobability pr are constant and then by usingthe Routh–Hurwitz criterion. The possible para-meter range is dependent on the proportion ofbeneficial mutations as can easily be seen inFig. 4. Here, for four different choices of M11;those parameters, for which the trivial solution isnot the stable steady state, are interconnectedleaving the possible parameter space white. Thelarger the M11 the lesser the restrictions lie on theparameters for high-affinity clones (the selection
0 1 −1
0
1
(a)
(c)
pr1
pr2
s2
s1
−1
0 1 −1
0
1
pr1
pr2
s2
s1
−1
Fig. 4. Parameter region for which the system cannot atta0:75; (c) M11 ¼ 0:85; (d) M11 ¼ 0:95: The parameter range forpr1 on the negative x-axis, while s2 and pr2 are represented onfor which the trivial equilibrium point cannot be attained are crelevant parameters of the low-affinity population (s1 and pr1) ihigh-affinity population decreases.
probability s2 and the recycling probability pr2).This is also intuitively understandable since forlarge M11 only few high-affinity clones aregenerated in every round of mutation and thepopulation reducing effects therefore have topreferentially act on the low-affinity populationin order to prohibit the GC population fromgrowing. We further see that high recycling ratesare compatible with stable or falling populationsize if only a small proportion of all clonesbecomes selected as has already been observed inexperiments.
Efficiency of Affinity Maturation
Given that the main focus of this paper isthe process of affinity maturation, it is now ofinterest to determine the restrictions on theparameters such that we indeed obtain affinitymaturation.
(b)
(d)
0 1 −1
0
1
pr1
pr2
s2
s1
−1
0 1 −1
0
1
pr1
pr2
s2
s1
−1 −0.5 0.5
in the trivial equilibrium point: (a) M11 ¼ 0:65; (b) M11 ¼s1 is depicted on the positive x-axis, the parameter range forthe negative and positive y-axis, respectively. Parameter setsonnected by lines. For increasing M11 the restriction on thencreases while the restriction on the same parameters for the

D. IBER AND P. K. MAINI164
We can analyze the efficiency of affinitymaturation best by defining
’T1 ¼ ’B1 þ ’C1 þ ’Cs1 þ ’M1; ð25Þ
’T2 ¼ ’B2 þ ’C2 þ ’Cs2 þ ’M2 ð26Þ
so that ’T1 ð ’T2Þ represents the rate of increaseof low (high)-affinity cells. We thereforehave a net affinity increase if ’T1o ’T2:This inequality is satisfied if the followingconditions hold:
Cs1oCs21� pr2
1� pr1; ð27Þ
C14C21� s2
1� s1; ð28Þ
B1
B2o�1þ 2mðM22 �M12Þ�1þ 2mðM11 �M21Þ
: ð29Þ
From inequality (27) we see that affinitymaturation is favoured if high-affinity clonesrecycle with less probability than low-affinityclones ðpr2opr1Þ: We will come back to this ideawhen we analyze the mutation matrix in moredetail. Inequality (28) yields the intuitivelyunderstandable insight that it is most beneficialfor affinity maturation if low-affinity clones areselected to a lesser degree than high-affinityclones ðs1os2Þ:
Inequality (29) can be further analyzed byusing M11 þM21 ¼ 1; M12 þM22 ¼ 1 andM21 þM12 ¼ b where b is the proportion ofmutations that lead to an affinity change. Weobtain from eqn (29) the condition
B1
B2o�1þ 2mð3� 2b� 2M11Þ
�1þ 2mð2M11 � 1Þ: ð30Þ
Given that the LHS of inequality (29)is bounded below by 0, we require theRHS to be larger than zero in order toobtain affinity maturation. This is achieved ifeither
M1140:5þ 0:25m�1 and
bo1:5� 0:25m�1 �M11 ð31Þ
or
M11o0:5þ 0:25m�1 and
b41:5� 0:25m�1 �M11 ð32Þ
Estimates by others yield b ¼ 0:52 and m ¼0:72 (Shannon & Mehr, 1999) and condition (31)can therefore not be satisfied, while condition(32) implies M11o0:85: Note that since inequal-ities (27)–(29) are sufficient but not necessary,the upper limit for M11 may in fact be higher.The RHS of inequality (30) goes to zero whenM11 approaches its upper limit and for large M11
we can therefore only obtain affinity maturationif the LHS, B1=B2; can be made very small,which can be achieved by stringent selectionconditions on the low-affinity population.
A Multi-Generation Mechanism Cannot beExpected to Lead to a Higher Degree of
Affinity Maturation
After we have ruled out a multi-generationmechanism for centroblast–centrocyte conver-sion for kinetic reasons, we can now make use ofthe formalism developed above to also show thatsuch a mechanism cannot be expected to be ofgreat value with respect to affinity maturation.Introduction of several centroblast generationsleads to a multiple application of the matrix M
on the centroblast vector while condition (29) ischanged toP
i Bi1P
j Bj2
o�1þ 2mðM22 �M12Þ�1þ 2mðM11 �M21Þ
¼�1þ 2mð3� 2b� 2M11Þ
�1þ 2mð2M11 � 1Þð33Þ
for i; j ¼ 1;y; n being the number of divisionsthe centroblasts have gone through. While theRHS is identical to the case for the one-generation model, the LHS of inequality (33)now includes the sum of all centroblast popula-tions.
It is not difficult to show that if inequality (29)is satisfied there is a net shift of the mutationmatrix M to high affinity (i.e. M224M11) if thepopulation of low-affinity centroblasts is largerthan the population of high-affinity centroblasts

A MODEL FOR GC KINETICS 165
by more than M12=M21: Multiplication of themutation matrix with itself, however, does notchange the ratio Mn
12=Mn21 as can be seen from
the explicit calculation of Mn with n ¼ 2:
M2 ¼M2
11 þM12M21 M12ðM11 þM22Þ
M21ðM11 þM22Þ M222 þM12M21
!:
From this we see that the ratio betweenworsening and improving mutations is constantif the matrix is multiplied by itself. This impliesthat if the population of low-affinity clones islarger than the population of high-affinity clonesby more than M12=M21; then we have anet increase in the high-affinity populationupon application of this matrix. If, however,the proportion of high-affinity clones is higher,then this matrix lowers this proportion. Inthe limit we can therefore only attain the ratioM12=M21 by consecutive application ofthis matrix. This is illustrated in Fig. 5, andwe further see that the increase in the proportion
0 5 100
0.02
0.04
0.06
0.08
0.10
0.12
0.14
0.16
0.18Appl
prop
ortio
n of
hig
h af
finity
cel
ls [v
2/su
m(v
)]
Fig. 5. Consecutive application of the mutation matrix M
against the number of times n the mutation matrix M was applon the initial proportion of high-affinity cells, v2; given in the
of high-affinity clones per application of themutation matrix is highest when the proportionof high-affinity clones is smallest and if n;the number of times the mutation matrix hasalready been applied, is small. This result istherefore also not in favor of a multi-generationmodel.
Termination of Somatic Hypermutation Beforethe end of the GC Reaction is Beneficial
for Affinity Maturation
In case of a termination of somatic hypermu-tation M becomes the unit matrix and inequality(29) reduces to the inequality B1=B2o1: Thiscondition can be easily satisfied by introducingmore stringent selection conditions which reducethe number of B1 cells. The B2 cells furthermultiply and soon dominate the germinal centrereaction. From this it is obvious that it isbeneficial to terminate somatic hypermutationbefore the germinal centre reaction finishes in
15 20 25 30
ication of Mn
n
v2 = 0.2 v1
v2 = 0.05 v1
v2 = 0
: The proportion of high-affinity cells v2=P
i vi is plottedied. The shift per application of the mutation matrix dependslegend in the inset.
D. IBER AND P. K. MAINI166
order to be able to further expand the high-affinity clones without the risk of losing thembecause of worsening mutations. It is also clearthat somatic hypermutation must not terminatebefore high-affinity clones have evolved. Giventhat high-affinity clones have about nine muta-tions (Siekevitz et al., 1987; Wedemayer et al.,1997), and assuming that one way through thecycle takes about a day, we need about 9 days ofsomatic hypermutation. Given that not everymutation is beneficial the 12 days allowed forsomatic hypermutation to take place seems to bereasonable.
NUMERICAL SOLUTION OF THE FULLMODEL
After having gained insights concerning thenumber of centroblast generations, the optimaltime span of somatic hypermutation, the optimalchoice of the selection factor and the recyclingprobability, the final step to take is to solvenumerically the full model of the GC reactionincluding affinity maturation. Modelling affinitymaturation allows us to finally include thecompetition between centrocytes and emerginghigh-affinity antibodies as a driving force ofaffinity maturation. The resulting model isrobust against variations in the initial antigenamount over several orders of magnitude andagainst variations in the proportion of beneficialmutations.
First, biologically reasonable values need to bededuced for all parameters. For most rates therange can be justified while the correct valueremains elusive and would require furtherexperiments. However, the quality of the esti-mates should be sufficient for the predictionsmade to be of biological interest. In order to findthe correct entries for M we use calculations byothers (Shannon & Mehr, 1999) that estimate53% of all mutations to be silent and 28% to belethal. Therefore, from the surviving 72%, 74%have not changed affinity while 26% have. Wecannot expect that more than 10% of allmutations which change the affinity (or about2% of all mutations) are beneficial. Manser evenassumes that only 0.1% of all mutations arebeneficial (Manser, 1990), a figure which may,however, be quite pessimistic. Assuming that10% of all changing mutations are beneficial we
obtain as mutation matrix
M ¼0:948 0:468
0:052 0:532
!ð34Þ
which is derived as follows. If 10% ofall changing mutations were beneficial, 2:6%of all low-affinity clones would be promoted tohigh affinity in every round of mutation. Wetherefore have M21 ¼ 0:1� 0:26� 2 ¼ 0:052where the factor 2 comes in since the sum overall entries of M is 2. The remaining part of thelow-affinity clones remains of low-affinity andwe therefore find M11 ¼ 1� 0:052 ¼ 0:948: Gi-ven that we assume that 26% of all mutationschange the affinity ð26� 2:6Þ% ¼ 23:4% mustreduce the affinity so that M12 ¼ 0:234� 2 ¼0:468: The remaining high-affinity clones remainof high-affinity and we find for the last matrixentry M22 ¼ 1� 0:468 ¼ 0:532:
Given that the division rate is r ¼ 246:5 day
�1
and we apply the mutation matrix continuouslyin every time step, we need to take M to thepower ½24 day�1=6:5� � dt with dt ¼ 0:1 beingour numerical finite time difference. Therefore,the actual value we take for the matrix M is
M ¼0:9763 0:2136
0:0237 0:7864
!:
These mutations change the proportion be-tween high- and low-affinity clones, which iscalculated from
A ¼B2 þ C2 þ Cs2 þ M2P
iðBi þ Ci þ Csi þ MiÞ: ð35Þ
Recall, that when we investigated the antigendependency on the selection factor s andthe recycling probability pr in the previoussection, we had to use unrealistically highvalues for the Hill coefficient n; and the basicmodel of the GC reaction was not robustto changes in the initial number of antigencomplexes (a failing of the model since theamount of deposited antigen varies betweenGC reactions (MacLennan, pers. comm. 2001)and robustness of the real GC reaction tovariations of several orders of magnitude hasbeen observed). The GC reaction could attain

A MODEL FOR GC KINETICS 167
such stability by a feedback mechanismsuch that in case of a high availability of antigenthe total cell number would be reduced.A possible candidate for such a feedbackmechanism is antigen masking by high-affinityantibodies ðAbÞ: On the other hand, antibodieswith an affinity marginally above average maystill be out-competed by centrocytes. The emer-gence of high-affinity antibodies in the serum hasbeen determined experimentally for a trueprimary immune response (Smith et al., 1994;1997). The emergence of antibodies follows asaturation law and the largest increase in anti-body concentration was found between day 7(when high-affinity antibodies can first be found)and day 14. A simplistic way of modelling thekinetics of high-affinity antibody emergence isgiven by
dAb
dt¼ kAFC2 � konAgAb
with k ¼ 108 antibody
day� cell;
kon ¼ 5� 10�13 day�1particle�1 ð36Þ
which is derived as follows. Given thathigh-affinity antibodies are produced by high-affinity plasma cells ðAFC2Þ it is sensible toassume that the increase in antibody concentra-tion is proportional to the size of thiscell population (first summand in eqn (36))while the decrease is proportional to anti-body:antigen complex formation (second sum-mand in eqn (36)). The on-rate of antibody:antigen binding, kon ¼ 5� 10�13 day�1particle�1
C3:5� 106 M�1 s�1 was chosen in the range ofwhat has been measured for high-affinity anti-bodies in experiments (Batista & Neuberger,1998; Neri et al., 1995) (see Table 2). A maximalvalue for k; the production rate of high-affinityantibodies that are retained within the GC,cannot be expected to be smaller than 1011
antibodies per cell per day. However, it isreasonable to assume that the major part ofall antibodies produced is either alreadyproduced outside of GCs or is at least notretained within the GC. Given that we con-sider high-affinity interactions, antibody:antigenbinding is considered to be irreversible on the
time-scale considered and koff is set to be zero.Natural decay of antibody by catabolizingprocesses as well as by other parts of theimmune response such as the innate areneglected. The stoichiometry of the antigen:anti-body complex depends on the antigen. Giventhat there is no data available on the amount ofantibody found in GCs it is, however, notsensible to worry about stoichiometries at thisstage. With this model we can only investigatewhether antigen masking by antibody coulddrive affinity maturation efficientlyFfurtherexperiments are then needed to elucidate thispoint.
The availability of free, unbound antigen willdecrease due to extraction as discussed beforeand due to antigen masking and we thereforehave
dAg
dt¼ �ðukC þ uCsð1� kÞÞAg � konAgAb
with u ¼ 10�4 particle
cell� day:
ð37Þ
The on-rate kon ¼ 5� 10�13 day�1particle�1
C3:5� 106 M�1 s�1 is used as before. u; theextraction rate of antigen by centrocytes, is againchosen such that only about half of the antigenvanishes from the germinal centre. Due to theGC reaction, most of the remaining antigenwill be present in the form of antigen:anti-body complexes, KAgAb; whose emergence ismodelled by
dKAgAb
dt¼ konAgAb with
kon ¼ 5� 10�13 day�1 particle�1: ð38Þ
Our choice of the selection factor s andthe recycling probability pr is guided by theanalysis presented above. In order to gainmaximal affinity increase we need to choose s1small while s2 has to be large. The recyclingprobability, on the other hand, needs tobe chosen high for low-affinity clones ðpr1Þ andlow for high-affinity clones ðpr2Þ: The recyclingprobability for high-affinity clones has to in-crease with time, reflecting the stronger competi-tion for activating signals because of reduction

D. IBER AND P. K. MAINI168
of available antigen. We therefore have
s ¼0:01þ 0:09z
0:1þ 0:85z
!; ð39Þ
pr ¼0:95
0:7Z
!
with z¼Ag=P
i Ci and Z ¼ minðKAgAb=P
i Ci; 1Þ;where z models the fact that less antigen percentrocyte leads to less activation of B cells evenif their BCRs recognize the antigen with highaffinity. Z accounts for the negative feedback ofantigen:antibody complexes on B cell signallingwhich is here assumed to cause more recyclingand less B cell differentiation to plasma andmemory cells.
In the scenario where termination of somatichypermutation is included, it occurs simulta-neously with increased selection stringency. Bothprocesses may therefore be regulated by the samemechanism and we assume that somatic hyper-mutation terminates when zo1: A more realisticcase would be a continuous decrease of somatichypermutation with decreasing z:
The centrocytes which do not recycle caneither differentiate into memory or antibody-producing plasma cells (also called antibody-forming cells (AFCs)). It has been observed thatearly selected centrocytes preferentially leave theGC reaction and differentiate into antibody-forming cells, many of which migrate to the bonemarrow where they persist for several weeksand secrete antibodies (Smith et al., 1997). Theproportion of high-affinity clones among AFCslocated in the spleen during the measurementshas been determined explicitly in the experimentsand we will use these data to validate the model.
There is inconclusive data concerning memorycells ðMÞ: While from histological investigationsit was claimed that memory cells can first befound between days 3 and 4 (MacLennan, pers.comm., 2001), investigations of the antibodyrepertoire support the concept that memory cellsdevelop late during the response. Theoreticalanalysis shows that the affinity of the memorycell pool is higher, the later memory cellformation starts (Meyer-Hermann et al., 2001)although at least in the model presented here the
difference caused by a late start is not very high.In vitro experiments have shown that there mayexist a feedback loop which inhibits plasma cellformation once there is a high titre of IgGantibodies (Tarlinton & Smith, 2001). In the trueprimary immune response they can be detectedin the serum at day 7 (Smith et al., 1994; 1997).Taken together the dynamics of plasma andmemory cells can be modelled by
dAFC
dt¼ yrð1� prÞCs; ð40Þ
dM
dt¼ ð1� yÞrð1� prÞCs; ð41Þ
where y ¼ 0:3ðAg=P
i CiÞ ðAg=ðAg þ KAgAbÞÞ isthe product of the ratio of free antigen tocentrocytes and the fraction of free antigen, andmodels the inhibition of AFC formation by lessavailability of free antigen and by the emergenceof IgG:antigen complexes.
Figures 6 and 7 show numerical simulationresults for the cases without termination ofsomatic hypermutation or with termination,respectively. In both cases, the overall kineticsbehave as before and as described in theliterature (Liu et al., 1991). Given that we arestill considering a one-generation model, cen-trocytes still outnumber centroblasts as observedby MacLennan and co-workers (MacLennanet al., 1990). As found in experiments (Tew &Mandels, 1979), the total amount of antigen isonly halved during the immune response (curvefor Ag:Ab complexes in Figs 6 and 7), whilethe amount of free antigen is reduced to zero dueto masking by soluble high-affinity antibodieswhich are produced by plasma cells. Thismasking drives the competition in the germinalcentres and leads to affinity maturation (Figs. 6and 7 middle panel) as observed in experiments(Smith et al., 1997). The total amount of freeantibody in the GCs obtained in this simulationcorresponds to a concentration of about 1 Mwhich is reasonable since we have not consideredthe fact that most of the antibodies will beproduced outside the GC or diffuse out, andin experiments millimolar concentrations ofantibody are already sufficient to block binding.The GC reaction and the affinity maturation in

0 5 10 15 20 25 300
5000
10000
(a) t[days]
cell
num
ber/
GC B blasts
centrocytes GCR efflux cells total B cells free Ag/FDC [particle/cell]5*10−9 Antibody Ag:Ab complexes
0 5 10 15 20 25 300
0.5
1.0
(b) t[days]
prop
ortio
n of
hig
h af
finity
cel
ls
experimental results model results[Aff(C+Cs+M)]model results[Aff(C+Cs)]
0 5 10 15 20 25 300
0.5
t[days](c)
s1 s2 pr1 pr2
1.0
θ
Fig. 6. GC kinetics and affinity maturation of the primed primary immune response without termination of somatichypermutation. (a) GC kinetics of the primed primary immune response in the one-generation model. The dynamics of allcell populations behave as described before. (b) Affinity maturation during the primed primary immune response: The solidline represents experimental results for a true primary immune response (Smith et al., 1997) which starts later than theprimed primary immune response. The model results for the affinity increase in centrocyte (c), selected centrocyte ðCsÞ andmemory cell ðMÞ population together (broken line) are close to those observed experimentally. The earlier onset of affinitymaturation seen in the model results from the nature of the primed primary immune response. The dotted line represents theaffinity increase in the whole centrocyte population ðC þ CsÞ: (c) The dynamic behaviour of the selection and recyclingprobability for low- and high-affinity clones is depicted as well as y; the fraction of free antigen.
A MODEL FOR GC KINETICS 169
the model are very stable against increases in theinitial amount of antigen over several orders ofmagnitude. This is in good agreement with theobservation that the amount of deposited anti-gen varies (MacLennan, pers. comm., 2001) andexperiments in which the antigen amount wasstrongly increased but the reaction was found tobe normal (Vora et al., 1997). Also the propor-tion of beneficial mutations can be varied over awide range without affecting the GC reaction oraffinity maturation substantially. This robust-ness is very important since the proportion ofbeneficial mutations will strongly depend on theantigen encountered. Also in favour of bothmodels is the proportion of high-affinity AFCsat day 14. Although nothing was specifically
undertaken to influence this number, the pro-portion given in the literature (56%) (Smithet al., 1997) is reproduced well by the model(65.5%). The antibody level increases exponen-tially in this model while a saturation curve wasobtained in the experiments (Smith et al., 1997).The reason for this is that in this model nofurther antibody decreasing processes such asnatural decay and the immune response againstthe invader are considered.
The only major difference between the simula-tions with and without termination of somatichypermutation is the extent of affinity matura-tion. As predicted before, termination of somatichypermutation leads to the expansion ofhigh-affinity clones which finally dominate the

0 5 10 15 20 25 300
5000
10000
(a) t[days]
cell
num
ber/
GC B blasts
centrocytes GCR efflux cells total B cells free Ag/FDC [particle/cell]5*10−9 Antibody Ag:Ab complexes
0 5 10 15 20 25 300
0.5
(b) t[days]
prop
ortio
n of
hig
h a
ffini
ty c
ells
experimental results model results[Aff(C+Cs+M)]
0 5 10 15 20 25 300
0.5
1.0
t[days](c)
s1 s2 pr1 pr2
1.0
model results[Aff(C+Cs)]
θ
Fig. 7. GC kinetics and affinity maturation of the primed primary immune response if somatic hypermutationterminates before the end of the GC reaction. (a) GC kinetics of the primed primary immune response in the one-generationmodel. The dynamics of all cell populations behave as described before. (b) Affinity maturation during the primed primaryimmune response if somatic hypermutation terminates before the end of the GC reaction. The solid line representsexperimental results for a true primary immune response (Smith et al., 1997) which starts later than the primed primaryimmune response. The model results for the affinity increase in centrocyte (c), selected centrocyte ðCsÞ and memory cell ðMÞpopulation together (broken line) are close to those observed experimentally except for the final affinity increase after day16. Until about day 16 the affinity increase is largely due to an affinity increase in the memory population. After thetermination of somatic hypermutation the average affinity increases again substantially due to an affinity increase inthe centrocyte population ðC þ CsÞ which is represented by the dotted line. Termination of somatic hypermutation beforethe end of the GC reaction is therefore beneficial for affinity maturation and would be necessary to reproduce experimentaldata if a lower proportion of improving mutations had been chosen. The earlier onset of affinity maturation seen in themodel results from the nature of the primed primary immune response. (c) The dynamic behaviour of the selection andrecycling probability for low- and high-affinity clones is depicted as well as y; the fraction of free antigen.
D. IBER AND P. K. MAINI170
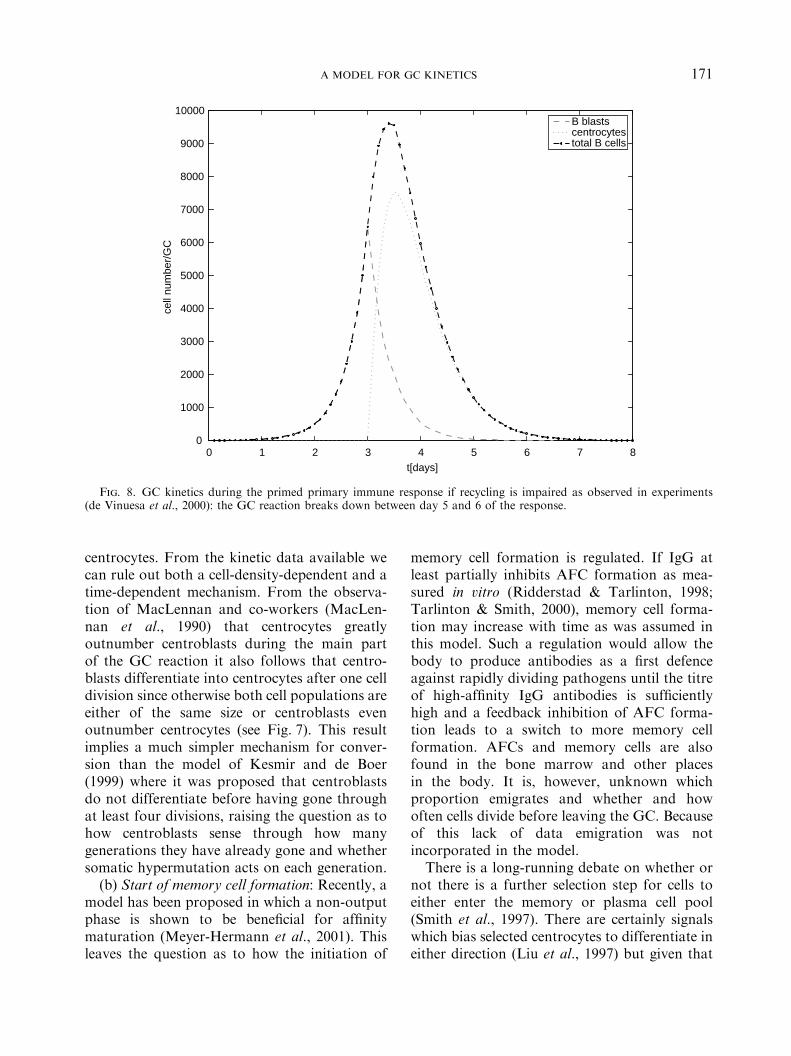
response (Fig. 7 middle panel). This is a furtherpoint in favour of termination of somatichypermutation at about day 16 as has beensuggested before by several experimentalists(Berek & Milstein, 1988; Jacob et al., 1993).One further way to check the model is to impairrecycling ðpr ¼ 0Þ: As has been shown experi-mentally (de Vinuesa et al., 2000) this leads to abreak-down of the GC reaction (see Fig. 8).
The last step is to build a multi-bin model.However, given that neither entries for the muchmore complex mutation matrix nor values for
the different entries of s or pr are known, it issensible to wait for more experimental data to beavailable before undertaking a detailed model-ling approach.
Discussion
KINETICASPECTS
(a) Regulation of centroblast to centrocyte
differentiation: No experiments have been car-ried out to address the regulation mechanismfor the differentiation of centroblasts into
0 1 2 3 4 5 6 7 80
1000
2000
3000
4000
5000
6000
7000
8000
9000
10000
t[days]
cell
num
ber/
GC
B blasts centrocytes total B cells
Fig. 8. GC kinetics during the primed primary immune response if recycling is impaired as observed in experiments(de Vinuesa et al., 2000): the GC reaction breaks down between day 5 and 6 of the response.
A MODEL FOR GC KINETICS 171
centrocytes. From the kinetic data available wecan rule out both a cell-density-dependent and atime-dependent mechanism. From the observa-tion of MacLennan and co-workers (MacLen-nan et al., 1990) that centrocytes greatlyoutnumber centroblasts during the main partof the GC reaction it also follows that centro-blasts differentiate into centrocytes after one celldivision since otherwise both cell populations areeither of the same size or centroblasts evenoutnumber centrocytes (see Fig. 7). This resultimplies a much simpler mechanism for conver-sion than the model of Kesmir and de Boer(1999) where it was proposed that centroblastsdo not differentiate before having gone throughat least four divisions, raising the question as tohow centroblasts sense through how manygenerations they have already gone and whethersomatic hypermutation acts on each generation.
(b) Start of memory cell formation: Recently, amodel has been proposed in which a non-outputphase is shown to be beneficial for affinitymaturation (Meyer-Hermann et al., 2001). Thisleaves the question as to how the initiation of
memory cell formation is regulated. If IgG atleast partially inhibits AFC formation as mea-sured in vitro (Ridderstad & Tarlinton, 1998;Tarlinton & Smith, 2000), memory cell forma-tion may increase with time as was assumed inthis model. Such a regulation would allow thebody to produce antibodies as a first defenceagainst rapidly dividing pathogens until the titreof high-affinity IgG antibodies is sufficientlyhigh and a feedback inhibition of AFC forma-tion leads to a switch to more memory cellformation. AFCs and memory cells are alsofound in the bone marrow and other placesin the body. It is, however, unknown whichproportion emigrates and whether and howoften cells divide before leaving the GC. Becauseof this lack of data emigration was notincorporated in the model.
There is a long-running debate on whether ornot there is a further selection step for cells toeither enter the memory or plasma cell pool(Smith et al., 1997). There are certainly signalswhich bias selected centrocytes to differentiate ineither direction (Liu et al., 1997) but given that

D. IBER AND P. K. MAINI172
the model presented here reproduces the experi-mental proportions of high-affinity clones with-out considering such a further selection step,properties other than affinity may be importantfor differentiation in either direction.
THE EFFICIENCYOFAFFINITY MATURATION
(a) The role of selection and recycling: Theprocess of the immune response would be mostefficient if somatic hypermutation worked on asmall number of centroblast generations ðno10Þand if the initial and recycling centroblastpopulation had a very small proportion ofhigh-affinity clones. This has indeed been shownfor the initial centroblast population which wasfound to consist of 3% high-affinity clones(Smith et al., 1997). In order to keep theproportion of high-affinity centroblasts low, therecycling probability for high-affinity centro-blasts needs to be much smaller than for low-affinity clones. Such a regime would also becompatible with inequality (27) as discussedabove. This is a new insight into the importanceof this parameter for affinity maturation andraises the question of how high-affinity clonescould be generated from low-affinity clones ifclones of improved affinity hardly recycle andhigh-affinity clones cannot be generated fromlow-affinity clones in one round. This conceptualproblem arises because of the simplicity of ourmodel which only considers two different affi-nities so that a shift from low- to high-affinity ispossible in this model.
At this stage it is therefore beneficial toconsider an advanced model with 10 bins.The number 10 is sensible since experimentalistsfind that high-affinity B cells differ in theirantibody coding genes by about eight mutationsfrom germline genes. Assuming that every oneof these mutations changes the affinity of theantibody, it is sensible to use eight bins forimproved affinity, one for the starting affinityand one for reduced/no affinity. While cellsbelow the starting bin undergo apoptosis whentrying to interact with antigen, cells well abovethe starting bin are selected into the plasmacell pool or into the memory cell pool. The cellsin the bins in between mostly recycle, some ofthem may also enter the memory pool. The
threshold above which cells definitely leavethe GC as memory or plasma cells can beassumed to increase during the germinal centrereaction. This is in agreement with the analysisof the two-bin model: once most of the popula-tion has gone, say from bin 2 to bin 3, bin 2acts as the low-affinity bin in our modeland is assigned the recycling probability forlow-affinity cells instead of that of high-affinitycells. Therefore, the recycling probabilitychanges with time for the different bins andfinally even clones of relatively high-affinityrecycle and are expanded. In this model,high-affinity clones preferentially leave theGC reaction at the beginning. This isalso intuitively understandable since at thebeginning a high-affinity clone, which wasgenerated by chance, would be lost with highprobability once it goes through mutation againsince most of the mutations worsen theantibody. Additionally, the body needs earlyhigh-affinity clones in order to hold the invaderin check. Early emigration is therefore beneficialfor the efficiency of affinity maturation andfor the early immune response. Once, however,many clones have reached the next affinity binand mutation acts on a wide platform, mutationsare beneficial since they will not lead to acomplete elimination of the already gainedbeneficial mutations but there is a good chancethat affinity is even enhanced.
The early emigration of high-affinity cloneshas been described previously (Radmacher et al.,1998; Smith et al., 1997) but was understood tobe due to a stochasticity in the selection and wasviewed as a failure of the system (Radmacheret al., 1998). The model presented here suggeststhat the early emigration is a deterministicprocess and is beneficial for affinity maturationand for the defence of the organism against theinvader since the early emigrants produce anti-bodies which support the organism’s first de-fence. This finding is also in good agreementwith another experimental result where a trans-gene which coded for a high-affinity antibodywas inserted into the genome of an animal (Vora& Manser, 1995). The animal neverthelessproduced a similar memory cell repertoireas the control animals without the transgene.This favours the notion of deterministic early

A MODEL FOR GC KINETICS 173
emigration of high-affinity clones which there-fore do not dominate the response. In the laterresponse animals without the transgene haveobtained antibodies of comparable affinity bymutation while the antibody encoded by thetransgene can accumulate worsening mutations.
The model also explains the results ofHannum and co-workers (Hannum et al., 2000)which show that the germinal centre reaction ismore or less normal even if the animals cannotdeposit antigen on FDCs due to the lack ofsoluble antibodies. Their data show that the GCcell numbers are even higher than in the controlanimals while the activation of centrocytes isreduced. Due to less activation, presumablymore cells recycle and the GC reaction istherefore stable. The activation may be lowersince antigen cannot be displayed professionallyon FDCs but needs to be recognized in other(maybe even in soluble) form which elicits lowerresponse (Batista et al., 2001).
The selection factor needs to be chosen in theopposite way to the recycling rate and is high forhigh-affinity clones and low for low-affinityclones. This is also intuitively understandable.With time competition for antigen increasesbecause extraction of antigen by centrocyteslowers the antigen density. Therefore, the selec-tion proportion of low affinity clones decreaseswith time.
(b) The role of termination of somatic hyper-
mutation: The analysis of this model shows thattermination of somatic hypermutation before theend of the germinal centre reaction is beneficialfor affinity maturation since it allows theexpansion of high-affinity clones without thehazard of losing the clone due to worseningmutations. The signal for a switch-off of somatichypermutation may be less activation due to lessavailability of free antigen since this would alsoprovide a mechanism for an increase in theselection stringency at the same time. Thecorrelation may be due to a connection betweenactivating signals during centrocyte selection andsignals for continuation of somatic hypermuta-tion after centrocytes have recycled. The signalmay also be received directly by centroblastswhich have been shown recently to expresssurface immunoglobulin in the late stages ofthe GC (Camacho et al., 1998). During that
stage the dark and light zones can no longer beseen and the FDC network extends through thewhole germinal centre such that centroblasts candirectly interact with FDCs. With the beginningof the second week of the response, these FDCshave further been shown to express CD23, alsoknown as FceRII (Camacho et al., 1998). CD23has been shown to bind to CD21, whichmodulates signalling through BCR. Time dy-namic expression of various such surface mole-cules may regulate somatic hypermutationtermination.
In total, we conclude that antigen masking byevolving antibody is an effective way by whichaffinity maturation may be driven. The postu-lated feedback effect on AFC formation mayfurther regulate the extent to which B cells eitherleave the GC or recycle. Understanding themechanism and regulation of recycling may bekey to understanding affinity maturation as fromthis model the extent to which B cells leave orrecycle has a very strong impact on affinitymaturation. This is also sensible from a biolo-gical point of view since selection is mainlymeant to have a protective function againstthe emergence of self-reactive clones. It is notsensible to eliminate even weak binders whichcan be used as plasma cells as a first defenceagainst the invader. Furthermore, the modelstrongly supports the concept of an earlytermination of somatic hypermutation at aboutday 16 since without such a termination, affinitymaturation would be less efficient as terminationof somatic hypermutation allows the expansionof the high-affinity B cell population without thehazard of worsening mutations.
This model made use of several black boxes inwhich less well characterized steps were included.Before refining the model, predictions made bythe model must be tested experimentally, andmore data obtained on the dependence of B cellselection on BCR:antigen affinity and antigendensity. Furthermore, it would be interesting tohave data on the impact of antigen masking byantibody on affinity maturation and on fatedetermination by the quality of BCR:antigenand B cell:T cell interaction. Finally, it wouldbe helpful if the sizes of the different B cellpopulations (centroblasts, centrocytes, memorycells, plasma cells) were known in detail.

D. IBER AND P. K. MAINI174
DI would like to thank D. Gavaghan and M.C.MacLennan for useful discussions and acknowledgessupport from an EPSRC scholarship and theStudienstiftung des deutschen Volkes. This workwas completed while PKM was a Visiting SeniorResearch Fellow at the Isaac Newton Institute forMathematical Sciences, University of Cambridge.
REFERENCES
Allen, D., Cumano, A., Dildrop, R., Kocks, C.,Rajewsky, K., Rajewsky, N., Roes, J., Sablitzky, F.& Siekevitz, M. (1987). Timing, genetic requirementsand functional consequences of somatic hypermutationduring B cell development. Immunol. Rev. 96, 5–22.
Batista, F. D. & Neuberger, M. S. (1998). Affinitydependences of the B cell response to antigen: a thresh-old, a ceiling and the importance of off-rate. Immunity 8,751–759.
Batista, F. D., Iber, D. & Neuberger, M. S. (2001). Bcells acquire antigen from target cells after synapseformation. Nature 411, 489–494.
Batista, F. D. & Neuberger, M. (2000). B cells extractand present immobilized antigen: implications for affinitydiscrimination. EMBO J. 19, 513–520.
Berek, C. & Milstein, C. (1988). The dynamic nature ofthe antibody repertoire. Immunol. Rev. 105, 5–26.
Berek, C., Berger, A. & Apel, M. (1991). Maturationof the immune response in germinal centers. Cell 67,1121–1129.
Camacho, S. A., Kosco-Vilbois, M. H. & Berek, C.(1998). The dynamic structure of the germinal center.Immunol. Today 19, 511–514.
De Vinuesa, C. G., Cook, M. C., Ball, J., Drew, M.,Sunners, Y., Cascalho, M., Wabl, M., Klaus,G. G. B. & MacLennan, I. C. (2000). Germinal centerswithout T cells. J. Exp. Med. 191, 485–493.
Goodnow, C. C. G. (1997). Chance encounters andorganized rendezvous. Immunol. Rev. 156, 5–10.
Han, S., Zheng, B., DalPorto, J. & Kelsoe, G. (1995). Insitu studies of the primary immune response to(4-hydroxy-3-nitrophenyl)acetyl. iv. Affinity-dependent,antigen-driven B cell apoptosis in germinal centers as amechanism for maintaining self-tolerance. J. Exp. Med.182, 1635–1644.
Hannum, L. G., Haberman, A. M., Anderson, S. M. &Shlomchik, M. J. (2000). Germinal center initiation,variable gene region hypermutation, and mutant B cellselection without detectable immune complexes onfollicular dendritic cells. J. Exp. Med. 192, 931–942.
Hardie, D. L., Johnson, G. D., Khan, M. & MacLen-nan, I. C. (1993). Quantitative analysis of moleculeswhich distinguish functional compartments within germ-inal centers. Eur. J. Immunol. 23, 997–1004.
Jacob, J., Kassir, R. & Kelsoe, G. (1991). In situ studiesof the primary immune response to (4-hydroxy-3-nitrophenyl)acetyl. I. the architecture and dynamicsof responding cell populations. J. Exp. Med. 173,1165–1175.
Jacob, J., Kelsoe, G., Rajewsky, K. & Weiss, U. (1991).Intraclonal generation of antibody mutants in germinalcentres. Nature 354, 389–392.
Jacob, J., Przylepa, J., Miller, C. & Kelsoe, G. (1993).In situ studies of the primary immune response to(4-hydroxy-3-nitrophenyl)acetyl. III. The kinetics of Vregion mutation and selection in germinal center B cells.J. Exp. Med. 178, 1293–1307.
Janeway, C. A. & Travers, P. (1997). Immunology. TheImmune System in Health and Disease. New York:Garland Publisher.
Kepler, T. B. & Perelson, A. S. (1993). Somatichypermutation in B cells: an optimal control treatment.J. theor. Biol. 164, 37–64.
Kesmir, C. & De Boer, R. J. (1999). A mathematicalmodel on germinal center kinetics and termination.J. Immunol. 163, 2463–2469.
Kroese, F. G. M., Wubena, A. S., Seijen, H. G. &Nieuwenhuis, P. (1987). Germinal centers developoligoclonally. Eur. J. Immunol. 17, 1069–1072.
Kuppers, R., Zhao, M., Hansmann, M.-L. & Rajewsky,K. (1993). Tracing B cell development in human germinalcentres by molecular analysis of single cells picked fromhistological sections. EMBO J. 12, 4955–4967.
Lanzavecchia, A. (1985). Antigen-specific interactionbetween T and B cells. Nature 314, 537–539.
Liu, Y. L., Joshua, D. E., Smith, C. A. G. J. &MacLennan, I. C. (1989). Mechanisms of antigen-drivenselection in germinal centres. Nature 342, 929–931.
Liu, Y. L., Zhang, J., Chan, E. Y. T. & MacLennan,I. C. (1991). Sites of specific B cell activation in primaryand secondary responses to T-cell-dependent andT-cell-independent antigens. Eur. J. Immunol. 21,
2951–2962.Liu, Y. J., De Bouteiller, O. & Fugier-Vivier, I. (1997).
Mechanisms of selection and differentiation in germinalcenters. Curr. Opin. Immunol. 9, 256–262.
MacLennan, I. C. (1994). Germinal centers. Annu. Rev.Immunol. 12, 117–139.
MacLennan, I. C., Liu, Y. L., Oldfield, S., Zhang, J. &Lane, P. J. L. (1990). The evolution of B-cell clones.Curr. Toppers Microbiol. Immunol. 159, 37–64.
MacLennan, I. C., GarciaŁ De Vinuesa, C. & Casa-mayor-Palleja, M. (2000). B-cell memory and thepersistence of antibody responses. Philos. Trans. R. Soc.London B Biol. Sci. 355, 345–350.
Manser, T. (1990). The efficiency of antibody affinitymaturation: can the rate of B-cell division be limiting?Immunol. Today 11, 305–308.
Meyer-Hermann, M., Deutsch, A. & Or-Guil, M.(2001). Recycling probability and dynamical properties ofgerminal centre reactions. J. theor. Biol. 210, 265–285.
Neri, D., Momo, M., Prospero, T. & Winter, G. (1995).High-affinity antigen binding by chelating recombinantantibodies (crabs). J. Mol. Biol. 246, 367–373.
Neuberger, M. S., Ehrenstein, M. R., Klix, N., Jolly,C. J., Yelamos, J., Rada, C. & Milstein, C. (1998).Monitoring and interpreting the intrinsic features ofsomatic hypermutation. Immunol. Rev. 162, 107–116.
Oprea, M. & Perelson, A. S. (1997). Somaticmutation leads to efficient affinity maturation whencentrocytes recycle back to centroblasts. J. Immunol.158, 5155–5162.
Radmacher, M. D., Kelsoe, G. & Kepler, T. B. (1998).Predicted and inferred waiting times for key mutants inthe germinal centre reaction: evidence for stochasticity inselection. Immunol. Cell Biol. 76, 373–381.
A MODEL FOR GC KINETICS 175
Ridderstad, A. & Tarlinton, D. M. (1998). Kinetics ofestablishing the memory B cell population as revealed byCD38 expression. J. Immunol., 160, 4688–4695.
Shannon, M. & Mehr, R. (1999). Reconciling repertoireshift with affinity maturation: the role of deleteriousmutations. J. Immunol. 162, 3950–3956.
Siekevitz, M., Kocks, C., Rajewsky, K. & Dildrop, R.(1987). Analysis of somatic mutations and class switchingin naive and memory B cells generating adoptive primaryand secondary responses. Cell 48, 757–770.
Smith, K. G. C., Weiss, U., Rajewski, K., Nossal, G. J. V.& Tarlinton, D. M. (1994). Bcl-2 increases memory Bcell recruitment but does not perturb selection in thegerminal centers. Immunity 1, 803–813.
Smith, K. G. C., Light, A., Nossal, G. J. V. &Tarlinton, D. M. (1997). The extent of affinitymaturation differs between the memory and antibody-forming cell compartments in the primary immuneresponse. EMBO J. 16, 2996–3006.
Stryer, L. (1995). Biochemistry. New York: W.H.Freeman and Company.
Tarlinton, D. M. & Smith, K. G. C. (2000). Dissectingaffinity maturation: a model explaining selection ofantibody-forming cells and memory B cells in thegerminal centre. Immunol. Today 9, 436–441.
Tew, J. G. & Mandel, T. E. (1979). Prolonged antigenhalf-life in the lymphoid follicles of specifically immu-nized mice. Immunology 37, 69–76.
Vora, K. A. & Manser, T. (1995). Altering the antibodyrepertoire via transgene homologous recombination:evidence for global and clone-autonomous regulation ofantigen-driven B cell differentiation. J. Exp. Med. 181,271–281.
Vora, K. A., Ravetch, J. V. & Manser, T.(1997). Amplified follicular immune complex depositionin mice lacking the Fc receptor g-chain does notalter maturation of the B cell response. J. Immunol.159, 2116–2124.
Wedemayer, G. J., Patten, P. A., Wang, L. H., Schultz,P. G. & Stevens, R. C. (1997). Structural insights intothe evolution of an antibody combining site. Science 276,
1665–1669.