Embed Size (px)
Citation preview

A Marketing Plan for the Freshwater Fisheries Section of the
South Carolina Department of Natural Resources
Prepared for the South Carolina Department of Natural Resources
February 2003
Prepared by Responsive Management

A Marketing Plan for the Freshwater Fisheries Section of the South Carolina Department of Natural Resources
February 2003
Responsive Management National Office
Mark Damian Duda, Executive Director Peter E. De Michele, Ph.D., Director of Research
Steven J. Bissell, Ph.D., Qualitative Research Associate Ping Wang, Ph.D., Quantitative Research Associate
James B. Herrick, Ph.D., Research Associate William Testerman, Director of Survey Center
Carol Zurawski, Research Associate Martin Jones, Research Associate
Joy Yoder, Research Associate Alison Lanier, Business Manager
130 Franklin Street
Harrisonburg, VA 22801 Phone: 540/432-1888 Fax: 540/432-1892
Email: [email protected] www.responsivemanagement.com

A Marketing Plan for the SC DNR Freshwater Fisheries Section i
TABLE OF CONTENTS Introduction ................................................................................................................................... 1 Chapter 1: Demographic Trends in South Carolina................................................................. 2 Chapter 2: South Carolina Residents’ Attitudes Toward Fishing and Aquatic Resources .................................................................................................................... 15 Chapter 3: South Carolina Residents’ Attitudes and Opinions Toward Wildlife and Marine Resources..................................................................................................................... 24 Chapter 4: Fishing Participation in the United States and South Carolina ......................... 26 Chapter 5: Fishing License Sales Trends in South Carolina ................................................. 31 Chapter 6: The South Carolina Angler.................................................................................... 60 Chapter 7: South Carolina Fishing License Holders’ Opinions and Attitudes Toward Fisheries Management and the SC DNR................................................................................ 62 Chapter 8: Youth and Fishing/Aquatic Resources ................................................................. 70 Chapter 9: Major Findings, Implications and Recommendations ........................................ 79 Literature ..................................................................................................................................... 98 Appendices ................................................................................................................................. 100

A Marketing Plan for the SC DNR Freshwater Fisheries Section 1
INTRODUCTION
The purpose of this marketing plan is to provide the Freshwater Fisheries Section (Section) of the South Carolina Department of Natural Resources (SC DNR) strategic market direction for the next ten years. This plan and associated recommendations are based upon a solid foundation of research, including 2000 Bureau of the Census data for South Carolina, historic fishing license sales data in South Carolina, and ten years of research on South Carolina residents’ and anglers’ attitudes toward natural and aquatic resources and outdoor recreation conducted by Responsive Management.
The core historical mission of the Section has been managing South Carolina’s sport fishery resources and providing recreational fishing opportunities for South Carolina’s freshwater anglers. This marketing plan examines whether this core mission is still relevant in 2003 and, if not, specific directions, opportunities and challenges that will face the Section as it considers alternative opportunities in aligning itself with the needs and desires of South Carolina residents, South Carolina freshwater anglers, South Carolina youth, and the demographic trends taking place within the Palmetto State.
2 Responsive Management
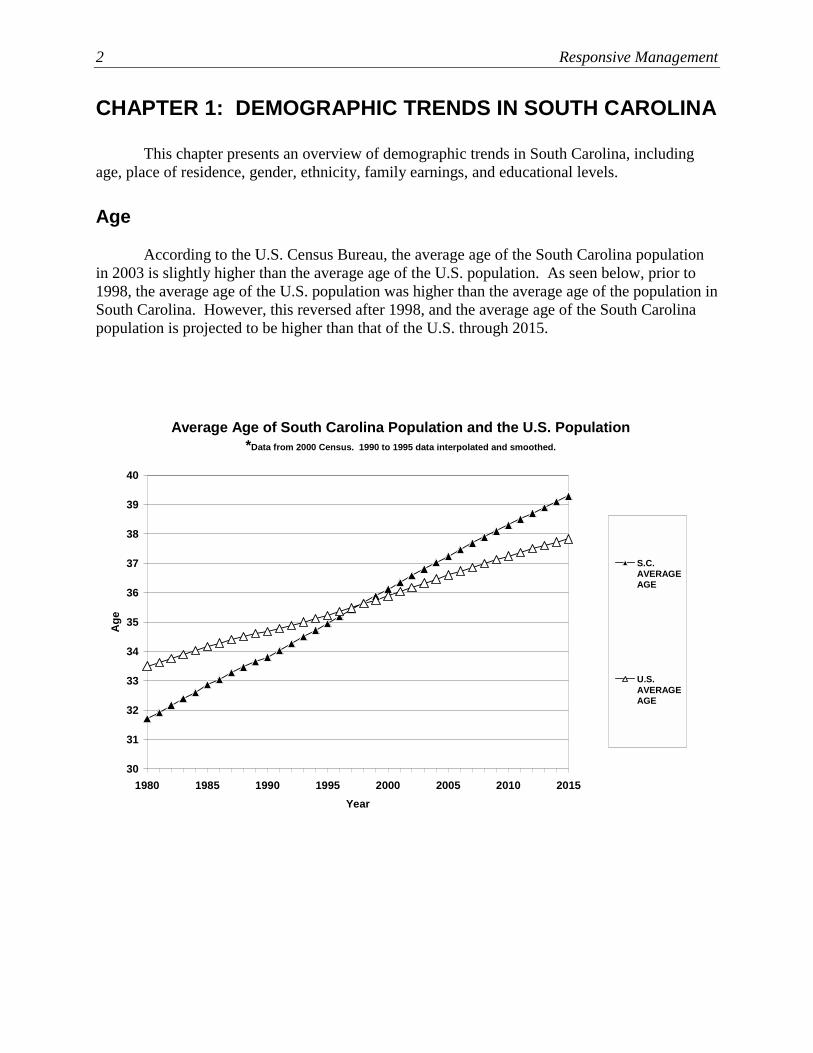
CHAPTER 1: DEMOGRAPHIC TRENDS IN SOUTH CAROLINA This chapter presents an overview of demographic trends in South Carolina, including age, place of residence, gender, ethnicity, family earnings, and educational levels. Age According to the U.S. Census Bureau, the average age of the South Carolina population in 2003 is slightly higher than the average age of the U.S. population. As seen below, prior to 1998, the average age of the U.S. population was higher than the average age of the population in South Carolina. However, this reversed after 1998, and the average age of the South Carolina population is projected to be higher than that of the U.S. through 2015.
Average Age of South Carolina Population and the U.S. Population*Data from 2000 Census. 1990 to 1995 data interpolated and smoothed.
30
31
32
33
34
35
36
37
38
39
40
1980 1985 1990 1995 2000 2005 2010 2015Year
Age
S.C.AVERAGEAGE
U.S.AVERAGEAGE
A Marketing Plan for the SC DNR Freshwater Fisheries Section 3
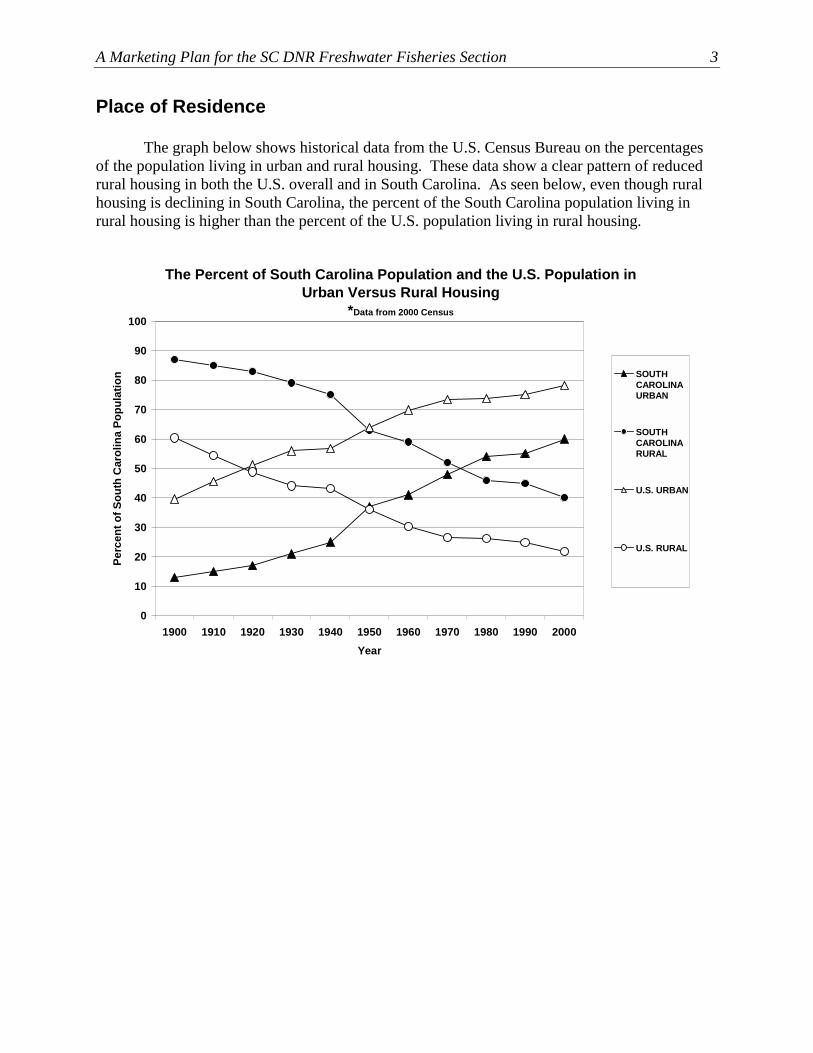
Place of Residence The graph below shows historical data from the U.S. Census Bureau on the percentages of the population living in urban and rural housing. These data show a clear pattern of reduced rural housing in both the U.S. overall and in South Carolina. As seen below, even though rural housing is declining in South Carolina, the percent of the South Carolina population living in rural housing is higher than the percent of the U.S. population living in rural housing.
The Percent of South Carolina Population and the U.S. Population in Urban Versus Rural Housing
*Data from 2000 Census
0
10
20
30
40
50
60
70
80
90
100
1900 1910 1920 1930 1940 1950 1960 1970 1980 1990 2000Year
Perc
ent o
f Sou
th C
arol
ina
Popu
latio
n SOUTHCAROLINAURBAN
SOUTHCAROLINARURAL
U.S. URBAN
U.S. RURAL
4 Responsive Management
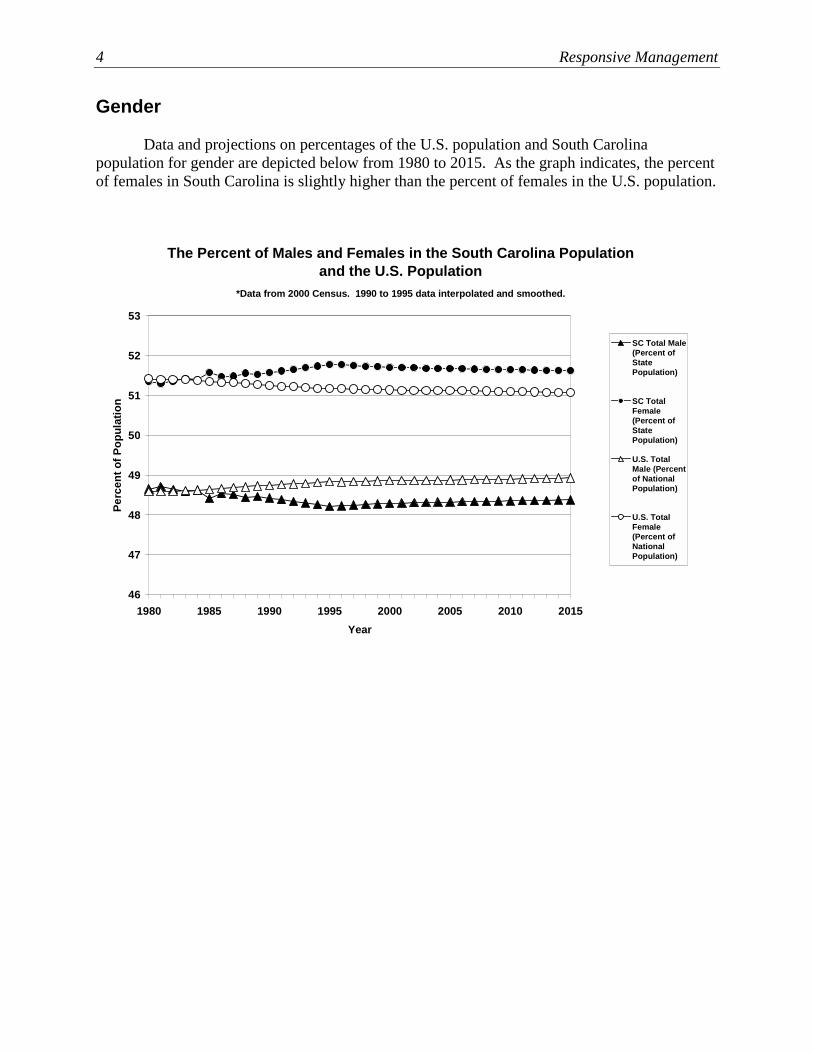
Gender Data and projections on percentages of the U.S. population and South Carolina population for gender are depicted below from 1980 to 2015. As the graph indicates, the percent of females in South Carolina is slightly higher than the percent of females in the U.S. population.
The Percent of Males and Females in the South Carolina Population and the U.S. Population
*Data from 2000 Census. 1990 to 1995 data interpolated and smoothed.
46
47
48
49
50
51
52
53
1980 1985 1990 1995 2000 2005 2010 2015Year
Perc
ent o
f Pop
ulat
ion
SC Total Male(Percent ofStatePopulation)
SC TotalFemale(Percent ofStatePopulation)
U.S. TotalMale (Percentof NationalPopulation)
U.S. TotalFemale(Percent ofNationalPopulation)
A Marketing Plan for the SC DNR Freshwater Fisheries Section 5
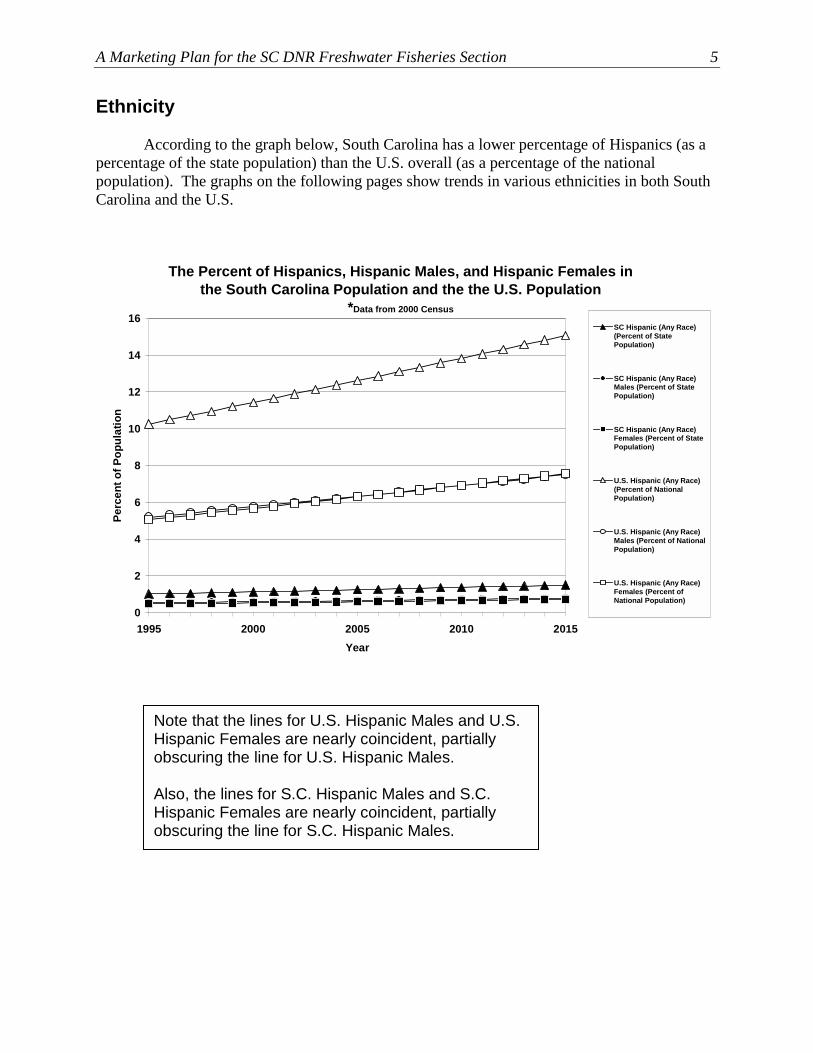
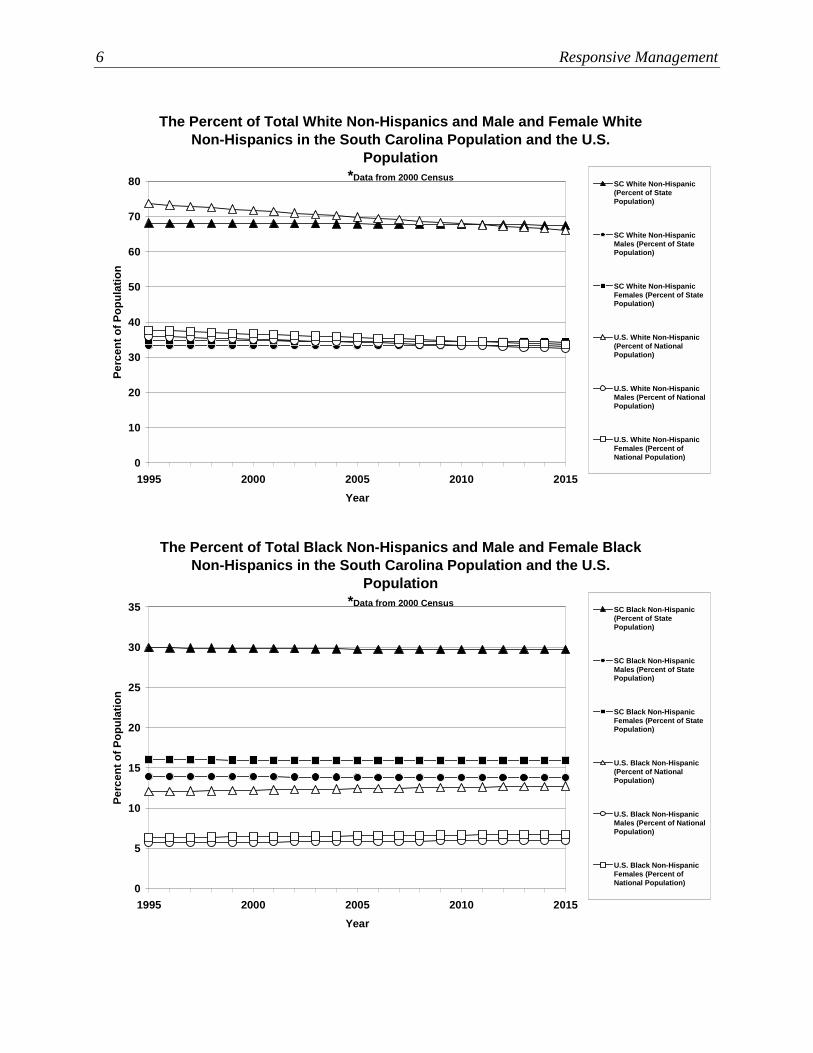
Ethnicity According to the graph below, South Carolina has a lower percentage of Hispanics (as a percentage of the state population) than the U.S. overall (as a percentage of the national population). The graphs on the following pages show trends in various ethnicities in both South Carolina and the U.S.
The Percent of Hispanics, Hispanic Males, and Hispanic Females in the South Carolina Population and the the U.S. Population
*Data from 2000 Census
0
2
4
6
8
10
12
14
16
1995 2000 2005 2010 2015Year
Perc
ent o
f Pop
ulat
ion
SC Hispanic (Any Race)(Percent of StatePopulation)
SC Hispanic (Any Race)Males (Percent of StatePopulation)
SC Hispanic (Any Race)Females (Percent of StatePopulation)
U.S. Hispanic (Any Race)(Percent of NationalPopulation)
U.S. Hispanic (Any Race)Males (Percent of NationalPopulation)
U.S. Hispanic (Any Race)Females (Percent ofNational Population)
Note that the lines for U.S. Hispanic Males and U.S. Hispanic Females are nearly coincident, partially obscuring the line for U.S. Hispanic Males. Also, the lines for S.C. Hispanic Males and S.C. Hispanic Females are nearly coincident, partially obscuring the line for S.C. Hispanic Males.
6 Responsive Management
The Percent of Total White Non-Hispanics and Male and Female White Non-Hispanics in the South Carolina Population and the U.S.
Population*Data from 2000 Census
0
10
20
30
40
50
60
70
80
1995 2000 2005 2010 2015Year
Perc
ent o
f Pop
ulat
ion
SC White Non-Hispanic(Percent of StatePopulation)
SC White Non-HispanicMales (Percent of StatePopulation)
SC White Non-HispanicFemales (Percent of StatePopulation)
U.S. White Non-Hispanic(Percent of NationalPopulation)
U.S. White Non-HispanicMales (Percent of NationalPopulation)
U.S. White Non-HispanicFemales (Percent ofNational Population)
The Percent of Total Black Non-Hispanics and Male and Female Black Non-Hispanics in the South Carolina Population and the U.S.
Population*Data from 2000 Census
0
5
10
15
20
25
30
35
1995 2000 2005 2010 2015Year
Perc
ent o
f Pop
ulat
ion
SC Black Non-Hispanic(Percent of StatePopulation)
SC Black Non-HispanicMales (Percent of StatePopulation)
SC Black Non-HispanicFemales (Percent of StatePopulation)
U.S. Black Non-Hispanic(Percent of NationalPopulation)
U.S. Black Non-HispanicMales (Percent of NationalPopulation)
U.S. Black Non-HispanicFemales (Percent ofNational Population)

A Marketing Plan for the SC DNR Freshwater Fisheries Section 7
The Percent of Total American Indian, Eskimo, and Aleut Non-Hispanics and Male and Female American Indian, Eskimo, and Aleut
Non-Hispanics in the South Carolina Population and the U.S. Population
*Data from 2000 Census
0.00
0.10
0.20
0.30
0.40
0.50
0.60
0.70
0.80
0.90
1995 2000 2005 2010 2015Year
Perc
ent o
f Pop
ulat
ion
SC American Indian,Eskimo, and Aleut Non-Hispanic (Percent of StatePopulation)
SC American Indian,Eskimo, and Aleut Non-Hispanic Male (Percent ofState Population)
SC American Indian,Eskimo, and Aleut Non-Hispanic Female (Percent ofState Population)
U.S. American Indian,Eskimo, and Aleut Non-Hispanic (Percent ofNational Population)
U.S. American Indian,Eskimo, and Aleut Non-Hispanic Male (Percent ofNational Population)
U.S. American Indian,Eskimo, and Aleut Non-Hispanic Female (Percent ofNational Population)
Note that the lines for S.C. American Indian, Eskimo, and Aleut Non-Hispanic Males and S.C. American Indian, Eskimo, and Aleut Non-Hispanic Females are nearly coincident, partially obscuring the line for S.C. American Indian, Eskimo, and Aleut Non-Hispanic Males.

8 Responsive Management
The Percent of Total Asian and Pacific-Islander Non-Hispanics and Male and Female Asian and Pacific-Islander Non-Hispanics in the
South Carolina Population and the U.S. Population*Data from 2000 Census
0
1
2
3
4
5
6
1995 2000 2005 2010 2015Year
Perc
ent o
f Pop
ulat
ion
SC Asian and Pacific-Islander Non-Hispanic(Percent of StatePopulation)
SC Asian and Pacific-Islander Non-Hispanic Male(Percent of StatePopulation)
SC Asian and Pacific-Islander Non-HispanicFemale (Percent of StatePopulation)
U.S. Asian and Pacific-Islander Non-Hispanic(Percent of NationalPopulation)
U.S. Asian and Pacific-Islander Non-Hispanic Male(Percent of NationalPopulation)
U.S. Asian and Pacific-Islander Non-HispanicFemale (Percent of NationalPopulation)
Note that the lines for S.C. Asian/Pacific Islander Non-
Hispanic Males and S.C. Asian/Pacific Islander Non-Hispanic Females are nearly coincident, partially obscuring the line for S.C. Asian/Pacific Islander Non-Hispanic Males.
A Marketing Plan for the SC DNR Freshwater Fisheries Section 9
The Percent of White Hispanic Males and Females in the South Carolina Population and the U.S. Population
*Data from 2000 Census
0
1
2
3
4
5
6
7
8
1995 2000 2005 2010 2015Year
Perc
ent o
f Pop
ulat
ion
SC White HispanicMale (Percent of StatePopulation)
SC White HispanicFemale (Percent ofState Population)
U.S. White HispanicMale (Percent ofNational Population)
U.S. White HispanicFemale (Percent ofNational Population)
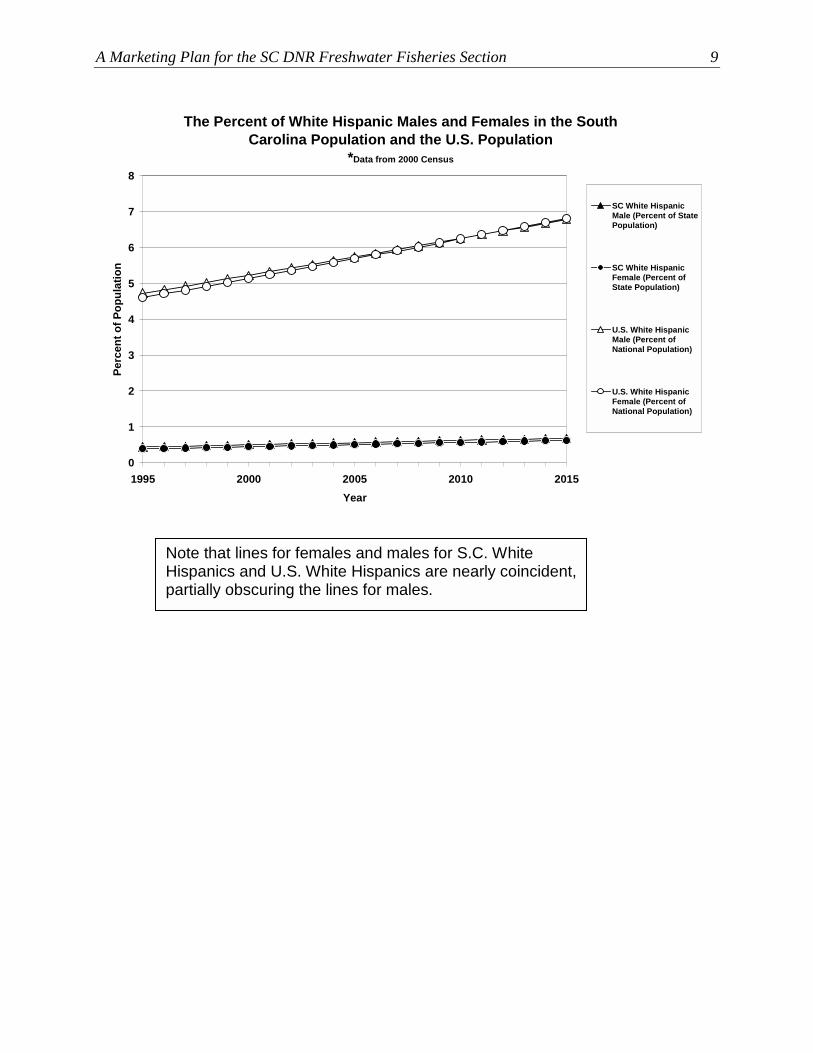
Note that lines for females and males for S.C. White Hispanics and U.S. White Hispanics are nearly coincident, partially obscuring the lines for males.

10 Responsive Management
The Percent of Black Hispanic Males and Females in the South Carolina Population and the U.S. Population
*Data from 2000 Census
0.00
0.10
0.20
0.30
0.40
0.50
0.60
1995 2000 2005 2010 2015Year
Perc
ent o
f Pop
ulat
ion
SC Black HispanicMale (Percent of StatePopulation)
SC Black HispanicFemale (Percent ofState Population)
U.S. Black HispanicMale (Percent ofNational Population)
U.S. Black HispanicFemale (Percent ofNational Population)
Note that lines for females and males for S.C. Black
Hispanics and U.S. Black Hispanics are nearly coincident, partially obscuring the lines for males.
A Marketing Plan for the SC DNR Freshwater Fisheries Section 11
The Percent of American Indian, Eskimo, and Aleut Hispanic Males and Females in the South Carolina Population and the U.S. Population
*Data from 2000 Census
0.00
0.01
0.02
0.03
0.04
0.05
0.06
0.07
0.08
0.09
1995 2000 2005 2010 2015Year
Perc
ent o
f Sou
th C
arol
ina
Popu
latio
n
SC American Indian,Eskimo, and AleutHispanic Male (Percentof State Population)
SC American Indian,Eskimo, and AleutHispanic Female(Percent of StatePopulation)
U.S. American Indian,Eskimo, and AleutHispanic Male (Percentof National Population)
U.S. American Indian,Eskimo, and AleutHispanic Female(Percent of NationalPopulation)
The Percent of Asian and Pacific-Islander Hispanic Males and Females in the South Carolina Population and the U.S. Population
*Data from 2000 Census
0.00
0.02
0.04
0.06
0.08
0.10
0.12
0.14
0.16
0.18
1995 2000 2005 2010 2015Year
Perc
ent o
f Pop
ulat
ion
SC Asian/Pacific-Islander Hispanic Male(Percent of StatePopulation)
SC Asian/Pacific-Islander HispanicFemale (Percent ofState Population)
U.S. Asian/Pacific-Islander Hispanic Male(Percent of NationalPopulation)
U.S. Asian/Pacific-Islander HispanicFemale (Percent ofNational Population)

12 Responsive Management
Income The median income in South Carolina has been consistently below that of the U.S. and as the graph below indicates, the difference has steadily increased since 1969. However, as the graph demonstrates, medium income in both the U.S. and South Carolina has risen considerably since 1969.
Median Household Income in the South Carolina Population and the U.S. Population (in 2000 dollars)
*Data from 2000 Census
0
5,000
10,000
15,000
20,000
25,000
30,000
35,000
40,000
45,000
1969 1979 1989 1999Year
Med
ian
Dol
lars
South Carolina
United States

A Marketing Plan for the SC DNR Freshwater Fisheries Section 13
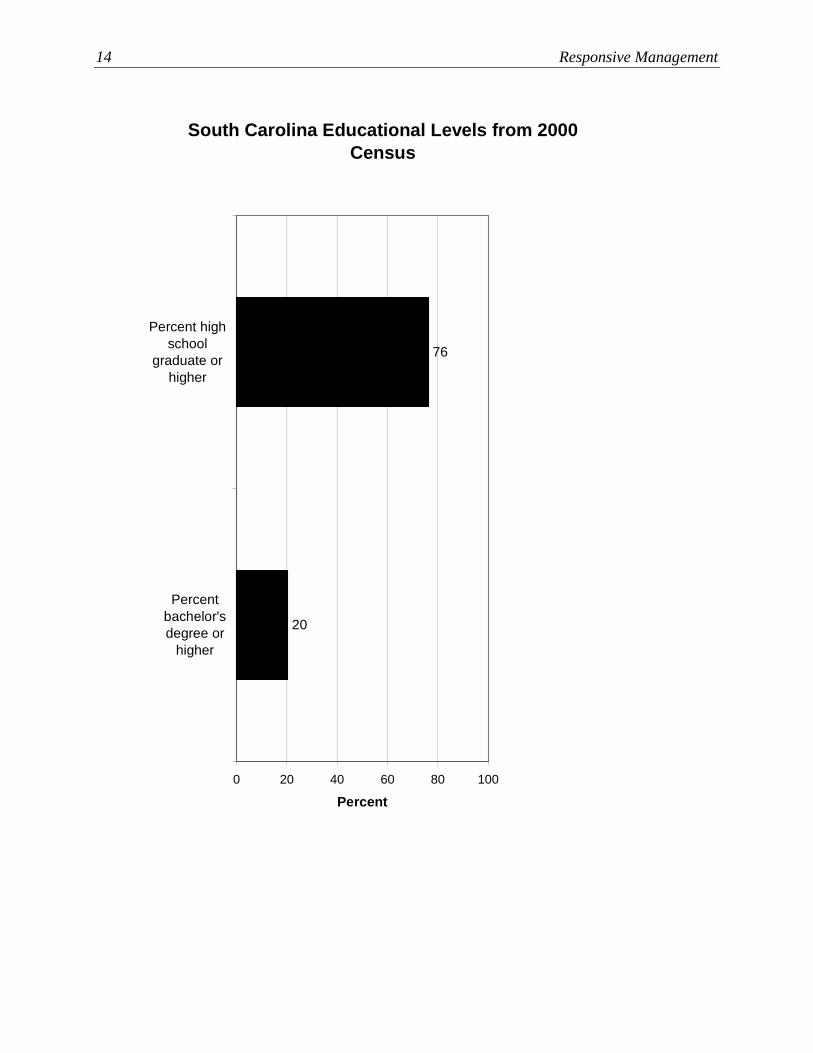
Education Data from the U.S. Bureau of Census indicate that the population (25 years old and older) in South Carolina has the following educational level breakdown as shown in the graph below. As the graph on the following page indicates, 76% of the population in South Carolina have attained the level of high school graduate or higher, while 20% have attained the level of Bachelor’s degree or higher.
South Carolina Educational Levels from 2000 Census
7
8
15
30
19
7
14
0 20 40 60 80 100
Less than 9thgrade
9th to 12thgrade, nodiploma
High schoolgraduate(includes
equivalency)
Somecollege, no
degree
Associatedegree
Bachelor'sdegree
Graduate orprofessional
degree
Percent
14 Responsive Management
South Carolina Educational Levels from 2000 Census
20
76
0 20 40 60 80 100
Percent highschool
graduate orhigher
Percentbachelor'sdegree or
higher
Percent

A Marketing Plan for the SC DNR Freshwater Fisheries Section 15
CHAPTER 2: SOUTH CAROLINA RESIDENTS’ ATTITUDES TOWARD FISHING AND AQUATIC RESOURCES
During the past ten years, Responsive Management has conducted several studies on the attitudes and opinions of South Carolina residents (anglers and non-anglers) toward fishing and aquatic resources in the state. The most recent study was conducted in 2002 for the Freshwater Fisheries Section of the SC DNR to assess South Carolina residents’ attitudes and behaviors toward fisheries and aquatic resources. The study entailed a telephone survey of South Carolina residents, and the major findings are presented below. Participation in Aquatic Activities, Interest in Fishing, Fishing Behaviors, and License Purchasing Opinions and Behaviors
A majority (56%) of respondents had participated in watching wildlife near a lake, stream, or river—the only activity in which a majority had participated. Other results: 38% had been motorized boating, 36% had fished in freshwater, 19% had fished in saltwater, 12% had been canoeing/kayaking, and 7% had been sailing. The z-score analysis found that for each activity, there was a positive correlation with participation in all other aquatic activities listed in the survey—in other words, those who participated in any activity were likely to have participated in other activities. Other important demographic characteristics associated with participation in most of the activities are being white, being male, and working in construction/development.
Of those who said that they had fished in both freshwater and saltwater in the past 12 months, 57% had fished more in freshwater, and 26% had fished more in saltwater (17% of respondents to this question had fished in freshwater and saltwater about equally). Of those who indicated that they had fished in either freshwater or saltwater but had not fished in both, 81% had fished exclusively in freshwater, and 19% had fished exclusively in saltwater. Of those who indicated that they had fished in freshwater and/or saltwater and indicated that they had not fished in “both about equally,” 91% had fished in freshwater either exclusively or predominantly, and 9% had fished in saltwater either exclusively or predominantly. Finally, in examining those who had fished exclusively in freshwater or saltwater and those who had fished in both in the past 12 months, 54% had fished exclusively in freshwater, 13% had fished exclusively in saltwater, and 33% had fished in both freshwater and saltwater.
The top reasons that those who had not fished in freshwater in the past 12 months had not done so were because of lack of interest (56%), work obligations (21%), and family obligations (15%). Those who had not fished in freshwater in the past 12 months were asked how interested they would be in doing so in the next 12 months, and 37% expressed interest. The following are some of the characteristics/behaviors that were associated with those who expressed interest in going freshwater fishing in the next 12 months: had watched wildlife near water; are male; had fished in saltwater; had been motorized boating; were 25 to 34 years old; and had a job in agriculture/farming, construction/development, or industry.
Half of those who had fished in freshwater in the past 12 months indicated that their freshwater fishing activity has remained about the same over the past five years, while 29% said it has decreased and 20% said it has increased. Those who said that their fishing activity has declined over the past 5 years said that “no time: work obligations” was a main reason that their

16 Responsive Management
freshwater fishing activity had declined (28%), and “family obligations” was also an important reason (18%).
The results show that 36% of respondents had purchased a fishing license in South Carolina in the past 2 years. Those who had purchased a fishing license were likely to have the following characteristics/behaviors: had fished in freshwater and/or saltwater; are male; had participated in motorized boating, watching wildlife near water, canoeing or kayaking, or sailing; were 35 to 54 years old; identified themselves as white; and had a job in industry, construction/development, or agriculture/farming.
Of those who had purchased a fishing license in the past 2 years in South Carolina, 56% had purchased a freshwater license only, 6% had purchased a saltwater license only, and 37% had purchased both types of licenses.
Of those who had not purchased a fishing license in South Carolina in the past 2 years, the leading reasons for not doing so were that they don’t fish and were not interested (63%), work obligations (13%), and family obligations (9%). Of those who had purchased a fishing license in South Carolina in the past 2 years, 93% said that there had not been anything that hindered their buying a fishing license.
Each respondent who had purchased a fishing license in the past 2 years in South Carolina was asked one of two questions about the likelihood of their purchasing a fishing license in the next year at an increased cost. Large majorities answered each question that they would be very likely to purchase a fishing license the next year at the given cost: 88% said they would be very likely to purchase a license for $12, and 75% said they would be very likely to purchase a license for $14 (the current cost is $10). Respondents saying that they would be not at all likely to purchase a license at an increased cost were 4% for the $12 cost and 10% for the $14 cost.
Regarding Internet purchasing, 65% said that they would be not at all likely to purchase a license over the Internet, while only 23% said that they would be very likely to purchase a license in this way.
A Marketing Plan for the SC DNR Freshwater Fisheries Section 17
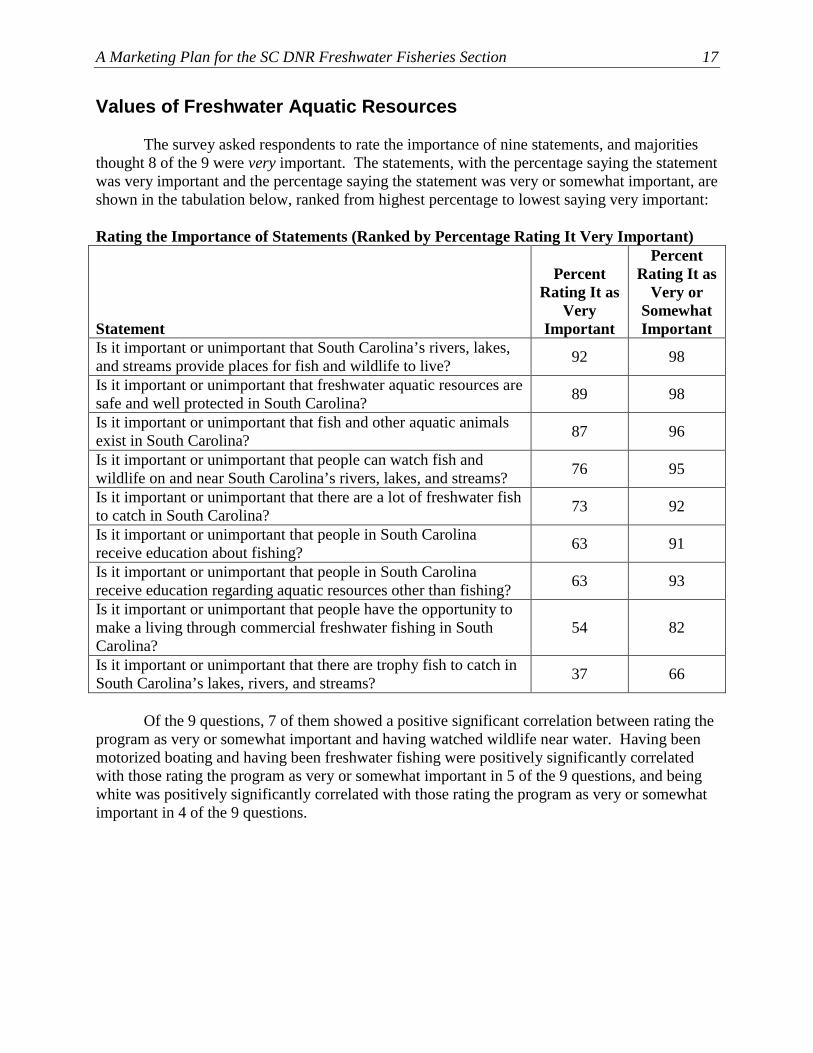
Values of Freshwater Aquatic Resources
The survey asked respondents to rate the importance of nine statements, and majorities thought 8 of the 9 were very important. The statements, with the percentage saying the statement was very important and the percentage saying the statement was very or somewhat important, are shown in the tabulation below, ranked from highest percentage to lowest saying very important: Rating the Importance of Statements (Ranked by Percentage Rating It Very Important)
Statement
Percent Rating It as
Very Important
Percent Rating It as
Very or Somewhat Important
Is it important or unimportant that South Carolina’s rivers, lakes, and streams provide places for fish and wildlife to live? 92 98
Is it important or unimportant that freshwater aquatic resources are safe and well protected in South Carolina? 89 98
Is it important or unimportant that fish and other aquatic animals exist in South Carolina? 87 96
Is it important or unimportant that people can watch fish and wildlife on and near South Carolina’s rivers, lakes, and streams? 76 95
Is it important or unimportant that there are a lot of freshwater fish to catch in South Carolina? 73 92
Is it important or unimportant that people in South Carolina receive education about fishing? 63 91
Is it important or unimportant that people in South Carolina receive education regarding aquatic resources other than fishing? 63 93
Is it important or unimportant that people have the opportunity to make a living through commercial freshwater fishing in South Carolina?
54 82
Is it important or unimportant that there are trophy fish to catch in South Carolina’s lakes, rivers, and streams? 37 66
Of the 9 questions, 7 of them showed a positive significant correlation between rating the
program as very or somewhat important and having watched wildlife near water. Having been motorized boating and having been freshwater fishing were positively significantly correlated with those rating the program as very or somewhat important in 5 of the 9 questions, and being white was positively significantly correlated with those rating the program as very or somewhat important in 4 of the 9 questions.
18 Responsive Management
Knowledge of and Opinions on SC DNR’s Freshwater Fisheries and Aquatic Resources Programs
A large majority (80%) of respondents knew little or nothing at all about the SC DNR’s freshwater fisheries and aquatic resources programs, while 19% knew a great deal or moderate amount (with only 2% saying they knew a great deal).
A majority (52%) of respondents said that the SC DNR does an excellent or good job of managing the state’s freshwater fisheries and aquatic resources, broken down to 10% saying excellent and 42% saying good. Only 1% rated the SC DNR’s performance as poor, and a relatively high percentage answered that they did not know (35%).
Regarding the SC DNR’s performance of managing the state’s freshwater fisheries and aquatic resources, 80% said that they had not heard any good things and 95% said that they had not heard any bad things about the SC DNR’s freshwater fisheries and aquatic resources programs.
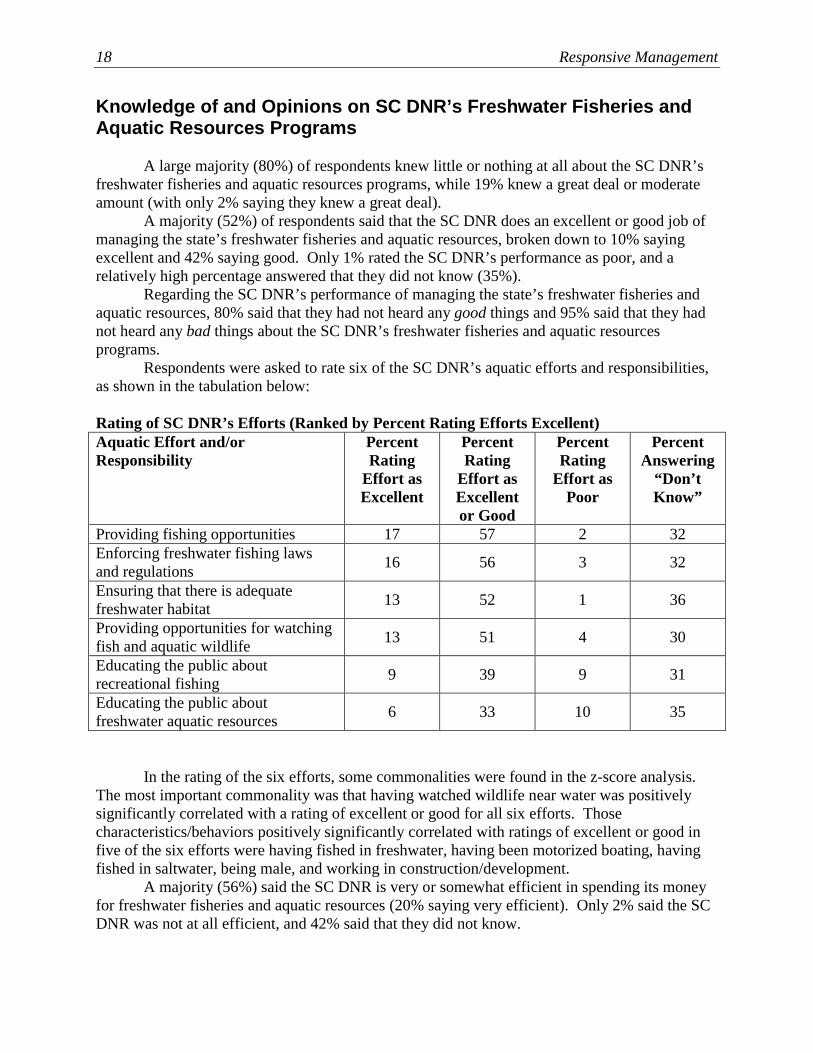
Respondents were asked to rate six of the SC DNR’s aquatic efforts and responsibilities, as shown in the tabulation below: Rating of SC DNR’s Efforts (Ranked by Percent Rating Efforts Excellent) Aquatic Effort and/or Responsibility
Percent Rating
Effort as Excellent
Percent Rating
Effort as Excellent or Good
Percent Rating
Effort as Poor
Percent Answering
“Don’t Know”
Providing fishing opportunities 17 57 2 32 Enforcing freshwater fishing laws and regulations 16 56 3 32
Ensuring that there is adequate freshwater habitat 13 52 1 36
Providing opportunities for watching fish and aquatic wildlife 13 51 4 30
Educating the public about recreational fishing 9 39 9 31
Educating the public about freshwater aquatic resources 6 33 10 35
In the rating of the six efforts, some commonalities were found in the z-score analysis. The most important commonality was that having watched wildlife near water was positively significantly correlated with a rating of excellent or good for all six efforts. Those characteristics/behaviors positively significantly correlated with ratings of excellent or good in five of the six efforts were having fished in freshwater, having been motorized boating, having fished in saltwater, being male, and working in construction/development.
A majority (56%) said the SC DNR is very or somewhat efficient in spending its money for freshwater fisheries and aquatic resources (20% saying very efficient). Only 2% said the SC DNR was not at all efficient, and 42% said that they did not know.
A Marketing Plan for the SC DNR Freshwater Fisheries Section 19
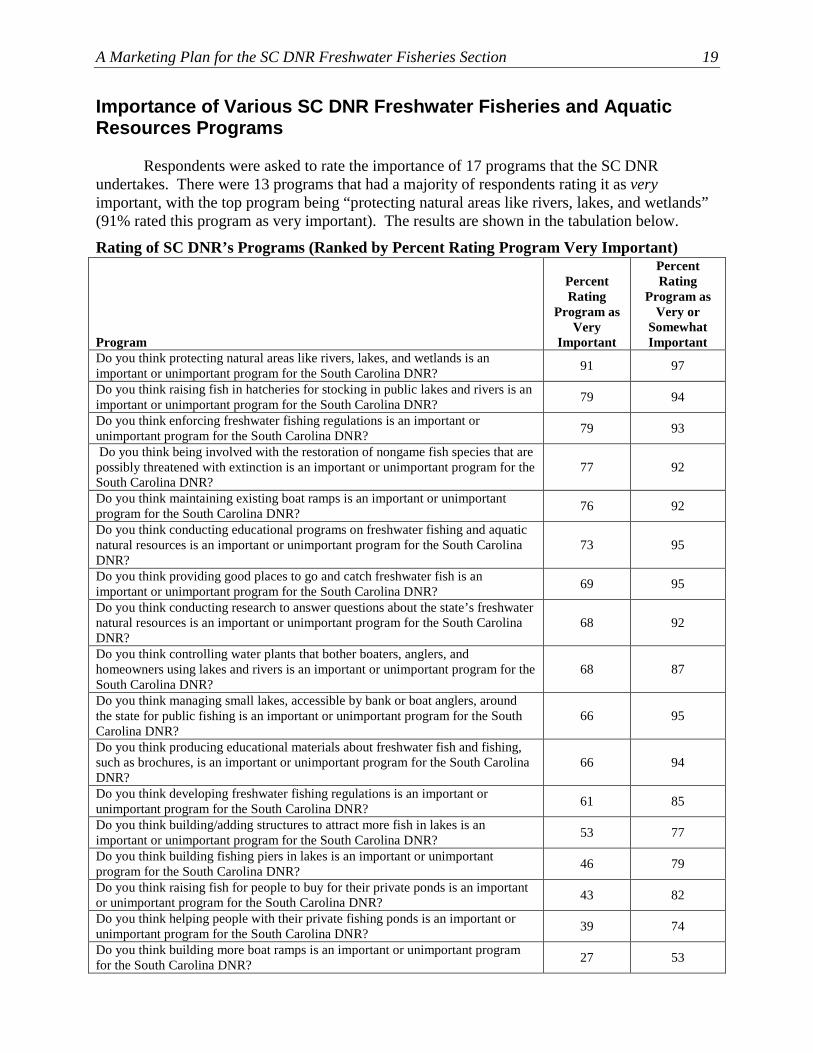
Importance of Various SC DNR Freshwater Fisheries and Aquatic Resources Programs
Respondents were asked to rate the importance of 17 programs that the SC DNR undertakes. There were 13 programs that had a majority of respondents rating it as very important, with the top program being “protecting natural areas like rivers, lakes, and wetlands” (91% rated this program as very important). The results are shown in the tabulation below.
Rating of SC DNR’s Programs (Ranked by Percent Rating Program Very Important)
Program
Percent Rating
Program as Very
Important
Percent Rating
Program as Very or
Somewhat Important
Do you think protecting natural areas like rivers, lakes, and wetlands is an important or unimportant program for the South Carolina DNR? 91 97
Do you think raising fish in hatcheries for stocking in public lakes and rivers is an important or unimportant program for the South Carolina DNR? 79 94
Do you think enforcing freshwater fishing regulations is an important or unimportant program for the South Carolina DNR? 79 93
Do you think being involved with the restoration of nongame fish species that are possibly threatened with extinction is an important or unimportant program for the South Carolina DNR?
77 92
Do you think maintaining existing boat ramps is an important or unimportant program for the South Carolina DNR? 76 92
Do you think conducting educational programs on freshwater fishing and aquatic natural resources is an important or unimportant program for the South Carolina DNR?
73 95
Do you think providing good places to go and catch freshwater fish is an important or unimportant program for the South Carolina DNR? 69 95
Do you think conducting research to answer questions about the state’s freshwater natural resources is an important or unimportant program for the South Carolina DNR?
68 92
Do you think controlling water plants that bother boaters, anglers, and homeowners using lakes and rivers is an important or unimportant program for the South Carolina DNR?
68 87
Do you think managing small lakes, accessible by bank or boat anglers, around the state for public fishing is an important or unimportant program for the South Carolina DNR?
66 95
Do you think producing educational materials about freshwater fish and fishing, such as brochures, is an important or unimportant program for the South Carolina DNR?
66 94
Do you think developing freshwater fishing regulations is an important or unimportant program for the South Carolina DNR? 61 85
Do you think building/adding structures to attract more fish in lakes is an important or unimportant program for the South Carolina DNR? 53 77
Do you think building fishing piers in lakes is an important or unimportant program for the South Carolina DNR? 46 79
Do you think raising fish for people to buy for their private ponds is an important or unimportant program for the South Carolina DNR? 43 82
Do you think helping people with their private fishing ponds is an important or unimportant program for the South Carolina DNR? 39 74
Do you think building more boat ramps is an important or unimportant program for the South Carolina DNR? 27 53

20 Responsive Management
There was a positive significant correlation between a rating of very or somewhat important and having been freshwater fishing in 10 of the 17 questions, and there was a positive significant correlation between a rating of very or somewhat important and having been motorized boating in 7 of the 17 questions. Other characteristics positively significantly correlated with a rating of very or somewhat important on many questions include being male (a significant positive z-score on 6 of the 17 questions), being white (a significant positive z-score on 5 of the 17 questions), and having a high school diploma or equivalent but having no further education (a significant positive z-score on 5 of the 17 questions). Importance of Various SC DNR Freshwater Fisheries and Aquatic Resources Education Programs
Respondents rated the importance of six educational programs of the SC DNR, and for each program, a majority rated it as very important, as shown in the tabulation below: Importance Rating of SC DNR’s Educational Programs (Ranked by Percent Rating Educational Program as Very Important)
Educational Program
Percent Rating
Educational Program as
Very Important
Percent Rating
Educational Program as
Very or Somewhat Important
Do you think parent-child activities are important or unimportant education programs for the South Carolina DNR? 79 96
Do you think producing educational brochures for kids is an important or unimportant education program for the South Carolina DNR?
63 89
Do you think producing other multimedia educational programs, such as TV, an Internet page, etc., is an important or unimportant program for the South Carolina DNR?
62 92
Do you think producing educational brochures for adults is an important or unimportant education program for the South Carolina DNR?
61 93
Do you think in-school programs such as teacher workshops are important or unimportant education programs for the South Carolina DNR?
58 86
Do you think youth programs such as fishing rodeos are important or unimportant education programs for the South Carolina DNR?
54 81
Several characteristics/behaviors were positively correlated with a rating of very or
somewhat important for this series of questions: in 5 of the 6 questions, those who gave a rating of very or somewhat important were positively significantly related to having watched wildlife near water; and in 3 of the 6 questions, those who gave a rating of very or somewhat important
A Marketing Plan for the SC DNR Freshwater Fisheries Section 21
were positively significantly related to having been motorized boating. Interestingly, fishing was not a strong factor: in only 2 of the 6 questions was having been freshwater fishing positively significantly correlated with those respondents answering very or somewhat important, and in only 1 of the 6 questions was having been saltwater fishing positively significantly correlated with those respondents’ answering very or somewhat important. Funding for SC DNR’s Freshwater Fisheries and Aquatic Resources Programs
The most common answer among respondents regarding where funding for freshwater fishing opportunities comes from in South Carolina was “don’t know” (34%). The next most popular answers were fishing licenses (28%) and taxes in general (24%).
Respondents were asked about funding options for the SC DNR’s freshwater fisheries and aquatic resources program, and a plurality responded that funds should come from anglers and the general revenue equally (46%). At either end of the spectrum, 4% thought that anglers should pay for all of the funding for the SC DNR, and 4% thought that the general revenue should pay for all of the funding for the SC DNR.
An overwhelming majority (91%) of respondents had not heard of the Federal Aid in Sport Fish Restoration Program, also known as the Dingell-Johnson Program or the Wallop-Breaux Program, before this survey. However, after being informed of the program, 55% indicated that they support the program (25% strongly supporting); only 9% said that they oppose the program.
The survey asked respondents about their likelihood of purchasing a fishing license or stamp in three situations, with fairly consistent results for all three questions. For each situation, a majority (from 53% to 61%) indicated that they would be very or somewhat likely to purchase a fishing license or stamp. When looking only at those who said that they would be very likely to purchase a fishing license or stamp, the survey found that 30% would be very likely to purchase a fishing license, even if not to be used, with the proceeds going to improve water quality; 28% would be very likely to purchase a fishing license, even if not to be used, as a way to support freshwater fisheries and aquatic resources conservation; and 25% would be very likely to purchase a fishing stamp to fish for certain hatchery-raised fish, such as striped bass and trout, with the proceeds going toward the SC DNR’s freshwater fisheries program.
An analysis was performed on responses to likelihood of purchasing a stamp to fish for certain hatchery-raised species by those who had purchased a license in the past 2 years, those who indicated that they had fished in freshwater in the past 2 years, and those who had fished in saltwater in the past 2 years. Among those who had purchased a license in the past 2 years, 73% indicated that they would be very or somewhat likely to purchase a stamp to fish for certain hatchery-raised species, and 36% indicated that they would be very likely to purchase a stamp. Among those who had fished in freshwater in the past 2 years, 73% indicated that they would be very or somewhat likely to purchase a stamp to fish for certain hatchery-raised species, and 37% indicated that they would be very likely to purchase a stamp. Finally, among those who had fished in saltwater in the past 2 years, 77% indicated that they would be very or somewhat likely to purchase a stamp to fish for certain hatchery-raised species, and 36% indicated that they would be very likely to purchase a stamp. Note that these amounts (ranging from 73% to 77%) indicating that they would be likely to purchase a stamp to fish for certain hatchery-raised

22 Responsive Management
species are higher than those among the general population who said they would be likely to purchase a stamp (57%). Potential Regulatory Changes, Including Regulations Regarding Dams
A majority (69%) of respondents supported giving the SC DNR the ability to set fishing regulations in lieu of having the South Carolina State Legislature do so, with 39% strongly supporting this action. A majority (64%) also supported giving the SC DNR the ability to set fishing license fees, with 36% strongly supporting this action. However, freshwater anglers were statistically more likely to oppose giving the SC DNR the ability to set fishing license fees.
A large majority (78%) of respondents agreed that the SC DNR should require dam owners to put fish passage facilities at the dams so as not to impede migrating fish, with 60% having strongly agreed. SC DNR’s Potential Involvement with Commercial Fishing
Recreational fishing was perceived to be more important for the SC DNR’s involvement than was commercial fishing. In total, 86% of respondents thought the SC DNR should emphasize its recreational fishing efforts (36% saying recreational fishing should be the sole emphasis, 50% saying both recreational and commercial fishing should be emphasized), and 51% thought the SC DNR should emphasize its commercial fishing efforts (1% saying commercial fishing should be the sole emphasis, 50% saying both recreational and commercial fishing should be emphasized).
A majority (52%) supported the practice of having some anglers catch freshwater fish, such as catfish, for the purpose of commercial sale. An even larger majority (70%) supported allowing commercial interests to raise freshwater fish, such as bass or crappie, for sale to the public in grocery stores and restaurants. Ways for the SC DNR to Provide Information about Freshwater Fisheries and Aquatic Resources Programs
A majority (52%) of respondents favored direct mail as the best way for them to receive information on fishing and aquatic resources. The next most popular ways were the Internet (16%), television (16%), and newspapers (12%). Knowledge of Aquatic Wildlife
In assessing general knowledge about basic aquatic species, only 1 of the 3 questions concerning what types of food three aquatic species eat was answered correctly by a majority of respondents. Correct knowledge of what type of food sharks typically eat was the highest of the three species: 68% of respondents correctly named the kind of food that sharks usually eat (saltwater fish). Correct knowledge about other basic aquatic wildlife was low, with less than a majority being able to identify the correct food of largemouth bass or river otters. Less than a majority (42%) of respondents correctly named the kind of food that largemouth bass eat (other

A Marketing Plan for the SC DNR Freshwater Fisheries Section 23
fish, including bream), and nearly the same percentage (41%) correctly named the kind of food that river otters usually eat (fish and frogs).
24 Responsive Management
CHAPTER 3: SOUTH CAROLINA RESIDENTS’ ATTITUDES AND OPINIONS TOWARD WILDLIFE AND MARINE RESOURCES
In 1994, Responsive Management conducted a study for the South Carolina Wildlife and
Marine Resources Department (Department) to gauge opinions and attitudes of adult South Carolina residents toward fish, wildlife and marine resources management in the state. Specifically, the survey objectives were to: 1) identify the Department’s total market, 2) identify the market size, 3) identify what citizens think the Department is doing right, 4) identify what constituents want from the Department in terms of programs and services, 5) identify respondents’ willingness to pay for specific programs and services, and 6) identify sources of information on wildlife for citizens. The information generated from the survey was designed to assist the Department in better serving South Carolina citizens and to generate more recognition and support for the Department. Participation and Interest in Recreational Fishing
Forty-nine percent of respondents said that they had freshwater fished in South Carolina in the past two years, and 24% of respondents saltwater fished in South Carolina in the past two years. Eighteen percent of respondents said that they shellfished in South Carolina in the past two years. Other activities that respondents said they participated in were as follows: 10% of respondents canoed in South Carolina in the past two years, 43% of respondents motorboated in South Carolina in the past two years, and 9% of respondents sailed in South Carolina in the past two years.
In 1993, 41% of freshwater anglers said that they spent 0-5 days freshwater fishing in South Carolina, 31% said that they spent 6-20 days, and 28% said they spent 21 or more days freshwater fishing in South Carolina. Sixty-four percent of saltwater anglers said they spent 0-5 days saltwater fishing, and 23% said they spent 6-20 days saltwater fishing in South Carolina. In 1993, 64% of shellfish “anglers” spent 0-5 days shellfishing in South Carolina, 30% spent 6-20 days and 6% spent 21 or more days shellfishing in South Carolina. Thirty-six percent of non-anglers said that they would be interested in going fishing or shellfishing in South Carolina, 60% of non-anglers said that they would not be interested in going fishing or shellfishing in South Carolina, and 5% said they did not know. Non-anglers who said they were interested in going fishing or shellfishing in South Carolina were interested in the following types of fishing: 73% said freshwater, 44% said saltwater, 26% said shellfishing, and 1% said other. Opinions on the Performance and Focus of the Department
Respondents were asked to rate the overall performance of the Department in protecting, enhancing and managing the state’s fish, wildlife and marine resources. Eleven percent rated the overall performance of the Department as excellent, 44% rated the overall performance as good, 14% rated the overall performance as fair, 3% rated the overall performance as poor, and 29% of respondents did not know or had no opinion when asked to rate the overall performance of the Department.

A Marketing Plan for the SC DNR Freshwater Fisheries Section 25
Among 18 fish, wildlife, and natural resource programs presented to South Carolina residents, the top 4 programs that residents said should have increased funding were all related to education. In order of priority, the natural resource programs for which South Carolinians wanted increased funding were:
• Educating children about fish, wildlife and natural resources through schools. Thirty-
five percent of respondents said that much more time and money should be spent providing educational opportunities to children about fish, wildlife and natural resources through schools, 45% said more, 14% said about the same, 2% said less, 1% said much less, and 3% did not know.
• Boater Education. Thirty-four percent said that much more time and money should be spent providing education and safety training to boaters, 42% said more, 17% said about the same, 2% said less, 1% said much less, and 5% said they did not know.
• Hunter Education. Thirty-two percent of respondents said that much more time and money should be spent providing education and safety training to hunters, 41% said more, 18% said about the same, 2% said less, 1% said much less, and 6% said they did not know.
• Educate residents about South Carolina’s fish, wildlife and marine resources. Twenty percent said much more time and money should be spent educating and informing residents about South Carolina’s fish, wildlife and marine resources, 49% said more, 23% said about the same, 3% said less, 1% said much less, and 4% did not know.
26 Responsive Management
CHAPTER 4: FISHING PARTICIPATION IN THE UNITED STATES AND SOUTH CAROLINA
Several studies have been conducted to track trends in fishing participation both nationally and statewide. The longest and most continuous study on recreational angling in the U.S. is the National Survey of Fishing, Hunting, and Wildlife-Associated Recreation administered by the U.S. Fish and Wildlife Service. Conducted at 5-year intervals since 1955, the study provides estimates of the number of anglers as well as descriptions of their fishing activities and demographic characteristics. Although it is not possible to directly compare results between some years due to different survey methodologies, general trends in participation can still be observed. It should be noted, however, that comparisons are possible among the National Surveys conducted in 1991, 1996, and 2001 because similar methodologies were used.
After a decade of substantial growth in the total number of anglers nationwide, fishing participation in the U.S. has leveled off nationwide and has also decreased substantially in many states (Responsive Management, 1999).
Nationally, between 1980 and 1990, fishing participation among those aged 6 years and older increased by 20%. Between 1991 and 1996, fishing participation declined from 35.6 million anglers 16 years old and older to 35.2 million nationwide. In 2001, fishing participation declined even further to 34.1 million anglers 16 years old and older nationwide. As a percentage of the general population, fishing has decreased slightly. In 1991, 19% of those aged 16 years and older fished, whereas only 17% fished in 1996 (U.S. Department of the Interior, 1997, in Responsive Management, 1999). In 2001, only 16% of those aged 16 years and older fished in the United States (U.S. Department of the Interior, 2001). From 1991 to 2001, the number of all anglers declined 4% while expenditures increased 14%. Saltwater fishing increased 22%, but freshwater fishing declined by 6% (U.S. Department of the Interior, 2001). Overall Trends in Fishing Participation in South Carolina (1980-1996) The National Surveys of Fishing, Hunting, and Wildlife-Associated Recreation indicate that South Carolina has experienced some similarity in trends in overall fishing participation to that of the United States. For example, participation increased between 1980 and 1985 but decreased between 1996 and 2001. South Carolina had a rise in fishing participation between 1991 and 1996, which differs from the national trend. Fishing trip related expenditures increased slightly between 1991 and 2001 in South Carolina. South Carolina trends for freshwater and saltwater fishing differed from the national trends. In South Carolina, the number of anglers who fished in freshwater increased between 1991 and 1996 but decreased between 1996 and 2001. The number of saltwater anglers, in contrast, has increased slightly from 1991 to 2001.
A Marketing Plan for the SC DNR Freshwater Fisheries Section 27
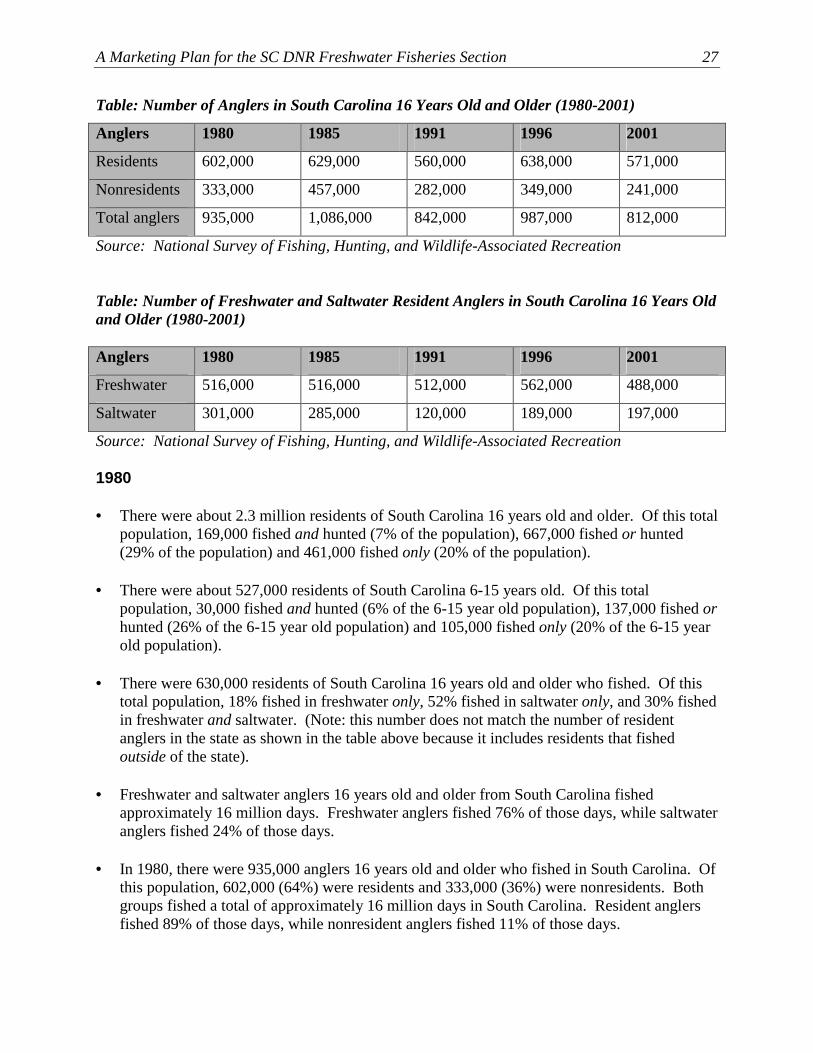
Table: Number of Anglers in South Carolina 16 Years Old and Older (1980-2001)
Anglers 1980 1985 1991 1996 2001
Residents 602,000 629,000 560,000 638,000 571,000
Nonresidents 333,000 457,000 282,000 349,000 241,000
Total anglers 935,000 1,086,000 842,000 987,000 812,000
Source: National Survey of Fishing, Hunting, and Wildlife-Associated Recreation
Table: Number of Freshwater and Saltwater Resident Anglers in South Carolina 16 Years Old and Older (1980-2001) Anglers 1980 1985 1991 1996 2001
Freshwater 516,000 516,000 512,000 562,000 488,000
Saltwater 301,000 285,000 120,000 189,000 197,000
Source: National Survey of Fishing, Hunting, and Wildlife-Associated Recreation 1980 • There were about 2.3 million residents of South Carolina 16 years old and older. Of this total
population, 169,000 fished and hunted (7% of the population), 667,000 fished or hunted (29% of the population) and 461,000 fished only (20% of the population).
• There were about 527,000 residents of South Carolina 6-15 years old. Of this total
population, 30,000 fished and hunted (6% of the 6-15 year old population), 137,000 fished or hunted (26% of the 6-15 year old population) and 105,000 fished only (20% of the 6-15 year old population).
• There were 630,000 residents of South Carolina 16 years old and older who fished. Of this
total population, 18% fished in freshwater only, 52% fished in saltwater only, and 30% fished in freshwater and saltwater. (Note: this number does not match the number of resident anglers in the state as shown in the table above because it includes residents that fished outside of the state).
• Freshwater and saltwater anglers 16 years old and older from South Carolina fished
approximately 16 million days. Freshwater anglers fished 76% of those days, while saltwater anglers fished 24% of those days.
• In 1980, there were 935,000 anglers 16 years old and older who fished in South Carolina. Of
this population, 602,000 (64%) were residents and 333,000 (36%) were nonresidents. Both groups fished a total of approximately 16 million days in South Carolina. Resident anglers fished 89% of those days, while nonresident anglers fished 11% of those days.
28 Responsive Management
• Nonresident and resident anglers spent a total of about $105 million on fishing trip related expenditures in South Carolina. Of this total, residents spent about $68 million (64%), while nonresidents spent about $37 million (36%).
1985 • There were about 2.4 million residents of South Carolina 16 years old and older. Of this total
population, 179,000 fished and hunted (7% of the population 16 years old and older), 690,000 fished or hunted (20% of the population 16 years old and older) and 481,000 fished only (28% of the population 16 years old and older).
• There were 538,000 residents of South Carolina 6-15 years old. Of this total population,
26,000 fished and hunted (5% of the population 6-15 years old), 144,000 fished or hunted (27% of the population 6-15 years old) and 117,000 fished only (22% of the population 6-15 years old).
• In 1985, there were about 1 million anglers 16 years old and older who fished in South
Carolina. Of this angler population, 629,000 were residents (58%), and 457,000 were nonresidents (42%). Both groups together fished approximately 20 million days in South Carolina. Resident anglers fished 85% of the days, and nonresidents fished 15% of the days.
• Approximately 564,000 residents and nonresidents fished in saltwater in South Carolina. Of
this total saltwater angler population, 51% were residents and 49% were nonresidents. Saltwater anglers fished approximately 5 million days in South Carolina. Residents fished 81% of the days, and nonresidents fished 19% of the days.
• Approximately 740,000 residents and nonresidents fished in freshwater in South Carolina.
Of this total freshwater angler population, 70% were residents, and 30% were nonresidents. Freshwater anglers fished approximately 15 million days in South Carolina. Residents fished 87% of the days, and nonresidents fished 13% of the days.
• Nonresident and resident anglers spent a total of about $276 million on fishing trip related
expenditures in South Carolina. Of this total, residents spent about $185 million (67%), while nonresidents spent about $91 million (33%).
1991 • There were about 2.6 million residents of South Carolina 16 years old and older. Of this total
population, 151,000 fished and hunted (6% of the population 16 years old and older), 630,000 fished or hunted (24% of the population 16 years old and older) and 444,000 fished only (17% of the population 16 years old and older).
• In 1991, there were about 842,000 anglers 16 years old and older who fished in South
Carolina. Of this population, 560,000 were residents (67% of the angler population) and 282,000 were nonresidents (33% of the angler population). Both groups fished
A Marketing Plan for the SC DNR Freshwater Fisheries Section 29
approximately 10 million days in South Carolina. Resident anglers fished 81% of the days, and nonresidents fished 19% of the days.
• Approximately 298,000 residents and nonresidents fished in saltwater in South Carolina. Of
this total saltwater angler population, 40% were residents, and 60% were nonresidents. Saltwater anglers fished approximately 1.5 million days in South Carolina. Residents fished 50% of the days, and nonresidents fished 50% of the days.
• Approximately 645,000 residents and nonresidents fished in freshwater in South Carolina.
Of this total freshwater angler population, 79% were residents, and 21% were nonresidents. Freshwater anglers fished approximately 9 million days in South Carolina. Residents fished 85% of the days, and nonresidents fished 15% of the days.
• Nonresident and resident anglers 16 years old and older spent a total of about $241 million
on fishing trip related expenditures in South Carolina. Of this total, residents spent about $125 million (52%), while nonresidents spent about $116 million (48%).
1996 • There were about 2.8 million residents of South Carolina 16 years old and older. Of this total
population, 199,000 fished and hunted (7% of the population 16 years old and older), 718,000 fished or hunted (25% of the population 16 years old and older) and 475,000 fished only (17% of the population 16 years old and older).
• In 1996, there were about 986,000 anglers 16 years old and older in South Carolina. Of this
population, 638,000 were residents (65% of the angler population), and 349,000 were nonresidents (35% of the angler population). Both groups fished approximately 15 million days in South Carolina. Resident anglers fished 85% of the days, and nonresidents fished 15% of the days.
• Approximately 382,000 residents and nonresidents fished in saltwater in South Carolina. Of
this total saltwater angler population, 50% were residents, and 50% were nonresidents. Saltwater anglers fished approximately 2.4 million days in South Carolina. Residents fished 70% of the days, and nonresidents fished 30% of the days.
• Approximately 716,000 residents and nonresidents fished in freshwater in South Carolina.
Of this total freshwater angler population, 78% were residents, and 22% were nonresidents. Freshwater anglers fished approximately 11.3 million days in South Carolina. Residents fished 92% of the days, and nonresidents fished 8% of the days.
• Nonresident and resident anglers 16 years old and older spent a total of about $302 million
on fishing trip related expenditures in South Carolina.

30 Responsive Management
2001 • There were about 3.1 million residents of South Carolina 16 years old and older. Of this total
population, 162,000 fished and hunted (5% of the population 16 years old and older), 674,000 fished or hunted (22% of the population 16 years old and older) and 442,000 fished only (14% of the population 16 years old and older).
• In 2001, there were about 812,000 anglers 16 years old and older in South Carolina. Of this
population, 571,000 were residents (70% of the angler population), and 241,000 were nonresidents (30% of the angler population). Both groups fished approximately 10.7 million days in South Carolina. Resident anglers fished 91% of the days, and nonresidents fished 9% of the days.
• Approximately 348,000 residents and nonresidents 16 years old and older fished in saltwater
in South Carolina. Of this saltwater angler population, 56% were residents, and 44% were nonresidents. Saltwater anglers fished approximately 2 million days in South Carolina. Residents fished 73% of the days, and nonresidents fished 27% of the days.
• Approximately 591,000 residents and nonresidents 16 years old and older fished in
freshwater in South Carolina. Of this freshwater angler population, 82% were residents, and 18% were nonresidents. Freshwater anglers fished approximately 8.7 million days in South Carolina. Residents fished 96% of the days, and nonresidents fished 4% of the days.
• Nonresident and resident anglers 16 years old and older spent a total of about $318 million
on fishing trip related expenditures in South Carolina.

A Marketing Plan for the SC DNR Freshwater Fisheries Section 31
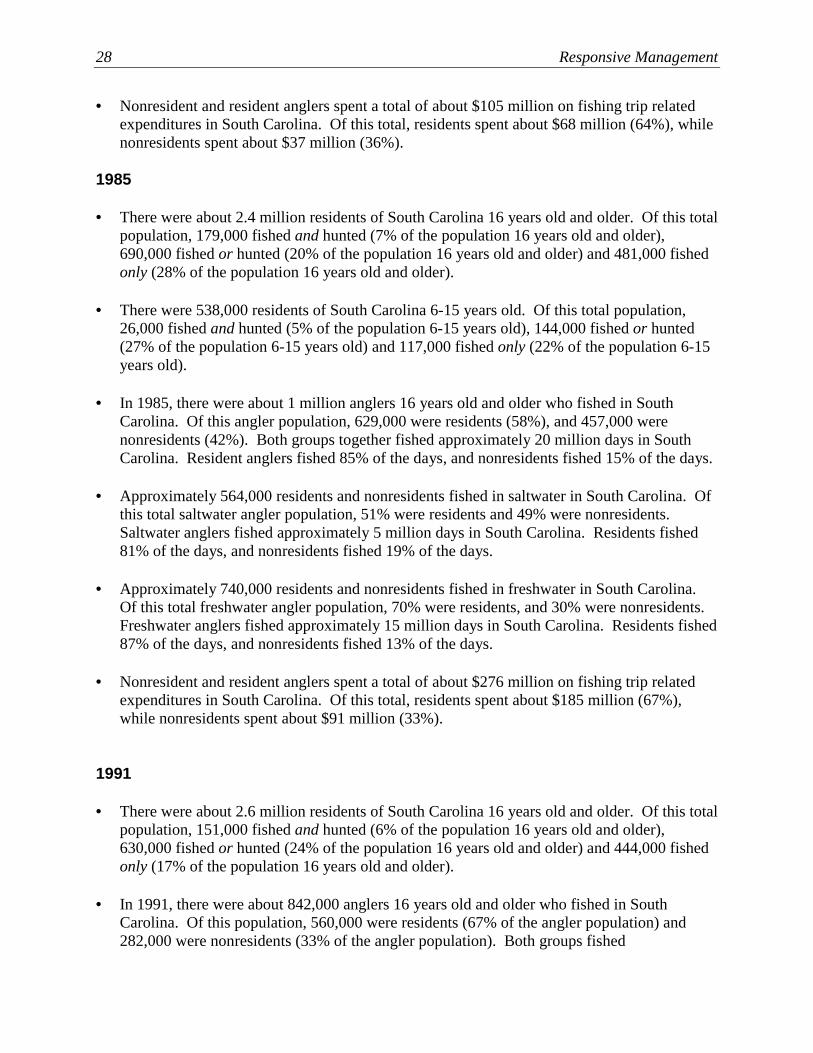
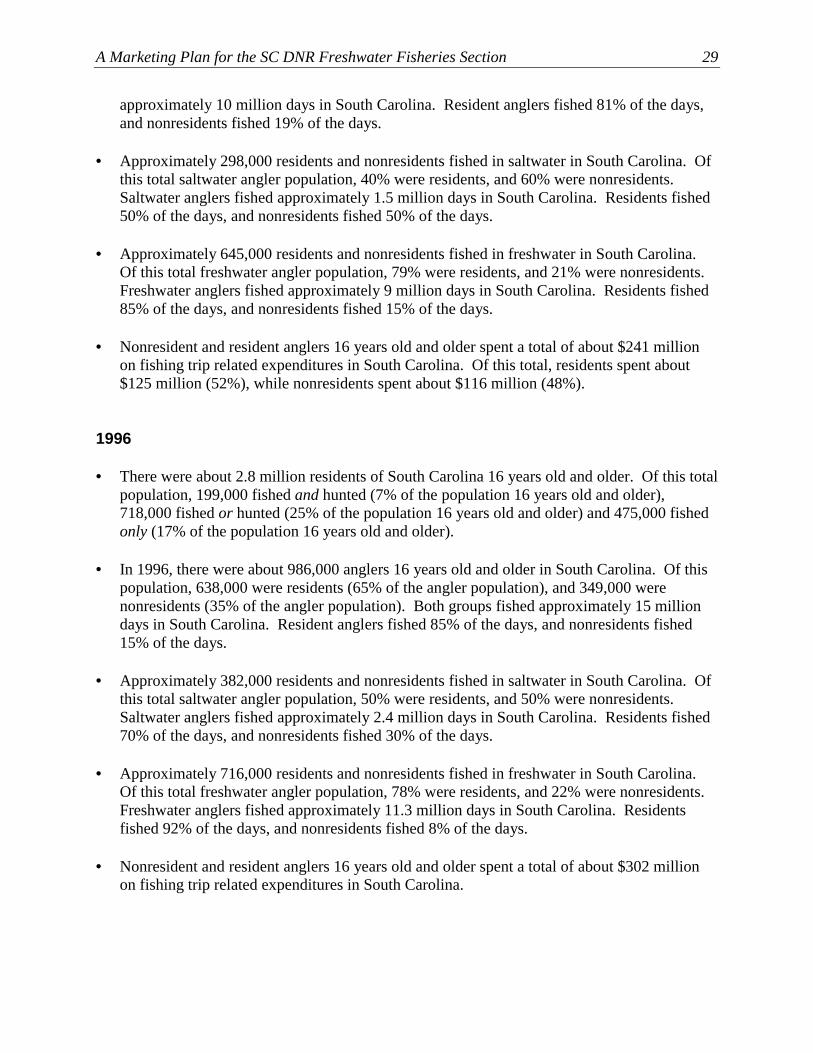
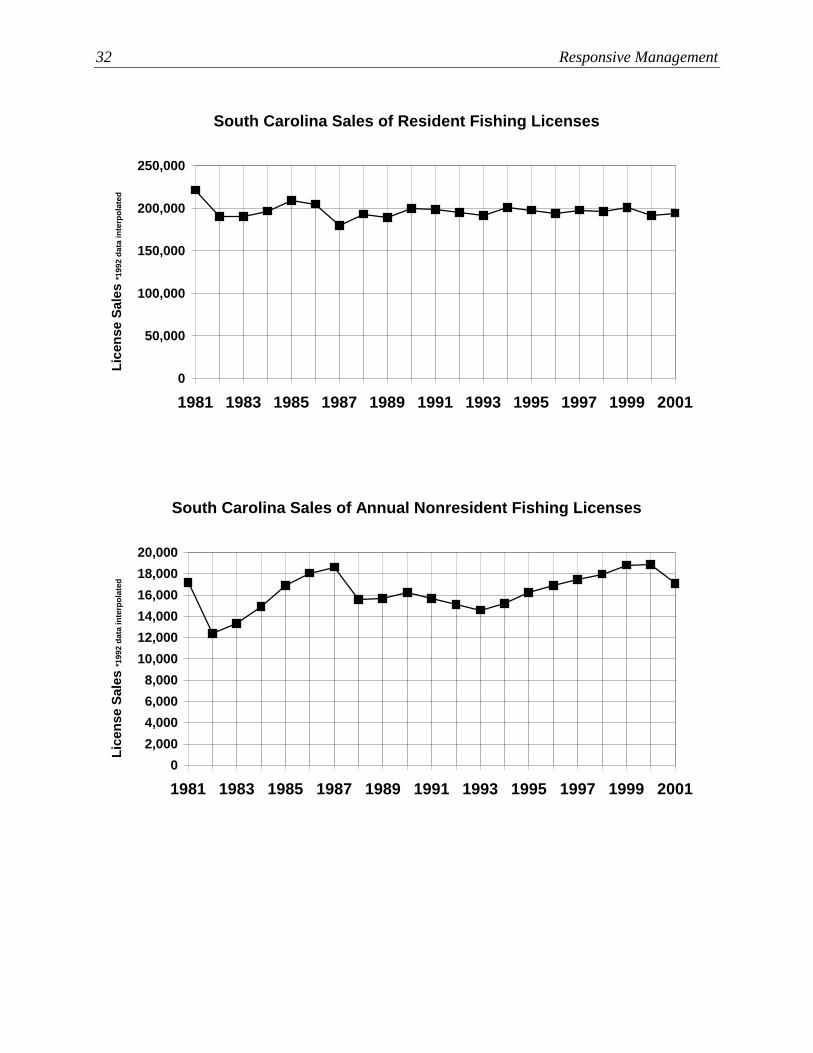
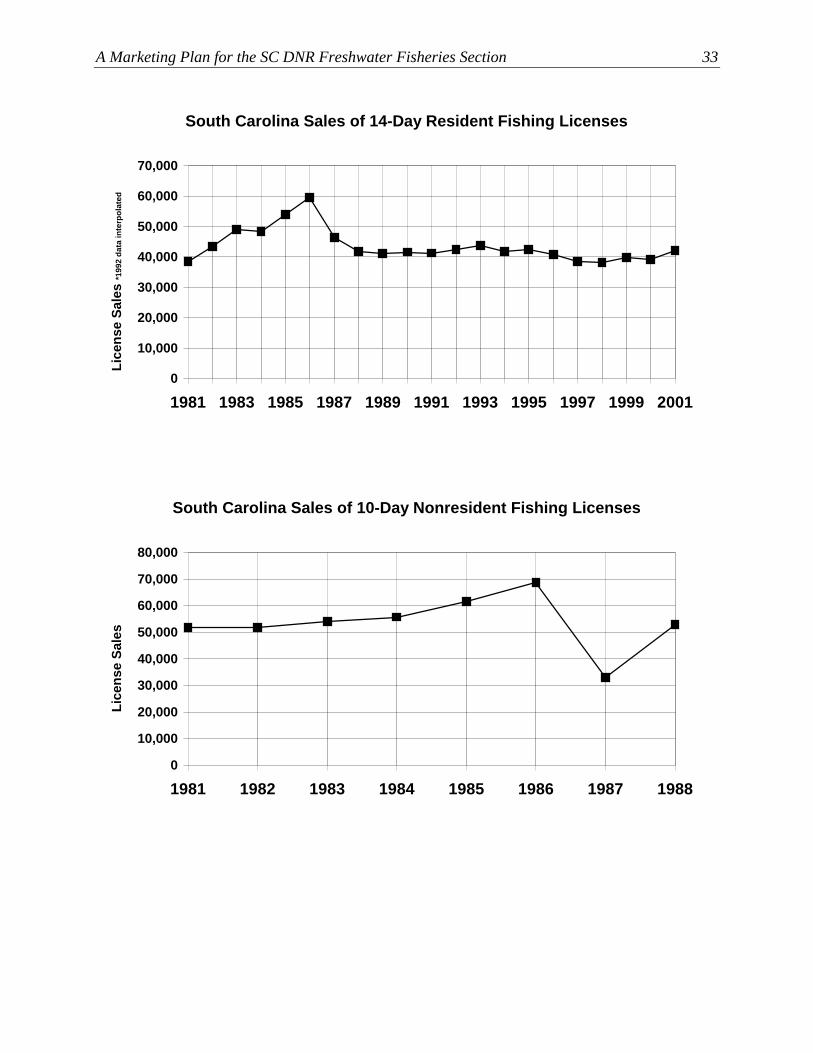
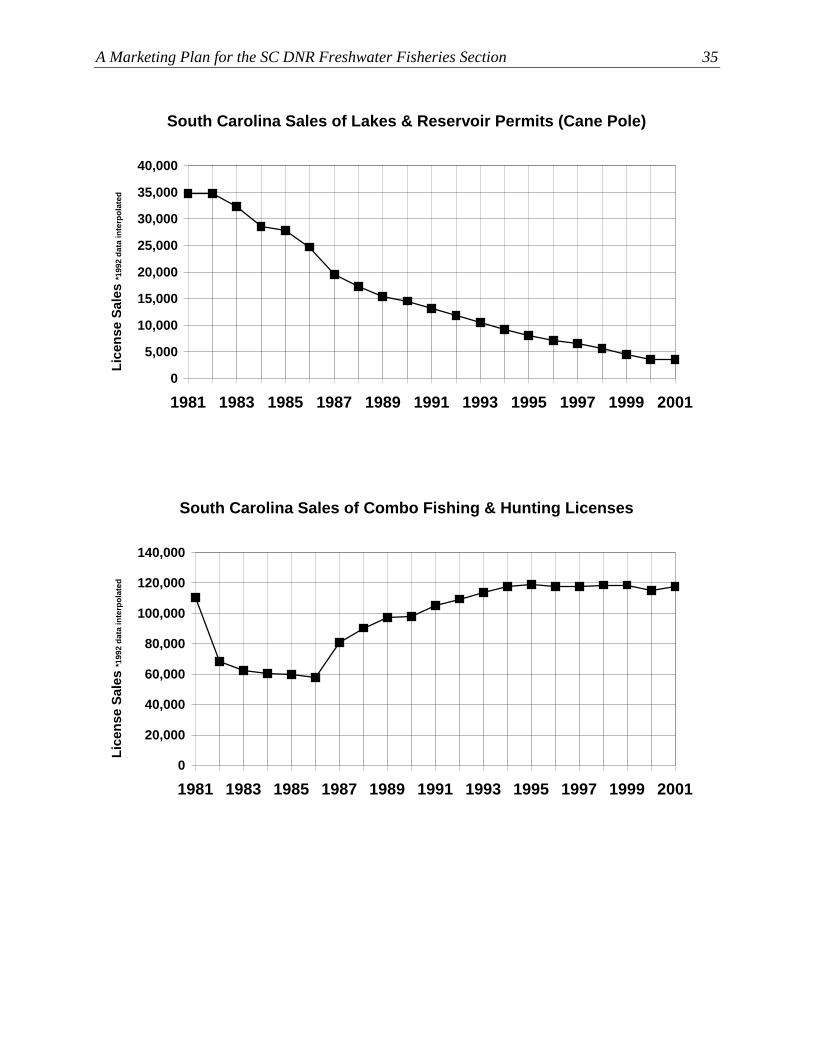
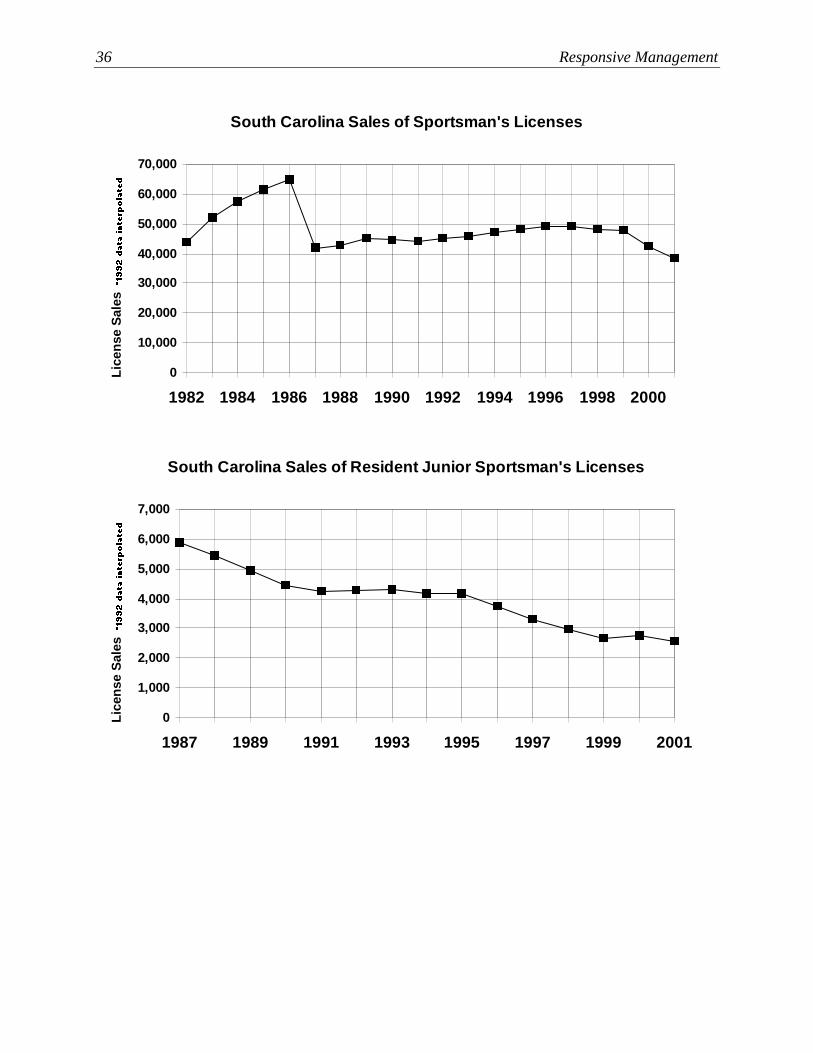
CHAPTER 5: FISHING LICENSE SALES TRENDS IN SOUTH CAROLINA Fishing license sales are another important indicator of fishing participation levels. The SC DNR has recorded the number of fishing licenses issued in South Carolina from 1981-2001 by year and by county. Based on data from the SC DNR, the overall trend of the numbers of fishing licenses issued in South Carolina in 1981-2001 has been relatively stable to slightly increasing. Please see the graphs below and on the following pages.
Since 1993, the overall trend in sales for all fishing license types has been relatively stable (see graph below). As the graphs on the following pages indicate, nonresident license sales have decreased, while resident licenses have experienced recent increases in sales. Saltwater fishing stamps have had the highest increase in sales in the past ten years compared to all other fishing licenses in South Carolina. Junior sportsman license sales have declined over the years.
South Carolina Sales Total of All Fish-Related Licenses
0
100,000
200,000
300,000
400,000
500,000
600,000
700,000
1981 1983 1985 1987 1989 1991 1993 1995 1997 1999 2001
Lice
nse
Sale
s
32 Responsive Management
South Carolina Sales of Resident Fishing Licenses
0
50,000
100,000
150,000
200,000
250,000
1981 1983 1985 1987 1989 1991 1993 1995 1997 1999 2001
Lice
nse
Sale
s *1
992
data
inte
rpol
ated
South Carolina Sales of Annual Nonresident Fishing Licenses
02,0004,0006,0008,000
10,00012,00014,00016,00018,00020,000
1981 1983 1985 1987 1989 1991 1993 1995 1997 1999 2001
Lice
nse
Sale
s *1
992
data
inte
rpol
ated
A Marketing Plan for the SC DNR Freshwater Fisheries Section 33
South Carolina Sales of 14-Day Resident Fishing Licenses
0
10,000
20,000
30,000
40,000
50,000
60,000
70,000
1981 1983 1985 1987 1989 1991 1993 1995 1997 1999 2001
Lice
nse
Sale
s *1
992
data
inte
rpol
ated
South Carolina Sales of 10-Day Nonresident Fishing Licenses
0
10,000
20,000
30,000
40,000
50,000
60,000
70,000
80,000
1981 1982 1983 1984 1985 1986 1987 1988
Lice
nse
Sale
s

34 Responsive Management
South Carolina Sales of 7-Day Nonresident Fishing Licenses
0
10,000
20,000
30,000
40,000
50,000
60,000
70,000
80,000
1989 1990 1991 1992 1993 1994 1995 1996 1997 1998 1999 2000 2001
Lice
nse
Sale
s *1
992
data
inte
rpol
ated
South Carolina Sales of Saltwater Fishing Stamps
0
20,000
40,000
60,000
80,000
100,000
120,000
1993 1994 1995 1996 1997 1998 1999 2000 2001
Lice
nse
Sale
s
A Marketing Plan for the SC DNR Freshwater Fisheries Section 35
South Carolina Sales of Lakes & Reservoir Permits (Cane Pole)
0
5,000
10,000
15,000
20,000
25,000
30,000
35,000
40,000
1981 1983 1985 1987 1989 1991 1993 1995 1997 1999 2001
Lice
nse
Sale
s *1
992
data
inte
rpol
ated
South Carolina Sales of Combo Fishing & Hunting Licenses
0
20,000
40,000
60,000
80,000
100,000
120,000
140,000
1981 1983 1985 1987 1989 1991 1993 1995 1997 1999 2001
Lice
nse
Sale
s *1
992
data
inte
rpol
ated
36 Responsive Management
South Carolina Sales of Sportsman's Licenses
0
10,000
20,000
30,000
40,000
50,000
60,000
70,000
1982 1984 1986 1988 1990 1992 1994 1996 1998 2000
Lice
nse
Sale
s
South Carolina Sales of Resident Junior Sportsman's Licenses
0
1,000
2,000
3,000
4,000
5,000
6,000
7,000
1987 1989 1991 1993 1995 1997 1999 2001
Lice
nse
Sale
s

A Marketing Plan for the SC DNR Freshwater Fisheries Section 37
Fishing License Sales and Demographics
Hunting and fishing license sales data from South Carolina for each county from 1981 to 2001 were mapped using the Statistical Package for the Social Sciences software (SPSS, 2002) to show the geographic distribution of license sales relative to population density. The year 2000 was selected because it allowed graphic and statistical analyses in relation to the most recent census data (U.S. Census Bureau, 2002).
These graphs and analyses, shown on the following pages, indicate the counties with the highest rate of sales per person per square mile. The numbers of people per square mile for each county were derived from 2000 Census data (U.S. Census Bureau, 2002). Sales that are standardized by licenses per person per square mile allow for comparable units of analyses between counties. There is not a map of 10-day nonresident fishing license sales, as they were not sold in 2000. Screening
Bivariate correlations were used to examine any relationships between standardized license sales data and characteristics of each county that may have contributed to differences in sales rates among counties. Elements of data were then selected as the most appropriate variables to examine with a regression analysis (Pedhazur, 1982) based upon predictive power and face validity (Krathwohl, 1993). The screened data were then culled for further regression analyses. Regression analyses
Regression analyses (Pedhazur, 1982) allowed predictive equations to examine the defining features of counties with different levels of overall fishing-related license sales. The equations both helped define the features most important to license sales, but also allowed future demographic changes to be loaded into these equations easily to predict sales for future years.
38 Responsive Management
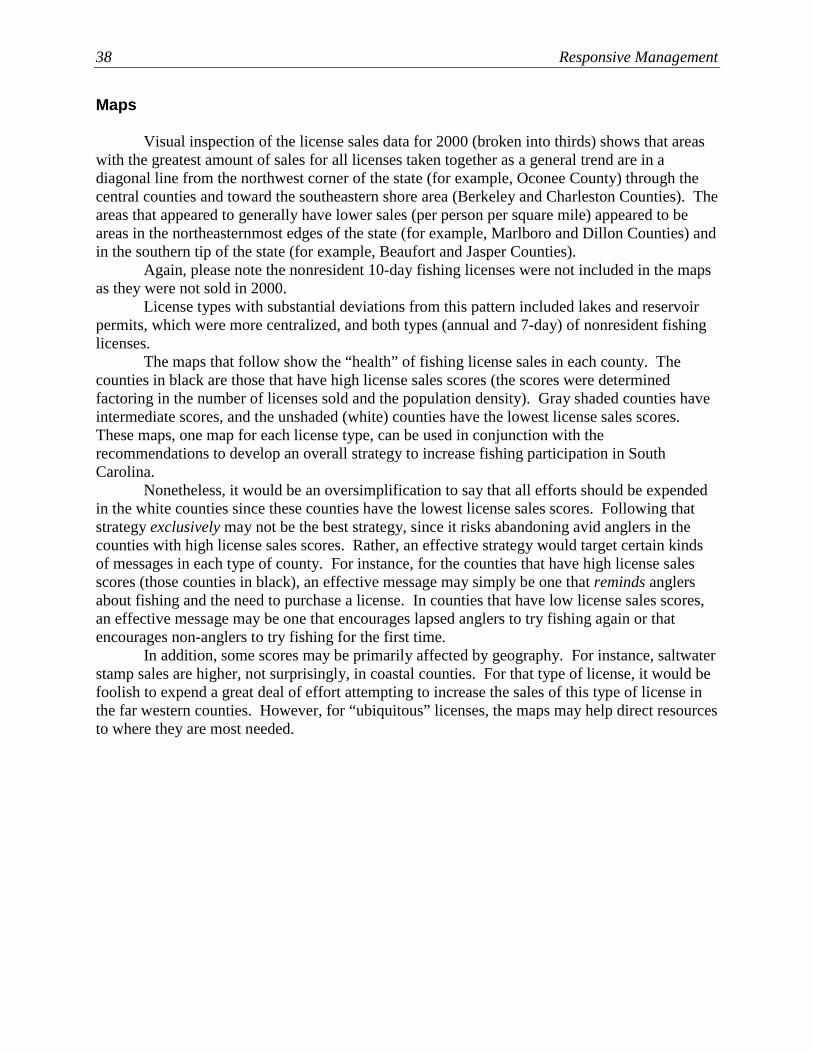
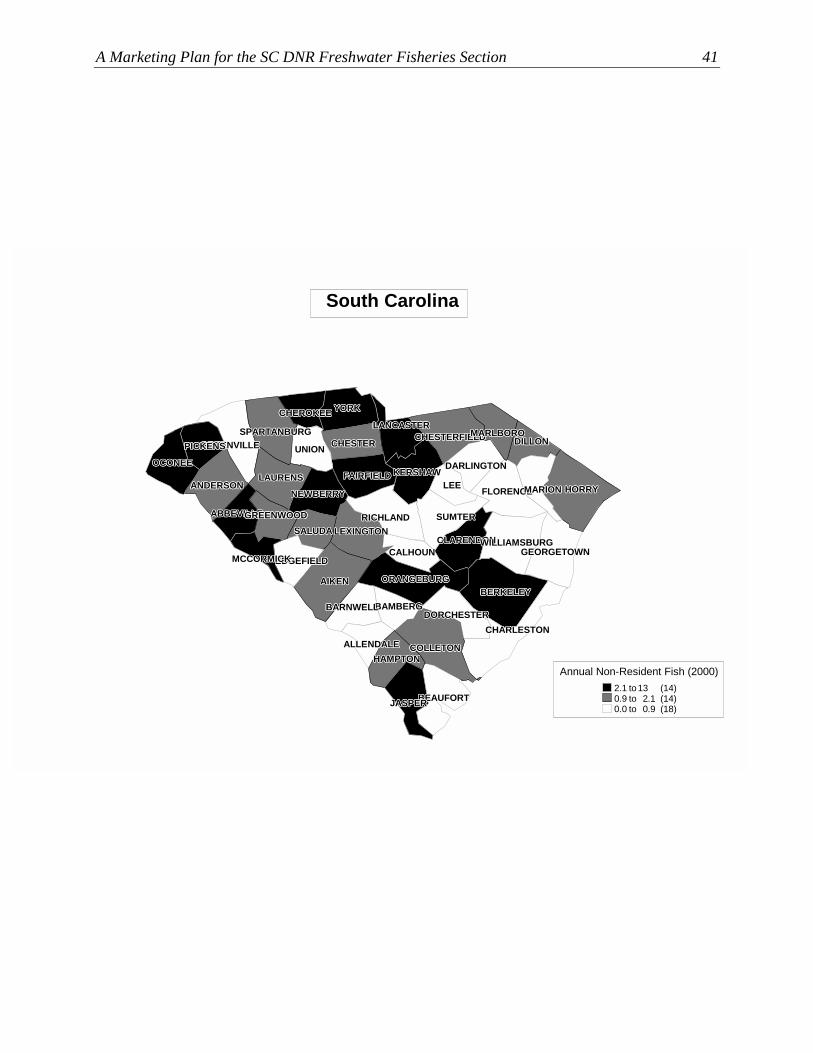
Maps Visual inspection of the license sales data for 2000 (broken into thirds) shows that areas
with the greatest amount of sales for all licenses taken together as a general trend are in a diagonal line from the northwest corner of the state (for example, Oconee County) through the central counties and toward the southeastern shore area (Berkeley and Charleston Counties). The areas that appeared to generally have lower sales (per person per square mile) appeared to be areas in the northeasternmost edges of the state (for example, Marlboro and Dillon Counties) and in the southern tip of the state (for example, Beaufort and Jasper Counties).
Again, please note the nonresident 10-day fishing licenses were not included in the maps as they were not sold in 2000.
License types with substantial deviations from this pattern included lakes and reservoir permits, which were more centralized, and both types (annual and 7-day) of nonresident fishing licenses.
The maps that follow show the “health” of fishing license sales in each county. The counties in black are those that have high license sales scores (the scores were determined factoring in the number of licenses sold and the population density). Gray shaded counties have intermediate scores, and the unshaded (white) counties have the lowest license sales scores. These maps, one map for each license type, can be used in conjunction with the recommendations to develop an overall strategy to increase fishing participation in South Carolina.
Nonetheless, it would be an oversimplification to say that all efforts should be expended in the white counties since these counties have the lowest license sales scores. Following that strategy exclusively may not be the best strategy, since it risks abandoning avid anglers in the counties with high license sales scores. Rather, an effective strategy would target certain kinds of messages in each type of county. For instance, for the counties that have high license sales scores (those counties in black), an effective message may simply be one that reminds anglers about fishing and the need to purchase a license. In counties that have low license sales scores, an effective message may be one that encourages lapsed anglers to try fishing again or that encourages non-anglers to try fishing for the first time.
In addition, some scores may be primarily affected by geography. For instance, saltwater stamp sales are higher, not surprisingly, in coastal counties. For that type of license, it would be foolish to expend a great deal of effort attempting to increase the sales of this type of license in the far western counties. However, for “ubiquitous” licenses, the maps may help direct resources to where they are most needed.
A Marketing Plan for the SC DNR Freshwater Fisheries Section 39
Please note that all units are rounded and are measures of
sales per population density.
ABBEVILLE ABBEVILLE ABBEVILLE ABBEVILLE ABBEVILLE ABBEVILLE ABBEVILLE ABBEVILLE ABBEVILLE
AIKENAIKENAIKENAIKENAIKENAIKENAIKENAIKENAIKEN
ALLENDALEALLENDALEALLENDALEALLENDALEALLENDALEALLENDALEALLENDALEALLENDALEALLENDALE
ANDERSON ANDERSON ANDERSON ANDERSON ANDERSON ANDERSON ANDERSON ANDERSON ANDERSON
BAMBERGBAMBERGBAMBERGBAMBERGBAMBERGBAMBERGBAMBERGBAMBERGBAMBERGBARNWELLBARNWELLBARNWELLBARNWELLBARNWELLBARNWELLBARNWELLBARNWELLBARNWELL
BEAUFORTBEAUFORTBEAUFORTBEAUFORTBEAUFORTBEAUFORTBEAUFORTBEAUFORTBEAUFORT
BERKELEYBERKELEYBERKELEYBERKELEYBERKELEYBERKELEYBERKELEYBERKELEYBERKELEY
CALHOUNCALHOUNCALHOUNCALHOUNCALHOUNCALHOUNCALHOUNCALHOUNCALHOUN
CHARLESTON CHARLESTON CHARLESTON CHARLESTON CHARLESTON CHARLESTON CHARLESTON CHARLESTON CHARLESTON
CHEROKEECHEROKEECHEROKEECHEROKEECHEROKEECHEROKEECHEROKEECHEROKEECHEROKEE
CHESTERCHESTERCHESTERCHESTERCHESTERCHESTERCHESTERCHESTERCHESTERCHESTERFIELDCHESTERFIELDCHESTERFIELDCHESTERFIELDCHESTERFIELDCHESTERFIELDCHESTERFIELDCHESTERFIELDCHESTERFIELD
CLARENDONCLARENDONCLARENDONCLARENDONCLARENDONCLARENDONCLARENDONCLARENDONCLARENDON
COLLETONCOLLETONCOLLETONCOLLETONCOLLETONCOLLETONCOLLETONCOLLETONCOLLETON
DARLINGTONDARLINGTONDARLINGTONDARLINGTONDARLINGTONDARLINGTONDARLINGTONDARLINGTONDARLINGTON
DILLON DILLON DILLON DILLON DILLON DILLON DILLON DILLON DILLON
DORCHESTERDORCHESTERDORCHESTERDORCHESTERDORCHESTERDORCHESTERDORCHESTERDORCHESTERDORCHESTER
EDGEFIELDEDGEFIELDEDGEFIELDEDGEFIELDEDGEFIELDEDGEFIELDEDGEFIELDEDGEFIELDEDGEFIELD
FAIRFIELDFAIRFIELDFAIRFIELDFAIRFIELDFAIRFIELDFAIRFIELDFAIRFIELDFAIRFIELDFAIRFIELDFLORENCEFLORENCEFLORENCEFLORENCEFLORENCEFLORENCEFLORENCEFLORENCEFLORENCE
GEORGETOWN GEORGETOWN GEORGETOWN GEORGETOWN GEORGETOWN GEORGETOWN GEORGETOWN GEORGETOWN GEORGETOWN
GREENVILLE GREENVILLE GREENVILLE GREENVILLE GREENVILLE GREENVILLE GREENVILLE GREENVILLE GREENVILLE
GREENWOODGREENWOODGREENWOODGREENWOODGREENWOODGREENWOODGREENWOODGREENWOODGREENWOOD
HAMPTONHAMPTONHAMPTONHAMPTONHAMPTONHAMPTONHAMPTONHAMPTONHAMPTON
HORRY HORRY HORRY HORRY HORRY HORRY HORRY HORRY HORRY
JASPERJASPERJASPERJASPERJASPERJASPERJASPERJASPERJASPER
KERSHAWKERSHAWKERSHAWKERSHAWKERSHAWKERSHAWKERSHAWKERSHAWKERSHAW
LANCASTERLANCASTERLANCASTERLANCASTERLANCASTERLANCASTERLANCASTERLANCASTERLANCASTER
LAURENSLAURENSLAURENSLAURENSLAURENSLAURENSLAURENSLAURENSLAURENSLEELEELEELEELEELEELEELEELEE
LEXINGTONLEXINGTONLEXINGTONLEXINGTONLEXINGTONLEXINGTONLEXINGTONLEXINGTONLEXINGTON
MARION MARION MARION MARION MARION MARION MARION MARION MARION
MARLBOROMARLBOROMARLBOROMARLBOROMARLBOROMARLBOROMARLBOROMARLBOROMARLBORO
MCCORMICK MCCORMICK MCCORMICK MCCORMICK MCCORMICK MCCORMICK MCCORMICK MCCORMICK MCCORMICK
NEWBERRYNEWBERRYNEWBERRYNEWBERRYNEWBERRYNEWBERRYNEWBERRYNEWBERRYNEWBERRY
OCONEE OCONEE OCONEE OCONEE OCONEE OCONEE OCONEE OCONEE OCONEE
ORANGEBURGORANGEBURGORANGEBURGORANGEBURGORANGEBURGORANGEBURGORANGEBURGORANGEBURGORANGEBURG
PICKENS PICKENS PICKENS PICKENS PICKENS PICKENS PICKENS PICKENS PICKENS
RICHLANDRICHLANDRICHLANDRICHLANDRICHLANDRICHLANDRICHLANDRICHLANDRICHLANDSALUDASALUDASALUDASALUDASALUDASALUDASALUDASALUDASALUDA
SPARTANBURGSPARTANBURGSPARTANBURGSPARTANBURGSPARTANBURGSPARTANBURGSPARTANBURGSPARTANBURGSPARTANBURG
SUMTERSUMTERSUMTERSUMTERSUMTERSUMTERSUMTERSUMTERSUMTER
UNIONUNIONUNIONUNIONUNIONUNIONUNIONUNIONUNION
WILLIAMSBURG WILLIAMSBURG WILLIAMSBURG WILLIAMSBURG WILLIAMSBURG WILLIAMSBURG WILLIAMSBURG WILLIAMSBURG WILLIAMSBURG
YORKYORKYORKYORKYORKYORKYORKYORKYORK
14-Day Resident Fish (2000)8 .7 to 39 .1 (15)4 .0 to 8 .7 (14)0 .3 to 4 .0 (17)
South Carolina

40 Responsive Management
ABBEVILLE ABBEVILLE ABBEVILLE ABBEVILLE ABBEVILLE ABBEVILLE ABBEVILLE ABBEVILLE ABBEVILLE
AIKENAIKENAIKENAIKENAIKENAIKENAIKENAIKENAIKEN
ALLENDALEALLENDALEALLENDALEALLENDALEALLENDALEALLENDALEALLENDALEALLENDALEALLENDALE
ANDERSON ANDERSON ANDERSON ANDERSON ANDERSON ANDERSON ANDERSON ANDERSON ANDERSON
BAMBERGBAMBERGBAMBERGBAMBERGBAMBERGBAMBERGBAMBERGBAMBERGBAMBERGBARNWELLBARNWELLBARNWELLBARNWELLBARNWELLBARNWELLBARNWELLBARNWELLBARNWELL
BEAUFORTBEAUFORTBEAUFORTBEAUFORTBEAUFORTBEAUFORTBEAUFORTBEAUFORTBEAUFORT
BERKELEYBERKELEYBERKELEYBERKELEYBERKELEYBERKELEYBERKELEYBERKELEYBERKELEY
CALHOUNCALHOUNCALHOUNCALHOUNCALHOUNCALHOUNCALHOUNCALHOUNCALHOUN
CHARLESTON CHARLESTON CHARLESTON CHARLESTON CHARLESTON CHARLESTON CHARLESTON CHARLESTON CHARLESTON
CHEROKEECHEROKEECHEROKEECHEROKEECHEROKEECHEROKEECHEROKEECHEROKEECHEROKEE
CHESTERCHESTERCHESTERCHESTERCHESTERCHESTERCHESTERCHESTERCHESTERCHESTERFIELDCHESTERFIELDCHESTERFIELDCHESTERFIELDCHESTERFIELDCHESTERFIELDCHESTERFIELDCHESTERFIELDCHESTERFIELD
CLARENDONCLARENDONCLARENDONCLARENDONCLARENDONCLARENDONCLARENDONCLARENDONCLARENDON
COLLETONCOLLETONCOLLETONCOLLETONCOLLETONCOLLETONCOLLETONCOLLETONCOLLETON
DARLINGTONDARLINGTONDARLINGTONDARLINGTONDARLINGTONDARLINGTONDARLINGTONDARLINGTONDARLINGTON
DILLON DILLON DILLON DILLON DILLON DILLON DILLON DILLON DILLON
DORCHESTERDORCHESTERDORCHESTERDORCHESTERDORCHESTERDORCHESTERDORCHESTERDORCHESTERDORCHESTER
EDGEFIELDEDGEFIELDEDGEFIELDEDGEFIELDEDGEFIELDEDGEFIELDEDGEFIELDEDGEFIELDEDGEFIELD
FAIRFIELDFAIRFIELDFAIRFIELDFAIRFIELDFAIRFIELDFAIRFIELDFAIRFIELDFAIRFIELDFAIRFIELDFLORENCEFLORENCEFLORENCEFLORENCEFLORENCEFLORENCEFLORENCEFLORENCEFLORENCE
GEORGETOWN GEORGETOWN GEORGETOWN GEORGETOWN GEORGETOWN GEORGETOWN GEORGETOWN GEORGETOWN GEORGETOWN
GREENVILLE GREENVILLE GREENVILLE GREENVILLE GREENVILLE GREENVILLE GREENVILLE GREENVILLE GREENVILLE
GREENWOODGREENWOODGREENWOODGREENWOODGREENWOODGREENWOODGREENWOODGREENWOODGREENWOOD
HAMPTONHAMPTONHAMPTONHAMPTONHAMPTONHAMPTONHAMPTONHAMPTONHAMPTON
HORRY HORRY HORRY HORRY HORRY HORRY HORRY HORRY HORRY
JASPERJASPERJASPERJASPERJASPERJASPERJASPERJASPERJASPER
KERSHAWKERSHAWKERSHAWKERSHAWKERSHAWKERSHAWKERSHAWKERSHAWKERSHAW
LANCASTERLANCASTERLANCASTERLANCASTERLANCASTERLANCASTERLANCASTERLANCASTERLANCASTER
LAURENSLAURENSLAURENSLAURENSLAURENSLAURENSLAURENSLAURENSLAURENSLEELEELEELEELEELEELEELEELEE
LEXINGTONLEXINGTONLEXINGTONLEXINGTONLEXINGTONLEXINGTONLEXINGTONLEXINGTONLEXINGTON
MARION MARION MARION MARION MARION MARION MARION MARION MARION
MARLBOROMARLBOROMARLBOROMARLBOROMARLBOROMARLBOROMARLBOROMARLBOROMARLBORO
MCCORMICK MCCORMICK MCCORMICK MCCORMICK MCCORMICK MCCORMICK MCCORMICK MCCORMICK MCCORMICK
NEWBERRYNEWBERRYNEWBERRYNEWBERRYNEWBERRYNEWBERRYNEWBERRYNEWBERRYNEWBERRY
OCONEE OCONEE OCONEE OCONEE OCONEE OCONEE OCONEE OCONEE OCONEE
ORANGEBURGORANGEBURGORANGEBURGORANGEBURGORANGEBURGORANGEBURGORANGEBURGORANGEBURGORANGEBURG
PICKENS PICKENS PICKENS PICKENS PICKENS PICKENS PICKENS PICKENS PICKENS
RICHLANDRICHLANDRICHLANDRICHLANDRICHLANDRICHLANDRICHLANDRICHLANDRICHLANDSALUDASALUDASALUDASALUDASALUDASALUDASALUDASALUDASALUDA
SPARTANBURGSPARTANBURGSPARTANBURGSPARTANBURGSPARTANBURGSPARTANBURGSPARTANBURGSPARTANBURGSPARTANBURG
SUMTERSUMTERSUMTERSUMTERSUMTERSUMTERSUMTERSUMTERSUMTER
UNIONUNIONUNIONUNIONUNIONUNIONUNIONUNIONUNION
WILLIAMSBURG WILLIAMSBURG WILLIAMSBURG WILLIAMSBURG WILLIAMSBURG WILLIAMSBURG WILLIAMSBURG WILLIAMSBURG WILLIAMSBURG
YORKYORKYORKYORKYORKYORKYORKYORKYORK
7-Day Non-Resident Fish (2000)6 to 155 (18)4 to 6 (7)0 to 4 (21)
South Carolina
A Marketing Plan for the SC DNR Freshwater Fisheries Section 41
ABBEVILLE ABBEVILLE ABBEVILLE ABBEVILLE ABBEVILLE ABBEVILLE ABBEVILLE ABBEVILLE ABBEVILLE
AIKENAIKENAIKENAIKENAIKENAIKENAIKENAIKENAIKEN
ALLENDALEALLENDALEALLENDALEALLENDALEALLENDALEALLENDALEALLENDALEALLENDALEALLENDALE
ANDERSON ANDERSON ANDERSON ANDERSON ANDERSON ANDERSONANDERSONANDERSONANDERSON
BAMBERGBAMBERGBAMBERGBAMBERGBAMBERGBAMBERGBAMBERGBAMBERGBAMBERGBARNWELLBARNWELLBARNWELLBARNWELLBARNWELLBARNWELLBARNWELLBARNWELLBARNWELL
BEAUFORTBEAUFORTBEAUFORTBEAUFORTBEAUFORTBEAUFORTBEAUFORTBEAUFORTBEAUFORT
BERKELEYBERKELEYBERKELEYBERKELEYBERKELEYBERKELEYBERKELEYBERKELEYBERKELEY
CALHOUNCALHOUNCALHOUNCALHOUNCALHOUNCALHOUNCALHOUNCALHOUNCALHOUN
CHARLESTONCHARLESTONCHARLESTONCHARLESTONCHARLESTONCHARLESTONCHARLESTONCHARLESTONCHARLESTON
CHEROKEECHEROKEECHEROKEECHEROKEECHEROKEECHEROKEECHEROKEECHEROKEECHEROKEE
CHESTERCHESTERCHESTERCHESTERCHESTERCHESTERCHESTERCHESTERCHESTERCHESTERFIELDCHESTERFIELDCHESTERFIELDCHESTERFIELDCHESTERFIELDCHESTERFIELDCHESTERFIELDCHESTERFIELDCHESTERFIELD
CLARENDONCLARENDONCLARENDONCLARENDONCLARENDONCLARENDONCLARENDONCLARENDONCLARENDON
COLLETONCOLLETONCOLLETONCOLLETONCOLLETONCOLLETONCOLLETONCOLLETONCOLLETON
DARLINGTONDARLINGTONDARLINGTONDARLINGTONDARLINGTONDARLINGTONDARLINGTONDARLINGTONDARLINGTON
DILLONDILLONDILLONDILLONDILLONDILLONDILLONDILLONDILLON
DORCHESTERDORCHESTERDORCHESTERDORCHESTERDORCHESTERDORCHESTERDORCHESTERDORCHESTERDORCHESTER
EDGEFIELD EDGEFIELD EDGEFIELD EDGEFIELD EDGEFIELD EDGEFIELDEDGEFIELDEDGEFIELDEDGEFIELD
FAIRFIELDFAIRFIELDFAIRFIELDFAIRFIELDFAIRFIELDFAIRFIELDFAIRFIELDFAIRFIELDFAIRFIELDFLORENCEFLORENCEFLORENCEFLORENCEFLORENCEFLORENCEFLORENCEFLORENCEFLORENCE
GEORGETOWN GEORGETOWN GEORGETOWN GEORGETOWN GEORGETOWN GEORGETOWN GEORGETOWN GEORGETOWN GEORGETOWN
GREENVILLE GREENVILLE GREENVILLE GREENVILLE GREENVILLE GREENVILLE GREENVILLE GREENVILLE GREENVILLE
GREENWOOD GREENWOOD GREENWOOD GREENWOOD GREENWOOD GREENWOOD GREENWOOD GREENWOOD GREENWOOD
HAMPTONHAMPTONHAMPTONHAMPTONHAMPTONHAMPTONHAMPTONHAMPTONHAMPTON
HORRY HORRY HORRY HORRY HORRY HORRY HORRY HORRY HORRY
JASPERJASPERJASPERJASPERJASPERJASPERJASPERJASPERJASPER
KERSHAWKERSHAWKERSHAWKERSHAWKERSHAWKERSHAWKERSHAWKERSHAWKERSHAW
LANCASTERLANCASTERLANCASTERLANCASTERLANCASTERLANCASTERLANCASTERLANCASTERLANCASTER
LAURENS LAURENS LAURENS LAURENS LAURENS LAURENS LAURENS LAURENS LAURENS LEELEELEELEELEELEELEELEELEE
LEXINGTONLEXINGTONLEXINGTONLEXINGTONLEXINGTONLEXINGTONLEXINGTONLEXINGTONLEXINGTON
MARIONMARIONMARIONMARIONMARIONMARIONMARIONMARIONMARION
MARLBOROMARLBOROMARLBOROMARLBOROMARLBOROMARLBOROMARLBOROMARLBOROMARLBORO
MCCORMICK MCCORMICK MCCORMICK MCCORMICK MCCORMICK MCCORMICK MCCORMICK MCCORMICK MCCORMICK
NEWBERRYNEWBERRYNEWBERRYNEWBERRYNEWBERRYNEWBERRYNEWBERRYNEWBERRYNEWBERRY
OCONEE OCONEE OCONEE OCONEE OCONEE OCONEE OCONEE OCONEE OCONEE
ORANGEBURGORANGEBURGORANGEBURGORANGEBURGORANGEBURGORANGEBURGORANGEBURGORANGEBURGORANGEBURG
PICKENS PICKENS PICKENS PICKENS PICKENS PICKENS PICKENS PICKENS PICKENS
RICHLANDRICHLANDRICHLANDRICHLANDRICHLANDRICHLANDRICHLANDRICHLANDRICHLANDSALUDASALUDASALUDASALUDASALUDASALUDASALUDASALUDASALUDA
SPARTANBURG SPARTANBURG SPARTANBURG SPARTANBURG SPARTANBURG SPARTANBURG SPARTANBURG SPARTANBURG SPARTANBURG
SUMTERSUMTERSUMTERSUMTERSUMTERSUMTERSUMTERSUMTERSUMTER
UNION UNION UNION UNION UNION UNION UNION UNION UNION
WILLIAMSBURGWILLIAMSBURGWILLIAMSBURGWILLIAMSBURGWILLIAMSBURGWILLIAMSBURGWILLIAMSBURGWILLIAMSBURGWILLIAMSBURG
YORKYORKYORKYORKYORKYORKYORKYORKYORK
Annual Non-Resident Fish (2000)2 .1 to 13 (14)0 .9 to 2 .1 (14)0 .0 to 0 .9 (18)
South Carolina

42 Responsive Management
ABBEVILLE ABBEVILLE ABBEVILLE ABBEVILLE ABBEVILLE ABBEVILLE ABBEVILLE ABBEVILLE ABBEVILLE
AIKENAIKENAIKENAIKENAIKENAIKENAIKENAIKENAIKEN
ALLENDALEALLENDALEALLENDALEALLENDALEALLENDALEALLENDALEALLENDALEALLENDALEALLENDALE
ANDERSON ANDERSON ANDERSON ANDERSON ANDERSON ANDERSON ANDERSON ANDERSON ANDERSON
BAMBERGBAMBERGBAMBERGBAMBERGBAMBERGBAMBERGBAMBERGBAMBERGBAMBERGBARNWELLBARNWELLBARNWELLBARNWELLBARNWELLBARNWELLBARNWELLBARNWELLBARNWELL
BEAUFORTBEAUFORTBEAUFORTBEAUFORTBEAUFORTBEAUFORTBEAUFORTBEAUFORTBEAUFORT
BERKELEY BERKELEY BERKELEY BERKELEY BERKELEY BERKELEY BERKELEY BERKELEY BERKELEY
CALHOUNCALHOUNCALHOUNCALHOUNCALHOUNCALHOUNCALHOUNCALHOUNCALHOUN
CHARLESTON CHARLESTON CHARLESTON CHARLESTON CHARLESTON CHARLESTON CHARLESTON CHARLESTON CHARLESTON
CHEROKEECHEROKEECHEROKEECHEROKEECHEROKEECHEROKEECHEROKEECHEROKEECHEROKEE
CHESTERCHESTERCHESTERCHESTERCHESTERCHESTERCHESTERCHESTERCHESTERCHESTERFIELDCHESTERFIELDCHESTERFIELDCHESTERFIELDCHESTERFIELDCHESTERFIELDCHESTERFIELDCHESTERFIELDCHESTERFIELD
CLARENDONCLARENDONCLARENDONCLARENDONCLARENDONCLARENDONCLARENDONCLARENDONCLARENDON
COLLETONCOLLETONCOLLETONCOLLETONCOLLETONCOLLETONCOLLETONCOLLETONCOLLETON
DARLINGTONDARLINGTONDARLINGTONDARLINGTONDARLINGTONDARLINGTONDARLINGTONDARLINGTONDARLINGTON
DILLON DILLON DILLON DILLON DILLON DILLON DILLON DILLON DILLON
DORCHESTERDORCHESTERDORCHESTERDORCHESTERDORCHESTERDORCHESTERDORCHESTERDORCHESTERDORCHESTER
EDGEFIELDEDGEFIELDEDGEFIELDEDGEFIELDEDGEFIELDEDGEFIELDEDGEFIELDEDGEFIELDEDGEFIELD
FAIRFIELDFAIRFIELDFAIRFIELDFAIRFIELDFAIRFIELDFAIRFIELDFAIRFIELDFAIRFIELDFAIRFIELDFLORENCE FLORENCE FLORENCE FLORENCE FLORENCE FLORENCE FLORENCE FLORENCE FLORENCE
GEORGETOWN GEORGETOWN GEORGETOWN GEORGETOWN GEORGETOWN GEORGETOWN GEORGETOWN GEORGETOWN GEORGETOWN
GREENVILLE GREENVILLE GREENVILLE GREENVILLE GREENVILLE GREENVILLE GREENVILLE GREENVILLE GREENVILLE
GREENWOODGREENWOODGREENWOODGREENWOODGREENWOODGREENWOODGREENWOODGREENWOODGREENWOOD
HAMPTONHAMPTONHAMPTONHAMPTONHAMPTONHAMPTONHAMPTONHAMPTONHAMPTON
HORRY HORRY HORRY HORRY HORRY HORRY HORRY HORRY HORRY
JASPERJASPERJASPERJASPERJASPERJASPERJASPERJASPERJASPER
KERSHAWKERSHAWKERSHAWKERSHAWKERSHAWKERSHAWKERSHAWKERSHAWKERSHAW
LANCASTERLANCASTERLANCASTERLANCASTERLANCASTERLANCASTERLANCASTERLANCASTERLANCASTER
LAURENSLAURENSLAURENSLAURENSLAURENSLAURENSLAURENSLAURENSLAURENSLEELEELEELEELEELEELEELEELEE
LEXINGTONLEXINGTONLEXINGTONLEXINGTONLEXINGTONLEXINGTONLEXINGTONLEXINGTONLEXINGTON
MARION MARION MARION MARION MARION MARION MARION MARION MARION
MARLBORO MARLBORO MARLBORO MARLBORO MARLBORO MARLBORO MARLBORO MARLBORO MARLBORO
MCCORMICKMCCORMICKMCCORMICKMCCORMICKMCCORMICKMCCORMICKMCCORMICKMCCORMICKMCCORMICK
NEWBERRYNEWBERRYNEWBERRYNEWBERRYNEWBERRYNEWBERRYNEWBERRYNEWBERRYNEWBERRY
OCONEEOCONEEOCONEEOCONEEOCONEEOCONEEOCONEEOCONEEOCONEE
ORANGEBURGORANGEBURGORANGEBURGORANGEBURGORANGEBURGORANGEBURGORANGEBURGORANGEBURGORANGEBURG
PICKENS PICKENS PICKENS PICKENS PICKENS PICKENS PICKENS PICKENS PICKENS
RICHLANDRICHLANDRICHLANDRICHLANDRICHLANDRICHLANDRICHLANDRICHLANDRICHLANDSALUDASALUDASALUDASALUDASALUDASALUDASALUDASALUDASALUDA
SPARTANBURGSPARTANBURGSPARTANBURGSPARTANBURGSPARTANBURGSPARTANBURGSPARTANBURGSPARTANBURGSPARTANBURG
SUMTERSUMTERSUMTERSUMTERSUMTERSUMTERSUMTERSUMTERSUMTER
UNIONUNIONUNIONUNIONUNIONUNIONUNIONUNIONUNION
WILLIAMSBURG WILLIAMSBURG WILLIAMSBURG WILLIAMSBURG WILLIAMSBURG WILLIAMSBURG WILLIAMSBURG WILLIAMSBURG WILLIAMSBURG
YORKYORKYORKYORKYORKYORKYORKYORKYORK
Combination Fishing and Hunting License (2000)29 .5 to 82 .8 (14) 16 .8 to 29 .5 (16) 4 .7 to 16 .8 (16)
South Carolina
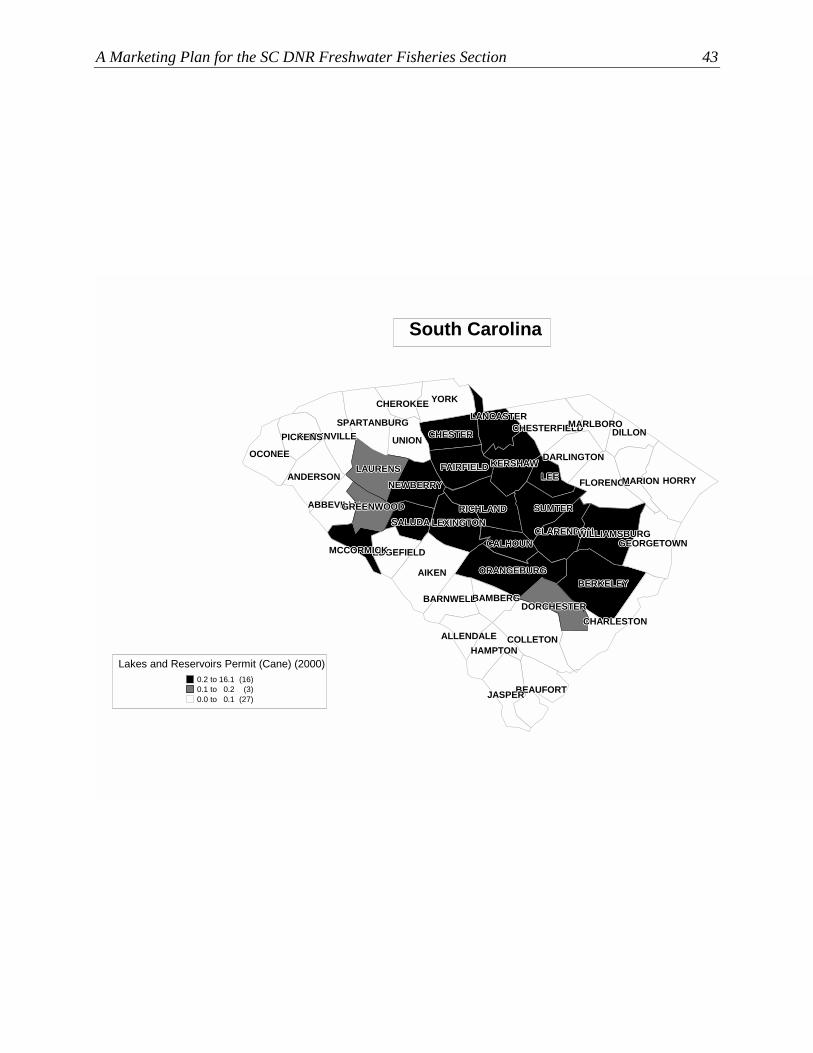
A Marketing Plan for the SC DNR Freshwater Fisheries Section 43
ABBEVILLEABBEVILLEABBEVILLEABBEVILLEABBEVILLEABBEVILLEABBEVILLEABBEVILLEABBEVILLE
AIKENAIKENAIKENAIKENAIKENAIKENAIKENAIKENAIKEN
ALLENDALEALLENDALEALLENDALEALLENDALEALLENDALEALLENDALEALLENDALEALLENDALEALLENDALE
ANDERSONANDERSONANDERSONANDERSONANDERSONANDERSONANDERSONANDERSONANDERSON
BAMBERGBAMBERGBAMBERGBAMBERGBAMBERGBAMBERGBAMBERGBAMBERGBAMBERGBARNWELLBARNWELLBARNWELLBARNWELLBARNWELLBARNWELLBARNWELLBARNWELLBARNWELL
BEAUFORTBEAUFORTBEAUFORTBEAUFORTBEAUFORTBEAUFORTBEAUFORTBEAUFORTBEAUFORT
BERKELEY BERKELEY BERKELEY BERKELEY BERKELEY BERKELEY BERKELEY BERKELEY BERKELEY
CALHOUNCALHOUNCALHOUNCALHOUNCALHOUNCALHOUNCALHOUNCALHOUNCALHOUN
CHARLESTON CHARLESTON CHARLESTON CHARLESTON CHARLESTON CHARLESTON CHARLESTON CHARLESTON CHARLESTON
CHEROKEECHEROKEECHEROKEECHEROKEECHEROKEECHEROKEECHEROKEECHEROKEECHEROKEE
CHESTERCHESTERCHESTERCHESTERCHESTERCHESTERCHESTERCHESTERCHESTERCHESTERFIELD CHESTERFIELD CHESTERFIELD CHESTERFIELD CHESTERFIELD CHESTERFIELD CHESTERFIELD CHESTERFIELD CHESTERFIELD
CLARENDON CLARENDON CLARENDON CLARENDON CLARENDON CLARENDON CLARENDON CLARENDON CLARENDON
COLLETONCOLLETONCOLLETONCOLLETONCOLLETONCOLLETONCOLLETONCOLLETONCOLLETON
DARLINGTON DARLINGTON DARLINGTON DARLINGTON DARLINGTON DARLINGTON DARLINGTON DARLINGTON DARLINGTON DILLON DILLON DILLON DILLON DILLON DILLON DILLON DILLON DILLON
DORCHESTER DORCHESTER DORCHESTER DORCHESTER DORCHESTER DORCHESTER DORCHESTER DORCHESTER DORCHESTER
EDGEFIELDEDGEFIELDEDGEFIELDEDGEFIELDEDGEFIELDEDGEFIELDEDGEFIELDEDGEFIELDEDGEFIELD
FAIRFIELDFAIRFIELDFAIRFIELDFAIRFIELDFAIRFIELDFAIRFIELDFAIRFIELDFAIRFIELDFAIRFIELDFLORENCE FLORENCE FLORENCE FLORENCE FLORENCE FLORENCE FLORENCE FLORENCE FLORENCE
GEORGETOWNGEORGETOWNGEORGETOWNGEORGETOWNGEORGETOWNGEORGETOWNGEORGETOWNGEORGETOWNGEORGETOWN
GREENVILLEGREENVILLEGREENVILLEGREENVILLEGREENVILLEGREENVILLEGREENVILLEGREENVILLEGREENVILLE
GREENWOODGREENWOODGREENWOODGREENWOODGREENWOODGREENWOODGREENWOODGREENWOODGREENWOOD
HAMPTONHAMPTONHAMPTONHAMPTONHAMPTONHAMPTONHAMPTONHAMPTONHAMPTON
HORRYHORRYHORRYHORRYHORRYHORRYHORRYHORRYHORRY
JASPERJASPERJASPERJASPERJASPERJASPERJASPERJASPERJASPER
KERSHAWKERSHAWKERSHAWKERSHAWKERSHAWKERSHAWKERSHAWKERSHAWKERSHAW
LANCASTERLANCASTERLANCASTERLANCASTERLANCASTERLANCASTERLANCASTERLANCASTERLANCASTER
LAURENSLAURENSLAURENSLAURENSLAURENSLAURENSLAURENSLAURENSLAURENSLEELEELEELEELEELEELEELEELEE
LEXINGTONLEXINGTONLEXINGTONLEXINGTONLEXINGTONLEXINGTONLEXINGTONLEXINGTONLEXINGTON
MARIONMARIONMARIONMARIONMARIONMARIONMARIONMARIONMARION
MARLBORO MARLBORO MARLBORO MARLBORO MARLBORO MARLBORO MARLBORO MARLBORO MARLBORO
MCCORMICKMCCORMICKMCCORMICKMCCORMICKMCCORMICKMCCORMICKMCCORMICKMCCORMICKMCCORMICK
NEWBERRYNEWBERRYNEWBERRYNEWBERRYNEWBERRYNEWBERRYNEWBERRYNEWBERRYNEWBERRY
OCONEE OCONEE OCONEE OCONEE OCONEE OCONEE OCONEE OCONEE OCONEE
ORANGEBURGORANGEBURGORANGEBURGORANGEBURGORANGEBURGORANGEBURGORANGEBURGORANGEBURGORANGEBURG
PICKENS PICKENS PICKENS PICKENS PICKENS PICKENS PICKENS PICKENS PICKENS
RICHLANDRICHLANDRICHLANDRICHLANDRICHLANDRICHLANDRICHLANDRICHLANDRICHLANDSALUDASALUDASALUDASALUDASALUDASALUDASALUDASALUDASALUDA
SPARTANBURGSPARTANBURGSPARTANBURGSPARTANBURGSPARTANBURGSPARTANBURGSPARTANBURGSPARTANBURGSPARTANBURG
SUMTER SUMTER SUMTER SUMTER SUMTER SUMTER SUMTER SUMTER SUMTER
UNIONUNIONUNIONUNIONUNIONUNIONUNIONUNIONUNION
WILLIAMSBURG WILLIAMSBURG WILLIAMSBURG WILLIAMSBURG WILLIAMSBURG WILLIAMSBURG WILLIAMSBURG WILLIAMSBURG WILLIAMSBURG
YORKYORKYORKYORKYORKYORKYORKYORKYORK
Lakes and Reservoirs Permit (Cane) (2000) 0 .2 to 16 .1 (16) 0 .1 to 0 .2 (3) 0 .0 to 0 .1 (27)
South Carolina
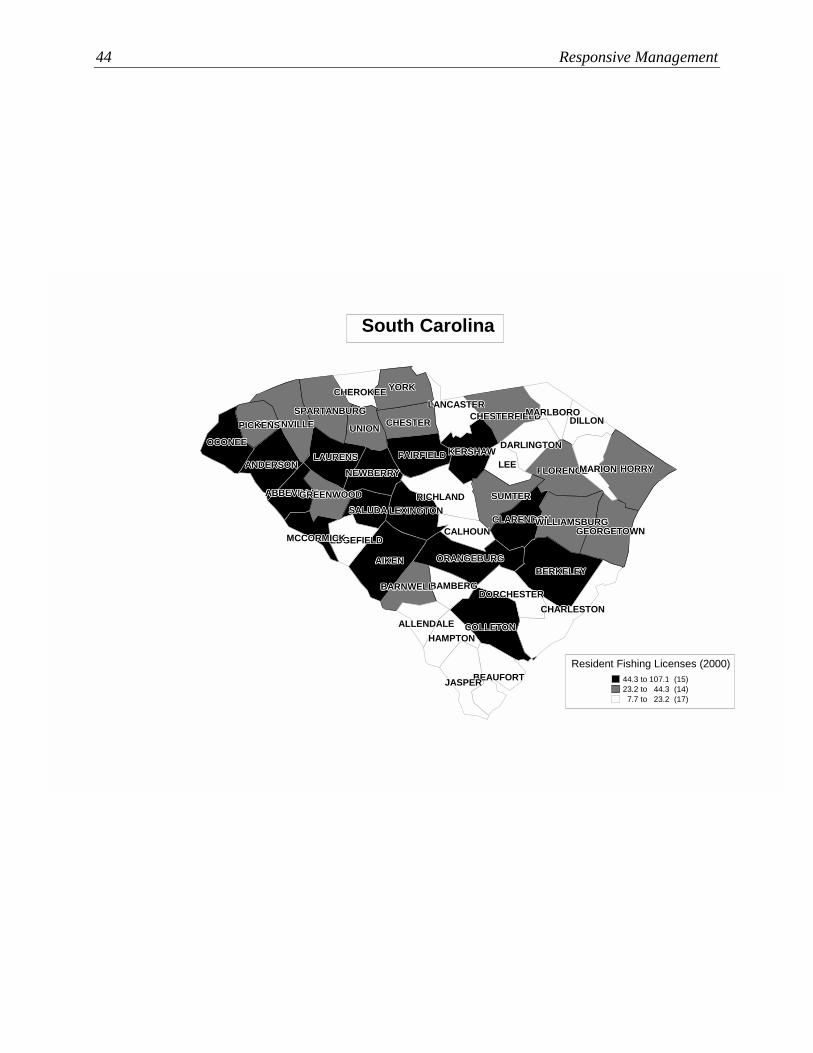
44 Responsive Management
ABBEVILLE ABBEVILLE ABBEVILLE ABBEVILLE ABBEVILLE ABBEVILLE ABBEVILLE ABBEVILLE ABBEVILLE
AIKENAIKENAIKENAIKENAIKENAIKENAIKENAIKENAIKEN
ALLENDALEALLENDALEALLENDALEALLENDALEALLENDALEALLENDALEALLENDALEALLENDALEALLENDALE
ANDERSON ANDERSON ANDERSON ANDERSON ANDERSON ANDERSON ANDERSON ANDERSON ANDERSON
BAMBERGBAMBERGBAMBERGBAMBERGBAMBERGBAMBERGBAMBERGBAMBERGBAMBERGBARNWELLBARNWELLBARNWELLBARNWELLBARNWELLBARNWELLBARNWELLBARNWELLBARNWELL
BEAUFORTBEAUFORTBEAUFORTBEAUFORTBEAUFORTBEAUFORTBEAUFORTBEAUFORTBEAUFORT
BERKELEY BERKELEY BERKELEY BERKELEY BERKELEY BERKELEY BERKELEY BERKELEY BERKELEY
CALHOUNCALHOUNCALHOUNCALHOUNCALHOUNCALHOUNCALHOUNCALHOUNCALHOUN
CHARLESTON CHARLESTON CHARLESTON CHARLESTON CHARLESTON CHARLESTON CHARLESTON CHARLESTON CHARLESTON
CHEROKEECHEROKEECHEROKEECHEROKEECHEROKEECHEROKEECHEROKEECHEROKEECHEROKEE
CHESTERCHESTERCHESTERCHESTERCHESTERCHESTERCHESTERCHESTERCHESTERCHESTERFIELDCHESTERFIELDCHESTERFIELDCHESTERFIELDCHESTERFIELDCHESTERFIELDCHESTERFIELDCHESTERFIELDCHESTERFIELD
CLARENDONCLARENDONCLARENDONCLARENDONCLARENDONCLARENDONCLARENDONCLARENDONCLARENDON
COLLETONCOLLETONCOLLETONCOLLETONCOLLETONCOLLETONCOLLETONCOLLETONCOLLETON
DARLINGTONDARLINGTONDARLINGTONDARLINGTONDARLINGTONDARLINGTONDARLINGTONDARLINGTONDARLINGTON
DILLON DILLON DILLON DILLON DILLON DILLON DILLON DILLON DILLON
DORCHESTERDORCHESTERDORCHESTERDORCHESTERDORCHESTERDORCHESTERDORCHESTERDORCHESTERDORCHESTER
EDGEFIELDEDGEFIELDEDGEFIELDEDGEFIELDEDGEFIELDEDGEFIELDEDGEFIELDEDGEFIELDEDGEFIELD
FAIRFIELDFAIRFIELDFAIRFIELDFAIRFIELDFAIRFIELDFAIRFIELDFAIRFIELDFAIRFIELDFAIRFIELDFLORENCE FLORENCE FLORENCE FLORENCE FLORENCE FLORENCE FLORENCE FLORENCE FLORENCE
GEORGETOWN GEORGETOWN GEORGETOWN GEORGETOWN GEORGETOWN GEORGETOWN GEORGETOWN GEORGETOWN GEORGETOWN
GREENVILLE GREENVILLE GREENVILLE GREENVILLE GREENVILLE GREENVILLE GREENVILLE GREENVILLE GREENVILLE
GREENWOODGREENWOODGREENWOODGREENWOODGREENWOODGREENWOODGREENWOODGREENWOODGREENWOOD
HAMPTONHAMPTONHAMPTONHAMPTONHAMPTONHAMPTONHAMPTONHAMPTONHAMPTON
HORRY HORRY HORRY HORRY HORRY HORRY HORRY HORRY HORRY
JASPERJASPERJASPERJASPERJASPERJASPERJASPERJASPERJASPER
KERSHAWKERSHAWKERSHAWKERSHAWKERSHAWKERSHAWKERSHAWKERSHAWKERSHAW
LANCASTERLANCASTERLANCASTERLANCASTERLANCASTERLANCASTERLANCASTERLANCASTERLANCASTER
LAURENSLAURENSLAURENSLAURENSLAURENSLAURENSLAURENSLAURENSLAURENSLEELEELEELEELEELEELEELEELEE
LEXINGTONLEXINGTONLEXINGTONLEXINGTONLEXINGTONLEXINGTONLEXINGTONLEXINGTONLEXINGTON
MARION MARION MARION MARION MARION MARION MARION MARION MARION
MARLBORO MARLBORO MARLBORO MARLBORO MARLBORO MARLBORO MARLBORO MARLBORO MARLBORO
MCCORMICKMCCORMICKMCCORMICKMCCORMICKMCCORMICKMCCORMICKMCCORMICKMCCORMICKMCCORMICK
NEWBERRYNEWBERRYNEWBERRYNEWBERRYNEWBERRYNEWBERRYNEWBERRYNEWBERRYNEWBERRY
OCONEE OCONEE OCONEE OCONEE OCONEE OCONEE OCONEE OCONEE OCONEE
ORANGEBURGORANGEBURGORANGEBURGORANGEBURGORANGEBURGORANGEBURGORANGEBURGORANGEBURGORANGEBURG
PICKENS PICKENS PICKENS PICKENS PICKENS PICKENS PICKENS PICKENS PICKENS
RICHLANDRICHLANDRICHLANDRICHLANDRICHLANDRICHLANDRICHLANDRICHLANDRICHLANDSALUDASALUDASALUDASALUDASALUDASALUDASALUDASALUDASALUDA
SPARTANBURGSPARTANBURGSPARTANBURGSPARTANBURGSPARTANBURGSPARTANBURGSPARTANBURGSPARTANBURGSPARTANBURG
SUMTERSUMTERSUMTERSUMTERSUMTERSUMTERSUMTERSUMTERSUMTER
UNIONUNIONUNIONUNIONUNIONUNIONUNIONUNIONUNION
WILLIAMSBURG WILLIAMSBURG WILLIAMSBURG WILLIAMSBURG WILLIAMSBURG WILLIAMSBURG WILLIAMSBURG WILLIAMSBURG WILLIAMSBURG
YORKYORKYORKYORKYORKYORKYORKYORKYORK
Resident Fishing Licenses (2000)44 .3 to 107.1 (15)23 .2 to 44.3 (14)
7 .7 to 23.2 (17)
South Carolina
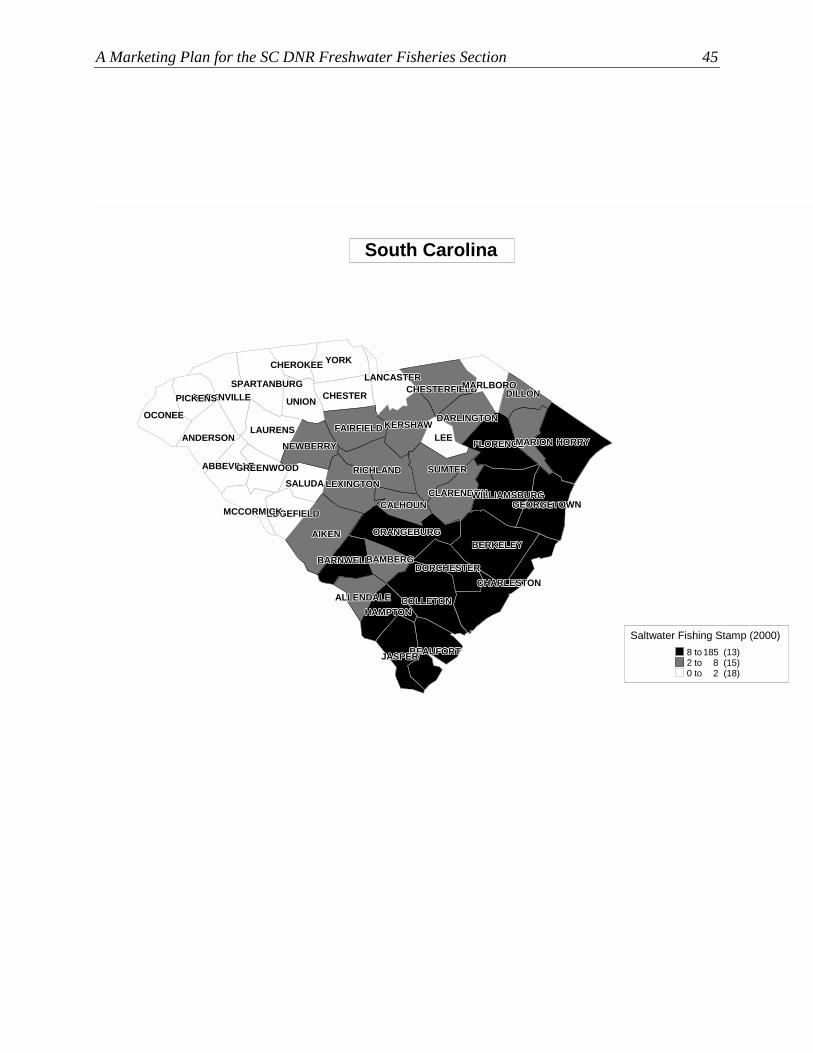
A Marketing Plan for the SC DNR Freshwater Fisheries Section 45
ABBEVILLE ABBEVILLE ABBEVILLE ABBEVILLE ABBEVILLE ABBEVILLE ABBEVILLE ABBEVILLE ABBEVILLE
AIKENAIKENAIKENAIKENAIKENAIKENAIKENAIKENAIKEN
ALLENDALEALLENDALEALLENDALEALLENDALEALLENDALEALLENDALEALLENDALEALLENDALEALLENDALE
ANDERSON ANDERSON ANDERSON ANDERSON ANDERSON ANDERSON ANDERSON ANDERSON ANDERSON
BAMBERGBAMBERGBAMBERGBAMBERGBAMBERGBAMBERGBAMBERGBAMBERGBAMBERGBARNWELLBARNWELLBARNWELLBARNWELLBARNWELLBARNWELLBARNWELLBARNWELLBARNWELL
BEAUFORTBEAUFORTBEAUFORTBEAUFORTBEAUFORTBEAUFORTBEAUFORTBEAUFORTBEAUFORT
BERKELEYBERKELEYBERKELEYBERKELEYBERKELEYBERKELEYBERKELEYBERKELEYBERKELEY
CALHOUNCALHOUNCALHOUNCALHOUNCALHOUNCALHOUNCALHOUNCALHOUNCALHOUN
CHARLESTONCHARLESTONCHARLESTONCHARLESTONCHARLESTONCHARLESTONCHARLESTONCHARLESTONCHARLESTON
CHEROKEE CHEROKEE CHEROKEE CHEROKEE CHEROKEE CHEROKEE CHEROKEE CHEROKEE CHEROKEE
CHESTERCHESTERCHESTERCHESTERCHESTERCHESTERCHESTERCHESTERCHESTERCHESTERFIELDCHESTERFIELDCHESTERFIELDCHESTERFIELDCHESTERFIELDCHESTERFIELDCHESTERFIELDCHESTERFIELDCHESTERFIELD
CLARENDONCLARENDONCLARENDONCLARENDONCLARENDONCLARENDONCLARENDONCLARENDONCLARENDON
COLLETONCOLLETONCOLLETONCOLLETONCOLLETONCOLLETONCOLLETONCOLLETONCOLLETON
DARLINGTONDARLINGTONDARLINGTONDARLINGTONDARLINGTONDARLINGTONDARLINGTONDARLINGTONDARLINGTON
DILLONDILLONDILLONDILLONDILLONDILLONDILLONDILLONDILLON
DORCHESTERDORCHESTERDORCHESTERDORCHESTERDORCHESTERDORCHESTERDORCHESTERDORCHESTERDORCHESTER
EDGEFIELD EDGEFIELD EDGEFIELD EDGEFIELD EDGEFIELD EDGEFIELD EDGEFIELD EDGEFIELD EDGEFIELD
FAIRFIELDFAIRFIELDFAIRFIELDFAIRFIELDFAIRFIELDFAIRFIELDFAIRFIELDFAIRFIELDFAIRFIELDFLORENCEFLORENCEFLORENCEFLORENCEFLORENCEFLORENCEFLORENCEFLORENCEFLORENCE
GEORGETOWN GEORGETOWN GEORGETOWN GEORGETOWN GEORGETOWN GEORGETOWN GEORGETOWN GEORGETOWN GEORGETOWN
GREENVILLE GREENVILLE GREENVILLE GREENVILLE GREENVILLE GREENVILLE GREENVILLE GREENVILLE GREENVILLE
GREENWOOD GREENWOOD GREENWOOD GREENWOOD GREENWOOD GREENWOOD GREENWOOD GREENWOOD GREENWOOD
HAMPTONHAMPTONHAMPTONHAMPTONHAMPTONHAMPTONHAMPTONHAMPTONHAMPTON
HORRY HORRY HORRY HORRY HORRY HORRY HORRY HORRY HORRY
JASPERJASPERJASPERJASPERJASPERJASPERJASPERJASPERJASPER
KERSHAWKERSHAWKERSHAWKERSHAWKERSHAWKERSHAWKERSHAWKERSHAWKERSHAW
LANCASTERLANCASTERLANCASTERLANCASTERLANCASTERLANCASTERLANCASTERLANCASTERLANCASTER
LAURENS LAURENS LAURENS LAURENS LAURENS LAURENS LAURENS LAURENS LAURENS LEELEELEELEELEELEELEELEELEE
LEXINGTONLEXINGTONLEXINGTONLEXINGTONLEXINGTONLEXINGTONLEXINGTONLEXINGTONLEXINGTON
MARIONMARIONMARIONMARIONMARIONMARIONMARIONMARIONMARION
MARLBOROMARLBOROMARLBOROMARLBOROMARLBOROMARLBOROMARLBOROMARLBOROMARLBORO
MCCORMICK MCCORMICK MCCORMICK MCCORMICK MCCORMICK MCCORMICK MCCORMICK MCCORMICK MCCORMICK
NEWBERRYNEWBERRYNEWBERRYNEWBERRYNEWBERRYNEWBERRYNEWBERRYNEWBERRYNEWBERRY
OCONEE OCONEE OCONEE OCONEE OCONEE OCONEE OCONEE OCONEE OCONEE
ORANGEBURGORANGEBURGORANGEBURGORANGEBURGORANGEBURGORANGEBURGORANGEBURGORANGEBURGORANGEBURG
PICKENS PICKENS PICKENS PICKENS PICKENS PICKENS PICKENS PICKENS PICKENS
RICHLANDRICHLANDRICHLANDRICHLANDRICHLANDRICHLANDRICHLANDRICHLANDRICHLANDSALUDA SALUDA SALUDA SALUDA SALUDA SALUDA SALUDA SALUDA SALUDA
SPARTANBURG SPARTANBURG SPARTANBURG SPARTANBURG SPARTANBURG SPARTANBURG SPARTANBURG SPARTANBURG SPARTANBURG
SUMTERSUMTERSUMTERSUMTERSUMTERSUMTERSUMTERSUMTERSUMTER
UNION UNION UNION UNION UNION UNION UNION UNION UNION
WILLIAMSBURGWILLIAMSBURGWILLIAMSBURGWILLIAMSBURGWILLIAMSBURGWILLIAMSBURGWILLIAMSBURGWILLIAMSBURGWILLIAMSBURG
YORKYORKYORKYORKYORKYORKYORKYORKYORK
Saltwater Fishing Stamp (2000)8 to 185 (13)2 to 8 (15)0 to 2 (18)
South Carolina

46 Responsive Management
ABBEVILLE ABBEVILLE ABBEVILLE ABBEVILLE ABBEVILLE ABBEVILLE ABBEVILLE ABBEVILLE ABBEVILLE
AIKENAIKENAIKENAIKENAIKENAIKENAIKENAIKENAIKEN
ALLENDALEALLENDALEALLENDALEALLENDALEALLENDALEALLENDALEALLENDALEALLENDALEALLENDALE
ANDERSON ANDERSON ANDERSON ANDERSON ANDERSON ANDERSON ANDERSON ANDERSON ANDERSON
BAMBERGBAMBERGBAMBERGBAMBERGBAMBERGBAMBERGBAMBERGBAMBERGBAMBERGBARNWELLBARNWELLBARNWELLBARNWELLBARNWELLBARNWELLBARNWELLBARNWELLBARNWELL
BEAUFORTBEAUFORTBEAUFORTBEAUFORTBEAUFORTBEAUFORTBEAUFORTBEAUFORTBEAUFORT
BERKELEYBERKELEYBERKELEYBERKELEYBERKELEYBERKELEYBERKELEYBERKELEYBERKELEY
CALHOUNCALHOUNCALHOUNCALHOUNCALHOUNCALHOUNCALHOUNCALHOUNCALHOUN
CHARLESTONCHARLESTONCHARLESTONCHARLESTONCHARLESTONCHARLESTONCHARLESTONCHARLESTONCHARLESTON
CHEROKEECHEROKEECHEROKEECHEROKEECHEROKEECHEROKEECHEROKEECHEROKEECHEROKEE
CHESTERCHESTERCHESTERCHESTERCHESTERCHESTERCHESTERCHESTERCHESTERCHESTERFIELDCHESTERFIELDCHESTERFIELDCHESTERFIELDCHESTERFIELDCHESTERFIELDCHESTERFIELDCHESTERFIELDCHESTERFIELD
CLARENDONCLARENDONCLARENDONCLARENDONCLARENDONCLARENDONCLARENDONCLARENDONCLARENDON
COLLETONCOLLETONCOLLETONCOLLETONCOLLETONCOLLETONCOLLETONCOLLETONCOLLETON
DARLINGTONDARLINGTONDARLINGTONDARLINGTONDARLINGTONDARLINGTONDARLINGTONDARLINGTONDARLINGTON
DILLONDILLONDILLONDILLONDILLONDILLONDILLONDILLONDILLON
DORCHESTERDORCHESTERDORCHESTERDORCHESTERDORCHESTERDORCHESTERDORCHESTERDORCHESTERDORCHESTER
EDGEFIELDEDGEFIELDEDGEFIELDEDGEFIELDEDGEFIELDEDGEFIELDEDGEFIELDEDGEFIELDEDGEFIELD
FAIRFIELDFAIRFIELDFAIRFIELDFAIRFIELDFAIRFIELDFAIRFIELDFAIRFIELDFAIRFIELDFAIRFIELDFLORENCEFLORENCEFLORENCEFLORENCEFLORENCEFLORENCEFLORENCEFLORENCEFLORENCE
GEORGETOWN GEORGETOWN GEORGETOWN GEORGETOWN GEORGETOWN GEORGETOWN GEORGETOWN GEORGETOWN GEORGETOWN
GREENVILLE GREENVILLE GREENVILLE GREENVILLE GREENVILLE GREENVILLE GREENVILLE GREENVILLE GREENVILLE
GREENWOOD GREENWOOD GREENWOOD GREENWOOD GREENWOOD GREENWOOD GREENWOOD GREENWOOD GREENWOOD
HAMPTONHAMPTONHAMPTONHAMPTONHAMPTONHAMPTONHAMPTONHAMPTONHAMPTON
HORRY HORRY HORRY HORRY HORRY HORRY HORRY HORRY HORRY
JASPERJASPERJASPERJASPERJASPERJASPERJASPERJASPERJASPER
KERSHAWKERSHAWKERSHAWKERSHAWKERSHAWKERSHAWKERSHAWKERSHAWKERSHAW
LANCASTERLANCASTERLANCASTERLANCASTERLANCASTERLANCASTERLANCASTERLANCASTERLANCASTER
LAURENS LAURENS LAURENS LAURENS LAURENS LAURENS LAURENS LAURENS LAURENS LEELEELEELEELEELEELEELEELEE
LEXINGTONLEXINGTONLEXINGTONLEXINGTONLEXINGTONLEXINGTONLEXINGTONLEXINGTONLEXINGTON
MARIONMARIONMARIONMARIONMARIONMARIONMARIONMARIONMARION
MARLBOROMARLBOROMARLBOROMARLBOROMARLBOROMARLBOROMARLBOROMARLBOROMARLBORO
MCCORMICK MCCORMICK MCCORMICK MCCORMICK MCCORMICK MCCORMICK MCCORMICK MCCORMICK MCCORMICK
NEWBERRYNEWBERRYNEWBERRYNEWBERRYNEWBERRYNEWBERRYNEWBERRYNEWBERRYNEWBERRY
OCONEE OCONEE OCONEE OCONEE OCONEE OCONEE OCONEE OCONEE OCONEE
ORANGEBURGORANGEBURGORANGEBURGORANGEBURGORANGEBURGORANGEBURGORANGEBURGORANGEBURGORANGEBURG
PICKENS PICKENS PICKENS PICKENS PICKENS PICKENS PICKENS PICKENS PICKENS
RICHLANDRICHLANDRICHLANDRICHLANDRICHLANDRICHLANDRICHLANDRICHLANDRICHLANDSALUDASALUDASALUDASALUDASALUDASALUDASALUDASALUDASALUDA
SPARTANBURG SPARTANBURG SPARTANBURG SPARTANBURG SPARTANBURG SPARTANBURG SPARTANBURG SPARTANBURG SPARTANBURG
SUMTERSUMTERSUMTERSUMTERSUMTERSUMTERSUMTERSUMTERSUMTER
UNIONUNIONUNIONUNIONUNIONUNIONUNIONUNIONUNION
WILLIAMSBURGWILLIAMSBURGWILLIAMSBURGWILLIAMSBURGWILLIAMSBURGWILLIAMSBURGWILLIAMSBURGWILLIAMSBURGWILLIAMSBURG
YORKYORKYORKYORKYORKYORKYORKYORKYORK
Resident Junior Sportsmans Licenses (2000)0 .63 to 1 .54 (14)0 .31 to 0 .63 (16)0 to 0 .31 (16)
South Carolina
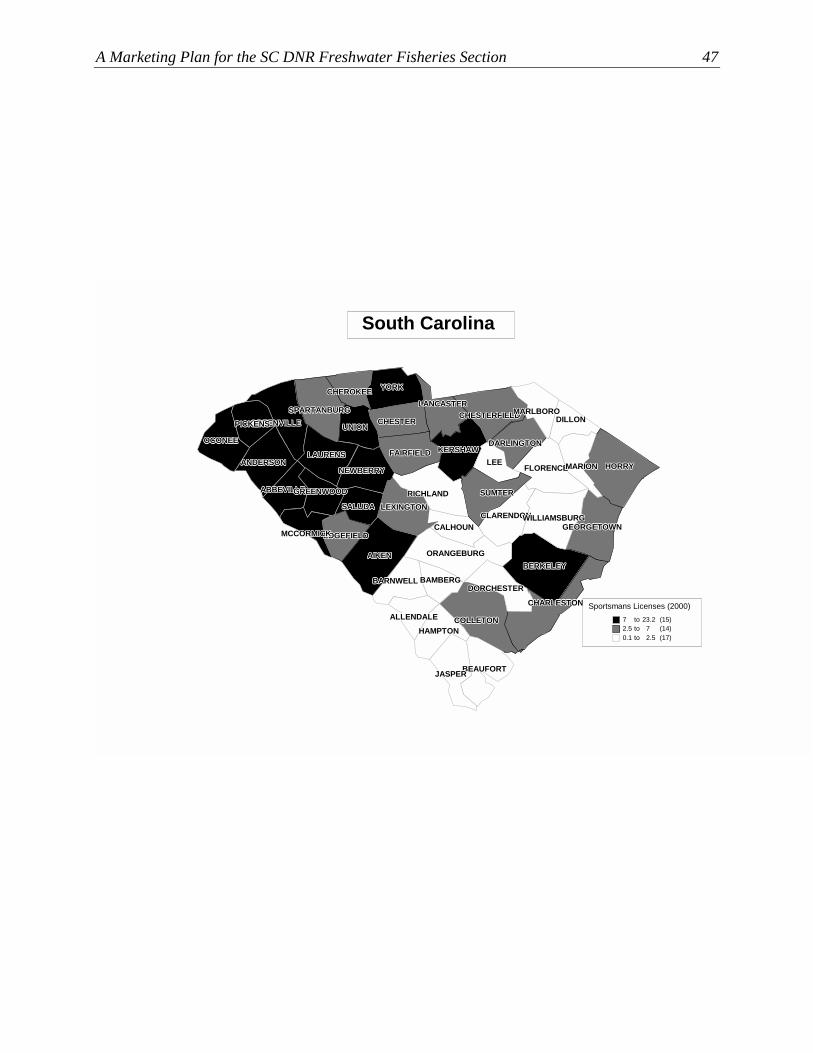
A Marketing Plan for the SC DNR Freshwater Fisheries Section 47
ABBEVILLE ABBEVILLE ABBEVILLE ABBEVILLE ABBEVILLE ABBEVILLE ABBEVILLE ABBEVILLE ABBEVILLE
AIKENAIKENAIKENAIKENAIKENAIKENAIKENAIKENAIKEN
ALLENDALEALLENDALEALLENDALEALLENDALEALLENDALEALLENDALEALLENDALEALLENDALEALLENDALE
ANDERSON ANDERSON ANDERSON ANDERSON ANDERSON ANDERSON ANDERSON ANDERSON ANDERSON
BAMBERGBAMBERGBAMBERGBAMBERGBAMBERGBAMBERGBAMBERGBAMBERGBAMBERGBARNWELLBARNWELLBARNWELLBARNWELLBARNWELLBARNWELLBARNWELLBARNWELLBARNWELL
BEAUFORTBEAUFORTBEAUFORTBEAUFORTBEAUFORTBEAUFORTBEAUFORTBEAUFORTBEAUFORT
BERKELEYBERKELEYBERKELEYBERKELEYBERKELEYBERKELEYBERKELEYBERKELEYBERKELEY
CALHOUNCALHOUNCALHOUNCALHOUNCALHOUNCALHOUNCALHOUNCALHOUNCALHOUN
CHARLESTON CHARLESTON CHARLESTON CHARLESTON CHARLESTON CHARLESTON CHARLESTON CHARLESTON CHARLESTON
CHEROKEECHEROKEECHEROKEECHEROKEECHEROKEECHEROKEECHEROKEECHEROKEECHEROKEE
CHESTERCHESTERCHESTERCHESTERCHESTERCHESTERCHESTERCHESTERCHESTERCHESTERFIELDCHESTERFIELDCHESTERFIELDCHESTERFIELDCHESTERFIELDCHESTERFIELDCHESTERFIELDCHESTERFIELDCHESTERFIELD
CLARENDONCLARENDONCLARENDONCLARENDONCLARENDONCLARENDONCLARENDONCLARENDONCLARENDON
COLLETONCOLLETONCOLLETONCOLLETONCOLLETONCOLLETONCOLLETONCOLLETONCOLLETON
DARLINGTONDARLINGTONDARLINGTONDARLINGTONDARLINGTONDARLINGTONDARLINGTONDARLINGTONDARLINGTON
DILLON DILLON DILLON DILLON DILLON DILLON DILLON DILLON DILLON
DORCHESTERDORCHESTERDORCHESTERDORCHESTERDORCHESTERDORCHESTERDORCHESTERDORCHESTERDORCHESTER
EDGEFIELDEDGEFIELDEDGEFIELDEDGEFIELDEDGEFIELDEDGEFIELDEDGEFIELDEDGEFIELDEDGEFIELD
FAIRFIELDFAIRFIELDFAIRFIELDFAIRFIELDFAIRFIELDFAIRFIELDFAIRFIELDFAIRFIELDFAIRFIELD
FLORENCEFLORENCEFLORENCEFLORENCEFLORENCEFLORENCEFLORENCEFLORENCEFLORENCE
GEORGETOWN GEORGETOWN GEORGETOWN GEORGETOWN GEORGETOWN GEORGETOWN GEORGETOWN GEORGETOWN GEORGETOWN
GREENVILLE GREENVILLE GREENVILLE GREENVILLE GREENVILLE GREENVILLE GREENVILLE GREENVILLE GREENVILLE
GREENWOODGREENWOODGREENWOODGREENWOODGREENWOODGREENWOODGREENWOODGREENWOODGREENWOOD
HAMPTONHAMPTONHAMPTONHAMPTONHAMPTONHAMPTONHAMPTONHAMPTONHAMPTON
HORRY HORRY HORRY HORRY HORRY HORRY HORRY HORRY HORRY
JASPERJASPERJASPERJASPERJASPERJASPERJASPERJASPERJASPER
KERSHAWKERSHAWKERSHAWKERSHAWKERSHAWKERSHAWKERSHAWKERSHAWKERSHAW
LANCASTERLANCASTERLANCASTERLANCASTERLANCASTERLANCASTERLANCASTERLANCASTERLANCASTER
LAURENSLAURENSLAURENSLAURENSLAURENSLAURENSLAURENSLAURENSLAURENSLEELEELEELEELEELEELEELEELEE
LEXINGTONLEXINGTONLEXINGTONLEXINGTONLEXINGTONLEXINGTONLEXINGTONLEXINGTONLEXINGTON
MARION MARION MARION MARION MARION MARION MARION MARION MARION
MARLBOROMARLBOROMARLBOROMARLBOROMARLBOROMARLBOROMARLBOROMARLBOROMARLBORO
MCCORMICKMCCORMICKMCCORMICKMCCORMICKMCCORMICKMCCORMICKMCCORMICKMCCORMICKMCCORMICK
NEWBERRYNEWBERRYNEWBERRYNEWBERRYNEWBERRYNEWBERRYNEWBERRYNEWBERRYNEWBERRY
OCONEE OCONEE OCONEE OCONEE OCONEE OCONEE OCONEE OCONEE OCONEE
ORANGEBURGORANGEBURGORANGEBURGORANGEBURGORANGEBURGORANGEBURGORANGEBURGORANGEBURGORANGEBURG
PICKENS PICKENS PICKENS PICKENS PICKENS PICKENS PICKENS PICKENS PICKENS
RICHLANDRICHLANDRICHLANDRICHLANDRICHLANDRICHLANDRICHLANDRICHLANDRICHLANDSALUDASALUDASALUDASALUDASALUDASALUDASALUDASALUDASALUDA
SPARTANBURGSPARTANBURGSPARTANBURGSPARTANBURGSPARTANBURGSPARTANBURGSPARTANBURGSPARTANBURGSPARTANBURG
SUMTERSUMTERSUMTERSUMTERSUMTERSUMTERSUMTERSUMTERSUMTER
UNIONUNIONUNIONUNIONUNIONUNIONUNIONUNIONUNION
WILLIAMSBURG WILLIAMSBURG WILLIAMSBURG WILLIAMSBURG WILLIAMSBURG WILLIAMSBURG WILLIAMSBURG WILLIAMSBURG WILLIAMSBURG
YORKYORKYORKYORKYORKYORKYORKYORKYORK
Sportsmans Licenses (2000)7 to 23 .2 (15)2 .5 to 7 (14)0 .1 to 2 .5 (17)
South Carolina

48 Responsive Management
ABBEVILLE ABBEVILLE ABBEVILLE ABBEVILLE ABBEVILLE ABBEVILLE ABBEVILLE ABBEVILLE ABBEVILLE
AIKEN AIKEN AIKEN AIKEN AIKEN AIKEN AIKEN AIKEN AIKEN
ALLENDALEALLENDALEALLENDALEALLENDALEALLENDALEALLENDALEALLENDALEALLENDALEALLENDALE
ANDERSON ANDERSON ANDERSON ANDERSON ANDERSON ANDERSON ANDERSON ANDERSON ANDERSON
BAMBERGBAMBERGBAMBERGBAMBERGBAMBERGBAMBERGBAMBERGBAMBERGBAMBERGBARNWELLBARNWELLBARNWELLBARNWELLBARNWELLBARNWELLBARNWELLBARNWELLBARNWELL
BEAUFORTBEAUFORTBEAUFORTBEAUFORTBEAUFORTBEAUFORTBEAUFORTBEAUFORTBEAUFORT
BERKELEYBERKELEYBERKELEYBERKELEYBERKELEYBERKELEYBERKELEYBERKELEYBERKELEY
CALHOUNCALHOUNCALHOUNCALHOUNCALHOUNCALHOUNCALHOUNCALHOUNCALHOUN
CHARLESTONCHARLESTONCHARLESTONCHARLESTONCHARLESTONCHARLESTONCHARLESTONCHARLESTONCHARLESTON
CHEROKEE CHEROKEE CHEROKEE CHEROKEE CHEROKEE CHEROKEE CHEROKEE CHEROKEE CHEROKEE
CHESTERCHESTERCHESTERCHESTERCHESTERCHESTERCHESTERCHESTERCHESTERCHESTERFIELDCHESTERFIELDCHESTERFIELDCHESTERFIELDCHESTERFIELDCHESTERFIELDCHESTERFIELDCHESTERFIELDCHESTERFIELD
CLARENDONCLARENDONCLARENDONCLARENDONCLARENDONCLARENDONCLARENDONCLARENDONCLARENDON
COLLETONCOLLETONCOLLETONCOLLETONCOLLETONCOLLETONCOLLETONCOLLETONCOLLETON
DARLINGTONDARLINGTONDARLINGTONDARLINGTONDARLINGTONDARLINGTONDARLINGTONDARLINGTONDARLINGTON
DILLONDILLONDILLONDILLONDILLONDILLONDILLONDILLONDILLON
DORCHESTERDORCHESTERDORCHESTERDORCHESTERDORCHESTERDORCHESTERDORCHESTERDORCHESTERDORCHESTER
EDGEFIELD EDGEFIELD EDGEFIELD EDGEFIELD EDGEFIELD EDGEFIELD EDGEFIELD EDGEFIELD EDGEFIELD
FAIRFIELDFAIRFIELDFAIRFIELDFAIRFIELDFAIRFIELDFAIRFIELDFAIRFIELDFAIRFIELDFAIRFIELD
FLORENCEFLORENCEFLORENCEFLORENCEFLORENCEFLORENCEFLORENCEFLORENCEFLORENCE
GEORGETOWNGEORGETOWNGEORGETOWNGEORGETOWNGEORGETOWNGEORGETOWNGEORGETOWNGEORGETOWNGEORGETOWN
GREENVILLE GREENVILLE GREENVILLE GREENVILLE GREENVILLE GREENVILLE GREENVILLE GREENVILLE GREENVILLE
GREENWOOD GREENWOOD GREENWOOD GREENWOOD GREENWOOD GREENWOOD GREENWOOD GREENWOOD GREENWOOD
HAMPTONHAMPTONHAMPTONHAMPTONHAMPTONHAMPTONHAMPTONHAMPTONHAMPTON
HORRYHORRYHORRYHORRYHORRYHORRYHORRYHORRYHORRY
JASPERJASPERJASPERJASPERJASPERJASPERJASPERJASPERJASPER
KERSHAWKERSHAWKERSHAWKERSHAWKERSHAWKERSHAWKERSHAWKERSHAWKERSHAW
LANCASTERLANCASTERLANCASTERLANCASTERLANCASTERLANCASTERLANCASTERLANCASTERLANCASTER
LAURENS LAURENS LAURENS LAURENS LAURENS LAURENS LAURENS LAURENS LAURENS LEELEELEELEELEELEELEELEELEE
LEXINGTONLEXINGTONLEXINGTONLEXINGTONLEXINGTONLEXINGTONLEXINGTONLEXINGTONLEXINGTON
MARIONMARIONMARIONMARIONMARIONMARIONMARIONMARIONMARION
MARLBOROMARLBOROMARLBOROMARLBOROMARLBOROMARLBOROMARLBOROMARLBOROMARLBORO
MCCORMICK MCCORMICK MCCORMICK MCCORMICK MCCORMICK MCCORMICK MCCORMICK MCCORMICK MCCORMICK
NEWBERRY NEWBERRY NEWBERRY NEWBERRY NEWBERRY NEWBERRY NEWBERRY NEWBERRY NEWBERRY
OCONEE OCONEE OCONEE OCONEE OCONEE OCONEE OCONEE OCONEE OCONEE
ORANGEBURGORANGEBURGORANGEBURGORANGEBURGORANGEBURGORANGEBURGORANGEBURGORANGEBURGORANGEBURG
PICKENS PICKENS PICKENS PICKENS PICKENS PICKENS PICKENS PICKENS PICKENS
RICHLANDRICHLANDRICHLANDRICHLANDRICHLANDRICHLANDRICHLANDRICHLANDRICHLANDSALUDA SALUDA SALUDA SALUDA SALUDA SALUDA SALUDA SALUDA SALUDA
SPARTANBURG SPARTANBURG SPARTANBURG SPARTANBURG SPARTANBURG SPARTANBURG SPARTANBURG SPARTANBURG SPARTANBURG
SUMTERSUMTERSUMTERSUMTERSUMTERSUMTERSUMTERSUMTERSUMTER
UNION UNION UNION UNION UNION UNION UNION UNION UNION
WILLIAMSBURGWILLIAMSBURGWILLIAMSBURGWILLIAMSBURGWILLIAMSBURGWILLIAMSBURGWILLIAMSBURGWILLIAMSBURGWILLIAMSBURG
YORKYORKYORKYORKYORKYORKYORKYORKYORK
Total Fish Related Licenses (2000)114 to 342 (15)
68 to 114 (13) 21 to 68 (18)
South Carolina
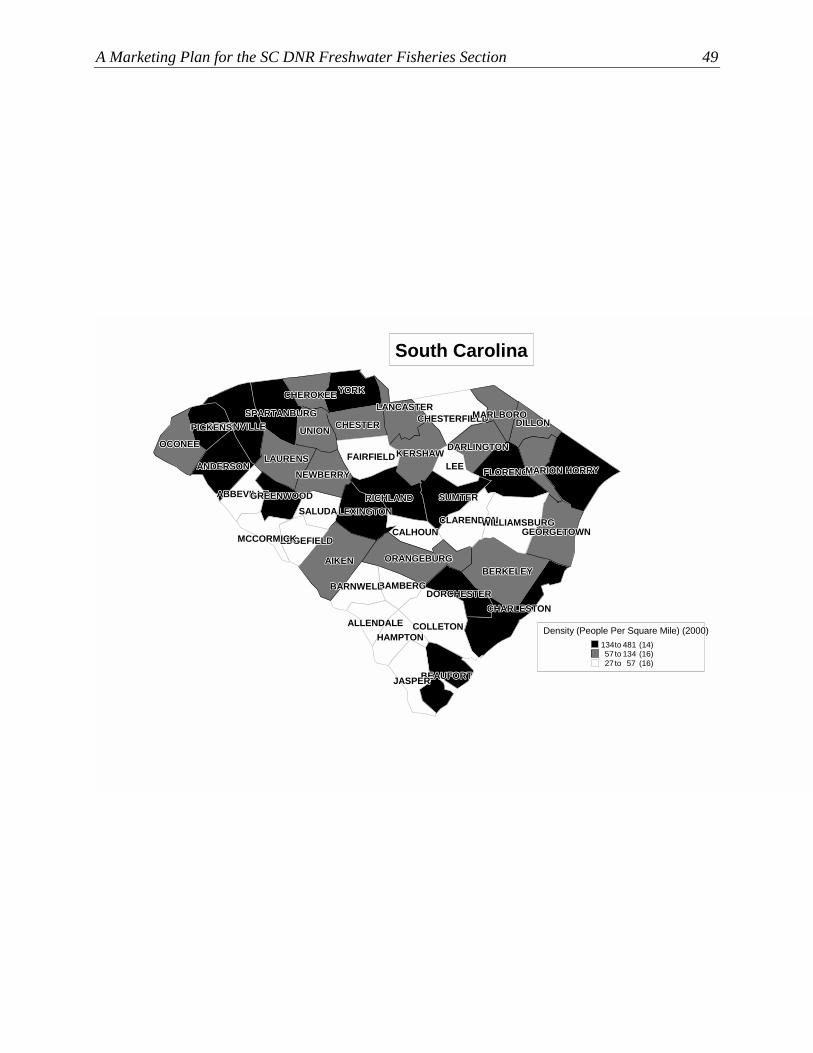
A Marketing Plan for the SC DNR Freshwater Fisheries Section 49
ABBEVILLE ABBEVILLE ABBEVILLE ABBEVILLE ABBEVILLE ABBEVILLE ABBEVILLE ABBEVILLE ABBEVILLE
AIKENAIKENAIKENAIKENAIKENAIKENAIKENAIKENAIKEN
ALLENDALEALLENDALEALLENDALEALLENDALEALLENDALEALLENDALEALLENDALEALLENDALEALLENDALE
ANDERSON ANDERSON ANDERSON ANDERSON ANDERSON ANDERSON ANDERSON ANDERSON ANDERSON
BAMBERGBAMBERGBAMBERGBAMBERGBAMBERGBAMBERGBAMBERGBAMBERGBAMBERGBARNWELLBARNWELLBARNWELLBARNWELLBARNWELLBARNWELLBARNWELLBARNWELLBARNWELL
BEAUFORTBEAUFORTBEAUFORTBEAUFORTBEAUFORTBEAUFORTBEAUFORTBEAUFORTBEAUFORT
BERKELEYBERKELEYBERKELEYBERKELEYBERKELEYBERKELEYBERKELEYBERKELEYBERKELEY
CALHOUNCALHOUNCALHOUNCALHOUNCALHOUNCALHOUNCALHOUNCALHOUNCALHOUN
CHARLESTONCHARLESTONCHARLESTONCHARLESTONCHARLESTONCHARLESTONCHARLESTONCHARLESTONCHARLESTON
CHEROKEECHEROKEECHEROKEECHEROKEECHEROKEECHEROKEECHEROKEECHEROKEECHEROKEE
CHESTERCHESTERCHESTERCHESTERCHESTERCHESTERCHESTERCHESTERCHESTERCHESTERFIELDCHESTERFIELDCHESTERFIELDCHESTERFIELDCHESTERFIELDCHESTERFIELDCHESTERFIELDCHESTERFIELDCHESTERFIELD
CLARENDONCLARENDONCLARENDONCLARENDONCLARENDONCLARENDONCLARENDONCLARENDONCLARENDON
COLLETONCOLLETONCOLLETONCOLLETONCOLLETONCOLLETONCOLLETONCOLLETONCOLLETON
DARLINGTONDARLINGTONDARLINGTONDARLINGTONDARLINGTONDARLINGTONDARLINGTONDARLINGTONDARLINGTON
DILLONDILLONDILLONDILLONDILLONDILLONDILLONDILLONDILLON
DORCHESTERDORCHESTERDORCHESTERDORCHESTERDORCHESTERDORCHESTERDORCHESTERDORCHESTERDORCHESTER
EDGEFIELDEDGEFIELDEDGEFIELDEDGEFIELDEDGEFIELDEDGEFIELDEDGEFIELDEDGEFIELDEDGEFIELD
FAIRFIELDFAIRFIELDFAIRFIELDFAIRFIELDFAIRFIELDFAIRFIELDFAIRFIELDFAIRFIELDFAIRFIELDFLORENCEFLORENCEFLORENCEFLORENCEFLORENCEFLORENCEFLORENCEFLORENCEFLORENCE
GEORGETOWN GEORGETOWN GEORGETOWN GEORGETOWN GEORGETOWN GEORGETOWN GEORGETOWN GEORGETOWN GEORGETOWN
GREENVILLE GREENVILLE GREENVILLE GREENVILLE GREENVILLE GREENVILLE GREENVILLE GREENVILLE GREENVILLE
GREENWOOD GREENWOOD GREENWOOD GREENWOOD GREENWOOD GREENWOOD GREENWOOD GREENWOOD GREENWOOD
HAMPTONHAMPTONHAMPTONHAMPTONHAMPTONHAMPTONHAMPTONHAMPTONHAMPTON
HORRY HORRY HORRY HORRY HORRY HORRY HORRY HORRY HORRY
JASPERJASPERJASPERJASPERJASPERJASPERJASPERJASPERJASPER
KERSHAWKERSHAWKERSHAWKERSHAWKERSHAWKERSHAWKERSHAWKERSHAWKERSHAW
LANCASTERLANCASTERLANCASTERLANCASTERLANCASTERLANCASTERLANCASTERLANCASTERLANCASTER
LAURENS LAURENS LAURENS LAURENS LAURENS LAURENS LAURENS LAURENS LAURENS LEELEELEELEELEELEELEELEELEE
LEXINGTONLEXINGTONLEXINGTONLEXINGTONLEXINGTONLEXINGTONLEXINGTONLEXINGTONLEXINGTON
MARIONMARIONMARIONMARIONMARIONMARIONMARIONMARIONMARION
MARLBOROMARLBOROMARLBOROMARLBOROMARLBOROMARLBOROMARLBOROMARLBOROMARLBORO
MCCORMICK MCCORMICK MCCORMICK MCCORMICK MCCORMICK MCCORMICK MCCORMICK MCCORMICK MCCORMICK
NEWBERRYNEWBERRYNEWBERRYNEWBERRYNEWBERRYNEWBERRYNEWBERRYNEWBERRYNEWBERRY
OCONEE OCONEE OCONEE OCONEE OCONEE OCONEE OCONEE OCONEE OCONEE
ORANGEBURGORANGEBURGORANGEBURGORANGEBURGORANGEBURGORANGEBURGORANGEBURGORANGEBURGORANGEBURG
PICKENS PICKENS PICKENS PICKENS PICKENS PICKENS PICKENS PICKENS PICKENS
RICHLANDRICHLANDRICHLANDRICHLANDRICHLANDRICHLANDRICHLANDRICHLANDRICHLANDSALUDASALUDASALUDASALUDASALUDASALUDASALUDASALUDASALUDA
SPARTANBURG SPARTANBURG SPARTANBURG SPARTANBURG SPARTANBURG SPARTANBURG SPARTANBURG SPARTANBURG SPARTANBURG
SUMTERSUMTERSUMTERSUMTERSUMTERSUMTERSUMTERSUMTERSUMTER
UNIONUNIONUNIONUNIONUNIONUNIONUNIONUNIONUNION
WILLIAMSBURGWILLIAMSBURGWILLIAMSBURGWILLIAMSBURGWILLIAMSBURGWILLIAMSBURGWILLIAMSBURGWILLIAMSBURGWILLIAMSBURG
YORKYORKYORKYORKYORKYORKYORKYORKYORK
Density (People Per Square Mile) (2000)134 to 481 (14) 57 to 134 (16) 27 to 57 (16)
South Carolina

50 Responsive Management
Screening Inspection of the variables screened in the table below indicates that license sales in 2000, adjusted to represent purchases per number of inhabitants per square miles of the county (to standardize the data as indicated previously), were related to several demographic variables. The screened data below show a general pattern where license sales were usually greater in counties with greater proportions of older and/or white inhabitants. The counties where sales were high also are in counties that had been more affluent than other counties in the past (late 60s and 70s). This pattern does not hold, however, for the combination fishing and hunting licenses, which, in contrast, seem to have greater sales in counties with proportionally higher numbers of blacks or African-Americans and people under 18 years of age. A more specific description of each license type is discussed below. The data used to make these interpretations is located in the table on page 53. Shaded cells highlight significant relationships in that table. License Types and Demographic Relationships
• Combined fishing and hunting licenses
Combined fishing and hunting license sales showed a significant positive correlation with the percent of the population within a county under 18 years old (i.e., the higher the percentage of those under 18 years of age, the greater the combined hunting and fishing license sales), the percent of black or African-American inhabitants, the size of the county, and the amount of land in the county (non-water area). That same license type showed a significant negative correlation with the percent of the population between the ages of 25 to 44 within the county, the population density of the county, the household density of the county, and the median household income from 1969 within the county. To summarize, combination hunting and fishing licenses were more likely to have high sales in larger counties with fewer people and fewer houses per square mile, with proportionately more people under 18, proportionately fewer people from 25 to 44 years of age, and proportionately more African-Americans.
• Resident fishing licenses
Resident fishing license sales showed a significant positive correlation with the percent of the population that is 45 to 64 years old and to the median age of the county. This indicates that resident fishing licenses were associated with age.
• Saltwater fishing stamp
Saltwater fishing stamp sales showed a significant positive correlation with the land area of the county, the water area of the county, and the total area of the county.
A Marketing Plan for the SC DNR Freshwater Fisheries Section 51
• Annual non-resident and 10-day non-resident fishing license
In the analysis, annual non-resident and 10-day non-resident fishing license sales were not related to any demographic variables of the counties in which the sales took place.
• 14-day resident fishing license
Sales of 14-day resident fishing licenses showed a significant negative correlation with the percent of people under 18 in the county, and they showed a significant positive correlation with the percent of people 45 to 64 years of age, to the percent of the population 65 and over, and to the median age for the county. This indicates that the numbers of 14-day resident fishing license sales were strongly tied to age in such a way that counties with older populations would tend to have higher sales.
• Lakes and reservoir permit (cane pole)
Lakes and reservoir permit (cane pole) sales showed a significant negative correlation with the percent of the population 25 to 44 years old in the county and the median household income in the county in 1969.
It may be valuable to further examine the interaction of these variables. Note that sales of these licenses showed a negative correlation with median income in the county in 1969, and 1969 falls within the range of birth years for those aged 25 to 44 years – the age cohort that also shows a negative correlation with sales of this type of license.
• Resident junior sportsman’s license
The resident junior sportsman’s license sales showed a significant positive correlation
with the percent of the population within the county aged 45 to 64, the percent aged 65 and over, the median age, and the percent of those who are white in the county. There were also significant positive correlations between this type of license and median household income in 1969 and 1979 (both reported in 2000 dollars).
There were significant negative correlations between the number of license purchases for this type of license and the percent of black or African-American people in the county and the percent of the population under the age of 18.
This indicates that counties that had higher concentrations of older white inhabitants and that had higher median household incomes in the late 60s and 70s were more likely to have higher sales of these type of licenses in 2000.
• Sportsman’s license
Sportsman’s license sales showed a significant positive correlation with median age in
the county, the percent of individuals in the county who are white, and the median household incomes in those counties in 1969 and 1979. There was a significant negative correlation between the number of licenses sold in the county and the percent of black or African-American people living in the county.
52 Responsive Management
Much like with the junior sportsman’s license, this indicates that counties with more wealth in the late 60s and 70s and that had proportionally fewer African-Americans and proportionally more whites tended to have greater sales of this type of license.
• Total fishing-related licenses
Total fishing-related licenses showed a significant positive correlation with the percent of
the population aged 45 to 64 in the county, the median age in the county, the total area of the county, the total land area of the county, and the total water area in the county. Sales of this type of license showed a significant negative correlation with the percent of the population aged 25 to 44 in the county.

Screening
Demographic Characteristics
Variable Information
Combo Fish & Hunt
Licenses Per
Person Per
Square Mile
(County Size) for
2000
Resident Fish
Licenses Per
Person Per
Square Mile
(County Size) for
2000
Saltwater Fishing Stamps
Per Person
Per Square
Mile (County Size) for
2000
Annual Non-
Resident Fish
Licenses Per
Person Per
Square Mile
(County Size) for
2000
14-Day Resident
Fish Licenses
Per Person
Per Square
Mile (County Size) for
2000
Lakes & Reservoir
Permit (Cane
Pole) Per Person
Per Square
Mile (County Size) for
2000
7-Day Non-
resident Fish
Licenses Per
Person Per
Square Mile
(County Size) for
2000
Resident Junior Sports-man’s
Licenses Per
Person Per
Square Mile
(County Size) for
2000
Sports-man’s
License Licenses
Per Person
Per Square
Mile (County Size) for
2000
Total Fish-
Related Licenses
Per Person
Per Square
Mile (County Size) for
2000 Pearson Correlation -.191 -.084 .066 -.158 -.167 -.132 -.081 -.009 .161 -.078
Sig. (2-tailed) .203 .580 .662 .294 .267 .380 .594 .953 .285 .608
Total Population N 46 46 46 46 46 46 46 46 46 46
Pearson Correlation .294(*) -.253 -.033 -.092 -.316(*) .094 -.048 -.368(*) -.493(**) -.118
Sig. (2-tailed) .047 .090 .828 .543 .032 .534 .752 .012 .000 .434
Percent Under 18 N 46 46 46 46 46 46 46 46 46 46
Pearson Correlation -.197 -.137 -.061 -.005 -.128 .100 .135 -.150 -.020 -.070
Sig. (2-tailed) .190 .365 .688 .975 .395 .508 .372 .320 .896 .646
Percent 18 to 24 N 46 46 46 46 46 46 46 46 46 46
Pearson Correlation -.388(**) -.226 -.161 -.063 -.225 -.327(*) -.257 -.039 .066 -.347(*)
Sig. (2-tailed) .008 .131 .286 .678 .134 .027 .085 .796 .661 .018
Percent 25 to 44 N 46 46 46 46 46 46 46 46 46 46
Pearson Correlation .199 .431(**) .129 .117 .464(**) .075 .141 .300(*) .277 .354(*)
Sig. (2-tailed) .184 .003 .392 .439 .001 .621 .351 .043 .063 .016
Percent 45 to 64 N 46 46 46 46 46 46 46 46 46 46
Pearson Correlation .107 .284 .155 .077 .317(*) .065 .060 .342(*) .258 .257
Sig. (2-tailed) .481 .056 .303 .609 .032 .666 .694 .020 .084 .084
Percent 65 and Over N 46 46 46 46 46 46 46 46 46 46
Pearson Correlation .132 .407(**) .132 .123 .431(**) .044 .081 .390(**) .335(*) .313(*)
Sig. (2-tailed) .382 .005 .382 .415 .003 .771 .591 .007 .023 .034
Median Age (Years) N 46 46 46 46 46 46 46 46 46 46
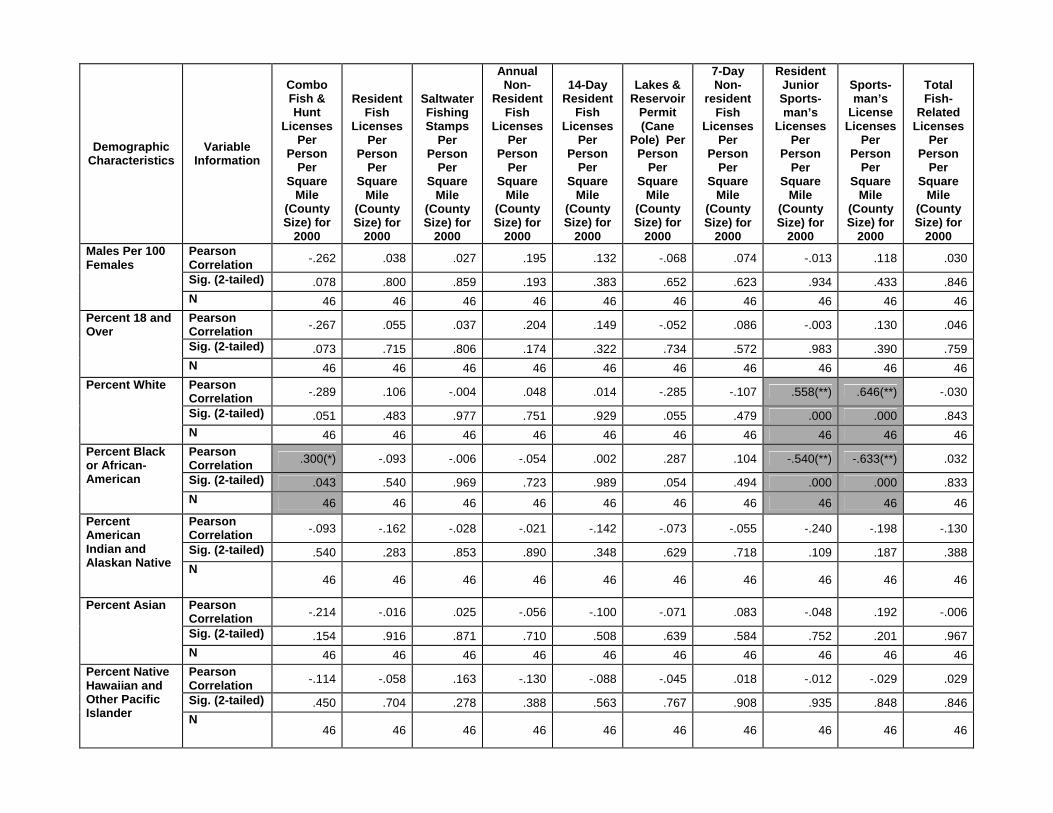
Demographic Characteristics
Variable Information
Combo Fish & Hunt
Licenses Per
Person Per
Square Mile
(County Size) for
2000
Resident Fish
Licenses Per
Person Per
Square Mile
(County Size) for
2000
Saltwater Fishing Stamps
Per Person
Per Square
Mile (County Size) for
2000
Annual Non-
Resident Fish
Licenses Per
Person Per
Square Mile
(County Size) for
2000
14-Day Resident
Fish Licenses
Per Person
Per Square
Mile (County Size) for
2000
Lakes & Reservoir
Permit (Cane
Pole) Per Person
Per Square
Mile (County Size) for
2000
7-Day Non-
resident Fish
Licenses Per
Person Per
Square Mile
(County Size) for
2000
Resident Junior Sports-man’s
Licenses Per
Person Per
Square Mile
(County Size) for
2000
Sports-man’s
License Licenses
Per Person
Per Square
Mile (County Size) for
2000
Total Fish-
Related Licenses
Per Person
Per Square
Mile (County Size) for
2000 Pearson Correlation -.262 .038 .027 .195 .132 -.068 .074 -.013 .118 .030
Sig. (2-tailed) .078 .800 .859 .193 .383 .652 .623 .934 .433 .846
Males Per 100 Females N 46 46 46 46 46 46 46 46 46 46
Pearson Correlation -.267 .055 .037 .204 .149 -.052 .086 -.003 .130 .046
Sig. (2-tailed) .073 .715 .806 .174 .322 .734 .572 .983 .390 .759
Percent 18 and Over N 46 46 46 46 46 46 46 46 46 46
Pearson Correlation -.289 .106 -.004 .048 .014 -.285 -.107 .558(**) .646(**) -.030
Sig. (2-tailed) .051 .483 .977 .751 .929 .055 .479 .000 .000 .843
Percent White
N 46 46 46 46 46 46 46 46 46 46Pearson Correlation .300(*) -.093 -.006 -.054 .002 .287 .104 -.540(**) -.633(**) .032
Sig. (2-tailed) .043 .540 .969 .723 .989 .054 .494 .000 .000 .833
Percent Black or African- American N 46 46 46 46 46 46 46 46 46 46
Pearson Correlation -.093 -.162 -.028 -.021 -.142 -.073 -.055 -.240 -.198 -.130
Sig. (2-tailed) .540 .283 .853 .890 .348 .629 .718 .109 .187 .388
Percent American Indian and Alaskan Native
N 46 46 46 46 46 46 46 46 46 46
Pearson Correlation -.214 -.016 .025 -.056 -.100 -.071 .083 -.048 .192 -.006
Sig. (2-tailed) .154 .916 .871 .710 .508 .639 .584 .752 .201 .967
Percent Asian
N 46 46 46 46 46 46 46 46 46 46Pearson Correlation -.114 -.058 .163 -.130 -.088 -.045 .018 -.012 -.029 .029
Sig. (2-tailed) .450 .704 .278 .388 .563 .767 .908 .935 .848 .846
Percent Native Hawaiian and Other Pacific Islander
N 46 46 46 46 46 46 46 46 46 46
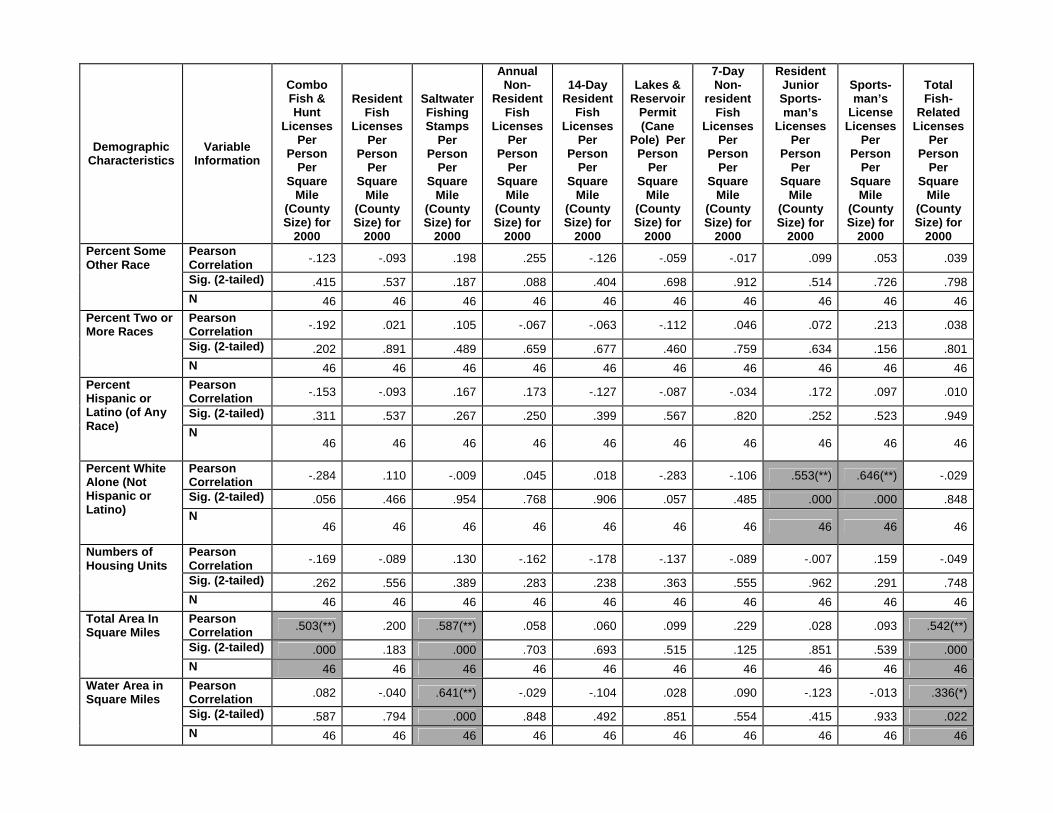
Demographic Characteristics
Variable Information
Combo Fish & Hunt
Licenses Per
Person Per
Square Mile
(County Size) for
2000
Resident Fish
Licenses Per
Person Per
Square Mile
(County Size) for
2000
Saltwater Fishing Stamps
Per Person
Per Square
Mile (County Size) for
2000
Annual Non-
Resident Fish
Licenses Per
Person Per
Square Mile
(County Size) for
2000
14-Day Resident
Fish Licenses
Per Person
Per Square
Mile (County Size) for
2000
Lakes & Reservoir
Permit (Cane
Pole) Per Person
Per Square
Mile (County Size) for
2000
7-Day Non-
resident Fish
Licenses Per
Person Per
Square Mile
(County Size) for
2000
Resident Junior Sports-man’s
Licenses Per
Person Per
Square Mile
(County Size) for
2000
Sports-man’s
License Licenses
Per Person
Per Square
Mile (County Size) for
2000
Total Fish-
Related Licenses
Per Person
Per Square
Mile (County Size) for
2000 Pearson Correlation -.123 -.093 .198 .255 -.126 -.059 -.017 .099 .053 .039
Sig. (2-tailed) .415 .537 .187 .088 .404 .698 .912 .514 .726 .798
Percent Some Other Race N 46 46 46 46 46 46 46 46 46 46
Pearson Correlation -.192 .021 .105 -.067 -.063 -.112 .046 .072 .213 .038
Sig. (2-tailed) .202 .891 .489 .659 .677 .460 .759 .634 .156 .801
Percent Two or More Races N 46 46 46 46 46 46 46 46 46 46
Pearson Correlation -.153 -.093 .167 .173 -.127 -.087 -.034 .172 .097 .010
Sig. (2-tailed) .311 .537 .267 .250 .399 .567 .820 .252 .523 .949
Percent Hispanic or Latino (of Any Race)
N 46 46 46 46 46 46 46 46 46 46
Pearson Correlation -.284 .110 -.009 .045 .018 -.283 -.106 .553(**) .646(**) -.029
Sig. (2-tailed) .056 .466 .954 .768 .906 .057 .485 .000 .000 .848
Percent White Alone (Not Hispanic or Latino)
N 46 46 46 46 46 46 46 46 46 46
Pearson Correlation -.169 -.089 .130 -.162 -.178 -.137 -.089 -.007 .159 -.049
Sig. (2-tailed) .262 .556 .389 .283 .238 .363 .555 .962 .291 .748
Numbers of Housing Units N 46 46 46 46 46 46 46 46 46 46
Pearson Correlation .503(**) .200 .587(**) .058 .060 .099 .229 .028 .093 .542(**)
Sig. (2-tailed) .000 .183 .000 .703 .693 .515 .125 .851 .539 .000
Total Area In Square Miles N 46 46 46 46 46 46 46 46 46 46
Pearson Correlation .082 -.040 .641(**) -.029 -.104 .028 .090 -.123 -.013 .336(*)
Sig. (2-tailed) .587 .794 .000 .848 .492 .851 .554 .415 .933 .022
Water Area in Square Miles N 46 46 46 46 46 46 46 46 46 46
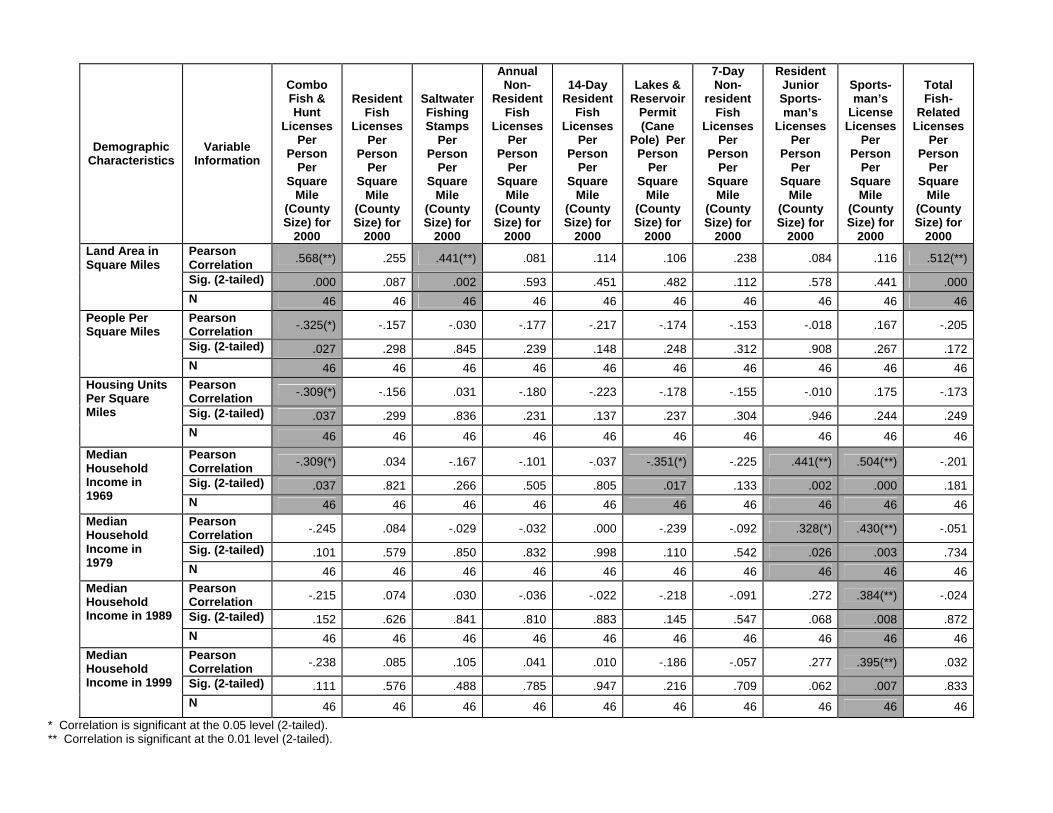
Demographic Characteristics
Variable Information
Combo Fish & Hunt
Licenses Per
Person Per
Square Mile
(County Size) for
2000
Resident Fish
Licenses Per
Person Per
Square Mile
(County Size) for
2000
Saltwater Fishing Stamps
Per Person
Per Square
Mile (County Size) for
2000
Annual Non-
Resident Fish
Licenses Per
Person Per
Square Mile
(County Size) for
2000
14-Day Resident
Fish Licenses
Per Person
Per Square
Mile (County Size) for
2000
Lakes & Reservoir
Permit (Cane
Pole) Per Person
Per Square
Mile (County Size) for
2000
7-Day Non-
resident Fish
Licenses Per
Person Per
Square Mile
(County Size) for
2000
Resident Junior Sports-man’s
Licenses Per
Person Per
Square Mile
(County Size) for
2000
Sports-man’s
License Licenses
Per Person
Per Square
Mile (County Size) for
2000
Total Fish-
Related Licenses
Per Person
Per Square
Mile (County Size) for
2000 Pearson Correlation .568(**) .255 .441(**) .081 .114 .106 .238 .084 .116 .512(**)
Sig. (2-tailed) .000 .087 .002 .593 .451 .482 .112 .578 .441 .000
Land Area in Square Miles N 46 46 46 46 46 46 46 46 46 46
Pearson Correlation -.325(*) -.157 -.030 -.177 -.217 -.174 -.153 -.018 .167 -.205
Sig. (2-tailed) .027 .298 .845 .239 .148 .248 .312 .908 .267 .172
People Per Square Miles N 46 46 46 46 46 46 46 46 46 46
Pearson Correlation -.309(*) -.156 .031 -.180 -.223 -.178 -.155 -.010 .175 -.173
Sig. (2-tailed) .037 .299 .836 .231 .137 .237 .304 .946 .244 .249
Housing Units Per Square Miles N 46 46 46 46 46 46 46 46 46 46
Pearson Correlation -.309(*) .034 -.167 -.101 -.037 -.351(*) -.225 .441(**) .504(**) -.201
Sig. (2-tailed) .037 .821 .266 .505 .805 .017 .133 .002 .000 .181
Median Household Income in 1969 N 46 46 46 46 46 46 46 46 46 46
Pearson Correlation -.245 .084 -.029 -.032 .000 -.239 -.092 .328(*) .430(**) -.051
Sig. (2-tailed) .101 .579 .850 .832 .998 .110 .542 .026 .003 .734
Median Household Income in 1979 N 46 46 46 46 46 46 46 46 46 46
Pearson Correlation -.215 .074 .030 -.036 -.022 -.218 -.091 .272 .384(**) -.024
Sig. (2-tailed) .152 .626 .841 .810 .883 .145 .547 .068 .008 .872
Median Household Income in 1989
N 46 46 46 46 46 46 46 46 46 46Pearson Correlation -.238 .085 .105 .041 .010 -.186 -.057 .277 .395(**) .032
Sig. (2-tailed) .111 .576 .488 .785 .947 .216 .709 .062 .007 .833
Median Household Income in 1999 N 46 46 46 46 46 46 46 46 46 46
* Correlation is significant at the 0.05 level (2-tailed). ** Correlation is significant at the 0.01 level (2-tailed).

A Marketing Plan for the SC DNR Freshwater Fisheries Section 57
Regressions The final analyses examined the effects of the most influential demographic characteristics on the overall trend of total fish-related license sales for each county over the years. This overall trend was determined by saving a value for the slope of the line of best fit for each county for sales of fish-related licenses. The slope, of the same variety used in basic geometry, is in the form or A=BX+C, where B is the slope. The slope is also known as the “Beta,” and in this case, the Beta is standardized to make it comparable across counties. Below is a table showing the standardized Betas for each county. Those Betas, which are a measure of overall change in fishing-related license sales, were then used in a regression of demographic variables selected previously in the screening phase. The resultant equation below shows the basic mix of demographic factors associated with “health” in fishing-related license sales. The largest and only significant factor related to the slope of fishing in each county was the amount of water area in each county. Nearing significance, but not included in the equation below, was the percent of inhabitants under 18 years of age and the percent of white inhabitants. Rate of Change in Fishing-Related Licenses = (0.001902284144772) * (Water Area) + 0.1167961739816

58 Responsive Management
Total of all Fish-Related Licenses
County Beta (ranked from highest to lowest growth in sales)
Beaufort 0.889519 Horry 0.861994 Georgetown 0.858123 Jasper 0.839546 Colleton 0.837903 Charleston 0.815884 Lexington 0.641904 Dillon 0.62426 Dorchester 0.574486 Abbeville 0.571794 Florence 0.535786 Chesterfield 0.534133 Darlington 0.525712 Newberry 0.509031 Lee 0.493931 Total 0.484386 Barnwell 0.466161 Marion 0.464743 York 0.458345 Hampton 0.440383 Greenville 0.368961 Spartanburg 0.363436 Bamberg 0.360139 Oconee 0.314938 Aiken 0.267114 Union 0.259271 Greenwood 0.222012 Williamsburg 0.214282 Chester 0.186181 Cherokee 0.182743 DNR Offices 0.023356 Sumter 0.002836 Out Of State 0.000157 Allendale -0.00253 Pickens -0.00991 Berkeley -0.13566 Anderson -0.13977 Orangeburg -0.20282 Mccormick -0.29743 Saluda -0.31286 Kershaw -0.35971

A Marketing Plan for the SC DNR Freshwater Fisheries Section 59
Total of all Fish-Related Licenses
County Beta (ranked from highest to lowest growth in sales)
Laurens -0.36687 Lancaster -0.37055 Richland -0.37272 Marlboro -0.47211 Edgefield -0.558 Clarendon -0.61685 Fairfield -0.68769 Calhoun -0.77267
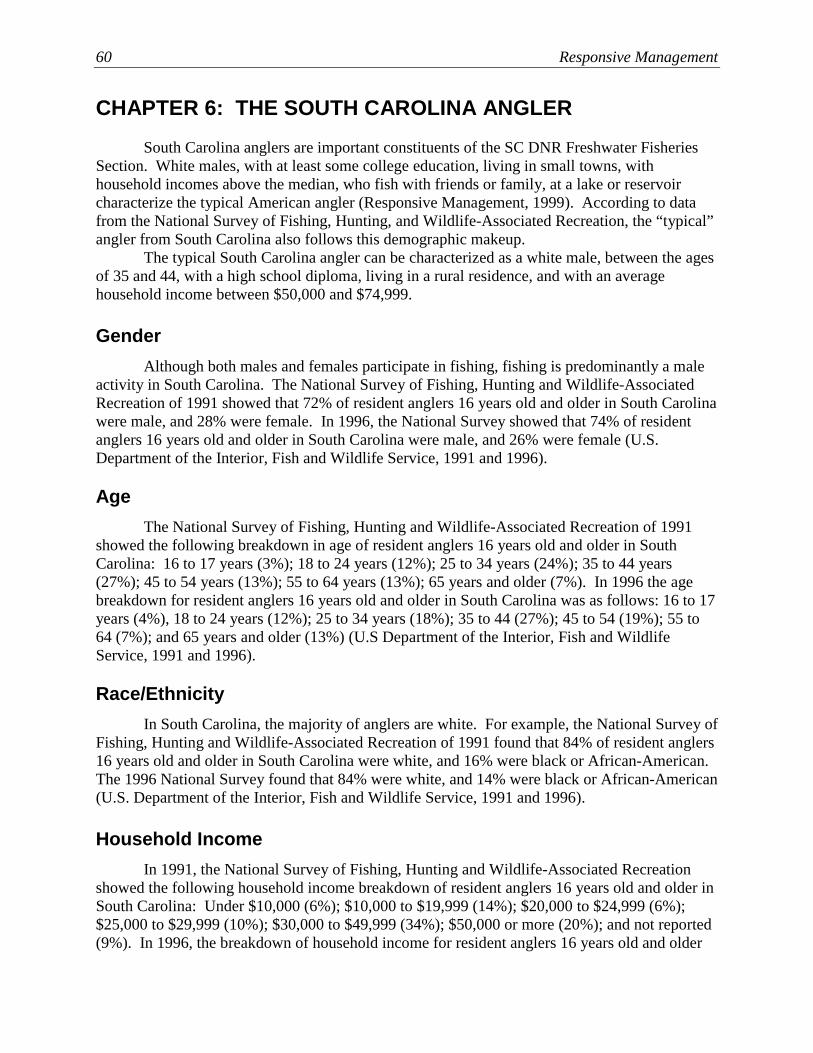
60 Responsive Management
CHAPTER 6: THE SOUTH CAROLINA ANGLER
South Carolina anglers are important constituents of the SC DNR Freshwater Fisheries Section. White males, with at least some college education, living in small towns, with household incomes above the median, who fish with friends or family, at a lake or reservoir characterize the typical American angler (Responsive Management, 1999). According to data from the National Survey of Fishing, Hunting, and Wildlife-Associated Recreation, the “typical” angler from South Carolina also follows this demographic makeup.
The typical South Carolina angler can be characterized as a white male, between the ages of 35 and 44, with a high school diploma, living in a rural residence, and with an average household income between $50,000 and $74,999. Gender Although both males and females participate in fishing, fishing is predominantly a male activity in South Carolina. The National Survey of Fishing, Hunting and Wildlife-Associated Recreation of 1991 showed that 72% of resident anglers 16 years old and older in South Carolina were male, and 28% were female. In 1996, the National Survey showed that 74% of resident anglers 16 years old and older in South Carolina were male, and 26% were female (U.S. Department of the Interior, Fish and Wildlife Service, 1991 and 1996). Age
The National Survey of Fishing, Hunting and Wildlife-Associated Recreation of 1991 showed the following breakdown in age of resident anglers 16 years old and older in South Carolina: 16 to 17 years (3%); 18 to 24 years (12%); 25 to 34 years (24%); 35 to 44 years (27%); 45 to 54 years (13%); 55 to 64 years (13%); 65 years and older (7%). In 1996 the age breakdown for resident anglers 16 years old and older in South Carolina was as follows: 16 to 17 years (4%), 18 to 24 years (12%); 25 to 34 years (18%); 35 to 44 (27%); 45 to 54 (19%); 55 to 64 (7%); and 65 years and older (13%) (U.S Department of the Interior, Fish and Wildlife Service, 1991 and 1996). Race/Ethnicity In South Carolina, the majority of anglers are white. For example, the National Survey of Fishing, Hunting and Wildlife-Associated Recreation of 1991 found that 84% of resident anglers 16 years old and older in South Carolina were white, and 16% were black or African-American. The 1996 National Survey found that 84% were white, and 14% were black or African-American (U.S. Department of the Interior, Fish and Wildlife Service, 1991 and 1996). Household Income
In 1991, the National Survey of Fishing, Hunting and Wildlife-Associated Recreation showed the following household income breakdown of resident anglers 16 years old and older in South Carolina: Under $10,000 (6%); $10,000 to $19,999 (14%); $20,000 to $24,999 (6%); $25,000 to $29,999 (10%); $30,000 to $49,999 (34%); $50,000 or more (20%); and not reported (9%). In 1996, the breakdown of household income for resident anglers 16 years old and older
A Marketing Plan for the SC DNR Freshwater Fisheries Section 61
in South Carolina was as follows: Under $10,000 (7%); $10,000 to $19,999 (8%); $20,000 to $29,999 (14%); $30,000 to $39,999 (10%); $40,000 to $49,999 (10%); $50,000 to $74,999 (25%); $75,000 or more (14%); and not reported (12%) (U.S. Department of the Interior, Fish and Wildlife Service, 1991 and 1996).
Education The National Survey of Fishing, Hunting and Wildlife-Associated Recreation showed that in 1991 the education breakdown of resident South Carolina anglers 16 years old and older was as follows: 8 years or less (8%); 9-11 years (13%); 12 years (40%); 1-3 years college (21%); and 4 years college or more (19%). In 1996, the breakdown was as follows: 8 years or less (5%); 9-11 years (11%); 12 years (37%); 1-3 years college (21%); and 4 years college or more (26%) (U.S. Department of the Interior, Fish and Wildlife Service, 1991 and 1996).
Residence The National Survey of Fishing, Hunting and Wildlife-Associated Recreation showed that in 1991, 59% of South Carolina resident anglers 16 years old and older lived in a rural residence, while 41% lived in an urban residence. In 1996, 58% of South Carolina resident anglers 16 years old and older lived in a rural residence, while 42% lived in an urban residence (U.S. Department of the Interior, Fish and Wildlife Service, 1991 and 1996).

62 Responsive Management
CHAPTER 7: SOUTH CAROLINA FISHING LICENSE HOLDERS’ OPINIONS AND ATTITUDES TOWARD FISHERIES MANAGEMENT AND THE SC DNR Responsive Management conducted a study in 1998 for the SC DNR on fishing license holders’ opinions and attitudes toward fisheries management and the agency itself. Responsive Management surveyed fishing license holders (including a breakout of largemouth and smallmouth bass anglers) for this study. The results are shown below. Fishing License Purchase Behavior
To assess turnover within the angling community, fishing license holders were asked in how many of the last five years had they purchased a South Carolina fishing license. The majority of fishing license holders (59%) had bought at least one license each year for the past five years.
The majority (65%) of largemouth bass anglers and 49% of smallmouth anglers had bought at least one license each year for the past five years. Ten percent of largemouth bass anglers and 19% of smallmouth bass anglers had only bought at least one license in only one year over the past five years. Ten percent of largemouth bass anglers and 14% of smallmouth bass anglers bought at least one license during two of the past five years, 6% of largemouth bass anglers and 11% of smallmouth bass anglers bought at least one license during four of the past five years, while 9% of largemouth bass anglers and 7% of smallmouth bass anglers bought at least one license during three of the past five years. Fishing Participation
Eleven percent of South Carolina fishing license holders did not freshwater fish in the
state during the 1996/1997 fishing license year. The most frequent response among license holders when asked how many days or parts of days they freshwater fished in the state during the 1996/1997 fishing year was 1-10 days (39%). Twenty-two percent freshwater fished over 40 days, 16% freshwater fished for 21-40 days, and 13% fished 11-20 days in South Carolina during the 1996/97 fishing license year. The average number of days fished among all South Carolina fishing license holders, whether they participated or not (i.e., including those who fished 0 days), for the 1996/97 license year was 29.72 days.
Those license holders who did not freshwater fish during the 1996/97 fishing license year were asked for the main reason they did not freshwater fish. Half of these inactive fishing license holders indicated that they did not have enough time. Twelve percent said other reasons. Seven percent said they aren’t interested in fishing, while another 6% only saltwater fished. For 5% of the inactive fishing license holders, poor health was the reason for not participating, while 4% did not have anyone to go with. Four percent did not know why they didn’t fish during the 1996/97 license year, and 3% said the weather prevented them from fishing. Two percent of inactive fishing license holders said they bought a license only to support the DNR.
Over one-third of all fishing license holders (38%) said their level of fishing activity over the past five years has increased. For 31% of fishing license holders, fishing activity had

A Marketing Plan for the SC DNR Freshwater Fisheries Section 63
remained the same. For 30% of fishing license holders, fishing activity had decreased over the past five years.
The average number of days of freshwater fishing undertaken by largemouth bass anglers who fished at least one day during the 1996/97 license year was 38.29 days. The average number of days of freshwater fishing undertaken by smallmouth bass anglers who fished at least one day during the 1996/97 license year was 34.36 days. Forty-one percent of largemouth bass anglers and 44% of smallmouth bass anglers said that their level of fishing activity over the past five years had increased. For 30% of largemouth bass anglers and 23% of smallmouth bass anglers, fishing activity had remained the same. For 28% of largemouth bass anglers and 33% of smallmouth bass anglers, fishing activity had decreased over the past five years. Respondents were also asked to project their fishing activity over the next five years. Fifty-three percent of largemouth bass anglers and 46% of smallmouth bass anglers expected their level of fishing to increase over the next five years. Forty-one percent largemouth bass anglers and 42% of smallmouth bass anglers expected their fishing activity to remain the same. Four percent of largemouth bass anglers and 5% of smallmouth bass anglers expected their fishing activity to decrease, while 3% of largemouth and 7% of smallmouth bass anglers did not know. Fishing Motivation
Active fishing license holders were asked their main reason for fishing in the past year. Respondents were presented six potential motivations. Less than half of active fishing license holders (44%) fished for relaxation. Nineteen percent fished to be with family and friends, while another 19% fished for the sport. Six percent fished to be close to nature, 6% fished to catch fresh fish, and 4% fished to catch large fish. Two percent said, “don’t know.”
Largemouth and smallmouth bass anglers were asked their main reasons for fishing in the past year. Respondents were also presented six potential motivations. Less than half of the largemouth bass anglers (43%) fished for relaxation. Twenty-one percent fished for the sport, 16% fished to be with family and friends, 8% fished to be close to nature, and 7% fished to catch fresh fish. Four percent of largemouth bass anglers fished to catch large fish, and 1% didn’t know. Of the smallmouth bass anglers, almost half fished for relaxation (47%). Twenty-five percent fished to be with family and friends. Eleven percent fished to catch fresh fish, while another 11% fished for the sport. Four percent fished to catch large fish, and another 4% fished to be close to nature. Opinion of the Quality of South Carolina Fishing One third of active fishing license holders thought the quality of South Carolina fishing had improved over the last ten years. Twenty-six percent thought the quality had remained the same, while another 26% thought the quality had declined. Fourteen percent did not know. Active license holders who thought the quality of South Carolina fishing had improved over the last ten years were asked what they believe to be the reason for the improvement. Twenty percent of these respondents attributed the improvement to cleaner water and 13% said there are more fish. Twelve percent indicated the overall fish and wildlife management is better, while 9% consider increased access to be the reason for improvement. Eight percent said there was less litter, and 7% thought the laws and regulations related to fishing have positively impacted the resource. Six percent said more people practiced catch and release, 5% said there was more

64 Responsive Management
awareness among anglers, and 5% thought improved law enforcement had improved the quality of fishing. Three percent or less said any of the following: more trophy fish, more anglers, the fish attractor program, or stocking. Twenty-one percent said they did not know, and 10% mentioned other reasons. Active fishing license holders who thought the quality of South Carolina fishing had declined over the last ten years were asked what they believed to be the reason for the decline. More than one reason was noted. Thirty percent of these respondents attributed the decline to overfishing, and 16% said there were too many anglers. Sixteen percent named pollution as a reason for the decline, while 8% said there were too many recreationists besides anglers. Seven percent said there was not enough stocking, and 5% thought there was too much aquatic vegetation. Four percent attributed the decline to poor weather, and 4% said litter. Three percent or less said any of the following: improper water levels, catfish are eating other fish, not enough aquatic vegetation, people not practicing catch and release, development, people taking undersized or illegal fish, or the bag and size limits are not in place or are too liberal. Eight percent said they did not know, and 14% mentioned other reasons.
Thirty-six percent of largemouth bass anglers and 30% of smallmouth bass anglers thought the quality of South Carolina fishing had improved over the last ten years. Twenty-seven percent and 23%, respectively, thought the quality had remained the same; while 27% and 26%, respectively, thought the quality had declined. Eleven percent of largemouth bass anglers did not know, while 21% of smallmouth bass anglers did not know. Respondents who thought the quality of South Carolina fishing had improved over the last ten years were asked what they believed to be the reason for the improvement. More than one reason could be noted. Twenty-one percent of the largemouth bass anglers attributed the improvement to cleaner water, and 12% said there was improved management in general. Thirteen percent indicated there were more fish, while 9% considered increased access to be the reason for improvement. Eight percent said more people practice catch and release, 8% said the laws and regulations related to fishing had positively impacted the resource, 7% thought less litter improved quality, 6% said more awareness and 6% better law enforcement. Eighteen percent said they did not know. Many other reasons were mentioned by largemouth bass anglers who thought the quality of South Carolina had improved, but none by at least 5% of this population.
Respondents who thought the quality of South Carolina fishing had declined over the last ten years were asked what they believe to be the reason for the decline. More than one reason could be noted. Thirty-three percent of largemouth bass anglers attributed the decline to overfishing and 19% said there were too many anglers. Seventeen percent named pollution as a reason for the decline, while 7% said there were too many other recreationists besides anglers. Six percent thought there was too much aquatic vegetation. Seven percent said they did not know. Many other reasons were mentioned by largemouth bass anglers who thought the quality of South Carolina has declined, but none by at least 5% of this population. Opinion of Fisheries Management and the South Carolina Department of Natural Resources
Knowledge of SC DNR Fisheries Section Responsibilities Respondents were asked what they believed to be the primary responsibilities of the SC DNR Fisheries Section. Over one third of active fishing license holders (34%) said they did not
A Marketing Plan for the SC DNR Freshwater Fisheries Section 65
know. Thirty-eight percent of active fishing license holders mentioned hatcheries or stocking programs, while 18% talked about law enforcement. Sixteen percent named responsibilities related to habitat restoration and enhancement, while 7% knew the Fisheries Section is responsible for setting regulations and laws related to fishing.
Largemouth and smallmouth bass anglers were also asked what they believed to be the primary responsibilities of the SC DNR Freshwater Fisheries Section. Respondents were not prompted with potential responsibilities and were allowed to offer more than one answer. Of the largemouth bass angler population, 30% said don’t know. Forty-one percent mentioned hatcheries or stocking programs, while 19% talked about law enforcement. Eighteen percent named responsibilities related to habitat restoration and enhancement, while 7% knew the Fisheries Section is responsible for setting regulations and laws related to fishing. Five percent of active fishing license holders said the Section is responsible for maintaining clean fishing areas and clean water.
Of the smallmouth bass angler population, 39% said they did not know what the primary responsibilities of the SC DNR Freshwater Fisheries Section were. Thirty-nine percent mentioned hatcheries or stocking programs, while 18% talked about law enforcement. Fourteen percent named responsibilities related to habitat restoration and enhancement, while 7% knew the Section is responsible for setting regulations and laws related to fishing. Five percent mentioned safety issues. Many other responsibilities were mentioned, but none by at least 5% of smallmouth bass anglers. Satisfaction with SC DNR Freshwater Fisheries Section A large majority of active fishing license holders were satisfied (85%) with the performance of the Section in protecting, conserving, and enhancing the state’s fisheries resources while providing recreational fishing opportunities. Specifically, 42% were very satisfied, 43% were somewhat satisfied, 5% were somewhat dissatisfied, 3% were very dissatisfied, and 1% were neither satisfied nor dissatisfied. Seven percent did not know.
A large majority of the largemouth bass angler population was satisfied (86%) with the performance of the Section in protecting, conserving, and enhancing the state’s fisheries resources while providing recreational fishing opportunities. Specifically, 43% were very satisfied, 43% were somewhat satisfied, 5% were somewhat dissatisfied, 2% were very dissatisfied, and 1% were neither satisfied nor dissatisfied. Six percent did not know. A large majority of the smallmouth bass angler population was also satisfied (79%) with the performance of the Section in protecting, conserving, and enhancing the state’s fisheries resources while providing recreational fishing opportunities. Specifically, 37% were very satisfied, 42% were somewhat satisfied, 5% were somewhat dissatisfied, and 4% were very dissatisfied. Twelve percent did not know. Opinion of Section Programmatic Emphasis Active fishing license holders were presented with 18 program areas of the Section and were asked if they thought more, the same, or less effort should be directed to each. The 18 program areas ranked in descending order based on the percent of active fishing license holders who desired more emphasis are as follows:
66 Responsive Management
• Protecting habitat used by fish and other aquatic life (75% said more emphasis) • Fish stocking programs in public waters (74%) • Information and education programs (70%) • Management of largemouth bass (61%) • Maintaining the existing 17 DNR-owned public fishing lakes (61%) • Developing DNR-owned public owned fishing lakes (60%) • Enforcement of fishing regulations (57%) • Fish attractor program (56%) • Shore fishing access (56%) • Management of crappie (53%) • Provide fishing for wild fish (53%) • Management of striped bass (48%) • Management of smallmouth bass (46%) • Management of bream (44%) • Technical assistance to private pond owners (43%) • Management of coldwater trout species (41%) • Management of hybrid striped bass (39%) and • Management of catfish (35%)
Largemouth and smallmouth bass anglers were also presented with 18 program areas of the Fisheries Section and were asked if they thought that more, the same, or less effort should be directed to each. The 18 program areas ranked in descending order based on the percent of largemouth bass anglers who desired more emphasis are as follows:
• Protecting habitat used by fish and other aquatic life (76% said more emphasis) • Fish stocking programs in public waters (75%) • Information and education programs (71%) • Management of largemouth bass (68%) • Maintaining the existing 17 DNR-owned public fishing lakes (62%) • Developing DNR-owned public fishing lakes (61%) • Enforcement of fishing regulations (59%) • Shore fishing access (58%) • Fish attractor program (58%) • Management of crappie (56%) • Provide fishing for wild fish (55%) • Management of striped bass (51%) • Management of smallmouth bass (51%) • Management of coldwater trout species (46%) • Technical assistance to private pond owners (46%) • Management of bream (41%) • Management of hybrid striped bass (41%) • Management of catfish (34%)
A Marketing Plan for the SC DNR Freshwater Fisheries Section 67
The 18 program areas ranked in descending order based on the percent of smallmouth bass anglers who desired more emphasis are as follows:
• Fish stocking programs in public waters (84% said more emphasis) • Protecting habitat used by fish and other aquatic life (71%) • Management of smallmouth bass (68%) • Information and education programs (66%) • Management of largemouth bass (63%) • Fish attractor program (61%) • Provide fishing for wild fish (59%) • Maintaining the existing 17 DNR-owned public fishing lakes (59%) • Developing DNR-owned public fishing lakes (57%) • Management of coldwater trout species (52%) • Management of striped bass (52%) • Shore fishing access (50%) • Enforcement of fishing regulations (50%) • Management of crappie (50%) • Management of bream (50%) • Technical assistance to private pond owners (46%) • Management of hybrid striped bass (45%) • Management of catfish (38%)
Funding Fisheries Management in South Carolina Opinion of New Funding Sources
Respondents were informed, “the Freshwater Fisheries Section receives funding from fishing license sales, federal excise taxes on fishing equipment, and general state funds. Although revenues have remained stable, costs have increased. So, the SC DNR is looking at options to increase revenue.” Respondents were then asked to name potential sources to fund fisheries programs. Forty-one percent of active fishing license holders did not know of any sources for increased fisheries program funding. Twenty-eight percent said the SC DNR could raise current license fees, while 9% said to look for more general state revenues. A wide variety of funding sources were mentioned but none were mentioned by at least 5% of active fishing license holders.
Of the largemouth bass angler population, 37% did not know of any sources for increased fisheries program funding. Thirty percent said the DNR could raise current license fees, while 9% said to look for more general state revenues. Five percent said tournament fees or SC DNR-sponsored tournaments, 5% said fines, and 5% said an increase in PR-DJ excise taxes. A wide variety of funding sources were mentioned but none were mentioned by at least 5% of largemouth bass anglers. Of the smallmouth bass angler population, 36% did not know of any sources for increased fisheries program funding. Thirty percent said the SC DNR could raise current license fees, while 18% said look for more general state revenues. Seven percent said an increase in PR-DJ excise taxes, while 5% said DNR-sponsored and other tournament fees. A

68 Responsive Management
wide variety of funding sources were mentioned but none were mentioned by at least 5% of smallmouth bass anglers. Information and Education
Survey respondents were asked to name sources from which they received information about fishing, and the question allowed more than one response. One third of active fishing license holders received fishing information from family and friends, while one third read outdoor magazines. Fifteen percent cited newspapers. Thirteen percent referred to the “Rules and Regulations” handbook, while 9% used SC DNR publications and brochures other than the regulations handbook. Eight percent received information from TV, 7% named “SC Wildlife” magazine, 7% got information from sporting goods stores/bait shops, 7% relied on personal experience, and 6% read magazines (other than outdoor type magazines). Many other information sources were mentioned, but none were mentioned by at least 5% of active fishing license holders. Five percent did not know where they had received fishing information.
Of the largemouth bass anglers, 37% received fishing information from outdoors magazines, while 34% got information from family and friends. Fourteen percent of largemouth bass anglers cited newspapers. Thirteen percent referred to the “Rules and Regulations” handbook, while 9% received information from TV. Eight percent named “SC Wildlife” magazine and 8% used SC DNR publications and brochures other than the regulations handbook. Seven percent got information from sporting goods stores/bait shops, 7% read magazines (other than outdoor-type magazines), and 6% relied on personal experiences. Many other information sources were mentioned, but none were mentioned by at least 5% of largemouth bass anglers. Four percent of largemouth bass anglers did not know where they had received fishing information.
Of the smallmouth bass angler population, 38% received fishing information from outdoors magazines, while 36% got information from family and friends. Eighteen percent of smallmouth bass anglers cited newspapers, while another 18% said they received information from TV. Eleven percent named “SC Wildlife” magazine. Seven percent used SC DNR publications and brochures other than the regulations handbook. Five percent referred to the “Rules and Regulations” handbook. Many other information sources were mentioned, but none were mentioned by at least 5% of smallmouth bass anglers. Seven percent of smallmouth bass anglers did not know where they had received fishing information.
Striped Bass Fisheries Management on Lake Murray
This study was conducted for the Fisheries Section of the South Carolina Department of Natural Resources to ascertain the attitudes and opinions of striped bass anglers concerning fisheries management on Lake Murray (Responsive Management, 2000). Overall, the study showed that bass anglers were satisfied with the agency’s fisheries management on Lake Murray, as indicated below. Twenty-six percent of respondents rated the quality of the striped bass fishery on Lake Murray as excellent, 52% as good, 16% as fair, 4% as poor, and 2% did not know. Twenty-nine percent of respondents stated that the Freshwater Fisheries Section of the SC DNR did an excellent job with respect to the striped bass fishery on Lake Murray. Fifty-three percent
A Marketing Plan for the SC DNR Freshwater Fisheries Section 69
reported that the SC DNR did a good job, 10% fair, 2% poor, and 6% did not know. Ninety percent of respondents were satisfied (49% very and 41% somewhat) with the SC DNR’s management of striped bass on Lake Murray, 8% were dissatisfied, and 2% were neither satisfied nor dissatisfied.
Of the respondents who were satisfied with the Department’s management of striped bass on Lake Murray, 64% cited plenty of fish as the main reason for their satisfaction. Other reasons for satisfaction with the Department’s management of striped bass on Lake Murray included: Sufficient law enforcement (34%), quality of fish health and 5 fish creel limit (each 27%), good water quality (26%), 21 inch length limit (25%), and plenty of large/trophy fish (12%). Forty-three percent of respondents reported that fishing for striped bass on Lake Murray had improved (12% greatly and 31% somewhat) since the 5/21 regulations was put in place, 13% reported it had declined (9% somewhat and 4% greatly), and 20% reported it had stayed the same. One quarter of respondents had not fished on Lake Murray before the 5/21 went into effect. Thirty-eight percent of respondents reported that, since the 5/21 was put into effect, there were more quality striped bass 98% much more and 30% somewhat more) on Lake Murray. Twenty-two percent reported there were less quality striped bass (14% somewhat and 8% much less), 19% reported the same, and 20% did not know. Twenty-two percent of respondents reported that, since the 5/21 was put into effect, there were more trophy striped bass (4% much more and 18% somewhat more) on Lake Murray. Thirty-four percent reported there were less trophy striped bass (21% somewhat and 13% much less), 18% reported there were the same numbers, and 27% did not know.

70 Responsive Management
CHAPTER 8: YOUTH AND FISHING/AQUATIC RESOURCES
In 2001, Responsive Management conducted a study for the South Carolina Department of Natural Resources to assess South Carolina youths’ awareness of issues related to aquatic resources and recreational fishing. The goal of this study was to gather the data on South Carolina youth to assist the SC DNR tailor its youth aquatic programs and services. This survey obtained data on South Carolina youths’ attitudes toward, opinions on, knowledge of, and perceived priorities toward South Carolina aquatic resources and recreational fishing. This study examined fishing initiation, motivation, and fishing participation rates among South Carolina youth. Data were examined for youth 8-18 years old and for their gender and grade-level population subsets.
Fishing Participation
Overall
A projected 548,847 of the 601,268 youth (91%) between the ages of 8 and 18 in South Carolina had fished at least one time in their lives, and a projected 370,615 of the 601,268 youth (62%) between the ages of 8 and 18 in South Carolina had fished during the last twelve months. Overall highlights from the study are as follows:
• 55% of all youth in South Carolina fished in freshwater. • 20% of all youth in South Carolina fished in saltwater. • The most common reason youth go fishing is to “have fun.” • Youth who had fished within the last twelve months fished an average of 13 days
per year. • 53% of youth would go fishing more often if they could. • The most common reason reported for not fishing more often was “not enough
time” (38%). Gender
• More male youth (94%) than female youth (88%) in South Carolina had fished in their life.
• More male youth (73%) than female youth (60%) had fished in the last twelve months.
• Most all fishing done by youth, who had fished in the last twelve months, regardless of gender, is in freshwater (91% of males and 88% of females).
• 34% of males and 29% of females, who had fished in the last twelve months, fished in saltwater.
• The majority of male youth (55%) liked fishing “a lot,” whereas the majority of female youth (54%) liked fishing “a little.”
• Significantly more male (69%) than female (53%) youth had fished within the past 12 months.
A Marketing Plan for the SC DNR Freshwater Fisheries Section 71
• Male youth had fished the most recently: more males (46%) reported having fished “this spring” than did female youth (34%).
• Male youth spent considerably more days (17) fishing than female youth (8). • Large percentages of both male youth (57%) and female youth (47%) anglers
wished they could fish more often. • The most popular reason youth go fishing regardless of gender was “to have fun,”
reported by 45% of both male and female youth anglers. • The most common reason reported for both male (41%) and female (35%) youth
for not fishing more often was “not enough time.” • When asked specifically what caused respondents to not have enough time,
“school” was the only reason given by a majority of male (65%) and female (74%) youth.
Grade
• Most South Carolina youth are introduced to fishing at a young age and those who remain within the sport of fishing become active anglers by grades 9-12.
• 85% of youth have fished by the fourth grade. • More youth in the lower grades (72% for grades 1-4; 69% for grades 5-8; and
64% for grades 9-12) reported having fished in the last twelve months. • Anglers in grades 1-4 fished an average of 8 days per year; anglers in grades 5-8
fished an average of 12 days per year and, anglers in grades 9-12 fished an average of 15 days per year.
• Youth in grades 1-4 were the most enthusiastic about fishing with 55% reporting liking fishing “a lot,” compared to 48% in grades 5-8 and 41% in grades 9-12 who liked fishing “a lot.” Youth in the higher grade levels were significantly more reserved in their ratings of liking fishing.
• A greater proportion of youth in grades 1-4 (23% relative to 16% in grades 5-8 and 10% in grades 9-12) indicated they fished “to catch fish.” As age increased, “to catch fish” became an ever increasingly unimportant reason for fishing.
• In general, those reasons to fish that had a more naturalistic connotation of “being close to nature” and “to relax” were especially important to higher grade-level youth.
Fishing Initiation
Overall
• Youth fishing occurs almost entirely within the familial context. • A father or male family member initiates almost all youth into fishing. • Over two-thirds (67%) of youth were first taught to fish by their father. • Most youth usually fished with their father (63%), and most youth preferred to
fish with their father (51%).

72 Responsive Management
Gender
• Regardless of gender, most youth were first taught to fish by their father (69% of males and 64% of females).
• Most youth, regardless of gender, reported overwhelmingly that they usually fished with their father (64% of females and 62% of males).
• After father, the second most common fishing companion for male youth (19%) was “friends the same age.”
• After father, the second most common fishing companion for female youth (14%) was their mother.
• When asked to consider who respondents would most like to go fishing with, half of both male (52%) and female youth (51%) reported they most preferred to go fishing with their father.
• It appears that though both male and female youth liked fishing with friends, had friends who fished, and reported that youth their age thought of fishing as “cool,” male youth had slightly stronger opinions, knew more friends who fished, and thought of fishing more highly than did female youth.
Grade
• The top three fishing companions who taught youth how to fish were the same regardless of grade cohort: a father, grandfather, and an uncle.
• The majority of youth, regardless of grade cohort, usually fished with their father. • Lower grade-level youth usually fished with immediate family, but as youth grew
older their desire to fish with friends either older or of the same age became more apparent.
• Lower grade-level children usually fished with and preferred to fish with family. • As youth grew older, those who reported fishing with their father, grandfather,
and/or mother decreased and those who fished with friends increased. • Youth in grades 9-12 usually fished with friends more than did any other grade
cohort and preferred to fish with friends more than did any other grade cohort. • Fishing is viewed as being “cool” most strongly by youth in grades 1-4.
Fishing License and Species Data
Overall
• 26% of South Carolina youth between ages 16-18 have purchased a fishing license.
Gender
• A significantly greater proportion of male youth (39%) had purchased a South Carolina fishing license than did female youth (11%).
A Marketing Plan for the SC DNR Freshwater Fisheries Section 73
• Most youth, both male (68%) and female (88%), who purchased a fishing license reported that having to purchase a fishing license did not restrict them from going fishing.
Interest in Outdoor Recreational Activities and Fishing Clubs
Overall
• Fishing (saltwater and freshwater combined) was the second most popular outdoor recreational activity youth had participated in during the last twelve months.
• Youth were most interested in fishing from a boat (85%) although few actually participated in boating activities.
• A small percentage (11%) of South Carolina youth currently belong to an animal or outdoor club.
• 60% of youth are interested in joining an animal or outdoor club.
Gender • Both male and female youth reported the same top two outdoor recreational
activities participated in during the last twelve months: biking and fishing (saltwater or freshwater).
• When male and female youth were presented with different types of fishing and asked if they were interested in participating in each type of fishing, female youth, in general, showed less interest than male youth in all of the different types of fishing presented to them.
• A greater proportion of male youth (13% relative to 7% of females) indicated that they belonged to an outdoor club.
Grade
• The most popular outdoor recreational activity for grades 1-4 and grades 5-8 was biking.
• The most popular outdoor recreational activity for grades 9-12 was fishing. • Interest in a joining a club to learn about fishing or to learn about South Carolina
aquatic habitat was strongest among the youngest grade cohort (grades 1-4) with over three-quarters of youth in grades 1-4 interested in joining an animal or outdoor club.

74 Responsive Management
Awareness of the South Carolina Department of Natural Resources and Its Fishing Programs
Overall
• 10% of South Carolina youth could correctly identify the SC DNR as the state agency that managed and conserved wildlife.
• 21% of youth were aware of SCDNR programs’ “Hooked on Fishing,” “Fishing Tackle Loaner Program,” or “South Carolina Reel Kids.”
• The top three factors rated as making SCDNR aquatic events or classes better were: 1) if youth could be at the event or class with their friends (95%), 2) if youth could win prizes at the event (93%) and 3) if youth could enjoy nature and the outdoors while at the event (91%).
Gender
• A significantly greater proportion of male youth (14%) compared to female youth (6%) correctly identified the SC DNR as the state agency responsible for managing and conserving fish and wildlife in South Carolina.
• Male youth were generally more supportive of activities that dealt with the physical act of catching fish. More male than female youth reported “catching a big fish,” “catching a lot of fish,” “keeping the fish they caught” and “being able to eat the fish they caught” would make the class or event better.
• More female youth reported ethical/moral activities would have made the event or class better including, “learning how to fish safely such as how to cast properly and that hooks are sharp” and “learning how to safely handle and release a fish.”
Grade
• Significantly more youth (17%) in grades 9-12 correctly identified the SC DNR as the agency responsible for managing and conserving wildlife in South Carolina than did any other grade cohort.
• Programs targeted toward the youngest anglers in grades 1-4 should be closely tied to the family whereas programs targeting higher grade-level youth in grades 9-12 should focus on including more socialization opportunities.
• Youth in grades 1-4 liked to keep the fish they caught more than any other grade cohort.
• Youth in grades 1-4 viewed receiving some token or certificate as a positive component to a fishing event or class.
• A significantly greater proportion of children in the lower grade levels, grades 1-8, indicated that learning how to identify fish and learning facts about fish would have made the event better.
A Marketing Plan for the SC DNR Freshwater Fisheries Section 75
• Middle grade-level youth appeared to have advanced in their participation in and thinking of fishing to areas of skill development.
• The combination of fishing and socializing is more important to higher grade-level youth.
• Older youth were much more concerned than lower grade-level youth with the act of fishing and of fishing to “relax and get away from it all while fishing.”
Aquatic Information and Computers
Overall
• Nearly 80% of youth used the Internet. • A sizeable percentage of youth who used the Internet accessed the Internet to find
information on aquatic animals (48%), aquatic habitats (33%), or information about fishing (18%).
Fishing and Aquatic Resource Information within Schools
Overall
• More youth had seen or heard information that helped them learn more about fishing or increased their interest in going fishing outside of school (45%) than in school (22%).
• 53% of youth were in a school class, within the last twelve months that did something to help them learn about the oceans and the animals and plants that live in the ocean. Forty-six percent of youth were in a school class, within the last twelve months, that did something to help them learn about South Carolina’s rivers, ponds, lakes or streams and the animals and plants that live in South Carolina’s aquatic habitats.
• A majority of youth reported they would like to learn even more in school about South Carolina’s rivers, ponds, lakes or streams and the animals and plants that live in South Carolina’s aquatic habitats (80%) as well as learn more about fishing in school (68%).
Gender
• A significantly greater proportion of male youth (51% relative to 38% of females) indicated that they had heard information outside of school that helped them learn more about fishing and/or that increased their interest in going fishing.
• More male youth had seen or heard information in school about fish species, the sport of fishing, and fishing skills than female youth in school.
• A significantly greater proportion of male youth (23% relative to 13% of females) indicated that they heard information in school through their teacher through informal stories, etc.
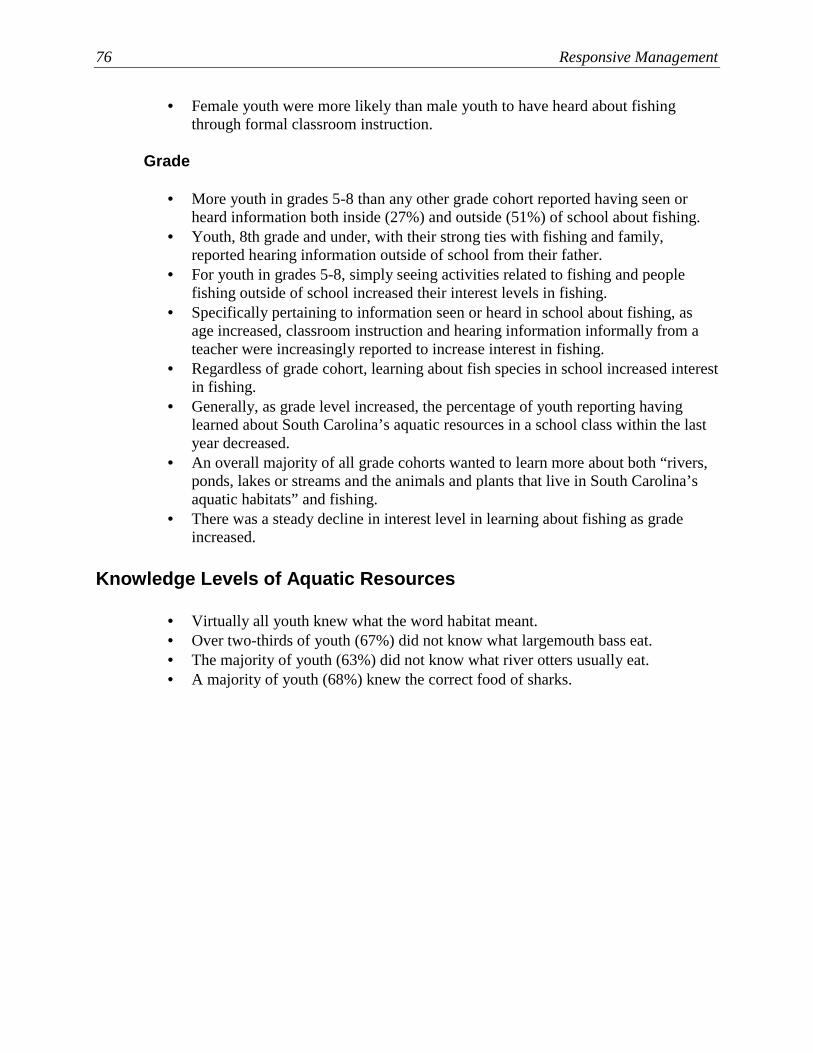
76 Responsive Management
• Female youth were more likely than male youth to have heard about fishing through formal classroom instruction.
Grade
• More youth in grades 5-8 than any other grade cohort reported having seen or heard information both inside (27%) and outside (51%) of school about fishing.
• Youth, 8th grade and under, with their strong ties with fishing and family, reported hearing information outside of school from their father.
• For youth in grades 5-8, simply seeing activities related to fishing and people fishing outside of school increased their interest levels in fishing.
• Specifically pertaining to information seen or heard in school about fishing, as age increased, classroom instruction and hearing information informally from a teacher were increasingly reported to increase interest in fishing.
• Regardless of grade cohort, learning about fish species in school increased interest in fishing.
• Generally, as grade level increased, the percentage of youth reporting having learned about South Carolina’s aquatic resources in a school class within the last year decreased.
• An overall majority of all grade cohorts wanted to learn more about both “rivers, ponds, lakes or streams and the animals and plants that live in South Carolina’s aquatic habitats” and fishing.
• There was a steady decline in interest level in learning about fishing as grade increased.
Knowledge Levels of Aquatic Resources
• Virtually all youth knew what the word habitat meant. • Over two-thirds of youth (67%) did not know what largemouth bass eat. • The majority of youth (63%) did not know what river otters usually eat. • A majority of youth (68%) knew the correct food of sharks.
A Marketing Plan for the SC DNR Freshwater Fisheries Section 77
Fishing and Developmental Stages in Youth
The study of South Carolina youth supports the findings by Kellert and others on how developmental stages in children affect their views on nature and wildlife. In the South Carolina study, younger youth enjoyed fishing for the act of catching a fish, while older youth enjoyed fishing as a means to relax and be with friends (Responsive Management, 2001). Studies by Kellert and Westervelt found that younger children are much more egocentric in their perception of the outdoors, while older children are more moralistic, ecologistic and naturalistic (Kellert and Westervelt, 1983). Although Responsive Management found that the interest in increasing factual knowledge about fishing increased as age increased, children in the younger age cohorts still expressed a high level of interest in learning facts about fishing, which differs from Kellert’s findings. However, this may be due to a number of things, including a youth population that is more informed about wildlife and natural resources or by an increased use of the Internet by children of all ages, causing children to be exposed to a wider variety of topics that they otherwise might be through direct experience.
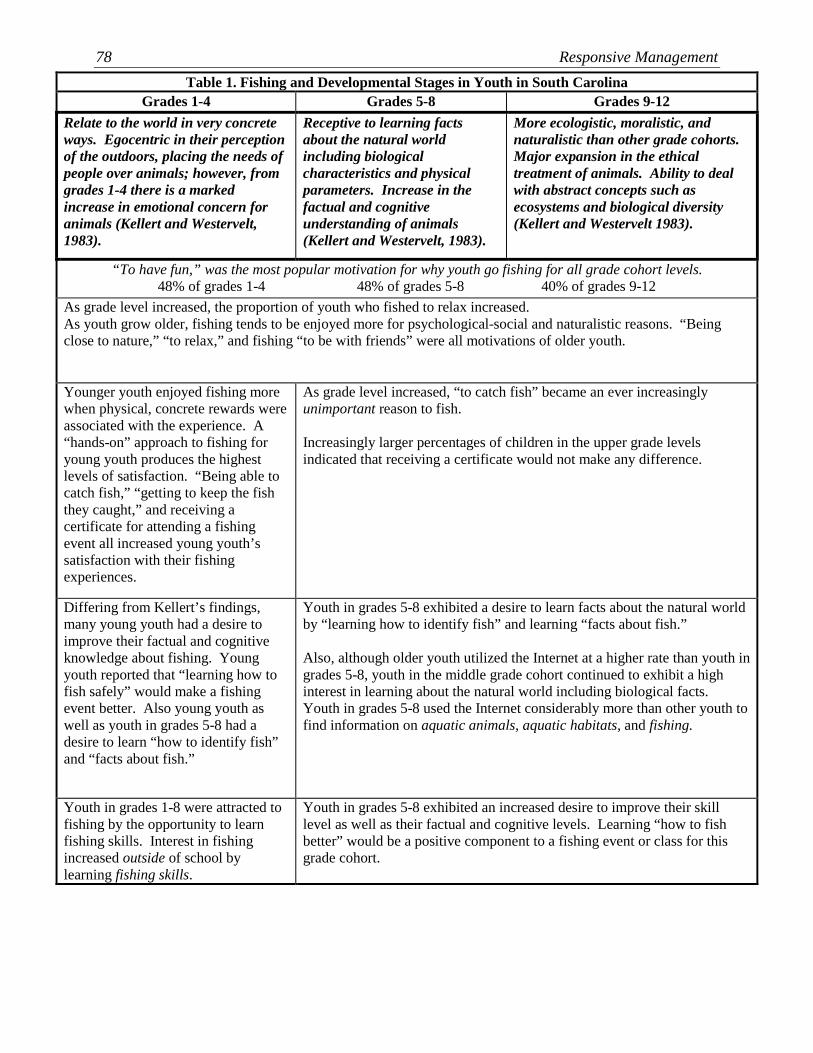
78 Responsive Management
Table 1. Fishing and Developmental Stages in Youth in South Carolina Grades 1-4 Grades 5-8 Grades 9-12
Relate to the world in very concrete ways. Egocentric in their perception of the outdoors, placing the needs of people over animals; however, from grades 1-4 there is a marked increase in emotional concern for animals (Kellert and Westervelt, 1983).
Receptive to learning facts about the natural world including biological characteristics and physical parameters. Increase in the factual and cognitive understanding of animals (Kellert and Westervelt, 1983).
More ecologistic, moralistic, and naturalistic than other grade cohorts. Major expansion in the ethical treatment of animals. Ability to deal with abstract concepts such as ecosystems and biological diversity (Kellert and Westervelt 1983).
“To have fun,” was the most popular motivation for why youth go fishing for all grade cohort levels. 48% of grades 1-4 48% of grades 5-8 40% of grades 9-12
As grade level increased, the proportion of youth who fished to relax increased. As youth grow older, fishing tends to be enjoyed more for psychological-social and naturalistic reasons. “Being close to nature,” “to relax,” and fishing “to be with friends” were all motivations of older youth.
Younger youth enjoyed fishing more when physical, concrete rewards were associated with the experience. A “hands-on” approach to fishing for young youth produces the highest levels of satisfaction. “Being able to catch fish,” “getting to keep the fish they caught,” and receiving a certificate for attending a fishing event all increased young youth’s satisfaction with their fishing experiences.
As grade level increased, “to catch fish” became an ever increasingly unimportant reason to fish. Increasingly larger percentages of children in the upper grade levels indicated that receiving a certificate would not make any difference.
Differing from Kellert’s findings, many young youth had a desire to improve their factual and cognitive knowledge about fishing. Young youth reported that “learning how to fish safely” would make a fishing event better. Also young youth as well as youth in grades 5-8 had a desire to learn “how to identify fish” and “facts about fish.”
Youth in grades 5-8 exhibited a desire to learn facts about the natural world by “learning how to identify fish” and learning “facts about fish.” Also, although older youth utilized the Internet at a higher rate than youth in grades 5-8, youth in the middle grade cohort continued to exhibit a high interest in learning about the natural world including biological facts. Youth in grades 5-8 used the Internet considerably more than other youth to find information on aquatic animals, aquatic habitats, and fishing.
Youth in grades 1-8 were attracted to fishing by the opportunity to learn fishing skills. Interest in fishing increased outside of school by learning fishing skills.
Youth in grades 5-8 exhibited an increased desire to improve their skill level as well as their factual and cognitive levels. Learning “how to fish better” would be a positive component to a fishing event or class for this grade cohort.
A Marketing Plan for the SC DNR Freshwater Fisheries Section 79
CHAPTER 9: MAJOR FINDINGS, IMPLICATIONS AND RECOMMENDATIONS Overall Direction for the Freshwater Fisheries Section
• The Freshwater Fisheries Section has been very successful in meeting its core historical mission of providing recreational fishing opportunities for South Carolina residents.
South Carolina anglers are very satisfied with the efforts of the Section, and it is clear
that where the Section has focused its efforts and expended resources, striking results have been achieved. For example, the 1998 study conducted by Responsive Management showed that a large majority of active fishing license holders were satisfied (85%) with the performance of the Freshwater Fisheries Section in protecting, conserving, and enhancing the state’s fisheries resources while providing recreational fishing opportunities (Responsive Management, 1998). Ninety-percent of striped bass anglers were very or somewhat satisfied with the SC DNR’s management of striped bass on Lake Murray (Responsive Management, 2000). In addition, a majority (52%) of South Carolina residents said that the SC DNR does an excellent or good job of managing the state’s freshwater fisheries and aquatic resources, with 10% saying excellent and 42% saying good (Responsive Management, 2002). Only 1% rated the SC DNR’s performance as poor in managing the state’s freshwater fisheries and aquatic resources.
All of these studies on South Carolina residents clearly showed that the closer the constituents were to the SC DNR, the higher they rated the Section’s performance. For example, in addition to high ratings by South Carolina anglers, the tables on the following page show that, “fished in freshwater” and “fished in saltwater” – two of the target markets (freshwater and saltwater anglers) of the SC DNR – were among the characteristics associated with the typical South Carolina resident who is most likely to rate the Section as doing an excellent job.
• The Section’s achievements in meeting its core mission of providing freshwater
fishing opportunities is also demonstrated in the research that illustrates the various markets that rate the Section’s performance as excellent.
It is extremely important to note that when all of the relevant variables relating to
demographics, geographic location, and participation are taken into account regarding the overall performance of the SC DNR, “male” and “fished in freshwater” had the strongest positive correlations with high ratings of the agency (Responsive Management, 2002). As seen in the table on the following page, other characteristics that are associated with those who rated the SC DNR’s performance at managing the state’s freshwater fisheries and aquatic resources as excellent or good are had a job in construction/development, had participated in motorized boating and/or watching wildlife near water, and identified themselves as white (Responsive Management, 2002). It is clear that core constituents of the SC DNR are very satisfied with the agency’s performance.
80 Responsive Management
• While the Freshwater Fisheries Sections’ core stakeholder groups feel the Section is doing an excellent job, it is clear that those who have not directly benefited from the Section’s focus on recreational fishing opportunities are less likely to have been served and are thus less likely to feel that the Section is doing an excellent job. The research shows that the stakeholder groups that have directly benefited from the
Freshwater Fisheries Section’s mission of providing recreational fishing opportunities for South Carolina residents also feel that the SC DNR is doing an excellent job managing the state’s freshwater fisheries and aquatic resources. As the following table illustrates, females, homemakers, African-Americans or other races besides white, and residents with lower education levels are less likely to rate the Section as doing an excellent job (Responsive Management, 2002). This demographic makeup represents a new constituency base that the Fisheries Section could reach out to and target to promote fishing opportunities and greater awareness of South Carolina’s aquatic resources.
• The Section should consider expanding its programmatic emphasis and outreach
efforts to women and African-Americans in South Carolina.
While much emphasis has been placed on the major population increases in the Hispanic and other minority populations in the U.S., African-Americans continue to represent an important underrepresented market for the Fisheries Section. While less than 2% of the South Carolina population is Hispanic, 30% of the South Carolina population is African-American. The participation and attitude research indicates that African-Americans are currently a group that is not being fully served by the Section, as shown in the table below. African-Americans are among the characteristics associated with not rating the SC DNR’s performance as excellent or good. From sheer population numbers, African-Americans are a considerably larger market than Hispanics and other minority groups. The Section should recognize this with programs targeted to the African-American community.
In addition, women are another important group that the Section could target. The 2002 study found that women were most likely not to say that the Section was doing an excellent or good job (as seen in the table on the following page) but that may be because they are not receiving any information about the Section or its accomplishments.
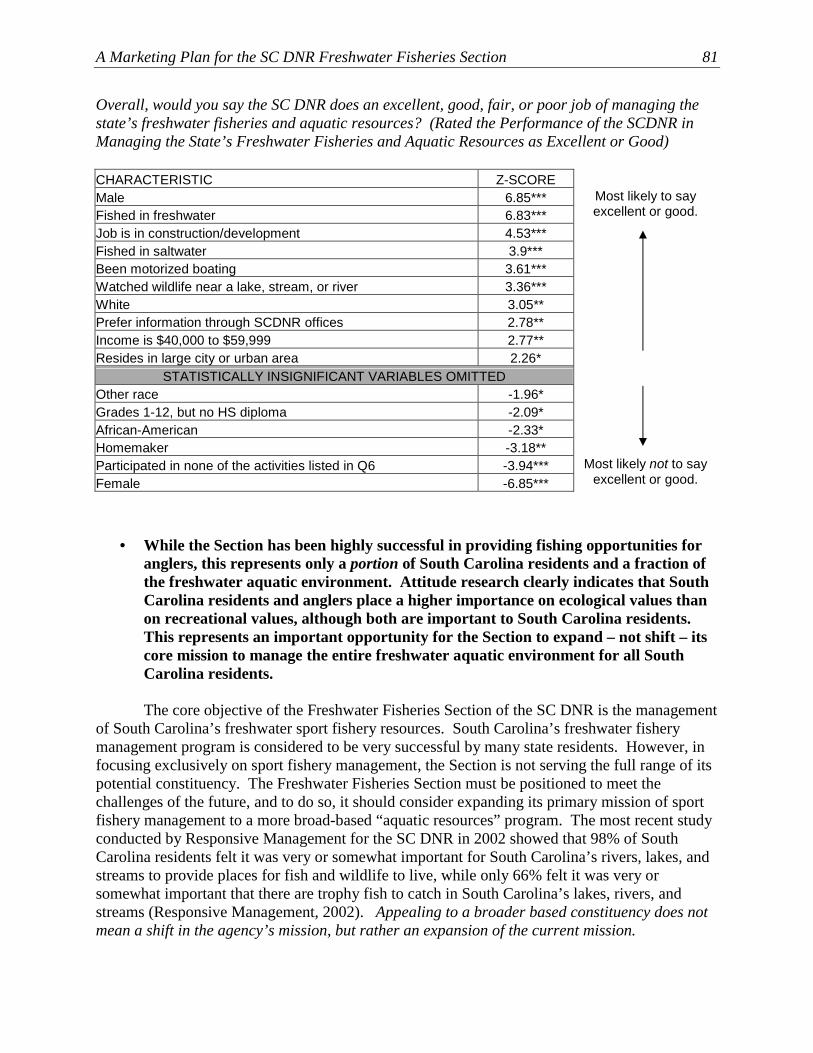
A Marketing Plan for the SC DNR Freshwater Fisheries Section 81
Overall, would you say the SC DNR does an excellent, good, fair, or poor job of managing the state’s freshwater fisheries and aquatic resources? (Rated the Performance of the SCDNR in Managing the State’s Freshwater Fisheries and Aquatic Resources as Excellent or Good) CHARACTERISTIC Z-SCORE Male 6.85*** Fished in freshwater 6.83***
Most likely to say excellent or good.
Job is in construction/development 4.53*** Fished in saltwater 3.9*** Been motorized boating 3.61*** Watched wildlife near a lake, stream, or river 3.36*** White 3.05** Prefer information through SCDNR offices 2.78** Income is $40,000 to $59,999 2.77** Resides in large city or urban area 2.26*
STATISTICALLY INSIGNIFICANT VARIABLES OMITTED Other race -1.96* Grades 1-12, but no HS diploma -2.09* African-American -2.33* Homemaker -3.18** Participated in none of the activities listed in Q6 -3.94*** Female -6.85***
Most likely not to say excellent or good.
• While the Section has been highly successful in providing fishing opportunities for anglers, this represents only a portion of South Carolina residents and a fraction of the freshwater aquatic environment. Attitude research clearly indicates that South Carolina residents and anglers place a higher importance on ecological values than on recreational values, although both are important to South Carolina residents. This represents an important opportunity for the Section to expand – not shift – its core mission to manage the entire freshwater aquatic environment for all South Carolina residents.
The core objective of the Freshwater Fisheries Section of the SC DNR is the management
of South Carolina’s freshwater sport fishery resources. South Carolina’s freshwater fishery management program is considered to be very successful by many state residents. However, in focusing exclusively on sport fishery management, the Section is not serving the full range of its potential constituency. The Freshwater Fisheries Section must be positioned to meet the challenges of the future, and to do so, it should consider expanding its primary mission of sport fishery management to a more broad-based “aquatic resources” program. The most recent study conducted by Responsive Management for the SC DNR in 2002 showed that 98% of South Carolina residents felt it was very or somewhat important for South Carolina’s rivers, lakes, and streams to provide places for fish and wildlife to live, while only 66% felt it was very or somewhat important that there are trophy fish to catch in South Carolina’s lakes, rivers, and streams (Responsive Management, 2002). Appealing to a broader based constituency does not mean a shift in the agency’s mission, but rather an expansion of the current mission.

82 Responsive Management
While this represents a major opportunity for the Section, it also presents two major challenges that, if not confronted directly, will harm the excellent track record and public image of the Section. The first challenge is to expand the historic mission of the Section without alienating the State’s freshwater anglers. The State’s anglers must remain the core stakeholder group of the Section and be informed that the expansion in mission is just that – an expansion – and not a shift. Without angler support, an expansion will fail and harm the excellent reputation of the Section among its constituents. The second challenge is obtaining financial resources for this expansion. An expansion of the Section’s mission should not come at the expense of the State’s freshwater anglers. If the Section is to expand its historical mission, financial resources should be secured from sources other than the South Carolina freshwater fishing license holder. If the section begins to provide ecological and educational benefits for all South Carolina residents, all South Carolina residents should be contributing financially toward these efforts. The Section should take a long-term view toward obtaining additional non-traditional funds. While the economic situation in 2003 does not lend itself toward obtaining additional revenue, the South Carolina and U. S. economy will rebound eventually (if historical trends are any indication of future trends) and, thus, the Section should begin laying the groundwork for obtaining additional revenue for this mission expansion.
• The Fisheries Section should consider expanding the recreational opportunities it provides to South Carolina residents to include opportunities for wildlife viewing near aquatic resources.
Wildlife watching near lakes, streams and rivers is a very popular activity for which the
Section could manage. More than half (56%) of South Carolina residents have participated in this activity and it represents a major new constituency for the Section (Responsive Management, 2002). Addressing the needs of this constituency supports the idea of an expansion, rather than a need for a shift in the Section’s core mission, because many of the residents who participate in fishing are also likely to participate in other outdoor activities such as wildlife watching near lakes, streams and rivers. The 2002 study of South Carolina residents found that for each outdoor activity (including motorized boating, fishing in freshwater, fishing in saltwater, canoeing/kayaking, sailing and wildlife watching near lakes, streams and rivers), there was a positive correlation with participation in all other aquatic activities listed in the survey; in other words, those who participated in any activity were likely to have participated in other activities (Responsive Management, 2002). Therefore, the Section can expand its recreational opportunities to include aquatic wildlife viewing without losing site of its historical mission of providing recreational fishing opportunities.
It is important to recognize that wildlife viewing is more than recreation. By developing wildlife viewing programs, the Section will not only be providing information on a topic, but will also be fostering sound aquatic resources education. In fact, wildlife viewing is one of the most powerful environmental educational tools available. In a national study on American’s attitudes toward wildlife, Dr. Stephen Kellert of Yale University found that active birders were the most knowledgeable group of Americans on natural resource issues compared to any other sociodemographic or activity group studied. Not only does participation in wildlife viewing have positive effect on adult attitudes toward fish, wildlife and the environment, but also it is an extremely effective tool for teaching children and adults about natural resources.

A Marketing Plan for the SC DNR Freshwater Fisheries Section 83
• Currently the South Carolina State Legislature makes all decisions regarding fisheries and aquatic resources, including setting fishing regulations and license fees. While a majority of South Carolina residents supported giving the SC DNR the ability to set fishing regulations and license fees, freshwater anglers were more likely to oppose giving the SC DNR the ability to set license fees. Therefore, any attempts to gain control over these activities should most likely be taken one at a time.
The data from the 2002 study indicate that efforts at gaining the ability to set fishing
regulations will be easier than gaining the ability to set fishing license fees. A majority (69%) of South Carolina residents supported giving the SC DNR the ability to set fishing regulations in lieu of having the South Carolina Legislature do so, and a majority (64%) also supported giving the SC DNR the ability to set fishing license fees (Responsive Management, 2002). However, freshwater anglers were statistically more likely to oppose giving the SC DNR the ability to set fishing license fees (please see the table on the following page). The possible reason for this is that some freshwater anglers see the SC DNR’s ability to set fishing license fees as “the fox guarding the hen house.” Thus, any attempts to garner this authority should be separated. The SC DNR should begin its efforts with gaining the ability to set fishing regulations. Once this is secured, the SC DNR should work closely with the state’s freshwater anglers to increase support among anglers over its ability to fairly set fishing license fees. If the two are taken together before the Legislature, there is a possibility that both measures would fail due to freshwater anglers’ resistance to the SC DNR’s setting fishing license fees. Would you support or oppose giving the South Carolina DNR the ability to set fishing license fees? (Oppose Giving the SCDNR the Ability to Set Fishing License Fees) CHARACTERISTIC Z-SCORE Male 3.64*** Most likely to oppose. Fished in freshwater 3.64*** Prefer information through regulations handbook 3.1** Prefer information through license agent/sporting goods store 2.99** Job is in industry 2.8** College graduate 2.57* Fished in saltwater 2.56* 45-54 years old 2.25*
STATISTICALLY INSIGNIFICANT VARIABLES OMITTED 55-64 years old -1.97* Graduate or professional degree -2.18* Prefer information through direct mail -2.24* Female -3.64***
Most likely not to oppose.
84 Responsive Management
Information and Education
• The Section should increase information, education and outreach efforts overall and work toward securing alternative funding mechanisms to pay for these expanded duties.
Research shows that both anglers and non-anglers are not very familiar with the SC
DNR or the agency’s responsibilities. For example, the 2002 study showed that a large majority (80%) of South Carolina residents knew little or nothing at all about the SC DNR’s freshwater fisheries and aquatic resources programs, while 19% knew a great deal or moderate amount (with only 2% saying that they knew a great deal) (Responsive Management, 2002). In the 1998 study, over one-third (34%) of active fishing license holders said that they did not know the primary responsibilities of the Freshwater Fisheries Section (Responsive Management, 1998). In addition, as previously mentioned, only 10% of South Carolina residents rated the agency’s performance as “excellent” (Responsive Management, 2002). However, it is important to realize that compared to ratings of other fish and wildlife agencies and departments by their respective state residents, the SC DNR is rated comparatively well (please see the graph on the following page).
The Section should set a goal to increase public awareness of the SC DNR’s and Section’s programs. Enhanced information, education and outreach programs will be the key to increasing awareness of the SC DNR’s – and particularly the Section’s – programs. Well-developed information and education programs will lead to increased public support for the Section in addition to increasing awareness and knowledge levels about the resource. Increased knowledge levels will lead to a more informed and concerned citizenry, and help in fostering positive behaviors and action on behalf of the resource. Increased agency support can lead to 1) increased funding and 2) help in thwarting agency budget cuts. In an overall sense, the process is cyclical. A well-developed information and education program will lead to an informed and educated citizenry. An informed and educated citizenry will lead to 1) an increase in agency support (the survey results show that in general the closer a constituent group gets to the agency, the higher the performance rankings become) and 2) an increase in positive attitudes toward fish, wildlife and aquatic resources. Both of these lead to enhanced efforts for the resource itself. Increased agency support can lead to funding which leads to increased management and an informed citizenry leads to positive actions on behalf of the resource.
However, new funding sources will be necessary to help pay for these efforts. South Carolina residents will likely support these additional efforts, especially as the economy improves. Surveys conducted by Responsive Management for the SC DNR show that stakeholder groups are interested in education programs and in gaining access to information about the agency and aquatic resources. In the 1994 study of South Carolina residents’ attitudes toward a variety of natural resource issues, among 18 fish, wildlife, and natural resource programs presented to South Carolina residents, the top 4 programs rated by residents for increased funding were all related to education (Responsive Management, 1994). In the 2002 study, respondents rated the importance of 6 educational programs of the SC DNR, and for each program, a majority rated it as very important (Responsive Management, 2002).

A Marketing Plan for the SC DNR Freshwater Fisheries Section 85
Percent Rating Division, Department, or Commission as Excellent
5
6
8
8
8
10
10
13
13
15
23
0 20 40 60 80 100
Southern Div. MarineResources
Southern Game and FreshWater Fish Comm.
Mid-Atlantic Div. Fish andWildlife
Western Dept. Fish and Game
Mid-Atlantic Wildlife Div.
Mid-Atlantic Fish and BoatComm.
South Carolina DNR
Mid-Atlantic Game Comm.
Northeastern Dept. Fish andWildlife
Northeastern Fish and GameDept.
Southern Game and Fish Div.
Percent
86 Responsive Management
• While the Section should consider increasing the number of products made available in order to raise awareness levels about the agency and the state’s aquatic resources, information and education programs do not necessarily need to be highly subsidized.
The Section should develop products that people want, charge them for it, and let the
money go back to further enhancing the Section’s information and education efforts. The 2002 study showed that a majority (52%) of respondents favored direct mail as the best way for them to receive information on fishing and aquatic resources, followed by the Internet (16%), television (16%), and newspapers (12%) (Responsive Management, 2002). The 1998 survey showed that active fishing license holders received their fishing information from family and friends (33%), outdoors magazines (33%), newspapers (15%), the “Rules and Regulations” handbook (13%), other SC DNR publications and brochures (9%), television (8%), “SC Wildlife” magazine (7%), sporting goods stores/bait shops (7%), personal experience (7%) and other magazines (6%) (Responsive Management, 1998).
• The Section should focus on promotion and distribution of a few excellent products
and programs.
Evaluation and development of information, education and public outreach efforts for state fish and wildlife agencies and departments of natural resources nationwide by Responsive Management over the past decade has highlighted the importance of developing a few excellent information and education materials (publications, videos, etc.) and spending the necessary time and money distributing and promoting the materials, as opposed to developing numerous publications and videos and not spending the necessary time promoting and distributing them. The Section should focus on a few good programs and products and promote them.
• The preferred method of receiving information about fishing and aquatic resources among South Carolina residents is direct mail.
The research shows that a majority (52%) of South Carolina residents prefer to
receive information on fishing and aquatic resources by direct mail (Responsive Management, 2002). Analyses show that across all demographic characteristics/behaviors, direct mail was by far the preferred method (please see Appendix A). The Section should focus on this type of media when developing promotional products to educate and inform South Carolina residents about fishing and aquatic resources in their state.
• While it is clear that education programs are important to South Carolina residents, these programs also received lower ratings than other Section programs. This is not an indictment of the Section’s efforts but rather due to the fact that only a small percentage of residents are actually receiving any information about the SC DNR or the agency’s accomplishments.
Research shows that education programs are very important to the residents of South
Carolina. However, a large percentage of residents are not hearing any information about the SC DNR. The 2002 study showed that 80% of South Carolina residents had not heard any good
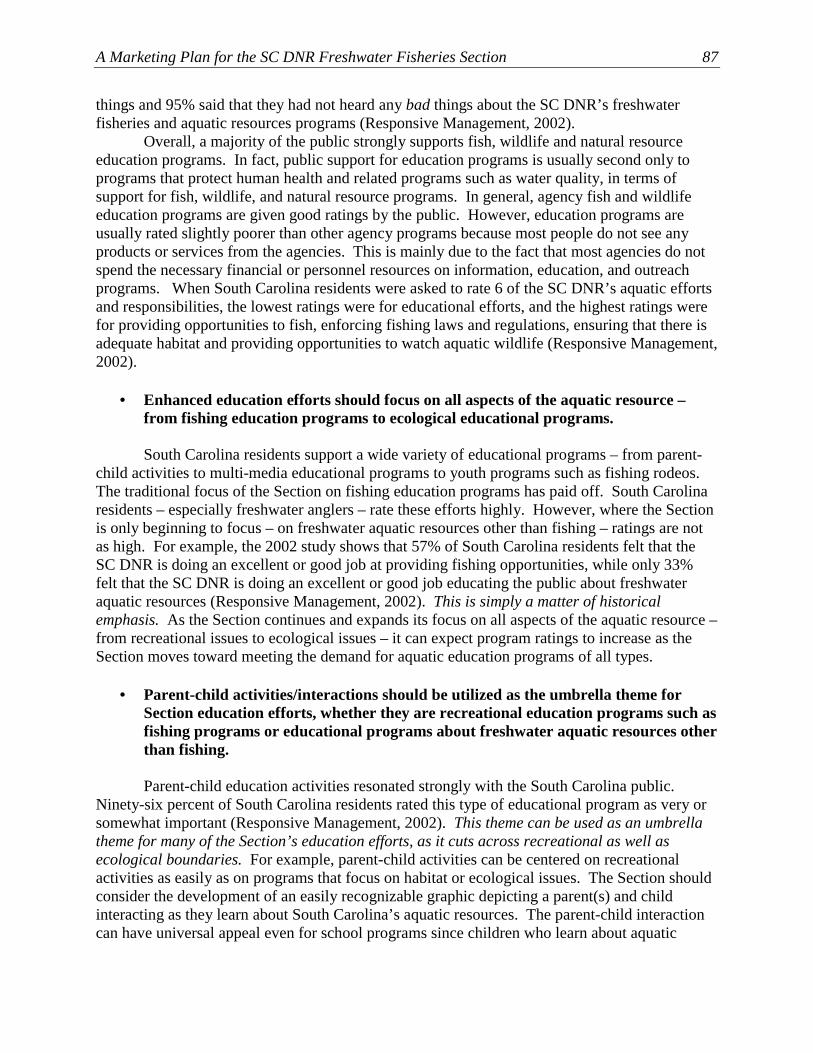
A Marketing Plan for the SC DNR Freshwater Fisheries Section 87
things and 95% said that they had not heard any bad things about the SC DNR’s freshwater fisheries and aquatic resources programs (Responsive Management, 2002).
Overall, a majority of the public strongly supports fish, wildlife and natural resource education programs. In fact, public support for education programs is usually second only to programs that protect human health and related programs such as water quality, in terms of support for fish, wildlife, and natural resource programs. In general, agency fish and wildlife education programs are given good ratings by the public. However, education programs are usually rated slightly poorer than other agency programs because most people do not see any products or services from the agencies. This is mainly due to the fact that most agencies do not spend the necessary financial or personnel resources on information, education, and outreach programs. When South Carolina residents were asked to rate 6 of the SC DNR’s aquatic efforts and responsibilities, the lowest ratings were for educational efforts, and the highest ratings were for providing opportunities to fish, enforcing fishing laws and regulations, ensuring that there is adequate habitat and providing opportunities to watch aquatic wildlife (Responsive Management, 2002).
• Enhanced education efforts should focus on all aspects of the aquatic resource –
from fishing education programs to ecological educational programs.
South Carolina residents support a wide variety of educational programs – from parent-child activities to multi-media educational programs to youth programs such as fishing rodeos. The traditional focus of the Section on fishing education programs has paid off. South Carolina residents – especially freshwater anglers – rate these efforts highly. However, where the Section is only beginning to focus – on freshwater aquatic resources other than fishing – ratings are not as high. For example, the 2002 study shows that 57% of South Carolina residents felt that the SC DNR is doing an excellent or good job at providing fishing opportunities, while only 33% felt that the SC DNR is doing an excellent or good job educating the public about freshwater aquatic resources (Responsive Management, 2002). This is simply a matter of historical emphasis. As the Section continues and expands its focus on all aspects of the aquatic resource – from recreational issues to ecological issues – it can expect program ratings to increase as the Section moves toward meeting the demand for aquatic education programs of all types.
• Parent-child activities/interactions should be utilized as the umbrella theme for
Section education efforts, whether they are recreational education programs such as fishing programs or educational programs about freshwater aquatic resources other than fishing.
Parent-child education activities resonated strongly with the South Carolina public.
Ninety-six percent of South Carolina residents rated this type of educational program as very or somewhat important (Responsive Management, 2002). This theme can be used as an umbrella theme for many of the Section’s education efforts, as it cuts across recreational as well as ecological boundaries. For example, parent-child activities can be centered on recreational activities as easily as on programs that focus on habitat or ecological issues. The Section should consider the development of an easily recognizable graphic depicting a parent(s) and child interacting as they learn about South Carolina’s aquatic resources. The parent-child interaction can have universal appeal even for school programs since children who learn about aquatic
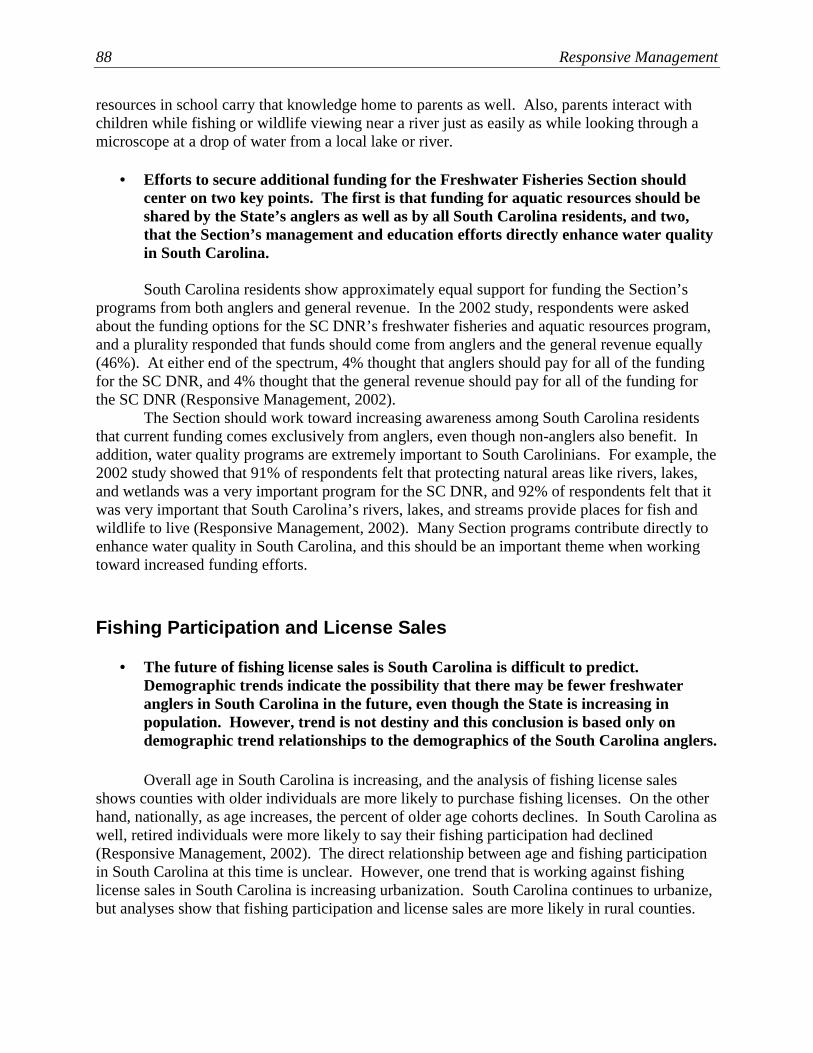
88 Responsive Management
resources in school carry that knowledge home to parents as well. Also, parents interact with children while fishing or wildlife viewing near a river just as easily as while looking through a microscope at a drop of water from a local lake or river.
• Efforts to secure additional funding for the Freshwater Fisheries Section should
center on two key points. The first is that funding for aquatic resources should be shared by the State’s anglers as well as by all South Carolina residents, and two, that the Section’s management and education efforts directly enhance water quality in South Carolina.
South Carolina residents show approximately equal support for funding the Section’s
programs from both anglers and general revenue. In the 2002 study, respondents were asked about the funding options for the SC DNR’s freshwater fisheries and aquatic resources program, and a plurality responded that funds should come from anglers and the general revenue equally (46%). At either end of the spectrum, 4% thought that anglers should pay for all of the funding for the SC DNR, and 4% thought that the general revenue should pay for all of the funding for the SC DNR (Responsive Management, 2002).
The Section should work toward increasing awareness among South Carolina residents that current funding comes exclusively from anglers, even though non-anglers also benefit. In addition, water quality programs are extremely important to South Carolinians. For example, the 2002 study showed that 91% of respondents felt that protecting natural areas like rivers, lakes, and wetlands was a very important program for the SC DNR, and 92% of respondents felt that it was very important that South Carolina’s rivers, lakes, and streams provide places for fish and wildlife to live (Responsive Management, 2002). Many Section programs contribute directly to enhance water quality in South Carolina, and this should be an important theme when working toward increased funding efforts. Fishing Participation and License Sales
• The future of fishing license sales is South Carolina is difficult to predict. Demographic trends indicate the possibility that there may be fewer freshwater anglers in South Carolina in the future, even though the State is increasing in population. However, trend is not destiny and this conclusion is based only on demographic trend relationships to the demographics of the South Carolina anglers.
Overall age in South Carolina is increasing, and the analysis of fishing license sales
shows counties with older individuals are more likely to purchase fishing licenses. On the other hand, nationally, as age increases, the percent of older age cohorts declines. In South Carolina as well, retired individuals were more likely to say their fishing participation had declined (Responsive Management, 2002). The direct relationship between age and fishing participation in South Carolina at this time is unclear. However, one trend that is working against fishing license sales in South Carolina is increasing urbanization. South Carolina continues to urbanize, but analyses show that fishing participation and license sales are more likely in rural counties.

A Marketing Plan for the SC DNR Freshwater Fisheries Section 89
• The Section should target its fishing license sale and promotional efforts in the counties where licenses currently have high sales as well as identify and target counties with similar demographic characteristics.
Analyses of fishing license sales and demographic characteristics in South Carolina show
that there are relationships between sales of different license types and demographics. For example, the Section should consider promoting the various license types as shown below. If a license type is not listed, there were no positive correlations between sales and demographics.
o Combination hunting and fishing licenses: target larger counties with fewer people and fewer houses per square mile, with proportionally more people under 18 years of age, proportionally less people 25 to 44 years of age, and proportionally more African-Americans.
o Resident fishing licenses: target counties with proportionally more people 45 to
64 years of age. o Saltwater fishing stamps: target counties with proportionally more land and water
area. o 14-day resident fishing licenses: target counties with a proportionally older
population: more people 45 to 64 years of age and proportionally more people 65 years old and older.
o Lakes and reservoir permits (cane pole): target counties with proportionally
fewer people 25 to 44 years old and traditionally less wealthy counties. o Resident junior sportsman’s licenses: target counties with a proportionally older
population: proportionally more people 45 to 64 years of age and proportionally more people 65 years old and older, a higher percentage of whites, and counties with more wealth during the 1960s and 1970s.
o Sportsman’s license: target counties with proportionally more white people and
counties that have more wealth during the 1960s and 1970s.
• The Fisheries Section should consider developing a fishing retention program for retired South Carolina residents.
Among those South Carolina anglers who said that their fishing participation had
declined over the past five years were retired South Carolina residents (Responsive Management, 2002). The Section should consider some retention programs for these retired citizens. Programs should not be developed, however, until further research is conducted on why retired South Carolina residents are more likely to have decreased their fishing activity. However, this is important as the overall population of South Carolina increases in the future and more South Carolina residents retire. It is commonly believed that retirement means more fishing activity,

90 Responsive Management
but this does not appear to be the case. The 2002 study showed that retired South Carolina residents were statistically more likely to say that they were not interested in going fishing in the next year (Responsive Management, 2002). Programs that target the real problems of why some retirees fish less often should be developed after research. Possible reasons why retired residents fish less often could be due to health, safety concerns, or no one to go with. However, this issue needs to be explored in greater depth.
• The Section should initiate a long-term marketing plan for selling fishing licenses over the Internet.
While the research indicates that a majority of South Carolina anglers will continue to
purchase their fishing license through traditional sources, almost a quarter of South Carolina anglers (23%) stated that they would be very likely to purchase their license on the Internet (Responsive Management, 2002). This is a sizable number of individuals, and selling licenses over the Internet represents three major opportunities for the Freshwater Fisheries Section. First, proceeds would go directly to the SC DNR and not to a third party. Second, an angler who purchases a fishing license over the Internet will become more familiar with the Section, not only increasing awareness of the Section (which is still needed), but also result in an increased awareness that fishing license fees are directed towards natural resource protection in South Carolina. Finally, selling fishing licenses over the Internet will allow the Section to develop a powerful database of South Carolina anglers that would be useful in numerous situations including retention and aquatic education efforts.
• The Section should consider raising the prices of fishing licenses.
Research from 2002 shows that most South Carolina residents who had purchased a fishing license in the past two years would be likely to still buy a license even if the price were increased. For example, 88% said that they would be very likely to purchase a license for $12, and 75% said that they would be very likely to purchase a license for $14. However, the Fisheries Section should keep in mind that although more revenue will be generated, some anglers will likely be lost in the process (12%). In 1985, when the price of the Annual Resident Fishing License was changed from $7.50 to $10.00, the increase resulted in a loss of 25,470 licensed anglers (12.4%) during the following year, and research from 2002 also supports this potential loss of licensed anglers.
If the SC DNR raises license fees, it should be aware that there is a point of diminishing returns – i.e., if the price is raised too high, so many anglers will drop out that total revenues will decrease. An example in the tabulation below from the 2002 survey is illustrative of this potential problem. $ 10 Cost $ 12 Cost $ 14 Cost Loss of anglers with price increase
NA 12 25
Sample of anglers 100 88 75 Revenue $1,000 $1,056 $1,050
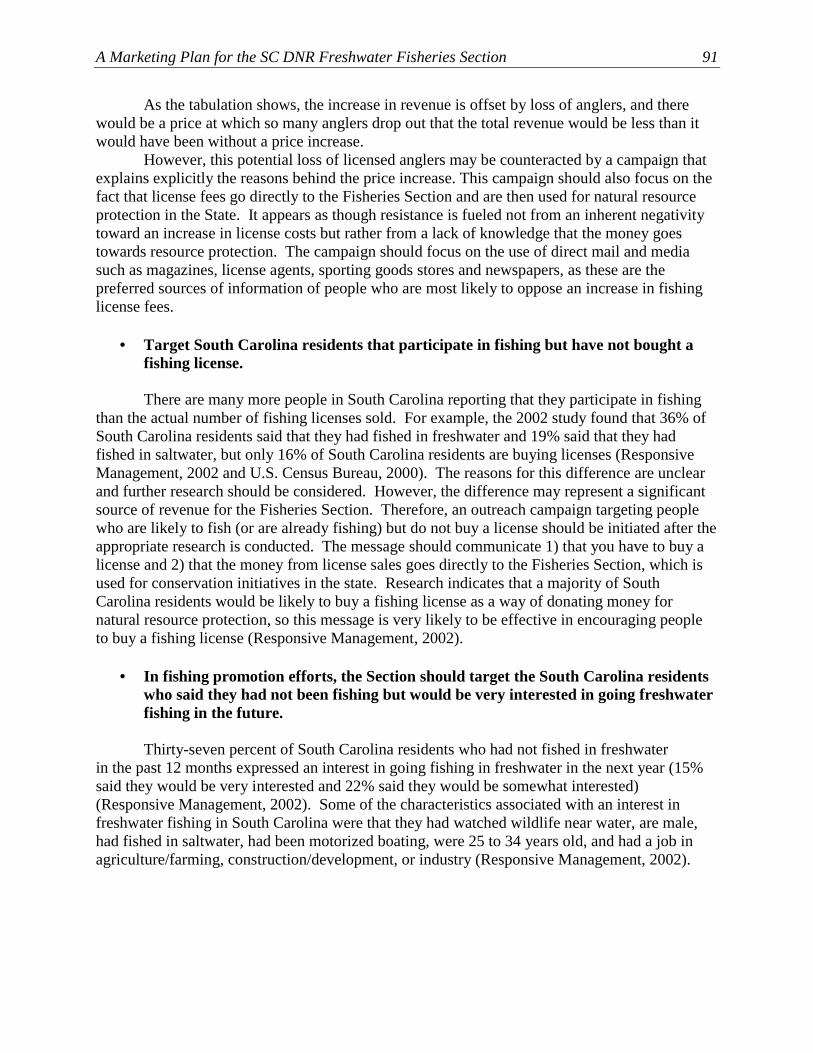
A Marketing Plan for the SC DNR Freshwater Fisheries Section 91
As the tabulation shows, the increase in revenue is offset by loss of anglers, and there would be a price at which so many anglers drop out that the total revenue would be less than it would have been without a price increase.
However, this potential loss of licensed anglers may be counteracted by a campaign that explains explicitly the reasons behind the price increase. This campaign should also focus on the fact that license fees go directly to the Fisheries Section and are then used for natural resource protection in the State. It appears as though resistance is fueled not from an inherent negativity toward an increase in license costs but rather from a lack of knowledge that the money goes towards resource protection. The campaign should focus on the use of direct mail and media such as magazines, license agents, sporting goods stores and newspapers, as these are the preferred sources of information of people who are most likely to oppose an increase in fishing license fees.
• Target South Carolina residents that participate in fishing but have not bought a
fishing license.
There are many more people in South Carolina reporting that they participate in fishing than the actual number of fishing licenses sold. For example, the 2002 study found that 36% of South Carolina residents said that they had fished in freshwater and 19% said that they had fished in saltwater, but only 16% of South Carolina residents are buying licenses (Responsive Management, 2002 and U.S. Census Bureau, 2000). The reasons for this difference are unclear and further research should be considered. However, the difference may represent a significant source of revenue for the Fisheries Section. Therefore, an outreach campaign targeting people who are likely to fish (or are already fishing) but do not buy a license should be initiated after the appropriate research is conducted. The message should communicate 1) that you have to buy a license and 2) that the money from license sales goes directly to the Fisheries Section, which is used for conservation initiatives in the state. Research indicates that a majority of South Carolina residents would be likely to buy a fishing license as a way of donating money for natural resource protection, so this message is very likely to be effective in encouraging people to buy a fishing license (Responsive Management, 2002).
• In fishing promotion efforts, the Section should target the South Carolina residents who said they had not been fishing but would be very interested in going freshwater fishing in the future.
Thirty-seven percent of South Carolina residents who had not fished in freshwater
in the past 12 months expressed an interest in going fishing in freshwater in the next year (15% said they would be very interested and 22% said they would be somewhat interested) (Responsive Management, 2002). Some of the characteristics associated with an interest in freshwater fishing in South Carolina were that they had watched wildlife near water, are male, had fished in saltwater, had been motorized boating, were 25 to 34 years old, and had a job in agriculture/farming, construction/development, or industry (Responsive Management, 2002).
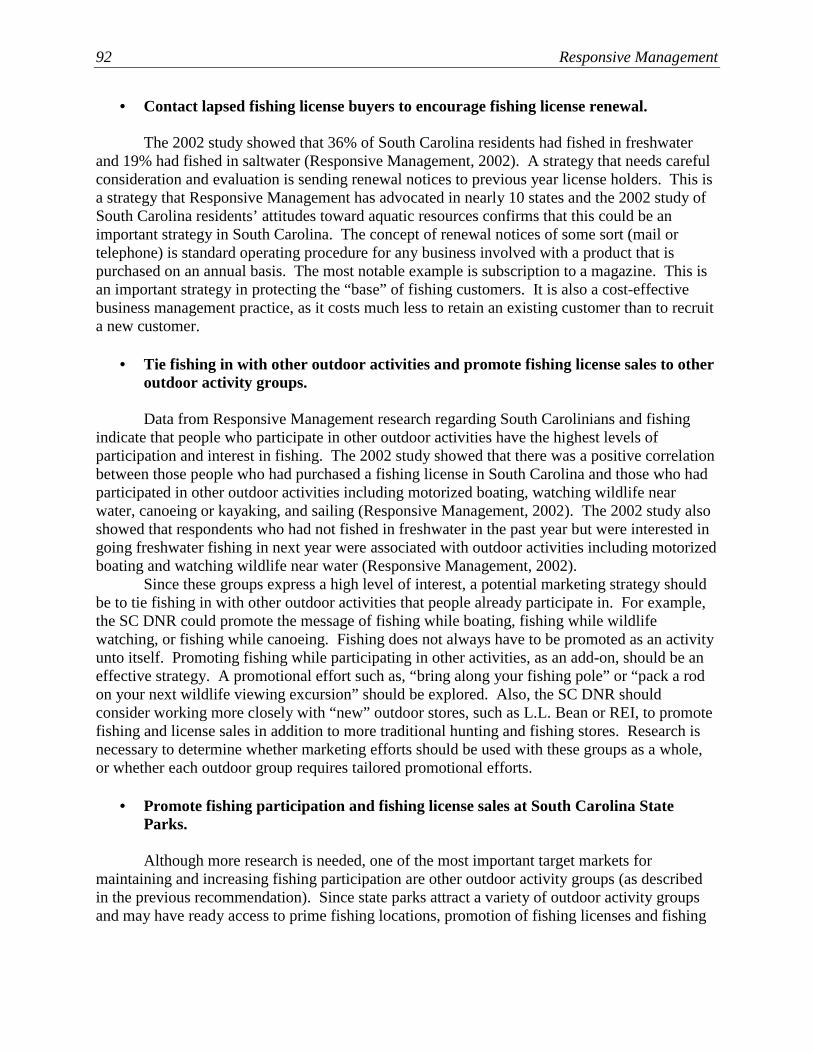
92 Responsive Management
• Contact lapsed fishing license buyers to encourage fishing license renewal.
The 2002 study showed that 36% of South Carolina residents had fished in freshwater and 19% had fished in saltwater (Responsive Management, 2002). A strategy that needs careful consideration and evaluation is sending renewal notices to previous year license holders. This is a strategy that Responsive Management has advocated in nearly 10 states and the 2002 study of South Carolina residents’ attitudes toward aquatic resources confirms that this could be an important strategy in South Carolina. The concept of renewal notices of some sort (mail or telephone) is standard operating procedure for any business involved with a product that is purchased on an annual basis. The most notable example is subscription to a magazine. This is an important strategy in protecting the “base” of fishing customers. It is also a cost-effective business management practice, as it costs much less to retain an existing customer than to recruit a new customer.
• Tie fishing in with other outdoor activities and promote fishing license sales to other
outdoor activity groups.
Data from Responsive Management research regarding South Carolinians and fishing indicate that people who participate in other outdoor activities have the highest levels of participation and interest in fishing. The 2002 study showed that there was a positive correlation between those people who had purchased a fishing license in South Carolina and those who had participated in other outdoor activities including motorized boating, watching wildlife near water, canoeing or kayaking, and sailing (Responsive Management, 2002). The 2002 study also showed that respondents who had not fished in freshwater in the past year but were interested in going freshwater fishing in next year were associated with outdoor activities including motorized boating and watching wildlife near water (Responsive Management, 2002).
Since these groups express a high level of interest, a potential marketing strategy should be to tie fishing in with other outdoor activities that people already participate in. For example, the SC DNR could promote the message of fishing while boating, fishing while wildlife watching, or fishing while canoeing. Fishing does not always have to be promoted as an activity unto itself. Promoting fishing while participating in other activities, as an add-on, should be an effective strategy. A promotional effort such as, “bring along your fishing pole” or “pack a rod on your next wildlife viewing excursion” should be explored. Also, the SC DNR should consider working more closely with “new” outdoor stores, such as L.L. Bean or REI, to promote fishing and license sales in addition to more traditional hunting and fishing stores. Research is necessary to determine whether marketing efforts should be used with these groups as a whole, or whether each outdoor group requires tailored promotional efforts.
• Promote fishing participation and fishing license sales at South Carolina State Parks.
Although more research is needed, one of the most important target markets for
maintaining and increasing fishing participation are other outdoor activity groups (as described in the previous recommendation). Since state parks attract a variety of outdoor activity groups and may have ready access to prime fishing locations, promotion of fishing licenses and fishing
A Marketing Plan for the SC DNR Freshwater Fisheries Section 93
participation at these venues is likely to be successful. This could be accomplished by providing fishing equipment for sale or loan and requiring the users to purchase a fishing license.
• Research shows that most fishing participation constraints are social rather than resource or service-related. Therefore, recruitment and retention efforts should focus on these types of constraints.
Research shows that constraints on fishing participation are social in nature. For example,
the 2002 study shows that of the South Carolina residents that said their freshwater fishing activity had declined over the past five years, the main reasons for the decline were “no time: work obligations (28%),” and “family obligations (18%)” (Responsive Management, 2002). The 1998 study showed that 50% of inactive fishing license holders indicated they did not fish due to lack of time (Responsive Management, 1998). In addition, the most common reason reported for both male (41%) and female (35%) youth for not fishing more often was “not enough time” (Responsive Management, 2001). Fishing promotion efforts should focus on these types of constraints. For example, the Section could play up fishing as a convenient activity, as a way to enjoy time with family, or as a way to escape from the pressures of work.
• Message: Promote the benefits of fishing and highlight family, relaxation, and naturalistic values.
Nearly all of the research on South Carolina anglers shows that the main reasons that
anglers fish and non-anglers would be interested in going fishing are for relaxation, to be with family and friends, and to be close to nature (Responsive Management, 1998 and 2001). In addition, the percentage of anglers fishing for these purposes are increasing, while the percentage of anglers fishing for the sport, fishing for large fish, and fishing for food are decreasing. Therefore, promotion of fishing as a way to relax and be with family and friends should be the focus. This message can be promoted in many ways, such as through brochures or other publications. Fishing tournaments might be a fun activity for youth and adults, but advertisement should play up fishing as a way to relax, rather than a sport activity, or a way to catch “the big one.”
• Message: Tie fishing license benefits to conservation or promote fishing licenses as a
means to support the SC DNR’s efforts to protect and conserve our natural resources and aquatic environment.
Research indicates that a majority of South Carolina anglers and non-anglers would be
likely to buy a fishing license as a way of donating money for natural resource protection (Responsive Management, 2002). The 2002 survey found that among those South Carolina residents who indicated they would be very or somewhat likely to purchase a fishing license or stamp, 30% said that they would be very likely to purchase a fishing license, even if not used, with the proceeds going to improve water quality, and 28% said they would be very likely to purchase a fishing license, even if not used, as a way to support freshwater fisheries and aquatic resources conservation (Responsive Management, 2002).
Also, in addition to lack of time, another potentially important fishing constraint among South Carolina anglers is decreased satisfaction among active anglers due to pollution or litter

94 Responsive Management
(Responsive Management, 1998). If the public was aware that the money they spent on fishing licenses was used directly for conservation purposes, interest in buying a license might increase. This is especially true within groups that participate in other outdoor activities and already have a propensity towards natural resource protection. In addition, some conservation organizations might be interested in promoting fishing to their members as a way to support conservation measures.
• Become more involved with tourism by advertising fishing and fishing licenses in convention visitor’s bureaus, the hotel/motel industry, and the local chamber of commerce.
Promotion of fishing and fishing licenses at the tourist venues mentioned above would
likely reach a wide audience and would be a good way to target families that are traveling together. Advertisements at Tourism locations that are near fishing lakes and rivers, or near State Parks, would likely be seen by groups that participate in outdoor activities, and research shows that these groups of people already participate in fishing or are interested in fishing. Youth and Fishing/Aquatic Resources
• Active participation in fishing as an adult is directly related to active participation as a youth. Therefore, strategies aimed at increasing youth participation in fishing are essential. Research has suggested that there is a very low likelihood of fishing participation by an
adult if the person did not learn to fish by the age of 20 (Responsive Management, 1998c). Indeed, not only is active participation by an adult determined by early exposure to fishing, but the level of adult avidity is also determined by the level of exposure as a child.
• Marketing strategies should include ways to help children find time to fish,
particularly through school (if possible), as children most commonly reported that “not enough time” was an important reason that they had not fished more often. Although large percentages of South Carolina male youth and female youth said that they
wished they could fish more often, “not enough time” was the most popular reason children gave for not fishing more often (Responsive Management, 2001). When asked specifically what caused the time constraints that interfered with fishing, majorities of both boys and girls said “school.” Therefore, promoting fishing activity through existing social structures like school, church, or clubs may be an effective way of keeping children interested in fishing.
• School may be an underused entity in promoting fishing participation, especially
among girls and among older grade cohorts. It may be an effective strategy to encourage schools to include aquatic habitat in the curriculum in the upper grades. More youth had seen or heard information outside of school than in school that helped
them learn more about fishing or increased their interest in fishing. In addition, a majority of youth in Responsive Management’s South Carolina youth fishing survey said that they would

A Marketing Plan for the SC DNR Freshwater Fisheries Section 95
like to learn more in school about fishing and about South Carolina’s rivers, lakes, and streams and the animals that live there. Also, more male youth than female youth had heard information in school about fish species, the sport of fishing, and fishing skills. Finally, in general, as grade level increased, the percentage of youth reporting that they learned about South Carolina’s aquatic resources declined (Responsive Management, 2001). Students begin learning about science in school as early as kindergarten, so schools should be encouraged to include topics relating to aquatic resources in their science curricula. An activity as simple as a field trip to a local pond to observe the aquatic flora and fauna could be used to teach youth about their state’s aquatic resources as well as some basic fishing skills.
• Marketing strategies must include the familial context of fishing initiation,
particularly father and children, particularly for younger youth. Youth fishing occurs almost entirely within the familial context, and a father or other
male family member most commonly initiates children into fishing—67% of youth in Responsive Management’s South Carolina youth fishing survey were first taught to fish by their father. The SC DNR may consider a type of “family license” as a way to encourage parents to take their children fishing.
• Continue to enhance the strong father-child partnership in fishing, but an
important market segment that should not be ignored is the mother-daughter segment. After the father, the second most common fishing companion for female youth was their
mother in the study of fishing participation of South Carolina youth (Responsive Management, 2001). The SC DNR may consider a type of “mother-daughter license” as a way to encourage mothers to take their daughters fishing.
• Encouragement of fishing in a familial context may increase parents’ fishing
activity, as well as the children’s’ fishing activity. Responsive Management’s “The Future of Fishing” (1999) found that the top situation
that would motivate people to go fishing was having their child ask them to take him or her fishing: 88% of active anglers and 65% of non-anglers said that being asked to go fishing by a child would encourage them to go fishing or go fishing more often. To further promote fishing among parents and children, the promotion should emphasize that fishing is a way for parents to spend time with their children; the promotion should not emphasize the fishing itself.
• Marketing strategies should differ for different youth age groups. For youth in
grades 1-4, marketing strategies should emphasize having fun and catching fish rather than naturalistic reasons. Indeed, youth at this age respond well to fishing events that provide a token or certificate of completion. More South Carolina children in this age cohort reported that they fished “to catch fish”
than did children in any other age cohort (Responsive Management, 2001). Also, youth in this age cohort viewed receiving some token or certificate as a positive component of a fishing event

96 Responsive Management
or class. It is also important for South Carolina children in this age cohort to experience the feel of catching and handling fish, so fishing events may need to include provisions that ensure that they catch and/or handle a fish, thereby satisfying their desire for hands-on learning.
• A club or other organization context may be effective for promoting fishing
participation among youth in grades 1-4. Interest in joining a club to learn about fishing or aquatic habitat was strongest among the
youngest grade cohort, with over three-quarters of South Carolina youth in grades 1-4 interested in joining an animal or outdoor club (Responsive Management, 2001). Therefore, the Fisheries Section could encourage schools to take a more proactive approach to developing clubs such as science clubs or outdoor clubs, where learning about fishing and aquatic resources could be part of the activities.
• For higher grades (9-12), an effective marketing strategy should include naturalistic
elements, such as identifying fish and learning about aquatic habitat, because older South Carolina youth respond to this. In particular, this age group may respond well to catch and release information as well as that fishing participation vis-à-vis license fees supports aquatic conservation. In addition, this age cohort responds well to fishing skill development. Finally, youth in this age group commonly fish with friends and indicate that they would like to fish with friends. In general, the primary reasons to fish among South Carolina youth in grades 9-12have a
naturalistic connotation of “being close to nature” and “to relax” (Responsive Management, 2001). Also, as age increased, “to catch fish” became an increasingly unimportant reason for fishing (Responsive Management, 2001). Children by this age and slightly younger (grades 5-8) have developed a sense of the ethical treatment of animals and may respond well to catch and release programs. In addition, children at this age show much interest in developing fishing skills.
In looking at fishing companions of various age cohorts, the higher the age, the greater the propensity to fish with friends. Indeed, youth in grades 9-12 usually fished with friends more than did any other grade cohort, and they respond well to socialization opportunities.
• A critical time to target children to increase their fishing participation is just prior
to and in grades 9-12, as Responsive Management research suggests that those grades are the time that children either become active anglers or drop out of the sport. Children who are most likely to remain with the sport of fishing become active anglers by
grades 9-12. This is also the time that children increase the average number of days per year that they fish: although anglers in grades 1-4 fished an average of 8 days per year and anglers in grades 5-8 fished an average of 12 days per year, those anglers in grades 9-12 fished an average of 15 days per year (Responsive Management, 2001). Therefore, an effective marketing strategy for children in grades 9-12 is to entice them to stay active in angling, as they likely have already been initiated into fishing by this age, and the main thrust at this point should be to attempt to dissuade them from deserting the sport. In short, it is important to increase fishing avidity at this

A Marketing Plan for the SC DNR Freshwater Fisheries Section 97
age. The main thrust of fishing promotion programs at the high school level must be to entice participants to stay active in angling. The teenage years are a major period of desertion from recreational fishing. Many teens report becoming too busy with competing activities to continue fishing. Teens enjoy social activities more at this time, and so as a way to bring teenagers together within the sport of fishing, more competitive events might be planned. Additionally, promoting fishing activities through existing social structures like school, church clubs or other groups should be an effective way of keeping teens interested in fishing. This is vital because fishing involvement during the teen years is one of the strongest predictors of long-term fishing involvement. The high school years also show youth have developed an increased sense of ethics and therefore may be more receptive to learning about catch and release programs.
• Marketing strategies for female youth should concentrate on moving girls from
liking fishing “a little” to liking it “a lot.” In addition, encouraging more girls to try fishing may be an effective marketing strategy, as the percentage of girls who have fished lags behind the percentage of boys who have fished. The majority of South Carolina male youth liked fishing “a lot,’ whereas the majority of
female youth liked fishing “a little” (Responsive Management, 2001). While this means that boys may be a more natural market for fishing than are girls, the latter market should not be ignored—after all, it represents half the youth market—and marketing strategies must ensure that girls have enjoyable fishing experiences early on to move their attitudes from liking fishing “a little” to liking it “a lot.” In addition, increasing fishing initiation among young girls may lead to increased participation in fishing among older girls and eventually higher percentages of South Carolina adult women.

98 Responsive Management
LITERATURE Responsive Management. (2002). South Carolina Residents’ Attitudes and Behaviors Toward
Aquatic Resources. Prepared for the South Carolina Department of Natural Resources. Harrisonburg, VA: Responsive Management.
_____. (2001). South Carolina Youth Aquatic Survey. Prepared for the South Carolina
Department of Natural Resources. Harrisonburg, VA: Responsive Management. _____. (2000). Striped Bass Anglers’ Attitudes Toward Fisheries Management on Lake Murray.
Prepared for the South Carolina Department of Natural Resources. Harrisonburg, VA: Responsive Management
_____. (1999). The future of fishing, phase V: final report and recommendations. Report for the
International Association of Fish and Wildlife Agencies Under a Grant from the U. S. Fish and Wildlife Service, Division of Federal Aid Sport Fish Restoration Program. (Grant # 1448-98210-98-G048). Harrisonburg, VA: Responsive Management.
_____. (1998). South Carolina Fishing License Holders’ Opinions and Attitudes Toward
Fisheries Management and the South Carolina Department of Natural Resources. Prepared for the South Carolina Department of Natural Resources. Harrisonburg, VA: Responsive Management.
_____. (1998b). South Carolina Fishing License Holders’ Opinions and Attitudes Toward
Fisheries Management and the South Carolina Department of Natural Resources: Results of Largemouth and Smallmouth Bass Anglers. Prepared for the South Carolina Department of Natural Resources. Harrisonburg, VA: Responsive Management.
_____. (1998c). Wildlife and the American Mind. Public Opinions on and Attitudes toward
Fish and Wildlife Management. Federal Aid in Sport Fish and Wildlife Restoration Grant Agreement 14-48-0009-96-1230.
_____. (1994). South Carolina Residents’ Attitudes and Opinions Toward Wildlife and Marine
Resources. Prepared for the South Carolina Wildlife and Marine Resources Department. Harrisonburg, VA: Responsive Management.
U.S. Department of Interior, Fish and Wildlife Service and U.S. Department of Commerce,
Bureau of the Census. (2001). National survey of fishing, hunting and wildlife-associated recreation. Washington, DC: U.S. Dep. of Interior, Fish and Wildlife Service.
_____. (1996). National survey of fishing, hunting, and wildlife-associated recreation.
Washington, DC: U.S. Dep. of Interior, Fish and Wildlife Service. _____. (1991). National survey of fishing, hunting, and wildlife-associated recreation.
Washington, DC: U.S. Dep. of Interior, Fish and Wildlife Service.
A Marketing Plan for the SC DNR Freshwater Fisheries Section 99
_____. (1985). National survey of fishing, hunting, and wildlife-associated recreation.
Washington, DC: U.S. Dep. of Interior, Fish and Wildlife Service. _____. (1981). National survey of fishing, hunting, and wildlife-associated recreation.
Washington, DC: U.S. Dep. of Interior, Fish and Wildlife Service. Kellert, S. and M. Westervelt. (1983). Children’s attitudes, knowledge and behaviors toward
animals. Phase V of U.S. Fish and Wildlife Service Study, U.S. Government Printing Office. 024-010-006-412, Washington, D.C. 202pp.
Krathwohl, D. R. (1993). Research Methods in Education and the Social Sciences. New York:
Longman. Pedhazur, E. J. (1982). Multiple Regression in Behavioral Research: Explanation and
Prediction. (2nd ed.) Orlando, Florida: Harcourt Brace Jovanovich. SPSS, I. (2002). SPSS 11.5.0 (Version 11.5.0) [Computer software]. Chicago, IL: SPSS,Inc. U.S.Census Bureau (2002). U.S. Census Bureau. http://www.census.gov/ [On-line]. Available:
http://www.census.gov/
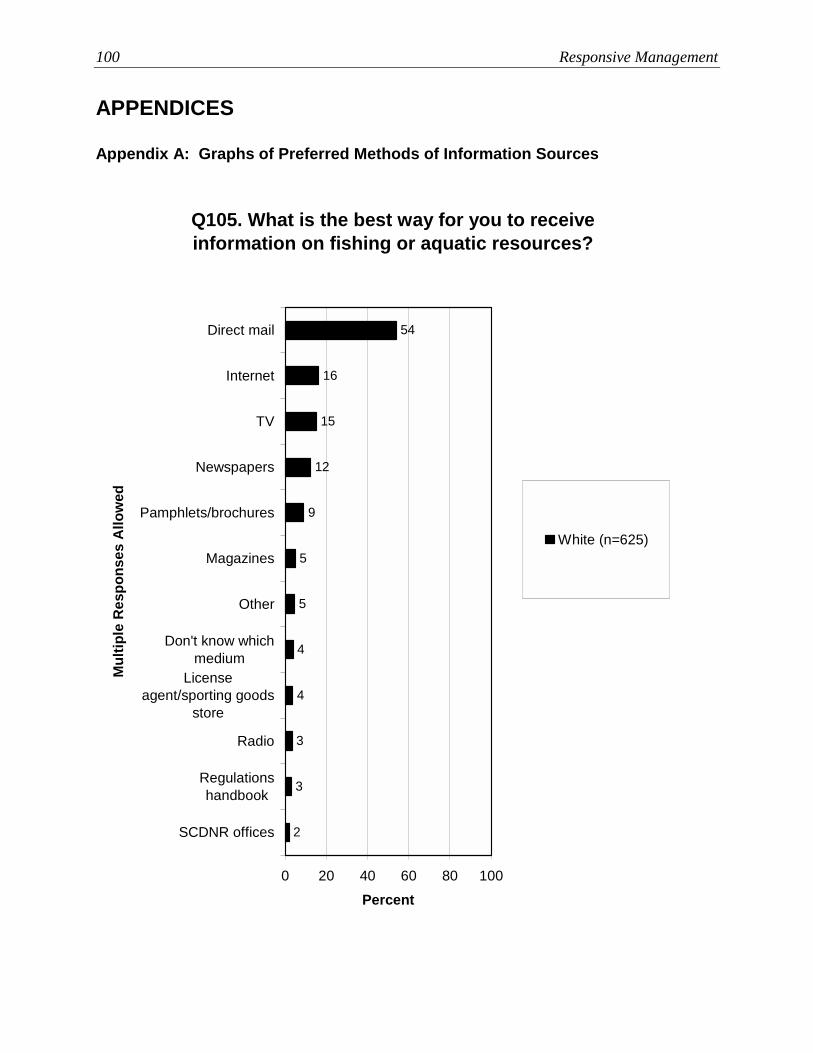
100 Responsive Management
APPENDICES Appendix A: Graphs of Preferred Methods of Information Sources
Q105. What is the best way for you to receive information on fishing or aquatic resources?
2
3
3
5
9
12
15
16
54
5
4
4
0 20 40 60 80 100
Direct mail
Internet
TV
Newspapers
Pamphlets/brochures
Magazines
Other
Don't know whichmedium
Licenseagent/sporting goods
store
Radio
Regulationshandbook
SCDNR offices
Mul
tiple
Res
pons
es A
llow
ed
Percent
White (n=625)
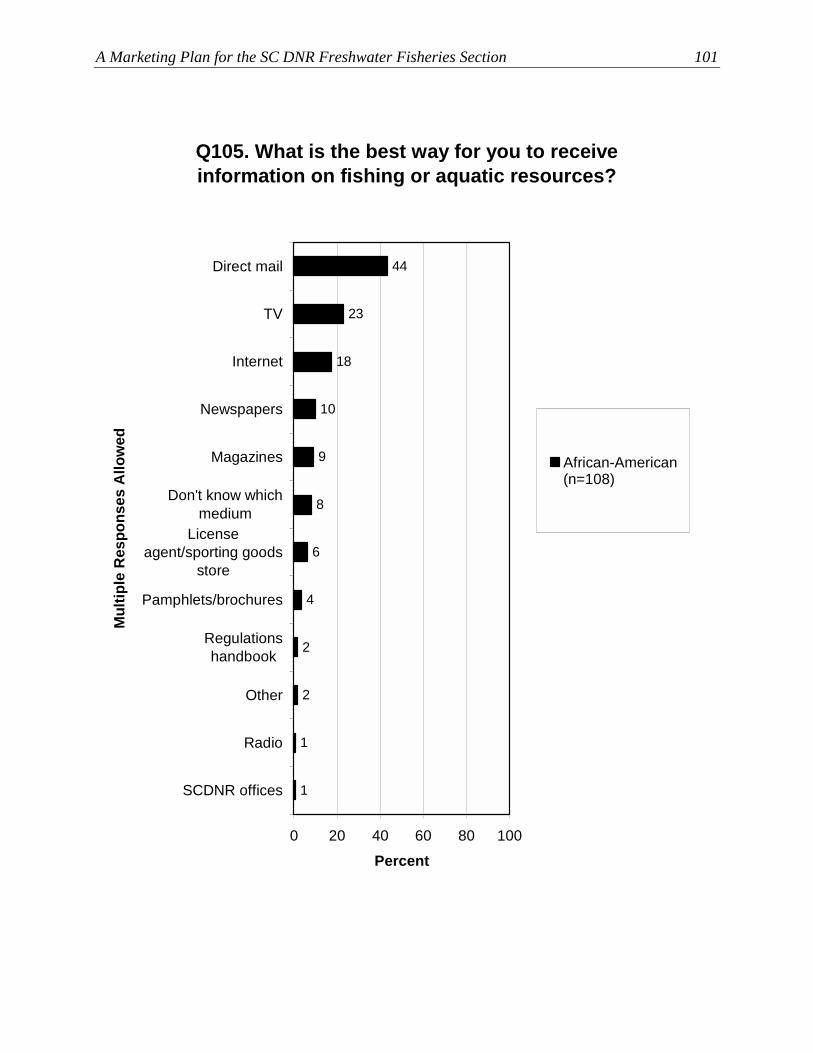
A Marketing Plan for the SC DNR Freshwater Fisheries Section 101
Q105. What is the best way for you to receive information on fishing or aquatic resources?
1
1
2
8
9
10
18
23
44
6
4
2
0 20 40 60 80 100
Direct mail
TV
Internet
Newspapers
Magazines
Don't know whichmedium
Licenseagent/sporting goods
store
Pamphlets/brochures
Regulationshandbook
Other
Radio
SCDNR offices
Mul
tiple
Res
pons
es A
llow
ed
Percent
African-American(n=108)

102 Responsive Management
Q105. What is the best way for you to receive information on fishing or aquatic resources?
2
3
4
7
10
14
18
24
33
7
6
4
0 20 40 60 80 100
Direct mail
TV
Don't know whichmedium
Internet
Newspapers
Pamphlets/brochures
Magazines
Licenseagent/sporting goods
store
Radio
Regulationshandbook
Other
SCDNR offices
Mul
tiple
Res
pons
es A
llow
ed
Percent
Grades 1-12, no HSdiploma (n=97)
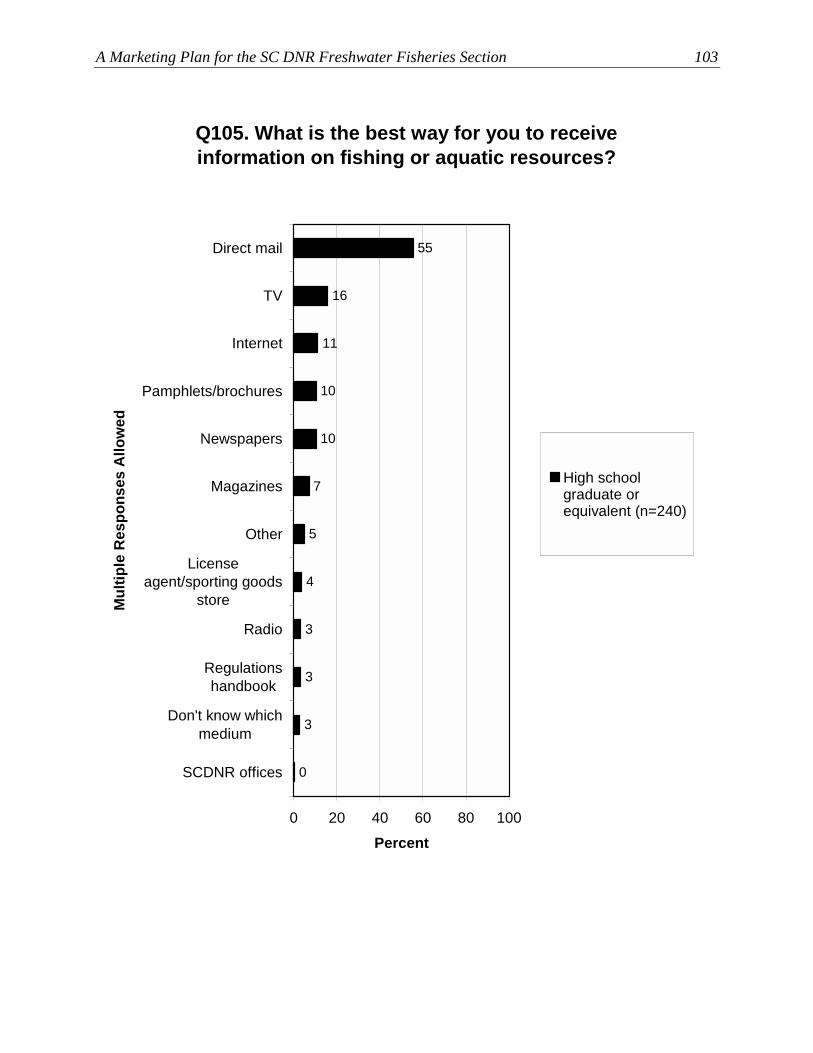
A Marketing Plan for the SC DNR Freshwater Fisheries Section 103
Q105. What is the best way for you to receive information on fishing or aquatic resources?
0
3
3
7
10
10
11
16
55
5
4
3
0 20 40 60 80 100
Direct mail
TV
Internet
Pamphlets/brochures
Newspapers
Magazines
Other
Licenseagent/sporting goods
store
Radio
Regulationshandbook
Don't know whichmedium
SCDNR offices
Mul
tiple
Res
pons
es A
llow
ed
Percent
High schoolgraduate orequivalent (n=240)

104 Responsive Management
Q105. What is the best way for you to receive information on fishing or aquatic resources?
2
2
3
7
8
9
14
21
57
4
4
3
0 20 40 60 80 100
Direct mail
Internet
TV
Newspapers
Pamphlets/brochures
Magazines
Regulationshandbook
Don't know whichmedium
Licenseagent/sporting goods
store
SCDNR offices
Radio
Other
Mul
tiple
Res
pons
es A
llow
ed
Percent
Some college ortrade school(n=183)

A Marketing Plan for the SC DNR Freshwater Fisheries Section 105
Q105. What is the best way for you to receive information on fishing or aquatic resources?
1
2
2
6
6
17
17
21
51
5
4
3
0 20 40 60 80 100
Direct mail
Internet
Newspapers
TV
Pamphlets/brochures
Licenseagent/sporting goods
store
Other
Magazines
SCDNR offices
Regulationshandbook
Radio
Don't know whichmedium
Mul
tiple
Res
pons
es A
llow
ed
Percent
College graduate(n=178)
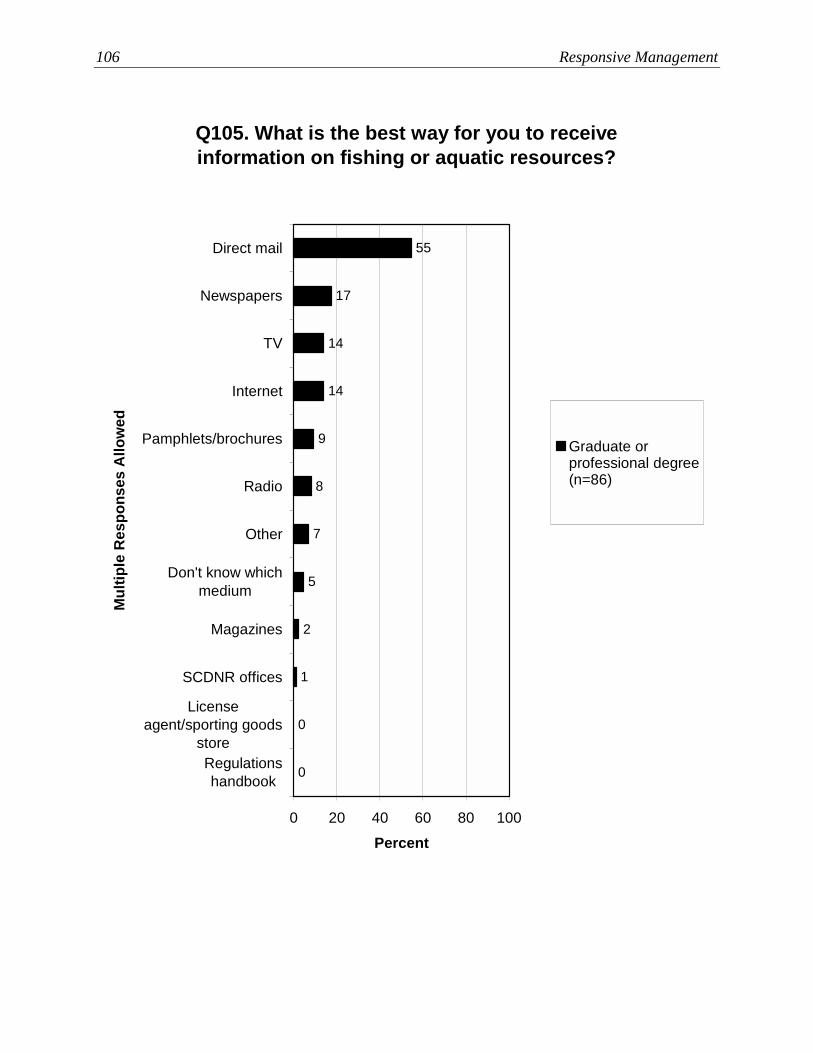
106 Responsive Management
Q105. What is the best way for you to receive information on fishing or aquatic resources?
0
0
1
8
9
14
14
17
55
7
5
2
0 20 40 60 80 100
Direct mail
Newspapers
TV
Internet
Pamphlets/brochures
Radio
Other
Don't know whichmedium
Magazines
SCDNR offices
Licenseagent/sporting goods
storeRegulationshandbook
Mul
tiple
Res
pons
es A
llow
ed
Percent
Graduate orprofessional degree(n=86)
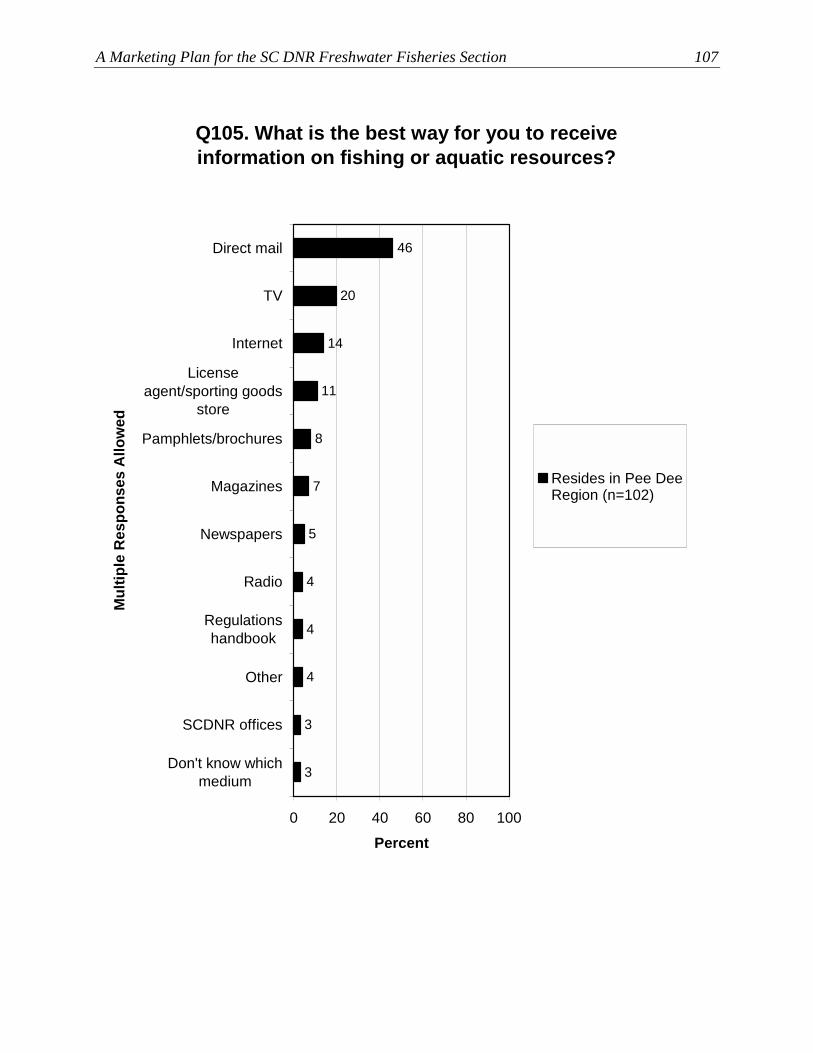
A Marketing Plan for the SC DNR Freshwater Fisheries Section 107
Q105. What is the best way for you to receive information on fishing or aquatic resources?
3
3
4
7
8
11
14
20
46
5
4
4
0 20 40 60 80 100
Direct mail
TV
Internet
Licenseagent/sporting goods
store
Pamphlets/brochures
Magazines
Newspapers
Radio
Regulationshandbook
Other
SCDNR offices
Don't know whichmedium
Mul
tiple
Res
pons
es A
llow
ed
Percent
Resides in Pee DeeRegion (n=102)

108 Responsive Management
Q105. What is the best way for you to receive information on fishing or aquatic resources?
1
1
2
6
10
10
15
16
51
5
5
3
0 20 40 60 80 100
Direct mail
Internet
TV
Pamphlets/brochures
Newspapers
Don't know whichmedium
Other
Magazines
Radio
Licenseagent/sporting goods
store
SCDNR offices
Regulationshandbook
Mul
tiple
Res
pons
es A
llow
ed
Percent
Resides in MountainRegion (n=169)

A Marketing Plan for the SC DNR Freshwater Fisheries Section 109
Q105. What is the best way for you to receive information on fishing or aquatic resources?
2
2
3
7
9
15
15
16
54
4
4
3
0 20 40 60 80 100
Direct mail
Internet
Newspapers
TV
Pamphlets/brochures
Magazines
Don't know whichmedium
Regulationshandbook
Other
Licenseagent/sporting goods
store
SCDNR offices
Radio
Mul
tiple
Res
pons
es A
llow
ed
Percent
Resides inPiedmont Region(n=300)

110 Responsive Management
Q105. What is the best way for you to receive information on fishing or aquatic resources?
2
4
4
6
6
15
18
18
51
6
4
4
0 20 40 60 80 100
Direct mail
TV
Internet
Newspapers
Pamphlets/brochures
Don't know whichmedium
Radio
Magazines
Other
Licenseagent/sporting goods
storeRegulationshandbook
SCDNR offices
Mul
tiple
Res
pons
es A
llow
ed
Percent
Resides in LowCounty Region(n=209)
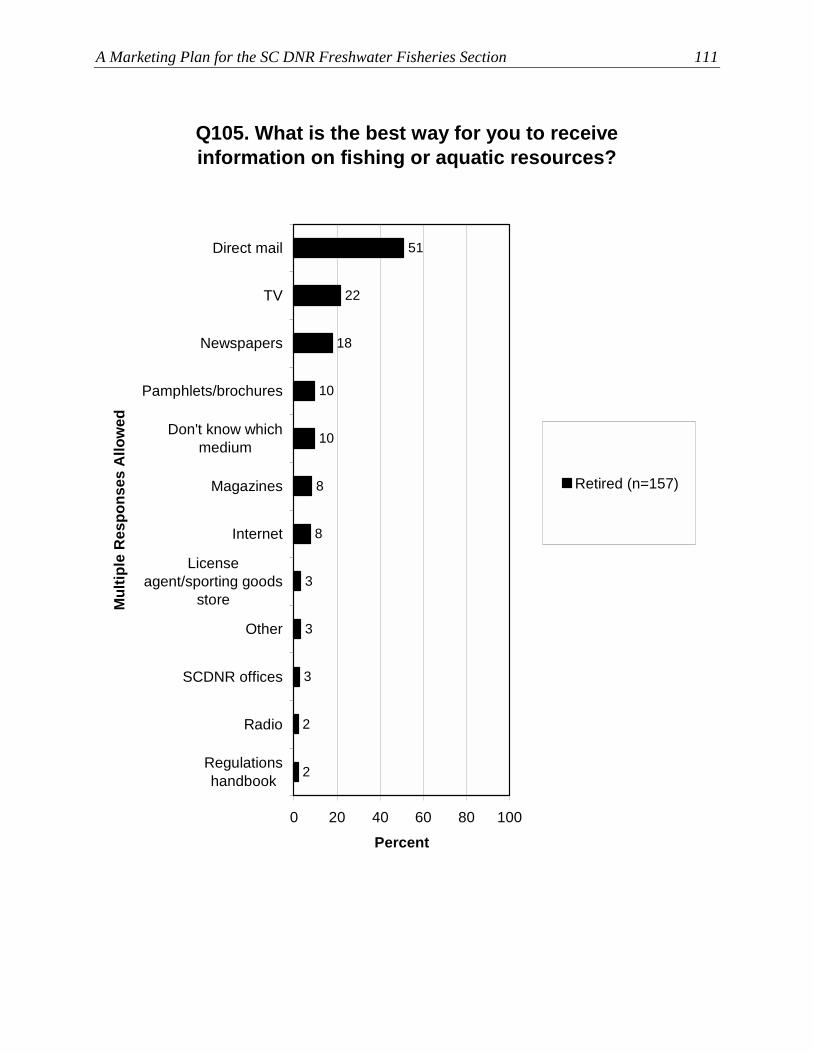
A Marketing Plan for the SC DNR Freshwater Fisheries Section 111
Q105. What is the best way for you to receive information on fishing or aquatic resources?
2
2
3
8
10
10
18
22
51
8
3
3
0 20 40 60 80 100
Direct mail
TV
Newspapers
Pamphlets/brochures
Don't know whichmedium
Magazines
Internet
Licenseagent/sporting goods
store
Other
SCDNR offices
Radio
Regulationshandbook
Mul
tiple
Res
pons
es A
llow
ed
Percent
Retired (n=157)
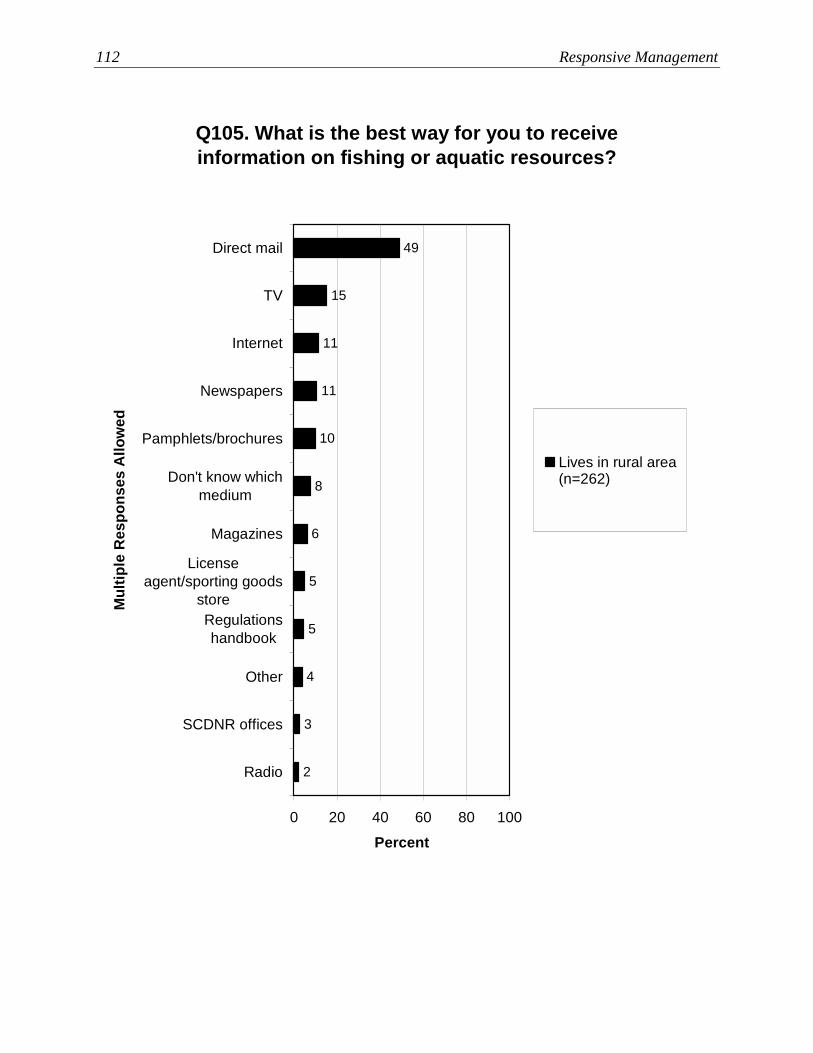
112 Responsive Management
Q105. What is the best way for you to receive information on fishing or aquatic resources?
2
3
4
8
10
11
11
15
49
6
5
5
0 20 40 60 80 100
Direct mail
TV
Internet
Newspapers
Pamphlets/brochures
Don't know whichmedium
Magazines
Licenseagent/sporting goods
storeRegulationshandbook
Other
SCDNR offices
Radio
Mul
tiple
Res
pons
es A
llow
ed
Percent
Lives in rural area(n=262)

A Marketing Plan for the SC DNR Freshwater Fisheries Section 113
Q105. What is the best way for you to receive information on fishing or aquatic resources?
1
2
3
5
6
11
17
21
53
5
3
3
0 20 40 60 80 100
Direct mail
Internet
TV
Newspapers
Pamphlets/brochures
Magazines
Other
Radio
Licenseagent/sporting goods
storeDon't know which
medium
Regulationshandbook
SCDNR offices
Mul
tiple
Res
pons
es A
llow
ed
Percent
Lives in small city ortown (n=333)
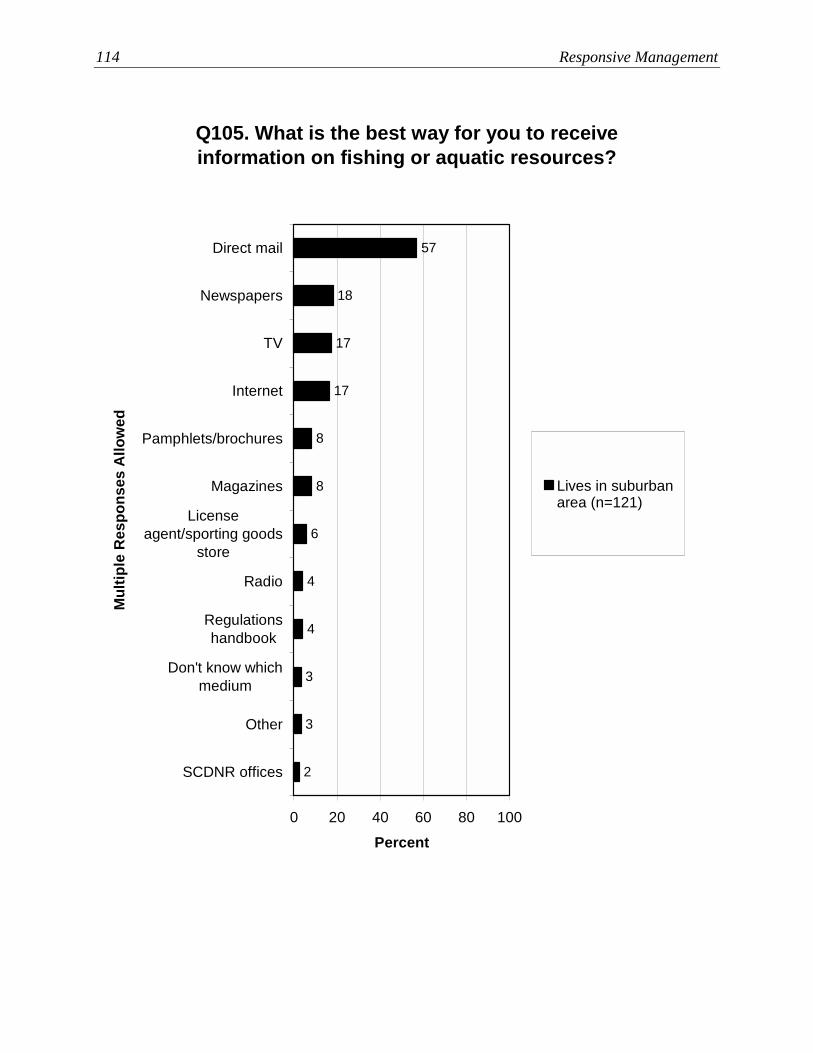
114 Responsive Management
Q105. What is the best way for you to receive information on fishing or aquatic resources?
2
3
3
8
8
17
17
18
57
6
4
4
0 20 40 60 80 100
Direct mail
Newspapers
TV
Internet
Pamphlets/brochures
Magazines
Licenseagent/sporting goods
store
Radio
Regulationshandbook
Don't know whichmedium
Other
SCDNR offices
Mul
tiple
Res
pons
es A
llow
ed
Percent
Lives in suburbanarea (n=121)

A Marketing Plan for the SC DNR Freshwater Fisheries Section 115
Q105. What is the best way for you to receive information on fishing or aquatic resources?
1
3
3
7
13
14
14
15
46
4
4
3
0 20 40 60 80 100
Direct mail
Internet
Newspapers
TV
Pamphlets/brochures
Don't know whichmedium
Radio
Other
SCDNR offices
Magazines
Regulationshandbook
Licenseagent/sporting goods
store
Mul
tiple
Res
pons
es A
llow
ed
Percent
Lives in large city orurban area (n=72)

116 Responsive Management
Q105. What is the best way for you to receive information on fishing or aquatic resources?
4
4
5
64
11
11
9
7
7
2
2
0
0 20 40 60 80 100
Direct mail
Newspapers
TV
Internet
Pamphlets/brochures
Magazines
Don't know whichmedium
Regulationshandbook
Other
Radio
SCDNR offices
Licenseagent/sporting goods
store
Mul
tiple
Res
pons
es A
llow
ed
Percent
Income of $100,000or more (n=56)

A Marketing Plan for the SC DNR Freshwater Fisheries Section 117
Q105. What is the best way for you to receive information on fishing or aquatic resources?
0
5
5
8
10
20
20
25
60
8
8
5
0 20 40 60 80 100
Direct mail
Internet
Newspapers
TV
Pamphlets/brochures
Radio
Licenseagent/sporting goods
store
Other
SCDNR offices
Magazines
Regulationshandbook
Don't know whichmedium
Mul
tiple
Res
pons
es A
llow
ed
Percent
Income of $80,000to $99,999 (n=40)
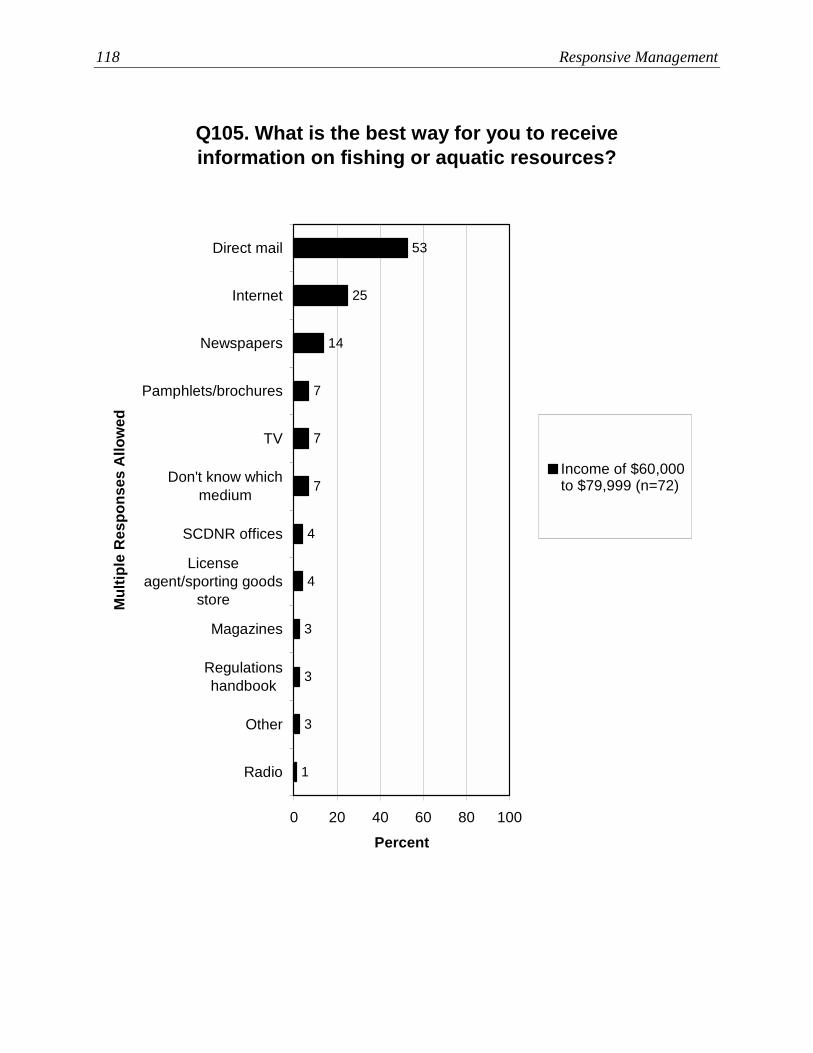
118 Responsive Management
Q105. What is the best way for you to receive information on fishing or aquatic resources?
1
3
3
7
7
7
14
25
53
4
4
3
0 20 40 60 80 100
Direct mail
Internet
Newspapers
Pamphlets/brochures
TV
Don't know whichmedium
SCDNR offices
Licenseagent/sporting goods
store
Magazines
Regulationshandbook
Other
Radio
Mul
tiple
Res
pons
es A
llow
ed
Percent
Income of $60,000to $79,999 (n=72)

A Marketing Plan for the SC DNR Freshwater Fisheries Section 119
Q105. What is the best way for you to receive information on fishing or aquatic resources?
2
3
3
4
6
10
13
20
53
4
4
4
0 20 40 60 80 100
Direct mail
Internet
TV
Newspapers
Pamphlets/brochures
Radio
SCDNR offices
Don't know whichmedium
Other
Magazines
Regulationshandbook
Licenseagent/sporting goods
store
Mul
tiple
Res
pons
es A
llow
ed
Percent
Income of $40,000to $59,999 (n=139)

120 Responsive Management
Q105. What is the best way for you to receive information on fishing or aquatic resources?
1
2
2
5
11
14
15
19
54
4
3
2
0 20 40 60 80 100
Direct mail
TV
Internet
Pamphlets/brochures
Newspapers
Magazines
Other
Licenseagent/sporting goods
store
Radio
SCDNR offices
Don't know whichmedium
Regulationshandbook
Mul
tiple
Res
pons
es A
llow
ed
Percent
Income of $20,000to $39,999 (n=151)
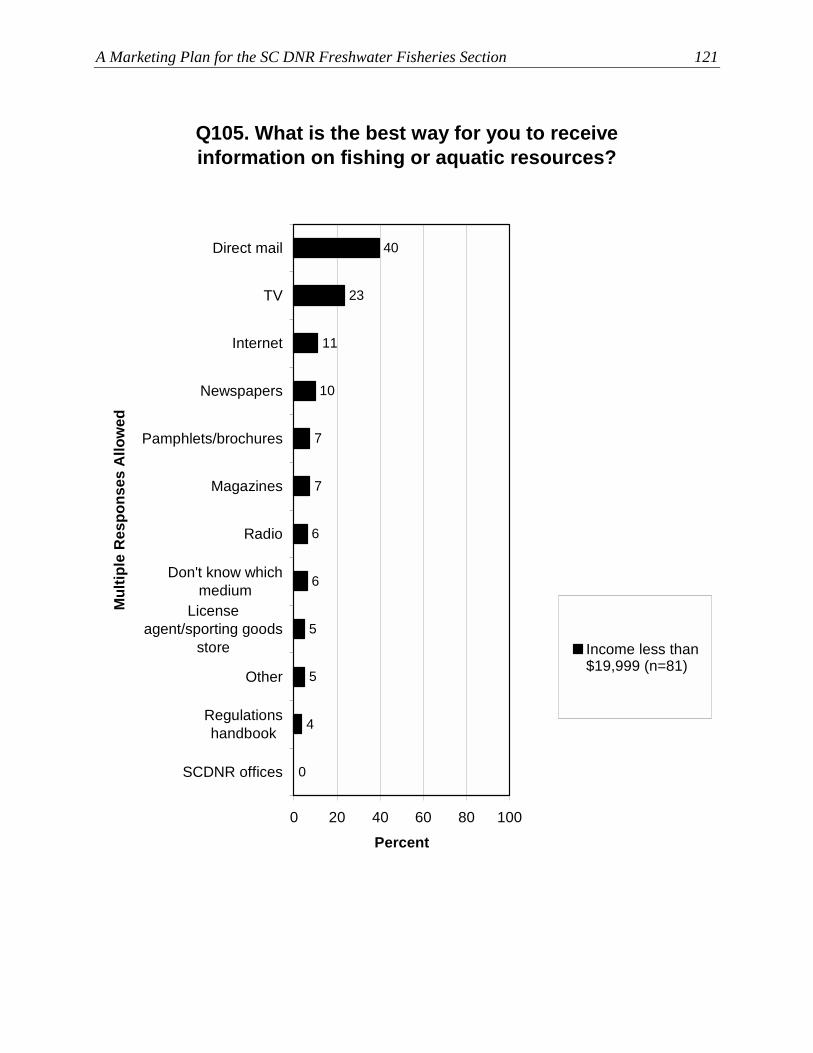
A Marketing Plan for the SC DNR Freshwater Fisheries Section 121
Q105. What is the best way for you to receive information on fishing or aquatic resources?
0
4
5
7
7
10
11
23
40
6
6
5
0 20 40 60 80 100
Direct mail
TV
Internet
Newspapers
Pamphlets/brochures
Magazines
Radio
Don't know whichmedium
Licenseagent/sporting goods
store
Other
Regulationshandbook
SCDNR offices
Mul
tiple
Res
pons
es A
llow
ed
Percent
Income less than$19,999 (n=81)

122 Responsive Management
Q105. What is the best way for you to receive information on fishing or aquatic resources?
1
1
2
7
8
13
15
18
53
4
4
3
0 20 40 60 80 100
Direct mail
TV
Internet
Newspapers
Pamphlets/brochures
Don't know whichmedium
Other
Magazines
Radio
Licenseagent/sporting goods
storeRegulationshandbook
SCDNR offices
Mul
tiple
Res
pons
es A
llow
ed
Percent
Female (n=410)

A Marketing Plan for the SC DNR Freshwater Fisheries Section 123
Q105. What is the best way for you to receive information on fishing or aquatic resources?
3
3
3
8
9
11
14
17
51
5
5
4
0 20 40 60 80 100
Direct mail
Internet
TV
Newspapers
Pamphlets/brochures
Magazines
Licenseagent/sporting goods
storeRegulationshandbook
Other
Radio
Don't know whichmedium
SCDNR offices
Mul
tiple
Res
pons
es A
llow
ed
Percent
Male (n=396)
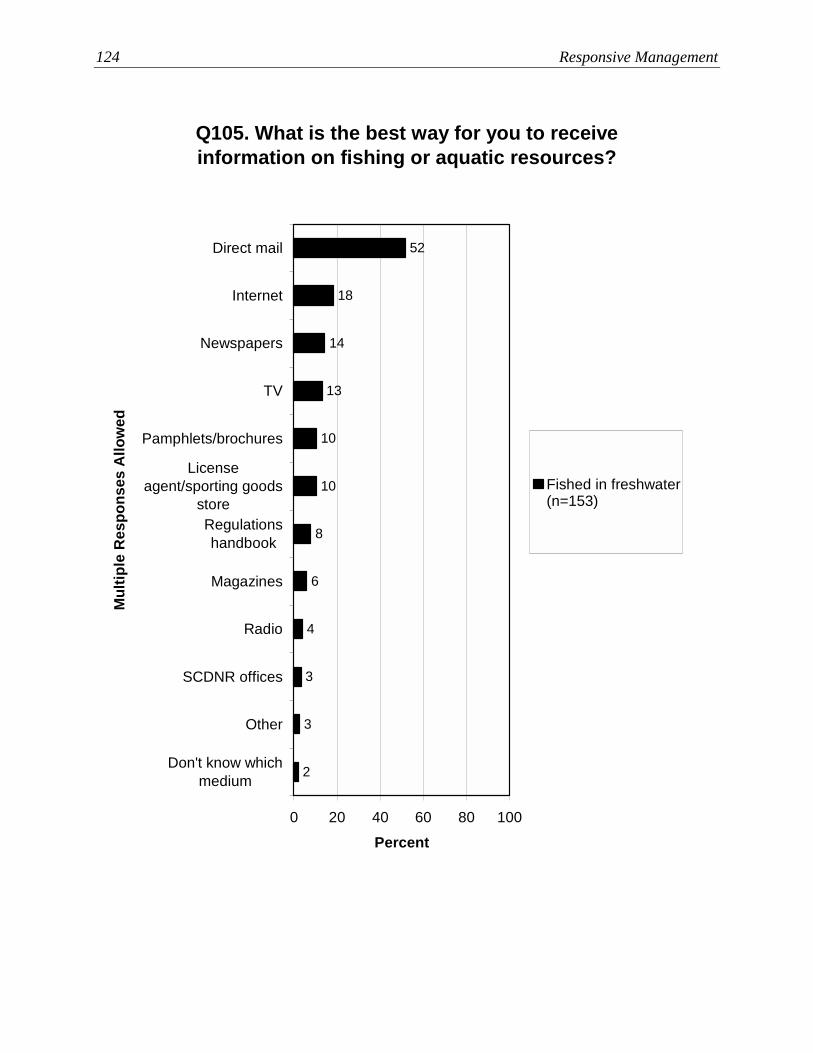
124 Responsive Management
Q105. What is the best way for you to receive information on fishing or aquatic resources?
2
3
3
10
10
13
14
18
52
8
6
4
0 20 40 60 80 100
Direct mail
Internet
Newspapers
TV
Pamphlets/brochures
Licenseagent/sporting goods
storeRegulationshandbook
Magazines
Radio
SCDNR offices
Other
Don't know whichmedium
Mul
tiple
Res
pons
es A
llow
ed
Percent
Fished in freshwater(n=153)
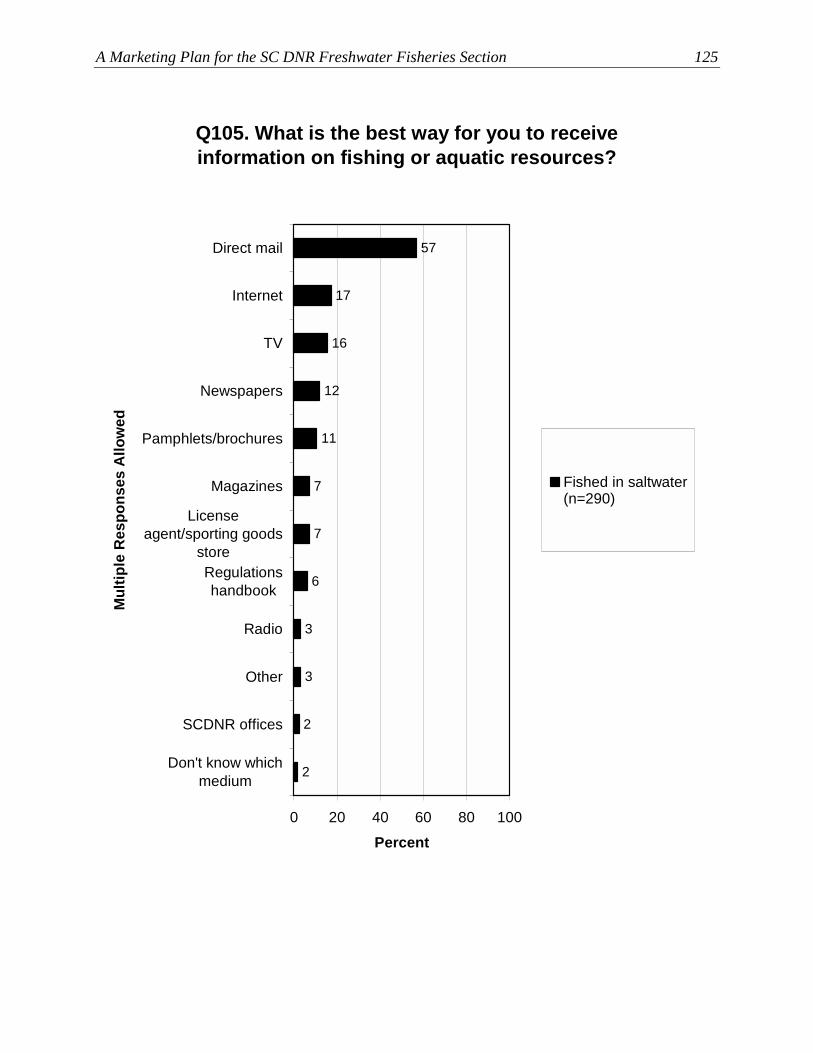
A Marketing Plan for the SC DNR Freshwater Fisheries Section 125
Q105. What is the best way for you to receive information on fishing or aquatic resources?
2
2
3
7
11
12
16
17
57
7
6
3
0 20 40 60 80 100
Direct mail
Internet
TV
Newspapers
Pamphlets/brochures
Magazines
Licenseagent/sporting goods
storeRegulationshandbook
Radio
Other
SCDNR offices
Don't know whichmedium
Mul
tiple
Res
pons
es A
llow
ed
Percent
Fished in saltwater(n=290)
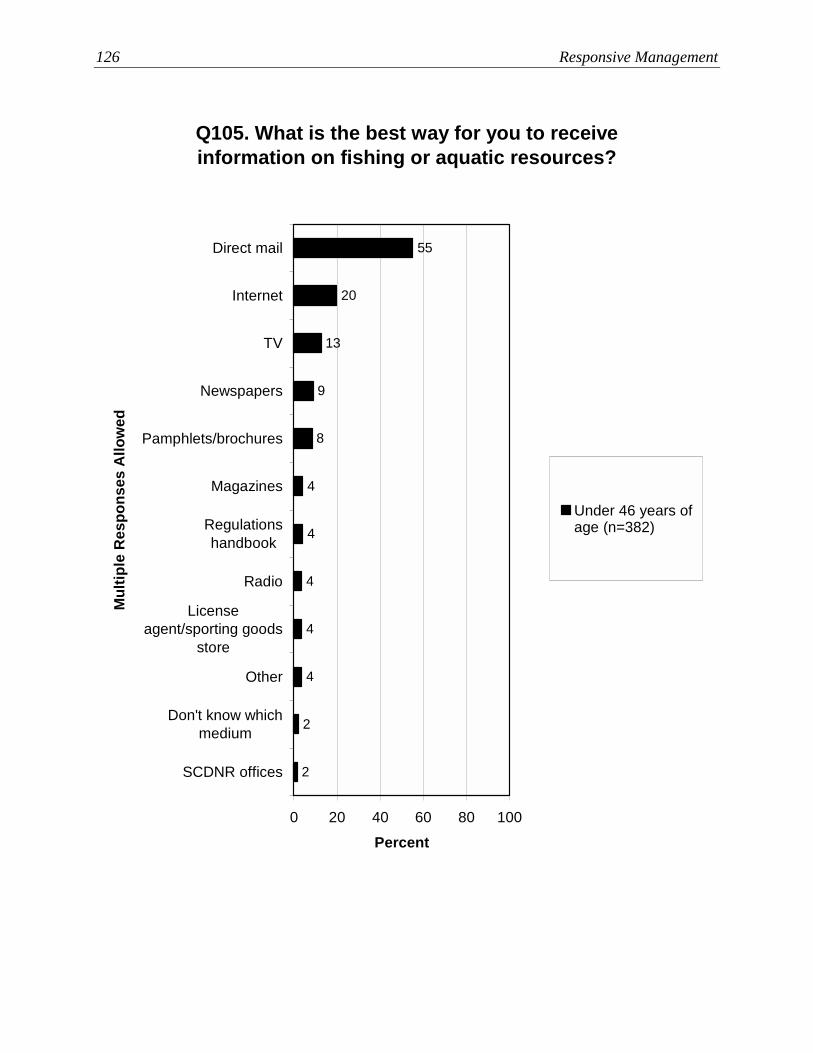
126 Responsive Management
Q105. What is the best way for you to receive information on fishing or aquatic resources?
2
2
4
4
8
9
13
20
55
4
4
4
0 20 40 60 80 100
Direct mail
Internet
TV
Newspapers
Pamphlets/brochures
Magazines
Regulationshandbook
Radio
Licenseagent/sporting goods
store
Other
Don't know whichmedium
SCDNR offices
Mul
tiple
Res
pons
es A
llow
ed
Percent
Under 46 years ofage (n=382)

A Marketing Plan for the SC DNR Freshwater Fisheries Section 127
Appendix B: Nonparametric Analyses of Preferred Information Sources PREFER INFORMATION THROUGH DIRECT MAIL Z-SCORE FISHED IN SALTWATER 2.07* WHITE 1.97* INCOME OF $100,000 OR MORE 1.90 JOB IS IN MEDICAL 1.87
MOST LIKELY TO SAY PREFER INFORMATION
THROUGH DIRECT MAIL.
JOB IS IN INDUSTRY 1.61 EDUCATION OF SOME COLLEGE OR TRADE SCHOOL 1.47 UNEMPLOYED 1.26 HIGH SCHOOL GRADUATE OR EQUIVALENT 1.25 LIVES IN A SUBURBAN AREA 1.19 WATCHED WILDLIFE NEAR A LAKE, STREAM, OR RIVER 1.11 BEEN SAILING 1.04 INCOME OF $80,000 TO $99,999 1.03 BEEN CANOEING OR KAYAKING 0.90 NATIVE AMERICAN 0.88 RESIDES IN PIEDMONT REGION 0.71 LIVES IN A SMALL CITY OR TOWN 0.53 GRADUATE OR PROFESSIONAL DEGREE 0.51 FEMALE 0.51 JOB IS IN SALES/RETAIL 0.44 INCOME OF $20,000 TO $39,999 0.44 JOB IS IN MILITARY 0.36 BEEN MOTORIZED BOATING 0.32 INCOME OF $40,000 TO $59,999 0.31 INCOME OF $60,000 TO $79,999 0.13 JOB IS IN TEACHING/EDUCATION 0.09 JOB IS IN CONSULTING 0.00 HISPANIC -0.10 FISHED IN FRESHWATER -0.11 RESIDES IN MOUNTAIN REGION -0.16 JOB IS IN AGRICULTURE/FARMING -0.23 UNDER 46 YEARS OF AGE (MEDIAN AGE) -0.29 RETIRED -0.30 MALE -0.43 RESIDES IN LOW COUNTY REGION -0.44 COLLEGE GRADUATE -0.45 ASIAN-AMERICAN -0.54 JOB IS IN CONSTRUCTION/DEVELOPMENT -0.59 HOMEMAKER -0.60 JOB IS IN PUBLIC SERVICE -0.86 PARTICIPATED IN NONE OF THE LISTED ACTIVITIES -0.94 LIVES IN A LARGE CITY OR URBAN AREA -1.10 OTHER RACE -1.25 LIVES IN A RURAL AREA -1.25 JOB IS IN CLERICAL -1.26 RESIDES IN PEE DEE REGION -1.29 STUDENT -1.35 DISABLED -1.46 AFRICAN-AMERICAN -1.90 INCOME LESS THAN $19,999 -2.38* EDUCATION OF GRADES 1-12, BUT NO HS DIPLOMA -4***
MOST LIKELY NOT TO SAY PREFER
INFORMATION THROUGH DIRECT
MAIL.

128 Responsive Management
PREFER INFORMATION THROUGH PAMPHLETS/BROCHURES Z-SCORE INCOME OF $20,000 TO $39,999 2.78** BEEN MOTORIZED BOATING 2.52* JOB IS IN INDUSTRY 1.87 FISHED IN SALTWATER 1.86 WATCHED WILDLIFE NEAR A LAKE, STREAM, OR RIVER 1.73
MOST LIKELY TO SAY PREFER INFORMATION THROUGH PAMPHLETS/
BROCHURES.
WHITE 1.59 HIGH SCHOOL GRADUATE OR EQUIVALENT 1.43 LIVES IN A LARGE CITY OR URBAN AREA 1.36 LIVES IN A RURAL AREA 1.17 FISHED IN FRESHWATER 1.08 RESIDES IN MOUNTAIN REGION 0.94 RESIDES IN PIEDMONT REGION 0.83 MALE 0.82 JOB IS IN MEDICAL 0.76 JOB IS IN CONSTRUCTION/DEVELOPMENT 0.68 UNDER 46 YEARS OF AGE (MEDIAN AGE) 0.66 RETIRED 0.64 OTHER RACE 0.58 JOB IS IN CLERICAL 0.51 INCOME OF $80,000 TO $99,999 0.40 GRADUATE OR PROFESSIONAL DEGREE 0.36 STUDENT 0.35 JOB IS IN SALES/RETAIL 0.01 LIVES IN A SUBURBAN AREA -0.01 EDUCATION OF SOME COLLEGE OR TRADE SCHOOL -0.05 JOB IS IN CONSULTING -0.05 RESIDES IN PEE DEE REGION -0.17 INCOME LESS THAN $19,999 -0.30 BEEN CANOEING OR KAYAKING -0.31 INCOME OF $100,000 OR MORE -0.32 JOB IS IN AGRICULTURE/FARMING -0.33 JOB IS IN TEACHING/EDUCATION -0.36 BEEN SAILING -0.40 EDUCATION OF GRADES 1-12, BUT NO HS DIPLOMA -0.41 INCOME OF $60,000 TO $79,999 -0.43 UNEMPLOYED -0.67 JOB IS IN MILITARY -0.67 ASIAN-AMERICAN -0.67 HISPANIC -0.74 FEMALE -0.75 INCOME OF $40,000 TO $59,999 -0.85 HOMEMAKER -0.89 NATIVE AMERICAN -0.91 COLLEGE GRADUATE -1.15 DISABLED -1.17 RESIDES IN LOW COUNTY REGION -1.26 JOB IS IN PUBLIC SERVICE -1.62 LIVES IN A SMALL CITY OR TOWN -1.71 AFRICAN-AMERICAN -1.85 PARTICIPATED IN NONE OF THE LISTED ACTIVITIES -1.93
MOST LIKELY NOT TO SAY PREFER
INFORMATION THROUGH PAMPHLETS/
BROCHURES.
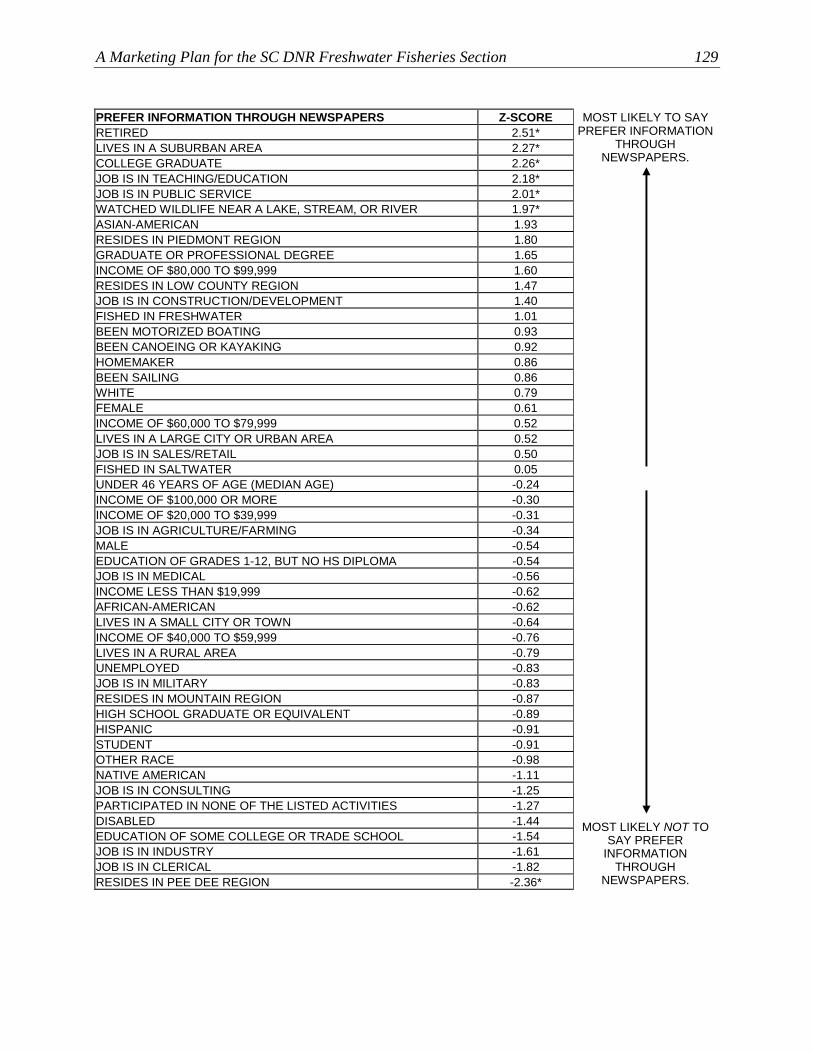
A Marketing Plan for the SC DNR Freshwater Fisheries Section 129
PREFER INFORMATION THROUGH NEWSPAPERS Z-SCORE RETIRED 2.51* LIVES IN A SUBURBAN AREA 2.27* COLLEGE GRADUATE 2.26* JOB IS IN TEACHING/EDUCATION 2.18*
MOST LIKELY TO SAY PREFER INFORMATION
THROUGH NEWSPAPERS.
JOB IS IN PUBLIC SERVICE 2.01* WATCHED WILDLIFE NEAR A LAKE, STREAM, OR RIVER 1.97* ASIAN-AMERICAN 1.93 RESIDES IN PIEDMONT REGION 1.80 GRADUATE OR PROFESSIONAL DEGREE 1.65 INCOME OF $80,000 TO $99,999 1.60 RESIDES IN LOW COUNTY REGION 1.47 JOB IS IN CONSTRUCTION/DEVELOPMENT 1.40 FISHED IN FRESHWATER 1.01 BEEN MOTORIZED BOATING 0.93 BEEN CANOEING OR KAYAKING 0.92 HOMEMAKER 0.86 BEEN SAILING 0.86 WHITE 0.79 FEMALE 0.61 INCOME OF $60,000 TO $79,999 0.52 LIVES IN A LARGE CITY OR URBAN AREA 0.52 JOB IS IN SALES/RETAIL 0.50 FISHED IN SALTWATER 0.05 UNDER 46 YEARS OF AGE (MEDIAN AGE) -0.24 INCOME OF $100,000 OR MORE -0.30 INCOME OF $20,000 TO $39,999 -0.31 JOB IS IN AGRICULTURE/FARMING -0.34 MALE -0.54 EDUCATION OF GRADES 1-12, BUT NO HS DIPLOMA -0.54 JOB IS IN MEDICAL -0.56 INCOME LESS THAN $19,999 -0.62 AFRICAN-AMERICAN -0.62 LIVES IN A SMALL CITY OR TOWN -0.64 INCOME OF $40,000 TO $59,999 -0.76 LIVES IN A RURAL AREA -0.79 UNEMPLOYED -0.83 JOB IS IN MILITARY -0.83 RESIDES IN MOUNTAIN REGION -0.87 HIGH SCHOOL GRADUATE OR EQUIVALENT -0.89 HISPANIC -0.91 STUDENT -0.91 OTHER RACE -0.98 NATIVE AMERICAN -1.11 JOB IS IN CONSULTING -1.25 PARTICIPATED IN NONE OF THE LISTED ACTIVITIES -1.27 DISABLED -1.44 EDUCATION OF SOME COLLEGE OR TRADE SCHOOL -1.54 JOB IS IN INDUSTRY -1.61 JOB IS IN CLERICAL -1.82 RESIDES IN PEE DEE REGION -2.36*
MOST LIKELY NOT TO SAY PREFER
INFORMATION THROUGH
NEWSPAPERS.
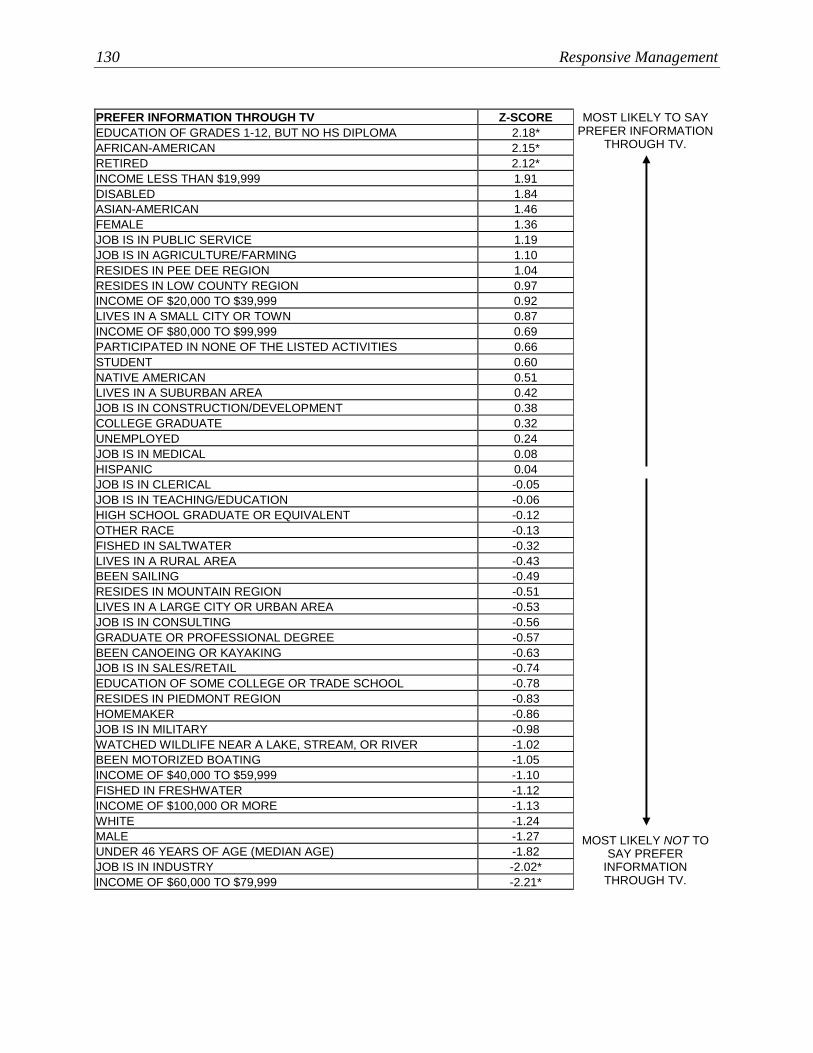
130 Responsive Management
PREFER INFORMATION THROUGH TV Z-SCORE EDUCATION OF GRADES 1-12, BUT NO HS DIPLOMA 2.18* AFRICAN-AMERICAN 2.15* RETIRED 2.12*
MOST LIKELY TO SAY PREFER INFORMATION
THROUGH TV.
INCOME LESS THAN $19,999 1.91 DISABLED 1.84 ASIAN-AMERICAN 1.46 FEMALE 1.36 JOB IS IN PUBLIC SERVICE 1.19 JOB IS IN AGRICULTURE/FARMING 1.10 RESIDES IN PEE DEE REGION 1.04 RESIDES IN LOW COUNTY REGION 0.97 INCOME OF $20,000 TO $39,999 0.92 LIVES IN A SMALL CITY OR TOWN 0.87 INCOME OF $80,000 TO $99,999 0.69 PARTICIPATED IN NONE OF THE LISTED ACTIVITIES 0.66 STUDENT 0.60 NATIVE AMERICAN 0.51 LIVES IN A SUBURBAN AREA 0.42 JOB IS IN CONSTRUCTION/DEVELOPMENT 0.38 COLLEGE GRADUATE 0.32 UNEMPLOYED 0.24 JOB IS IN MEDICAL 0.08 HISPANIC 0.04 JOB IS IN CLERICAL -0.05 JOB IS IN TEACHING/EDUCATION -0.06 HIGH SCHOOL GRADUATE OR EQUIVALENT -0.12 OTHER RACE -0.13 FISHED IN SALTWATER -0.32 LIVES IN A RURAL AREA -0.43 BEEN SAILING -0.49 RESIDES IN MOUNTAIN REGION -0.51 LIVES IN A LARGE CITY OR URBAN AREA -0.53 JOB IS IN CONSULTING -0.56 GRADUATE OR PROFESSIONAL DEGREE -0.57 BEEN CANOEING OR KAYAKING -0.63 JOB IS IN SALES/RETAIL -0.74 EDUCATION OF SOME COLLEGE OR TRADE SCHOOL -0.78 RESIDES IN PIEDMONT REGION -0.83 HOMEMAKER -0.86 JOB IS IN MILITARY -0.98 WATCHED WILDLIFE NEAR A LAKE, STREAM, OR RIVER -1.02 BEEN MOTORIZED BOATING -1.05 INCOME OF $40,000 TO $59,999 -1.10 FISHED IN FRESHWATER -1.12 INCOME OF $100,000 OR MORE -1.13 WHITE -1.24 MALE -1.27 UNDER 46 YEARS OF AGE (MEDIAN AGE) -1.82 JOB IS IN INDUSTRY -2.02* INCOME OF $60,000 TO $79,999 -2.21*
MOST LIKELY NOT TO SAY PREFER
INFORMATION THROUGH TV.
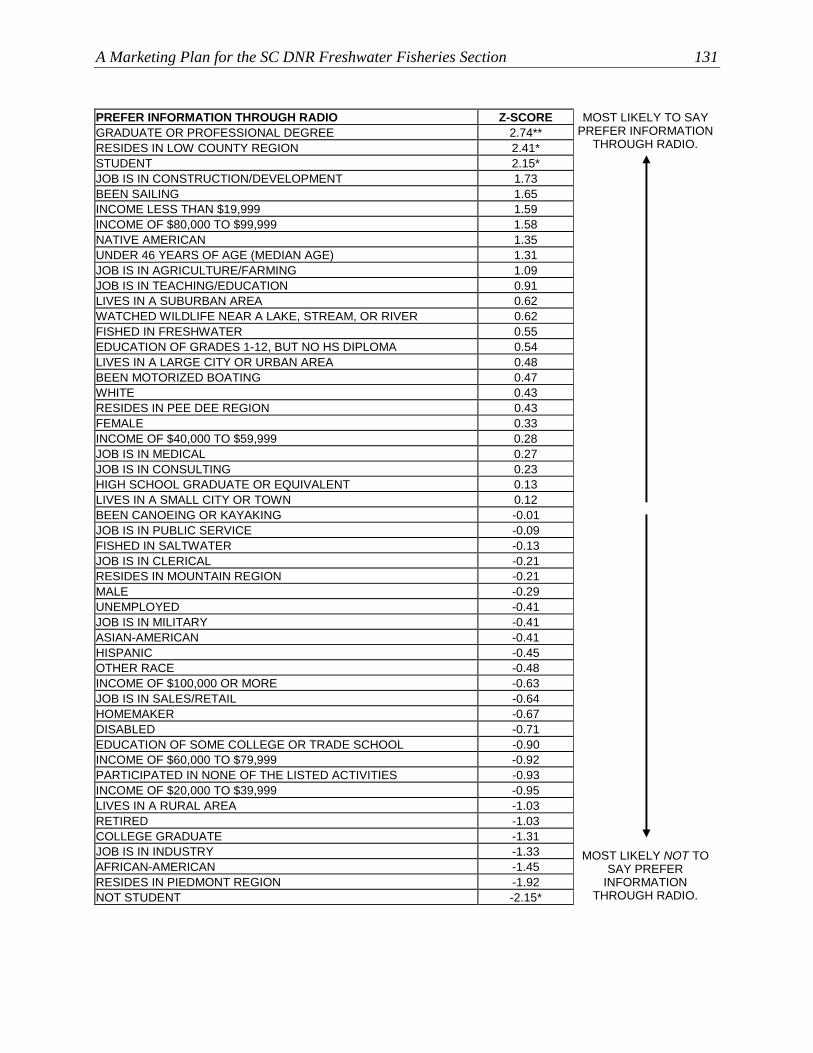
A Marketing Plan for the SC DNR Freshwater Fisheries Section 131
PREFER INFORMATION THROUGH RADIO Z-SCORE GRADUATE OR PROFESSIONAL DEGREE 2.74** RESIDES IN LOW COUNTY REGION 2.41* STUDENT 2.15*
MOST LIKELY TO SAY PREFER INFORMATION
THROUGH RADIO.
JOB IS IN CONSTRUCTION/DEVELOPMENT 1.73 BEEN SAILING 1.65 INCOME LESS THAN $19,999 1.59 INCOME OF $80,000 TO $99,999 1.58 NATIVE AMERICAN 1.35 UNDER 46 YEARS OF AGE (MEDIAN AGE) 1.31 JOB IS IN AGRICULTURE/FARMING 1.09 JOB IS IN TEACHING/EDUCATION 0.91 LIVES IN A SUBURBAN AREA 0.62 WATCHED WILDLIFE NEAR A LAKE, STREAM, OR RIVER 0.62 FISHED IN FRESHWATER 0.55 EDUCATION OF GRADES 1-12, BUT NO HS DIPLOMA 0.54 LIVES IN A LARGE CITY OR URBAN AREA 0.48 BEEN MOTORIZED BOATING 0.47 WHITE 0.43 RESIDES IN PEE DEE REGION 0.43 FEMALE 0.33 INCOME OF $40,000 TO $59,999 0.28 JOB IS IN MEDICAL 0.27 JOB IS IN CONSULTING 0.23 HIGH SCHOOL GRADUATE OR EQUIVALENT 0.13 LIVES IN A SMALL CITY OR TOWN 0.12 BEEN CANOEING OR KAYAKING -0.01 JOB IS IN PUBLIC SERVICE -0.09 FISHED IN SALTWATER -0.13 JOB IS IN CLERICAL -0.21 RESIDES IN MOUNTAIN REGION -0.21 MALE -0.29 UNEMPLOYED -0.41 JOB IS IN MILITARY -0.41 ASIAN-AMERICAN -0.41 HISPANIC -0.45 OTHER RACE -0.48 INCOME OF $100,000 OR MORE -0.63 JOB IS IN SALES/RETAIL -0.64 HOMEMAKER -0.67 DISABLED -0.71 EDUCATION OF SOME COLLEGE OR TRADE SCHOOL -0.90 INCOME OF $60,000 TO $79,999 -0.92 PARTICIPATED IN NONE OF THE LISTED ACTIVITIES -0.93 INCOME OF $20,000 TO $39,999 -0.95 LIVES IN A RURAL AREA -1.03 RETIRED -1.03 COLLEGE GRADUATE -1.31 JOB IS IN INDUSTRY -1.33 AFRICAN-AMERICAN -1.45 RESIDES IN PIEDMONT REGION -1.92 NOT STUDENT -2.15*
MOST LIKELY NOT TO SAY PREFER
INFORMATION THROUGH RADIO.

132 Responsive Management
PREFER INFORMATION THROUGH INTERNET Z-SCORE LIVES IN A SMALL CITY OR TOWN 3.12** JOB IS IN CONSULTING 2.73** STUDENT 2.6** BEEN CANOEING OR KAYAKING 2.32*
MOST LIKELY TO SAY PREFER INFORMATION THROUGH INTERNET.
INCOME OF $60,000 TO $79,999 2.13* OTHER RACE 1.92 EDUCATION OF SOME COLLEGE OR TRADE SCHOOL 1.91 COLLEGE GRADUATE 1.88 JOB IS IN CONSTRUCTION/DEVELOPMENT 1.85 JOB IS IN CLERICAL 1.74 INCOME OF $80,000 TO $99,999 1.55 JOB IS IN MILITARY 1.45 INCOME OF $40,000 TO $59,999 1.39 BEEN SAILING 1.33 HISPANIC 1.14 WATCHED WILDLIFE NEAR A LAKE, STREAM, OR RIVER 0.99 RESIDES IN LOW COUNTY REGION 0.91 FISHED IN FRESHWATER 0.79 BEEN MOTORIZED BOATING 0.65 FISHED IN SALTWATER 0.61 HOMEMAKER 0.59 JOB IS IN AGRICULTURE/FARMING 0.58 MALE 0.55 AFRICAN-AMERICAN 0.42 WHITE 0.18 LIVES IN A SUBURBAN AREA 0.11 RESIDES IN PIEDMONT REGION 0.08 JOB IS IN MEDICAL 0.06 JOB IS IN SALES/RETAIL 0.04 JOB IS IN TEACHING/EDUCATION -0.09 RESIDES IN MOUNTAIN REGION -0.09 LIVES IN A LARGE CITY OR URBAN AREA -0.22 JOB IS IN PUBLIC SERVICE -0.24 NATIVE AMERICAN -0.42 EDUCATION OF GRADES 1-12, BUT NO HS DIPLOMA -0.50 GRADUATE OR PROFESSIONAL DEGREE -0.60 INCOME OF $20,000 TO $39,999 -0.60 FEMALE -0.65 RESIDES IN PEE DEE REGION -0.72 UNEMPLOYED -0.99 ASIAN-AMERICAN -0.99 DISABLED -1.01 INCOME LESS THAN $19,999 -1.31 UNDER 46 YEARS OF AGE (MEDIAN AGE) -1.42 JOB IS IN INDUSTRY -1.47 INCOME OF $100,000 OR MORE -1.53 PARTICIPATED IN NONE OF THE LISTED ACTIVITIES -1.67 HIGH SCHOOL GRADUATE OR EQUIVALENT -2.48* LIVES IN A RURAL AREA -2.53* RETIRED -3.24**
MOST LIKELY NOT TO SAY PREFER
INFORMATION THROUGH INTERNET.

A Marketing Plan for the SC DNR Freshwater Fisheries Section 133
PREFER INFORMATION THROUGH SCDNR OFFICES Z-SCORE OTHER RACE 2.45* JOB IS IN CONSTRUCTION/DEVELOPMENT 2.01* BEEN SAILING 1.94 MALE 1.91
MOST LIKELY TO SAY PREFER INFORMATION
THROUGH SC DNR OFFICES.
BEEN MOTORIZED BOATING 1.78 COLLEGE GRADUATE 1.70 JOB IS IN PUBLIC SERVICE 1.69 INCOME OF $40,000 TO $59,999 1.67 INCOME OF $60,000 TO $79,999 1.52 INCOME OF $80,000 TO $99,999 1.51 FISHED IN FRESHWATER 1.44 LIVES IN A RURAL AREA 1.19 EDUCATION OF SOME COLLEGE OR TRADE SCHOOL 1.00 JOB IS IN INDUSTRY 0.93 FISHED IN SALTWATER 0.88 RESIDES IN PEE DEE REGION 0.87 WATCHED WILDLIFE NEAR A LAKE, STREAM, OR RIVER 0.87 RESIDES IN PIEDMONT REGION 0.78 RETIRED 0.72 LIVES IN A LARGE CITY OR URBAN AREA 0.61 LIVES IN A SUBURBAN AREA 0.55 WHITE 0.26 UNDER 46 YEARS OF AGE (MEDIAN AGE) 0.17 EDUCATION OF GRADES 1-12, BUT NO HS DIPLOMA 0.16 INCOME OF $20,000 TO $39,999 0.13 RESIDES IN LOW COUNTY REGION 0.07 INCOME OF $100,000 OR MORE -0.04 HOMEMAKER -0.08 UNEMPLOYED -0.31 JOB IS IN MILITARY -0.31 ASIAN-AMERICAN -0.31 HISPANIC -0.34 NATIVE AMERICAN -0.41 JOB IS IN SALES/RETAIL -0.48 GRADUATE OR PROFESSIONAL DEGREE -0.50 DISABLED -0.54 BEEN CANOEING OR KAYAKING -0.60 JOB IS IN MEDICAL -0.68 JOB IS IN CONSULTING -0.70 JOB IS IN AGRICULTURE/FARMING -0.77 STUDENT -0.77 AFRICAN-AMERICAN -0.77 JOB IS IN CLERICAL -0.87 JOB IS IN TEACHING/EDUCATION -1.08 INCOME LESS THAN $19,999 -1.30 RESIDES IN MOUNTAIN REGION -1.37 PARTICIPATED IN NONE OF THE LISTED ACTIVITIES -1.52 LIVES IN A SMALL CITY OR TOWN -1.68 FEMALE -1.88 HIGH SCHOOL GRADUATE OR EQUIVALENT -1.97*
MOST LIKELY NOT TO SAY PREFER
INFORMATION THROUGH SC DNR
OFFICES.

134 Responsive Management
PREFER INFORMATION THROUGH MAGAZINES Z-SCORE OTHER RACE 2.63** MALE 2.27* AFRICAN-AMERICAN 1.72 JOB IS IN CONSTRUCTION/DEVELOPMENT 1.68
MOST LIKELY TO SAY PREFER INFORMATION THROUGH MAGAZINES.
RETIRED 1.56 FISHED IN SALTWATER 1.43 LIVES IN A SUBURBAN AREA 1.33 HIGH SCHOOL GRADUATE OR EQUIVALENT 1.11 JOB IS IN INDUSTRY 1.10 RESIDES IN PIEDMONT REGION 0.92 INCOME LESS THAN $19,999 0.71 EDUCATION OF GRADES 1-12, BUT NO HS DIPLOMA 0.69 EDUCATION OF SOME COLLEGE OR TRADE SCHOOL 0.58 JOB IS IN MEDICAL 0.57 RESIDES IN PEE DEE REGION 0.55 JOB IS IN CONSULTING 0.51 INCOME OF $100,000 OR MORE 0.49 WATCHED WILDLIFE NEAR A LAKE, STREAM, OR RIVER 0.43 LIVES IN A RURAL AREA 0.36 UNDER 46 YEARS OF AGE (MEDIAN AGE) 0.25 STUDENT 0.24 FISHED IN FRESHWATER 0.12 BEEN MOTORIZED BOATING -0.14 HOMEMAKER -0.18 INCOME OF $80,000 TO $99,999 -0.19 INCOME OF $20,000 TO $39,999 -0.23 LIVES IN A SMALL CITY OR TOWN -0.29 PARTICIPATED IN NONE OF THE LISTED ACTIVITIES -0.47 UNEMPLOYED -0.55 JOB IS IN MILITARY -0.55 ASIAN-AMERICAN -0.55 JOB IS IN AGRICULTURE/FARMING -0.57 RESIDES IN MOUNTAIN REGION -0.60 HISPANIC -0.60 NATIVE AMERICAN -0.74 BEEN SAILING -0.76 JOB IS IN CLERICAL -0.83 JOB IS IN SALES/RETAIL -0.86 DISABLED -0.96 RESIDES IN LOW COUNTY REGION -1.00 BEEN CANOEING OR KAYAKING -1.11 INCOME OF $60,000 TO $79,999 -1.12 LIVES IN A LARGE CITY OR URBAN AREA -1.12 COLLEGE GRADUATE -1.14 JOB IS IN TEACHING/EDUCATION -1.33 GRADUATE OR PROFESSIONAL DEGREE -1.42 JOB IS IN PUBLIC SERVICE -1.53 INCOME OF $40,000 TO $59,999 -1.57 WHITE -1.64 FEMALE -2.22*
MOST LIKELY NOT TO SAY PREFER
INFORMATION THROUGH MAGAZINES.

A Marketing Plan for the SC DNR Freshwater Fisheries Section 135
PREFER INFORMATION THROUGH LICENSE AGENT/SPORTING GOODS STORE Z-SCORE
FISHED IN FRESHWATER 4.74*** RESIDES IN PEE DEE REGION 3.91*** FISHED IN SALTWATER 3.78*** BEEN MOTORIZED BOATING 2.73** MALE 2.13*
MOST LIKELY TO SAY PREFER INFORMATION
THROUGH LICENSE AGENT/SPORTING
GOODS STORE.
WATCHED WILDLIFE NEAR A LAKE, STREAM, OR RIVER 2.12* DISABLED 1.93 AFRICAN-AMERICAN 1.54 OTHER RACE 1.45 COLLEGE GRADUATE 1.41 JOB IS IN CONSTRUCTION/DEVELOPMENT 1.34 EDUCATION OF GRADES 1-12, BUT NO HS DIPLOMA 1.29 INCOME OF $80,000 TO $99,999 1.24 LIVES IN A SUBURBAN AREA 1.21 LIVES IN A RURAL AREA 1.16 STUDENT 0.82 JOB IS IN INDUSTRY 0.67 INCOME LESS THAN $19,999 0.55 INCOME OF $60,000 TO $79,999 0.16 JOB IS IN CONSULTING 0.04 RESIDES IN LOW COUNTY REGION 0.00 HIGH SCHOOL GRADUATE OR EQUIVALENT -0.08 JOB IS IN AGRICULTURE/FARMING -0.14 BEEN SAILING -0.16 BEEN CANOEING OR KAYAKING -0.34 INCOME OF $20,000 TO $39,999 -0.37 JOB IS IN CLERICAL -0.39 WHITE -0.41 EDUCATION OF SOME COLLEGE OR TRADE SCHOOL -0.44 UNEMPLOYED -0.45 JOB IS IN MILITARY -0.45 ASIAN-AMERICAN -0.45 RETIRED -0.47 HISPANIC -0.49 NATIVE AMERICAN -0.60 JOB IS IN SALES/RETAIL -0.70 JOB IS IN TEACHING/EDUCATION -0.85 RESIDES IN PIEDMONT REGION -0.95 JOB IS IN MEDICAL -0.99 JOB IS IN PUBLIC SERVICE -1.02 LIVES IN A SMALL CITY OR TOWN -1.03 INCOME OF $40,000 TO $59,999 -1.13 LIVES IN A LARGE CITY OR URBAN AREA -1.13 UNDER 46 YEARS OF AGE (MEDIAN AGE) -1.39 INCOME OF $100,000 OR MORE -1.55 RESIDES IN MOUNTAIN REGION -1.57 HOMEMAKER -1.58 GRADUATE OR PROFESSIONAL DEGREE -1.96 FEMALE -2.09* PARTICIPATED IN NONE OF THE LISTED ACTIVITIES -3.05**
MOST LIKELY NOT TO SAY PREFER
INFORMATION THROUGH LICENSE AGENT/SPORTING
GOODS STORE.
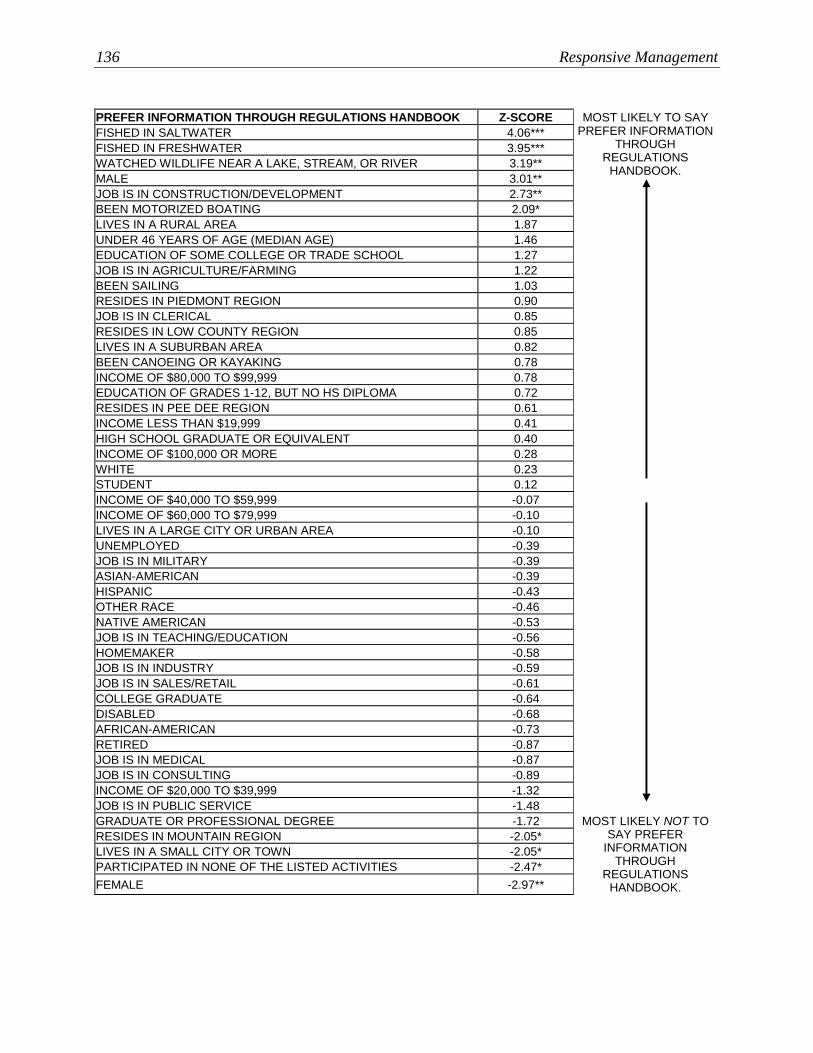
136 Responsive Management
PREFER INFORMATION THROUGH REGULATIONS HANDBOOK Z-SCORE FISHED IN SALTWATER 4.06*** FISHED IN FRESHWATER 3.95*** WATCHED WILDLIFE NEAR A LAKE, STREAM, OR RIVER 3.19** MALE 3.01** JOB IS IN CONSTRUCTION/DEVELOPMENT 2.73**
MOST LIKELY TO SAY PREFER INFORMATION
THROUGH REGULATIONS
HANDBOOK.
BEEN MOTORIZED BOATING 2.09* LIVES IN A RURAL AREA 1.87 UNDER 46 YEARS OF AGE (MEDIAN AGE) 1.46 EDUCATION OF SOME COLLEGE OR TRADE SCHOOL 1.27 JOB IS IN AGRICULTURE/FARMING 1.22 BEEN SAILING 1.03 RESIDES IN PIEDMONT REGION 0.90 JOB IS IN CLERICAL 0.85 RESIDES IN LOW COUNTY REGION 0.85 LIVES IN A SUBURBAN AREA 0.82 BEEN CANOEING OR KAYAKING 0.78 INCOME OF $80,000 TO $99,999 0.78 EDUCATION OF GRADES 1-12, BUT NO HS DIPLOMA 0.72 RESIDES IN PEE DEE REGION 0.61 INCOME LESS THAN $19,999 0.41 HIGH SCHOOL GRADUATE OR EQUIVALENT 0.40 INCOME OF $100,000 OR MORE 0.28 WHITE 0.23 STUDENT 0.12 INCOME OF $40,000 TO $59,999 -0.07 INCOME OF $60,000 TO $79,999 -0.10 LIVES IN A LARGE CITY OR URBAN AREA -0.10 UNEMPLOYED -0.39 JOB IS IN MILITARY -0.39 ASIAN-AMERICAN -0.39 HISPANIC -0.43 OTHER RACE -0.46 NATIVE AMERICAN -0.53 JOB IS IN TEACHING/EDUCATION -0.56 HOMEMAKER -0.58 JOB IS IN INDUSTRY -0.59 JOB IS IN SALES/RETAIL -0.61 COLLEGE GRADUATE -0.64 DISABLED -0.68 AFRICAN-AMERICAN -0.73 RETIRED -0.87 JOB IS IN MEDICAL -0.87 JOB IS IN CONSULTING -0.89 INCOME OF $20,000 TO $39,999 -1.32 JOB IS IN PUBLIC SERVICE -1.48 GRADUATE OR PROFESSIONAL DEGREE -1.72 RESIDES IN MOUNTAIN REGION -2.05* LIVES IN A SMALL CITY OR TOWN -2.05* PARTICIPATED IN NONE OF THE LISTED ACTIVITIES -2.47* FEMALE -2.97**
MOST LIKELY NOT TO SAY PREFER
INFORMATION THROUGH
REGULATIONS HANDBOOK.