Embed Size (px)
Citation preview

~ Pergamon Comp. Immun. Microbiol. Infect. Dis. Vol. 17, No. I, pp. 15-27, 1994
Copyright © 1994 Elsevier Science Ltd 0147-9571(93)E0006-2 Printed in Great Britain. All rights reserved
0147-9571/94 $6.00 + 0.00
A LYMPHOCYTE COLONY ASSAY FOR CULTURE OF SHEEP LYMPHOCYTES
REGINALD JOHNSON*, JOHN B. KANEENE'~ a n d JAMES W. LLOYD
Department of Clinical Sciences, College of Veterinary Medicine, E. Lansing, MI 48824-1316, U.S.A.
(Received for publication 24 October 1993)
Abstract--A procedure for culturing sheep peripheral blood lymphocytes in soft agar was standardized. The variables that were evaluated included the type of T lymphocyte mitogens, mitogen doses, cell number, distribution of the cells in the culture vessel and the duration of the culture. Both concanavalin A (CON A) and phytohemagglutinin A (PHA) stimulated the formation of lymphocyte colonies. However, CON A consistently produced more and larger colonies. The doses of CON A and PHA which yielded the maximum number of colonies were 35 and 61/~g/ml, respectively. The optimum number of cells per well as 1.36 x 10⁶. Adherence of the cells to the floor of the culture vessel was required for the colonies to form. The maximum number of colonies was attained between day 5 and day 6 of culture. The lymphocyte colony assay may be a useful adjunct to other immunologic assays for studying cell-mediated immunity of sheep.
Key words: Lymphocyte colony assay, soft agar cultures, immunologic assays, T lymphocytes, sheep lymphocytes, cell-mediated immunity.
R6sum&-La proc6dure pour cultiver des lymphocytes du sang p6riph6rique de moutons en gel d'agar est standardis6e. Les param6tres 6valu6s sont les suivants: type de mitog6nes des lymphocytes T, dose de mitog6ne, nombre de cellules, distribution des cellules dans les cultures in vitro et dur6e de la culture. Ainsi, la concanavaline A (CON A) et la phyto- h6magglutinine A (PHA) ont stimul6 la formation de colonies de lymphocytes. Cependant, la CON A produit plus de colonies et de plus grande taille. Les doses de CON A et PHA pour lesquelles on obtient le maximum de colonies, sont respectivement de 35#g/ml et 61 #g/ml. Le nombre optimum de cellules par puits est de 1.36 x 10 6. L'adh6rence des cellules au fond des puits de cultures est n6cessaire pour la formation des colonies. Le nombre maximum de colonies est obtenu entre 5 et 6 jours de culture. En plus des autres tests immunologiques d6jfi existants, le dosage des colonies de lymphocytes pourrait se r6v61er 6tre un bon moyen d'6tude de l'immunit6 ~i m6diation cellulaire chez le mouton.
Mots-clefs: Dosage de colonies de lymphocytes, cultures en gel d'agar, dosages immunologiques, lymphocytes T, lymphocytes de mouton, immunit6 ~i m6diation cellulaire.
*Current address: Department of Veterinary Pathobiology, Purdue University, 1027 Lynn Hall, W. Lafayette, IN 47907-1027, U.S.A.
tAuthor for correspondence at: Population Medicine Center, A-109 Veterinary Clinical Center, Michigan State University, E. Lansing, MI 48824-1316, U.S.A.
Abbreviations used: autologous sheep serum, ASS; Hanks balanced salt solution, HBSS; Dulbecco's modified Eagle's medium, DMEM; Concanavalin A, CON A; phytohemagglutinin A, PHA; plating efficiency, PE; analysis of variance, ANOVA; coefficient of determination, R2; Interleukin, IL-1; Interleukin 2, IL-2; bovine leukemia virus, BLV.
15

16 REGINALD JOHNSON et al.
INTRODUCTION
Several techniques for growing lymphocyte colonies derived from human peripheral blood mononuclear cells in semisolid media have been described [1~4]. The cells comprising individual colonies were shown originally to be predominantly of a mature T cell phenotype as determined by E rosette formation [5 8]. Additional studies using mono- clonal antibodies suggested that the colonies may originate from immature T cell precursors that later develop into mature T cells [8]. Recent evidence further confirmed the T cell nature of the colonies [9]. Subpopulations of T lymphocytes bearing CD2, CD3, CD4, and CD8 antigens have been identified [10].
The applications of the T colony assay include the study of the different steps of T cell differentiation and their control mechanisms, providing a source of clones for the production of functional cells and lymphokines, and providing a method for the induction and initial cloning of functional subsets of mature T cells before subsequent expansion of these cells by using liquid cultures [10]. The T colony assay has been used to study the cell-mediated immune responses of humans with a variety of nonhematopoietic diseases such as cancer, rheumatoid arthritis and extrinsic bronchial asthma [! 1-13]. It has been used to study the effectiveness of bone marrow T cell depletion as a method to prevent graft versus host disease, after allogeneic bone marrow transplantation in humans, to study hematopoietic disorders such as chronic lymphocytic leukemia and to evaluate treatment outcomes in acute nonlymphoblastic leukemia [14-17]. The lymphocyte colony assay has been used to study the effects of immunosuppressive drugs, cytotoxic drugs and irradiation on lymphocyte colony formation [18 20].
Contradictory results of studies of lymphocyte colony formation by human lymphocytes have frequently been reported [10]. The differences in the results were attributed primarily to differences in techniques used for growing T cell colonies. Thus, the need for standardization of techniques for growing human lymphocyte colonies has been realized. Technical parameters that may account for differences in the T colony assay include: (1) the culture system, e.g. single vs double-layer technique, cell concentration, contents of the culture medium; (2) cell sensitization in a liquid medium prior to transfer to an agar medium; (3) source of the cells, e.g. peripheral blood vs bone marrow and (4) addition of colony-enhancing factors, e.g. conditioned media.
The objective of this study was to determine the optimal culture conditions for a lymphocyte colony assay for sheep lymphocytes as a prerequisite to studying the cellular immune responses of bovine leukemia virus infection in sheep. The effects of different lymphocyte mitogens, mitogen doses, the cell number, the distribution of the cells in the culture vessel, and the duration of the culture on lymphocyte colony formation by sheep peripheral blood lymphocytes were determined.
MATERIALS AND METHODS
Animals
Eight, 30-month-old healthy crossbred ewes served as the blood donors.
Collection of blood
20-50 ml of blood per ewe was collected in sterile, 10-ml, heparinized (14.3 IU per ml), warmed (37 +_ 3°C) evacuated tubes (Becton Dickinson, Rutherford, N.J.) after aseptic

Lymphocyte colony assay for sheep lymphocytes 17
preparation of the jugular vein. The blood tubes were transported in a 37°C portable incubator. The source of the serum for the cultures was autologous sheep serum (ASS). To collect the ASS, a volume of whole blood equal to twice the volume of the ASS desired was collected from each sheep into 10 ml coagulant tubes from an aseptically prepared jugular vein. The blood was allowed to clot overnight at 26°C. The clots were removed using aseptic technique, and the remaining erythrocytes were pelleted by centrifugation at 400g for 10min. The serum was aspirated, filtered through a 0.20pm syringe filter (Millpore Prod., Bedford, Mass.), heat-inactivated at 56°C for 30min and frozen immediately in 1.5-4.0 ml aliquots at -30°C.
Separation of mononuclear cells A 100% percoll solution was prepared by mixing undiluted Percoll (Sigma Chemical,
St Louis, Mo.) with Hanks balanced salt solution (HBSS) 10 x (Gibco, Grand Island, N.Y.) at a ratio of 9 parts Percoll to 1 part HBSS 10 x [21]. A 60% Percoll solution was prepared from the 100% Percoll solution by mixing the 100% Percoll with HBSS 1 × at a ratio of six parts 100% Percoll to four parts HBSS 1 × (1.075 sp. gr.). The whole blood was diluted in warm isotonic phosphate buffered saline (PBS; pH 7.4; 37°C) at a ratio of 1.5 parts PBS to 1.0 part blood, mixed gently for 5 min, and layered onto 4 ml of the 60% Percoll gradient at a ratio of 2 parts of the blood and PBS mixture to one part 60% Percoll. The diluted blood was centrifuged at 500g (Jouan CR412, Jouan Inc., Winchester, Va) for 26 min at 37°C. After removal of the plasma-PBS layer, the mononuclear cell layer was aspirated, resuspended in 5 ml of warm PBS, mixed thoroughly, and washed three times in PBS at 50-75 g for 5 min. The pellet was resuspended in 1.5-3.0 ml of warm Dulbecco's modified Eagle's medium (DMEM, pH 7.4, Gibco, Grand Island, N.Y.). The cells were counted, viability (94-100%) was assessed using 0.5% trypan blue dye (Sigma Chemical, St Louis, Mo.), and the concentration was adjusted to not exceed 10.0 to 12.0 x 1 0 6 cells/ml. These stock PBMCs were incubated at 37°C, 5% CO2 and were mixed by gently pipetting them every 25 min to prevent autoagglutination, if they were not used immediately.
Adherence of PBMC A volume of the stock PBMC was adjusted to the final desired no, of cells/ml of DMEM,
and 1.0 ml of the PBMC suspension was seeded into each well of a 16 mm dia, 24-well, flat-bottom, polystyrene tissue culture plate (Costar, Cambridge, Mass.; Corning Glass Works, Corning, N.Y.). These cells were incubated (Stericult 200, Forma Scientific, Marietta, Ohio) for 4.5-5.0 h at 37°C, 5% CO2, 90% humidity to allow the PBMC to settle and adhere to the floor of the wells of each plate.
Preparation of DMEM-agar
One hour prior to the end of the PBMC-adherence period a 0.4% stock-agar (Bactoagar, Difco, Detroit, Mich.) suspension was prepared by adding a volume of sterile DMEM (39°C) equal to 20.0% of the final desired DMEM-agar volume to the agar in a 50 ml polypropylene centrifuge tube (Corning, N.Y.). This concentrated agar suspension was gradually dissolved by heating it in 4-5 s bursts in a microwave oven at reduced power, along with vigorous shaking of the solution between each cycle of heating. Additional DMEM equal to 10% of the final DMEM-agar volume was then added, and 2-3 additional heating cycles were carried out to completely dissolve the concentrated agar

18 REGINALD JOHNSON et al.
solution. The agar solution was brought to its final volume with warm (39°C) DMEM to give a final concentration of 0.4% stock-agar. The 0.4% DMEM-agar solution was mixed thoroughly and incubated in a waterbath (39°C) until further use (see below). Thorough dissolution of the agar was a critical step in the procedure.
Storage of phytomitogens
Concanavalin A (CON A) and phytohemagglutinin A (PHA) (Sigma Chemical, St Louis, Mo.) were dissolved in sterile DMEM containing 200 IU/ml of penicillin g, 0.2 ~g per ml of streptomycin and 0.6 ~ g per ml amphotericin B (Antibiotic/Antimycotic, Sigma Chemical). Serial 2-fold dilutions of CON A (0.55-0.068/~g/#1) and PHA (1.1-0.138 #g//~l) in DMEM were aliquoted and stored at -18°C.
Dose response to phytomitogens
The DMEM was aspirated from each well after the 4.5 h incubation period during which the PBMC was allowed to adhere to the wells of the culture plates. One hundred/~1 of ASS followed by the addition of 50/~1 of mitogen was added to the cells in each well. Control wells received 50 #1 of DMEM. After addition of the ASS and mitogens, the contents of the plates were gently mixed manually for 4 min. The final serum concentration was 18.0%, the final CON A concentrations were 6, 12, 25 and 50/~g/ml of DMEM-agar and the final PHA concentrations were 12, 25, 50 and 100/~g/ml of DMEM-agar. Doses outside these ranges were not effective in stimulating the formation of colonies. The final PBMC number per well and concentration per ml of DMEM-agar used to study the responses to the mitogen doses was 1.0 x 1 0 6 per well and 1.81 × 10⁶ per ml, respectively. An average of 5 measurements were made at each dose of mitogen by using cells from each of six sheep.
Addition of DMEM-agar
400/~1 of the 0.4% stock-agar was added to each well and the liquid contents were gently mixed either manually or by using a rotator (American Dade, Miami, FL 33152) for 4 rain. Vigorous swirling of the plates as a means of mixing their contents resulted in detachment of the adhered PBMC. The agar-overlays were allowed to harden by incubating at 26°C for at least 3 0 4 5 rain. The plates were then gently shaken by hand to verify that the agar had solidified. They were incubated at 37°C, 5% CO2, 90% humidity for 5-6 days.
Optimum number of mononuclear cells
The effect of mononuclear cell number on lymphocyte colony formation was determined by culturing 0.25, 0.50, 1.0 and 1.5 x 10⁶ PBMC per well. No colonies formed when 2.0 × 1 0 6 cells per well were cultured. The final PBMC concentrations per ml of DMEM-agar were 0.45, 0.90, 1.81, and 2.72 × 1 0 6 PBMC. An average of 6 measurements were made at each dose of cells by using cells from seven sheep.
Adhered PBMC versus suspended-PBMC cultures
For the adhered-PBMC cultures, 1.3 × 10⁶ PBMC in D MEM were allowed to adhere to the culture plates during a 4.5-5 h incubation period. After removal of the DMEM, a mixture of 100/~1 of ASS (18% final concentration) and 50/~1 of CON A (33/~g/ml final) were added followed by the addition of 400 ~1 of 0.4% DMEM-agar. The suspended- PBMC cultures were prepared by first adding 150gl of serum and mitogen to the
Lymphocyte colony assay for sheep lymphocytes 19
wells followed by the addition of 400pl of DMEM-agar containing PBMC at a concentration of 3.25 x 10⁶/ml. The final PBMC concentration per well was 2.36 x 10⁶/ml of DMEM-agar, and the final concentration of agar was 0.29%.
Duration of the culture
Visual observation was used to assess the optimum duration of the culture. The plates were scanned microscopically between days 3 and 8 to determine the approximate day on which new colonies ceased to form.
Colony counts
The lymphocyte colonies were counted after 5 or 6 days in culture by using an inverted microscope (Biostar, Cambridge Instruments, Buffalo, N.Y.) at 100 x magnification. A colony was defined as a group of 30 or more large, blast-like cells. These criteria were used in order to distinguish colonies from small groups of more mature cells that arose occasionally as a result of cellular aggregation or clumping of the PBMC prior to the PBMC adherence-step. Photographs of the colonies were made with a 35 mm automated camera (Photostar, Cambridge Instruments, Buffalo, N.Y.) and ektachrome 160 tungsten film (Kodak, Rochester, N.Y.)
Plating efficiency
60% of the sheep peripheral blood mononuclear cells have a T cell phenotype [22]. Thus, the plating efficiency (PE) was determined using the following formula: PE = no. of lymphocyte colonies- [ (0 .6)x no. of PBMC per culture vessel] × 100. The PE was estimated by using the colony and cell counts of wells in which 1.3 x l 0 6 PBMC were cultured, since this number of cells was the optimum number at which the maximum number of colonies grew (refer to "Results" section).
Statistical analysis
The effects of varying the doses of CON A and PHA and varying the numbers PBMC on colony formation were analyzed by using regression analysis [23]. The independent variables were mitogen dose or cell number per well, and the dependent variable was the number of colonies formed. A comparison of the adhered-PBMC and suspended-PBMC culture techniques was done using a two-factor crossed analysis of variance (ANOVA) model in which the treatments "adhered-PBMC" and "suspended-PBMC" were repeated for each sheep [24]. The data were analyzed using the general linear models procedure from the computer program SAS [25]. Graphs of the data were made using the computer program Harvard Graphics [26].
RESULTS
Lymphocyte colonies
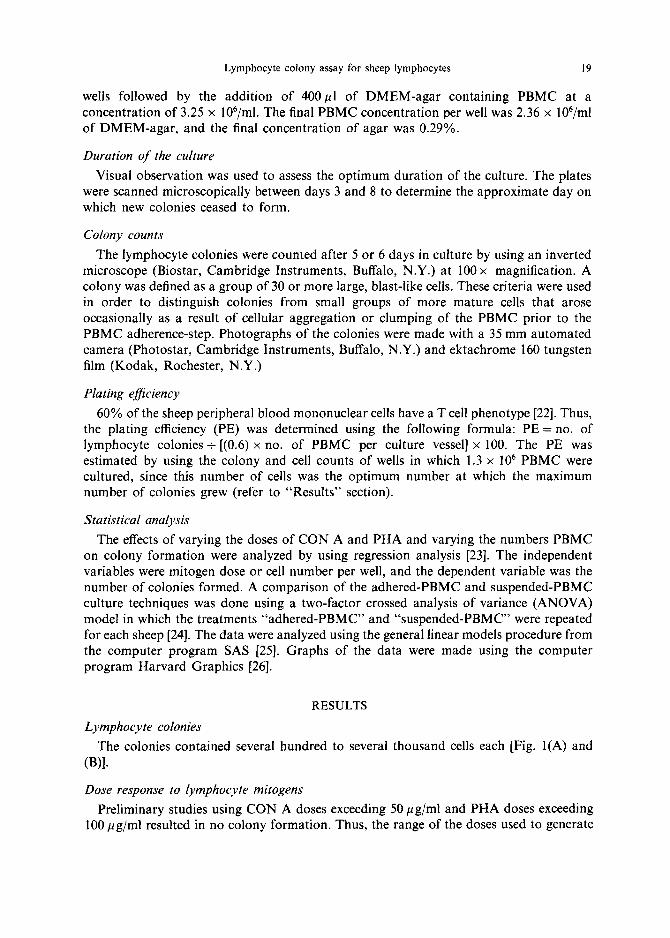
The colonies contained several hundred to several thousand cells each [Fig. I(A) and (B)].
Dose response to lymphocyte mitogens
Preliminary studies using CON A doses exceeding 50 ktg/ml and PHA doses exceeding 100 pg/ml resulted in no colony formation. Thus, the range of the doses used to generate

20 REGINALD JOHNSON et al.
the dose-response curves were 6-50 #g/ml for CON A (Fig. 2) and 12-100/~g/ml for PHA (Fig. 3). A quadratic regression model was used to best describe the responses to both CON A and PHA. The model that was used was:
where
Y = B0 + BI(XI ) + B2(Xt )2 + e,
Y = the number of lymphocyte colonies formed, the dependent variable X~ = the dose of mitogen, the independent variable B0 = a constant,
BL,B2 = coefficients for the independent variable, e = error term.
The number of the colonies formed by CON A-stimulated cells always exceeded the number formed by PHA-stimulated cells when the doses of CON A and PHA were equal, i.e. doses of 12, 25, and 50 #g/ml. The size of the colonies formed in the CON A-stimulated cultures was greater, and the cells forming these colonies appeared to be larger, more blast-like structures.
The effect of mitogen dose on colony formation was statistically significant for both CON A (P = 0.001) and for PHA (P =0.001). The coefficient of determination (R 2) indicates the percent of the variation in colony-formation that was due to the changes in the dose of the mitogens. The (R 2) for CON A and PHA was 0.70 and 0.65 respectively, suggesting that the 70 and 65% of the variation in the number of colonies formed was due to changing the doses of the two mitogens.
The actual regression equations used to predict the number of colonies formed for any dose of mitogen and (1) CON A and for (2) PHA were: (1) number of colonies = 1 0 6 + 4 6 ( C O N A d o s e ) - 0 . 6 6 ( C O N A dose) 2 and (2) number of colonies = - 43 + 16(PHA dose) - 0.13(PHA dose) 2.
The dose of mitogen at which maximum proliferation of the colonies occurred was
Number of Colonies
7oo~- .....~ 6oo I ......... ~" ~ 5oo I .- /- 400 ~-
t , , / ,oo U
O ~ ~ L ,
0 10 20 30 40 50
Con A ( ixg/ml)
~ O b s e r v e d P r e d i c t e d
Fig. 2. Dose r e sponse o f l y m p h o c y t e s f r o m 6 sheep to c o n c a n a v a l i n A ( C O N A). - * - - = obse rved m e a n n u m b e r o f colonies ; = p red ic t ed m e a n n u m b e r o f colonies ; * = m e a n response o f 5
m e a s u r e m e n t s f r o m each o f 6 sheep; P = 0.001; R 2 = 0.65.

Fig. 1. Lymphocyte colonies in a 5-day-old sofl-agar culture of sheep lymphocytes stimulated with 33 #g!mI of CON A. (A) = 100 x ; (B) = 500 x . Each colony contained several hundred to several
thousand cells,
21


Lymphocy te co lony assay for sheep lymphocytes 23
Number of Colonies 6O0
500
400
300
200
100
0 0
I I I I I I I I I I
10 20 30 40 50 60 70 80 90 100
PHA (/xg/ml)
"-~- Observed - - Predicted
Fig. 3. Dose - r e sponse of lymphocytes f rom 6 sheep to phy tohemagg lu t in in A (PHA). - - * - - = observed mean n u m b e r of colonies; = predicted mean number of colonies; * = mean
response of 5 measu remen t s f rom each of 6 sheep; P = 0.001; R 2 = 0.65.
determined by computing the dose at which the slope of the prediction line became zero, i.e. the first derivative of the prediction equation for each mitogen. The dose of CON A at which maximum colony proliferation occurred was 35 #g/ml and it was 61 pg/ml for PHA (Figs 2 and 3). No colonies formed in the negative control wells.
Optimum number of mononuclear cells
Preliminary studies using 2.0 × 10 6 PBMC per well resulted in no colony formation. Thus, the doses of cells between 0.25 and 1.50 inclusive were used to determine the
Number of Colonies 800
700
600
500
400
300
200
100
0 0
I I I I I J
0 .25 0.5 0 .75 1 1.25 1.5
Cell Number (x 105/well)
- - Predicted - - ~ Observed
Fig. 4. Dose - r e sponse of lymphocytes f rom 7 sheep to vary ing numbers of cells per well. - - * - - = observed m e a n n u m b e r of colonies; = predic ted m e a n n u m b e r of colonies; * = mean
response of 6 measu remen t s f rom each of 7 sheep; P = 0.001; R 2 = 0.49.

24 REGINALD JOHNSON et al.
Number of Colonies 1200
1000
800
600
400
200
0 I T I
Adhered PBMC Suspended PBMC
PBMC=Peripheral blood mononuclear c e l l s N = 9 p = 0 . 0 0 0 1
Fig. 5. Compar ison of lymphocyte colony formation by PBMC that either were adhered to the floor of the plate or were suspended in the agar layer. P = 0.0001.
optimum number of PBMC per well (Fig. 4). A quadratic regression model was also used to best describe the relationship between colony formation and the number of PBMC per well. However the number of PBMC was substituted in the equation for the dose of mitogen, the independent variable. The effect of PBMC number on colony formation was statistically significant (P = 0.001), and the coefficient of determination was 0.49, indicat- ing that approx, one-half of the variability in colony formation was due to the changes in the number of PBMCs cultured. The actual regression equation used to predict the number of colonies formed for a specified number of PBMC was:
No. of colonies = 66 + 1092 (No. of PBMC) - 402 (No. of PBMC) 2.
The approximate number of PBMC at which maximum colony proliferation occurred was 1.36 x l 0 6 PBMC per well (Fig. 4).
Adhered vs suspended-PBMC
PBMC that were first allowed to adhere to the bottom surface of the well before being overlayed with agar produced as many as 33 times more colonies when compared to an equal number of cells that were suspended in the agar. The number of colonies obtained using the adhered-cell technique was statistically greater (P -- 0.0001) than the number obtained using the suspended-cell technique (Fig. 5).
Duration of culture
The colonies became visible by day 3, and the maximum number of colonies was attained between day 5 and day 6 based upon visual observation. The size of individual colonies continued to increase, however, often leading to coalescence of the colonies and increased difficulty in distinguishing individual colonies.

Lymphocyte colony assay for sheep lymphocytes 25
Plating efficiency The PE was approximately 0.144%, indicating that about 144 of every 105-peripheral
blood T lymphocytes had colony-forming capacity.
DISCUSSION
These studies were done to determine the optimum conditions for culturing sheep lymphocytes in soft agar. The T colony assay was similar to the lymphocyte blastogenesis assay in that the proliferative responses varied between both mitogens and among doses for a specific mitogen.
A double-layer agar system has been used to culture human lymphocytes [1, 2, 27]. The cultures usually consisted of 0.5% agar in the lower layer that was overlaid with a 0.33% layer of agar in which the cells were suspended. The lymphocytes from sheep failed to produce colonies when the double-layer technique was used in our experiments. Human lymphocytes used in the double-layer cultures usually were preincubated in a liquid medium containing PHA, and the cells often agglutinated during the incubation period. Although the agglutinated human cells could be dispersed into single cells by vigorous pipetting, the sheep cells underwent irreversible agglutination. Therefore, the liquid preincubation step was abandoned during our experiments. The substitution of methyl cellulose for agar has been used to prevent the clumping and reduced viability associated with preincubation of human cells in a liquid medium [5]. We did not attempt to use methylcellulose as a medium for culturing the lymphocytes during our experiments.
The formation of colonies by sheep lymphocytes affected by both the distribution of the cells in the wells of the culture plates as well as the number of cells per well. The sheep cells seemed to have required closer contact than human cells in order for the colonies to form. The only method by which this close contact could be obtained was by allowing the cells to adhere to the floor of the wells in the culture plates. The colonies did not form when an equal number of cells was suspended in the agar. The concentration of the cells suspended in the agar was doubled, but this procedure also failed to increase colony formation. Despite the fact that a very large number of cells were used, thus requiring a prohibitively exhaustive PBMC-fractionation and collection process, colony formation in the suspended-PBMC cultures was significantly reduced.
Colony proliferation did not occur at low cell concentrations, even when the cells were allowed to adhere to the wells. Human cells have been cultured at concentration between 1.0 × 1 0 3 and 1.4 × 1 0 6 per ml of the final culture volume [5, 28]. The effects of varying the concentration of human cells were rarely studied, and the concentration of cells that resulted in maximum colony formation was reported in only one of the two studies. Our attempts to culture sheep lymphocytes at concentrations approx, equal to those used for human cells failed. Thus, it became necessary to generate a dose-response curve to determine the optimum number of cells per well. The minimum number of cells (2.5 × 10⁵ per well or 4.5 × 10⁵/ml) that were required for the generation of colonies by sheep lymphocytes was at least twice the numbers commonly used in the human lymphocyte colony assays. Also, the diameter of the wells of the culture plates that we used for sheep cells was usually 2-4 times smaller than the wells of plates that have been used to culture human cells, thus providing less surface area over which the sheep cells could have spread. The optimum number of sheep cells per well was 34 times greater than the number of

26 REGINALD JOHNSON et al.
human cells that were successfully cultured in the same 16 mm dia well [29]. This suggests that much closer contact is required for colonies to be generated from sheep cells.
Evidence for the importance of cell-to-cell contact in lymphocyte colony formation has been demonstrated by showing a strong linear relationship between the number of accessory cells plated and the number of T colonies formed [30]. Interleukin (IL)-I and IL-2 are important mediators in this process [31, 32]. This has been demonstrated by showing that either monocytes or IL-1 released from activated monocytes induced T colony formation, that IL-2 and lymphocyte colony promoting activity were related entities, and by showing that both recombinant and human lymphocyte-derived IL-2 were able to enhance the clonal growth of PBMC [31-33]. In addition, a monoclonal antibody to the IL-2 receptor completely inhibited T-colony formation in PHA-stimulated PBMC, when added directly to the culture system [33].
The relatively high concentration of sheep cells that were required for colonies to form along with the failure of colonies to form when the sheep cells were suspended in the agar suggest that the plating efficiency of sheep cells is lower than that of human cells. A lower number of cells with the capacity to form colonies and lower production and diffusibility of the various interleukins may be the explanation for the reduced plating efficiency of sheep ceils relative to human cells.
The results of this study suggest that the technical parameters for the culture of sheep lymphocytes in soft agar are different both qualitatively and quantitatively from the techniques used for human cells. The reduced plating efficiency required the use of a larger number of cells, the colony size, shape and number varied with the type and dose of mitogen used, adherence of the cells to the plate was essential for colony formation to occur, and fresh autologous serum seemed to have given better responses than either commercially obtained serum of sheep or bovine origin. These technical parameters should be considered during the standardization of the lymphocyte colony assay for cells from other animal species.
The T lymphocyte colony assay is a useful tool for studying aberrations in the cell-mediated immunity of humans. This assay also may be useful for studying diseases involving immunologic disorders restricted to animals as well as disorders of animals that resemble those of humans. The assay has been used by us to study the effect of bovine leukemia virus (BLV) on colony formation by lymphocytes from sheep infected with BLV.
Acknowledgements--Funds were provided by National Institutes of Health Training Grant No. GM-07995-07 for R. Johnson and by a Biomedical Research Support Grant from Michigan State University. The authors thank Dr J. M. Miller and the dissertation committee for advice, and S. Stark, Y. Bryant, M. Hoffman, M. E. Shea and K. Sayles-Winsky for technical assistance.
REFERENCES
1. Rozenszajn L. A., Shoham D. and Kalechman I. Clonal proliferation of PHA-stimulated human lymphocytes in soft agar. Immunology 29, 1041-1055 (1975).
2. Fibach E., Gerassi E. and Sachs L. Induction of colony formation in vitro by human lymphocytes. Nature 259, 127-129 (1976).
3. Riou N., Boizard G., Alcalay D., Goube de LaForest P. and Tanzer J. In citro growth of colonies from human peripheral blood lymphocytes stimulated by phytohemagglutinin. Ann. Immunol. (Inst. Pasteur) 127C, 83 93 (1976).
4. Claesson M. H., Rodger M. B., Johnson G. R., Whittingham S. and Metcalf D. Colony formation by human T lymphocytes in agar medium. Clin. Exp. lmmunol. 28, 526 534 (1977).

Lymphocyte colony assay for sheep lymphocytes 27
5. Shen J., Wilson F., Shifrine M. and Gershwin M. E. Select growth of human T lymphocytes in single phase semisolid culture. J. Immunol. 119, 1299-1305 (1977).
6. Foa R. and Catovsky D. T-lymphocyte colonies in normal blood, bone marrow and lymphoproliferative disorders. Clin. Exp. lmmunoL 36, 488-495 (1979).
7. Goube de Laforest P., Lasmayous-riou N., Alcalay D. and Tanzer J. Growth characteristic of PHA-induced colonies in primary and secondary agar culture. Immunology 35, 917-922 (1979).
8. Triebel F.0 Robinson W. A., Hayward A. R. and Goube de LaForest P. Characterization of the T lymphocyte colony-forming cells and evidence for the acquisition of T cell markers in the absence of the thymic microenvironment in man. J. Immunol. 126, 2020-2023 (1981).
9. Mossalayi M. D., Goube de Laforest P., Guilhot F., Lemaire M., Larroque V. and Tanzer J. Self-renewal and maturation of immature T-cell progenitors within PHA-induced agar T-cell colonies. Int. J. Cell Cloning 2, 34 36 (1984).
10. Goube de Laforest P. and Rozenszajn L. A. Meeting report on T-cell colony growth in semisolid media: significance and possible applications. Int. J. Cell Cloning 2, 47~66 (1984).
11. Winkelstein A., Bernstein M. L., Stevens M. A., Rodnan G. P., Medsger T. A. and Dodson S. A. Reduced T lymphoid colony growth in patients with progressive systemicsclerosis and rheumatoid arthritis. J. Lab. Clin. Med. 100, 240-247 (1982).
12. Wilson J. D. and Dalton G. Human T lymphocyte colonies in agar: a comparison with other T cell assays in healthy subjects and cancer patients. AJEBAK 54, 27 34 (1976).
13. Carvajal J., Rivas A., Ponce D. P. and Bianco N, E. Proliferative response in solid culture of T cells from patients with extrinsic bronchial asthma. Immunol. Invest. 15, 6 I-71 (1986).
14. Bosly A. E., Staquet P. J., Doyen C. M., Chatelain B. E., Humblet Y. P. and Symann M. L. Recombinant human interleukin-2 restores in vitro T-cell colony formation by peripheral blood mononuclear cells after autologous bone marrow transplantation. Exp. Hematol. 15, 1048-1054 (1987).
15. Farcet J. P. and Testa U. Human primary lymphocyte colony formation in agar culture: polyclonal origin and significance. Exp. Hematol. 10, 172-177 (1982).
16. Foa R., Fierro M. T,, Giovarelli M., Lusso P., Benetton G., Bonferroni M. and Forni G. Immunoregulatory T-cell defects in B-cell chronic lymphocytic leukemia: cause or consequence of the disease? the contributory role of decreased availability of Interleukin 2 (IL-2). Blood Cells 12, 399-412 (1987).
17. Browman G., Goldberg J., Gottlieb A. J., Priesler H. D. and Azarnia N. The clonogenic assay as a reproducible in vitro system to study predictive parameters of treatment outcome in acute nonlymphoblastic leukemia. Am. J. Hematol. 15, 227 235 (1983).
18. Winkelstein A. The effects ofcyclosporin and hydrocortisone on human T lymphocyte colony formation. Cell. lmmunol. 86, 413-420 (1984).
19. Taetle T., To D. and Mendelsohn J. In vitro sensitivity to steroid hormones and cytotoxic agents ofnorrnal and malignant lymphocyte colony-forming cells. Cancer Res. 43, 3553-3558 (1983).
20. Woods G. M. and Lowenthal R. M. Cellular interactions and IL2 requirements of PHA-induced human T-lymphocyte colonies. Exp. Hematol. 12, 301-308 (1984).
21. Miyasaka M. and Trnka Z. She•p as an experimenta• m•de• f•r immun•l•gy: immun•••gica• techniques in vitr• and in vivo. In Immunological Methods Volume 111 (Edited by Lefkovits J. and Pernis B.), pp. 403-425. Academic Press, Orlando, Fla (1985).
22. Ezaki T., Parisot R., Dudler L., Beya M. F., Miyasaka M. and Trnka Z. Monoclonal antibodies to surface markers which define functional subsets of sheep T lymphocytes. In Immunology of the Sheep (Edited by Morris B. and Miyasaka M.) 88, LaRoche & Co, Basle, Switzerland (1985).
23. MicroTSP, Quantitative Microsoftware Inc., Irvine, Calif. 24. Petersen R. G. Design and Analysis of Experiments. Marcel Dekker, New York 309 (1985). 25. Software Publishing Corporation, 1901 Landings Drive, P.O. Box 7210, Mountain View, CA, 94039-7219. 26. SAS User's Guide: Basics Version 5 Edition, SAS Institute Inc., Cary, N.C. (1981). 27. Gerassi E. and Sachs L. Regulation of the induction of colonies in vitro by normal human lymphocytes. Proc.
Natn. Acad. Sci. U.S.A. 73, 4546-4550 (1976). 28. Rozenszajn L. A., Goldman I., Kalechman Y., Michlin H., Sredni B., Zeevi A. and Shoham D. T-lymphocyte
colony growth in vitro: factors modulating clonal expansion. Immunol. Rev. 54, 157-186 (1981 ). 29. Mossalayi M. D., Lecron J. C., Tanzer J. and Goube de Laforest P. Relationship between IL-2 and human T
cell colony formation. Clin. Exp. lmmunol. 65, 532-538 (1986). 30. Farcet J., Oudhriri N., Gourdin M. F., Bouguet K., Fradelizi D. and Reyes F. Heterogenous accessory cell
requirement for human peripheral blood T lymphocyte activation by PHA into IL-2-responsive colony forming cells. Cell. Immunol. 87, 167 176 (1984).
31. Klein B., Rey A., Jourdan M. and Serrou B. The role of interleukin I and interleukin 2 in human T colony formation. Cell. Immunol. 77, 348 (1983).
32. Winkelstein A., Simon P. L., Wood D., Machen L. L., Shadduck R. K. and Waheed A. The effects of interleukins and soluble factors on T lymphocyte colony formation. Immunology 58, 173-177 (1986).
33. Jourdan M., Commes T. and Klein B, Control of human T-colony formation by interleukin-2. Immunology 5,1, 249-253 (1985).