Embed Size (px)
Citation preview
EUROGRAPHICS 2001 / A. Chalmers and T.-M. Rhyne(Guest Editors)
Volume 20 (2001 ), Number 3
A low cost 3D scanner based on structured light
C. Rocchini, P. Cignoni, C. Montani, P. Pingi and R. Scopigno†
Istituto di Scienza e Tecnologie dell’Informazione (ISTI)‡ – Consiglio Nazionale delle Ricerche, C.N.R., Pisa, Italy
AbstractAutomatic 3D acquisition devices (often called 3D scanners) allow to build highly accurate modelsof real 3D objects in a cost- and time-effective manner. We have experimented this technology ina particular application context: the acquisition of Cultural Heritage artefacts. Specific needs of thisdomain are: medium-high accuracy, easy of use, affordable cost of the scanning device, self-registeredacquisition of shape and color data, and finally operational safety for both the operator and the scannedartefacts. According to these requirements, we designed a low-cost 3D scanner based on structured lightwhich adopts a new, versatile colored stripe pattern approach. We present the scanner architecture, thesoftware technologies adopted, and the first results of its use in a project regarding the 3D acquisitionof an archeological statue.
1. Introduction
Classical 3D modeling tools result inadequate tomodel the shape of the art works of interest in Cul-tural Heritage applications. This is both due to theshape complexity of most artefacts (e.g. sculptures)and also to the accuracy requested. The 3D model inmany cases should not only look visually similar to thereal object, but should also be very accurate, from ageometrical point of view. This to allow a number ofimportant uses, such as the construction of 3D cata-logues, the automatic reproduction of copies, the useof 3D models in the context of restoration plans, etc.3D scanning technology has been adopted in a num-ber of recent projects in the framework of CulturalHeritage. Just to give some examples, we may cite theDigital Michelangelo Project of the Stanford Univer-sity 15, the acquisition of a Michelangelo’s Pieta by ateam of the IBM T.J. Watson Research Center 19, orthe acquisition of a section of the Coliseum in Rome 11.3D scanning technology evolved in the last few years,but unfortunately not as fast as expected. One criti-cal problem is still the high cost of high quality scan-
† Email: {rocchini, cignoni, montani, pingi}@iei.pi.cnr.it,[email protected]‡ Via G. Moruzzi 1, 56124 Pisa, ITALY
ning devices. A good scanner, able to produce dataat the accuracy required by the class of applicationswe are dealing with, often costs more than 100K US$,and therefore some recent scanning projects requiredvery high budgets 15. This could discourage the use of3D scanning in many Cultural Heritage institutions.Therefore, we investigated an alternative design fora low cost and medium quality optical scanner. Ourscanner has been designed to fulfill the following goals:
• use only consumer technology, to ensure affordablehardware cost and a very fast technological advance;
• support sufficient accuracy and resolution, i.e. sit-uating midway between commercial low cost laserscanners and high quality ones;
• ensure easy of use and flexibility.
The scanner has been designed around two verycommon electronic devices: a video projector anda digital still camera. A video projector is used toproject structured light patterns on the object to bescanned. The digital still camera is used to acquireimages of the object under structured lighting. Bothdevices are driven by a software tool running on astandard PC, which produces the series of patternsprojected by the emitter and drives the camera. Pho-tos are taken, to acquire: images of the distorted pat-terns (from which the geometry is reconstructed), and
c© The Eurographics Association and Blackwell Publishers 2001.
Published by Blackwell Publishers, 108 Cowley Road, Oxford OX4
1JF, UK and 350 Main Street, Malden, MA 02148, USA.
Rocchini, Cignoni, Montani, Pingi and Scopigno / A low cost 3D scanner
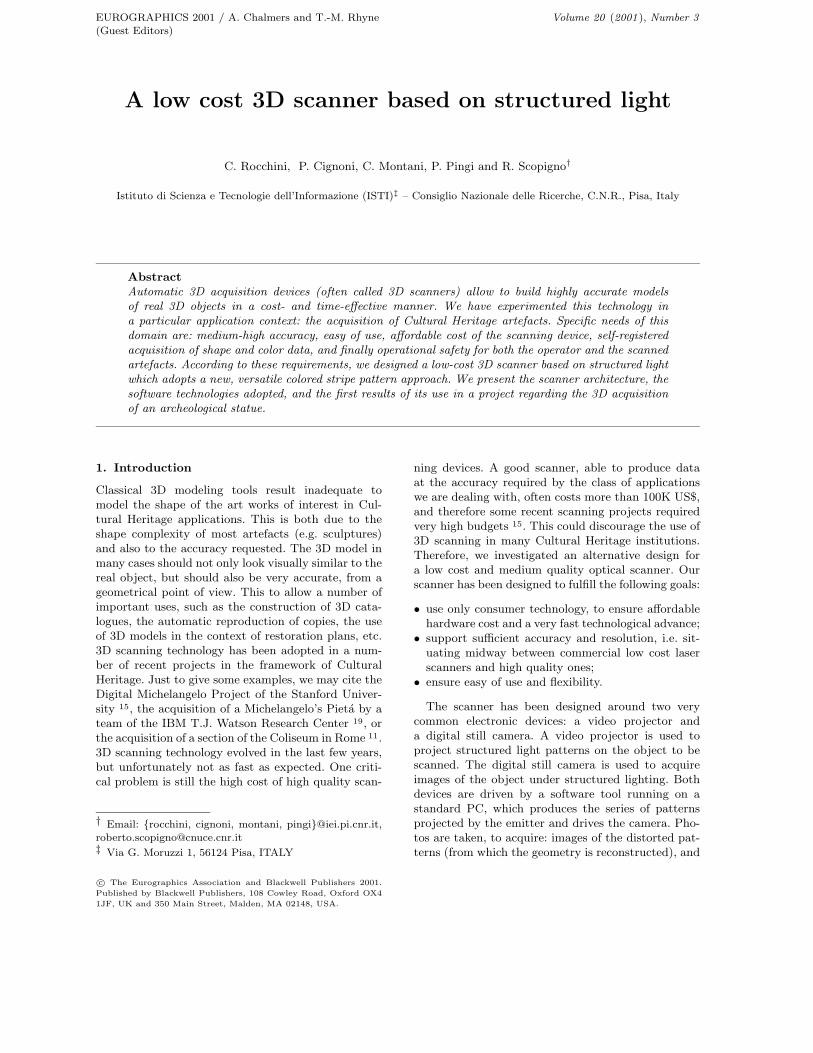
Figure 1: The low cost 3D scanner developed at CNR, based on structured light and consumer electronic technology.
images of the object under different illumination con-ditions (from which the illumination-invariant color,or albedo, of the object surface is reconstructed). Thecolor images by definition are self-registered with thegeometry (the range maps). The global system, de-picted in Figure 1, is able to produce: a range mapof each selected surface portion, with sample den-sity of 0.7 mm in Y axis and 1.4 mm in the X axis(when a 1024*768 video projector is used, locatedapproximately at 1.3 meters from the artifact); anillumination-invariant color texture (aligned with thecorresponding range map) which represents the pic-torial detail present on the acquired surface section.A limitation of our system, common to all methodswhich project a series of patterns, is that the sceneshould be static within the acquisition period.
The paper is organized as follows. A brief overviewand characterization of 3D scanning technologies ispresented in Section 2. The architecture of the pro-posed scanner is described in detail in Section 3. Thedevice has been tested and evaluated in the frameworkof a complex 3D scanning session; the results are re-ported in Section 4. Finally, concluding remarks andpossible extensions are presented in Section 5.
2. Previous work
Range scanning technology has evolved in a consider-able manner in the last few years. A complete overviewof the field, covering both hardware and software is-sues, is available in a couple of recent papers 2, 10.Many different systems have been proposed; a com-
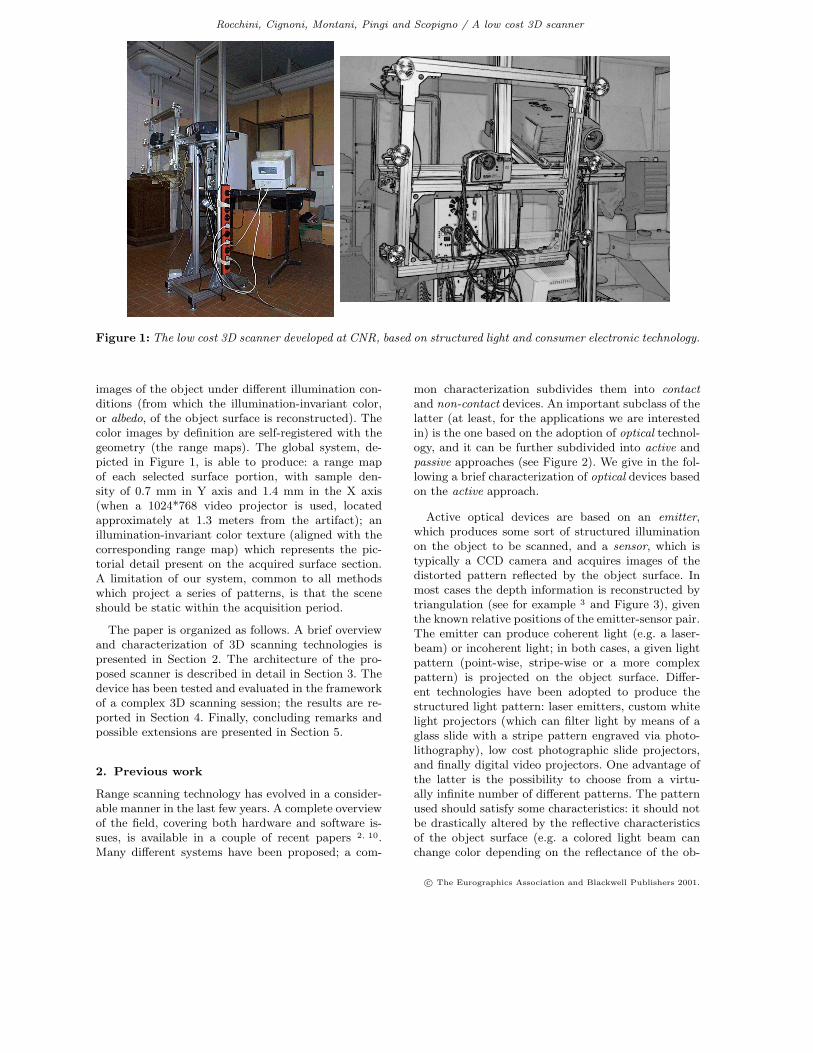
mon characterization subdivides them into contactand non-contact devices. An important subclass of thelatter (at least, for the applications we are interestedin) is the one based on the adoption of optical technol-ogy, and it can be further subdivided into active andpassive approaches (see Figure 2). We give in the fol-lowing a brief characterization of optical devices basedon the active approach.
Active optical devices are based on an emitter,which produces some sort of structured illuminationon the object to be scanned, and a sensor, which istypically a CCD camera and acquires images of thedistorted pattern reflected by the object surface. Inmost cases the depth information is reconstructed bytriangulation (see for example 3 and Figure 3), giventhe known relative positions of the emitter-sensor pair.The emitter can produce coherent light (e.g. a laser-beam) or incoherent light; in both cases, a given lightpattern (point-wise, stripe-wise or a more complexpattern) is projected on the object surface. Differ-ent technologies have been adopted to produce thestructured light pattern: laser emitters, custom whitelight projectors (which can filter light by means of aglass slide with a stripe pattern engraved via photo-lithography), low cost photographic slide projectors,and finally digital video projectors. One advantage ofthe latter is the possibility to choose from a virtu-ally infinite number of different patterns. The patternused should satisfy some characteristics: it should notbe drastically altered by the reflective characteristicsof the object surface (e.g. a colored light beam canchange color depending on the reflectance of the ob-
c© The Eurographics Association and Blackwell Publishers 2001.
Rocchini, Cignoni, Montani, Pingi and Scopigno / A low cost 3D scanner
Figure 2: A taxonomy of the systems for the auto-matic or semi-automatic acquisition of the shape ofreal 3D objects, according to 10.
Figure 3: A scheme of a typical optical scanner, wherethe 3D positions of the sampled points are computedby triangulation given the sampled point projectionP (a) on the sensor plane and the known relative posi-tion/orientation of the emitter and the sensor.
ject surface); the detection of its constituent features(e.g. points or lines) from the reflected image shouldbe easy and accurate; the reconstruction of the in-dexing of the features contained in the pattern (e.g.re-indexing the reflected stripes with respect to the
original order in a stripe-based pattern produced bythe emitter) should also be easy and accurate.
If we know exactly the position of the emitter w.r.t.the sensor (or viceversa), pairing the sampled cam-era pixels with the corresponding location on the lightpattern is sufficient to reconstruct the spatial locationof the corresponding point on the object surface. Thereconstruction method is in general directly relatedwith the characteristics of the pattern adopted. Thesimplest solution is to shoot in each instant of time asingle light plane (e.g. the solution adopted by mostlaser-based devices), which draws a single profile onthe scanned surface. Other solutions tend to acceler-ate the ranging process by projecting multiple beamsor planes of light (e.g. series of stripes). However, thereconstruction of a multiple feature pattern is slightlymore complex than the reconstruction of a single fea-ture pattern. The sequence in which these features arereflected is not necessarily the same as that projected,because it depends on the local scanned surface topol-ogy and curvature. Therefore, a possible ambiguityarises in the identification of complex patterns, e.g.multi-stripes patterns. Some methods work only un-der the strong assumption of spatial coherence of theobject surface. In the case of methods based on theprojection of a single B/W multi-stripe pattern 20,a correct reconstruction of the stripe order from thereflected image is possible only if the observed sur-face section does not contain self-occlusions or discon-nected components. This is due to the different inci-dent angle of the emitter and the sensor: some of thereflected stripes can be occluded and are missing inthe acquired CCD image. In this case the disappearedstripes can originate a wrong stripe re-indexing. Thisproblem is often prevented by the use of either color-encoded stripes 4, 7 or set of different patterns pro-jected sequentially on a static object 16, 20; the latterapproach is called spatio-temporal modulation of theillumination, and an example of a possible solution ispresented in Figure 4. Several methods have been pro-posed in literature, and a few of them are discussed inthe following Section 3.1.
3. A low cost 3D scanning tool
In the design of our low-cost scanner, we chose to im-plement the emitter unit by using a standard videoprojector. The reason was the flexibility of this device(which allows to experiment any type of light pat-tern) and its wide availability. A similar choice wasalso done in 6. The sensor can be either a custom de-vice, a standard digital still camera or a video camera.In our project the requirements of the sensor deviceare:
• it must support high quality color capture (i.e. ac-
c© The Eurographics Association and Blackwell Publishers 2001.
Rocchini, Cignoni, Montani, Pingi and Scopigno / A low cost 3D scanner
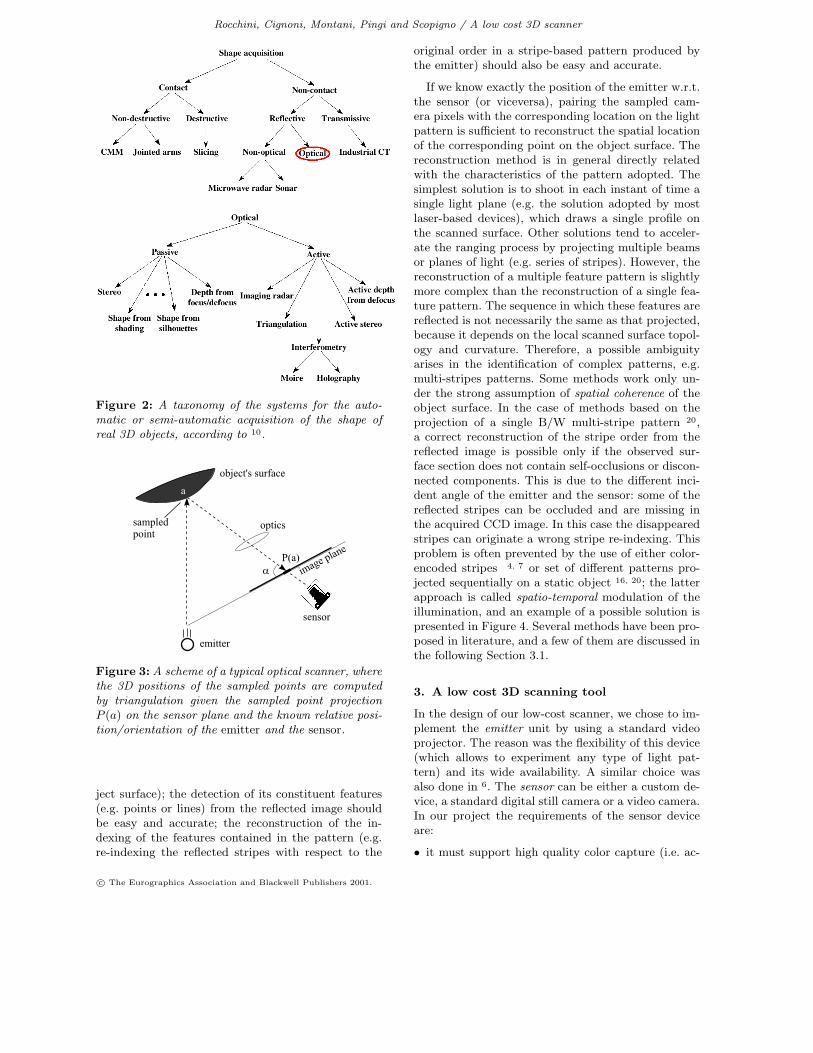
Figure 4: An example of a B/W binary pattern ofstripes projected on the Minerva case study.
quisition of high dynamic range) and possibly itshould not perform lossy compression of the imagescaptured;
• the resolution of the image should be as high aspossible (at least, not less than the resolution of thevideo projector);
• it should be driven by computer, possibly by givingaccess to the exposition and shutter time parame-ters.
We chose to use a digital still camera because wegave priority to the resolution and image quality ofthe sensor device. Off-the-shelf digital cameras offermuch higher resolution than standard consumer dig-ital video cameras. The disadvantage is that imageacquisition (and transmission to the computer) is ingeneral slower. Finally, a personal computer generatesthe multiple patters, drives the digital camera (com-mands to acquire each image and to transmit it to thePC), and carries out the shape and color reconstruc-tion task.
3.1. Structured light: evaluation of differentpatterns
One advantage of using a video projector to producea structured light pattern is that we can easily exper-iment and evaluate different patterns. Some classicalrange finders use a single multi-stripe pattern 20. Aswe pointed out previously, the disadvantage of thisapproach is that if the object has a complex topol-ogy and self-occlusions in the line of sight direction,then we can have ambiguous stripe configurations, andstripe indexing could become not easy. The term stripeindexing indicates the reconstruction of the ordinalplacement, i.e. a match between each detected stripein the image plane and the projected stripe whichcaused that reflected pattern. Some methods have cov-ered this problem by encoding the stripes using mul-tiple colors 4. However, if indexing depends heavilyon color matching, stripe detection error can be eas-ily produced by surfaces with non-neutral color (e.g.non-uniformly painted surfaces). Other approaches
make use of multiple sensors (e.g. acquisition of stereopairs 7 or multiple images).
The indexing problem can be solved by using a se-ries of images, produced in a number of steps by bi-nary subdivision of a binary pattern 16, 23, 20, or byusing intensity-modulated gray-level images 5, 12, 13.The first implementation of our system used a stan-dard binary pattern, composed of black and whitestripes which were subdivided recursively until theprojector resolution was reached. An example of thisseries of images is shown in Figure 4. A Gray code isassociated to each light plane, and each illuminationpattern represents one of the bits of the Gray codelabels (the number of projected patterns is thereforeequal to the number of bits needed to index the lightstripes at the requested resolution). Stripe recognitionis thus implemented using a progressive approach: thenew stripes detected in image k are recognized andindexed on the base of the knowledge acquired whilereconstructing images [1, .. k−1]. This approach needsa very precise alignment of the patterns 4 which madeits practical implementation difficult in the past butvery easy nowadays because video projector can sup-port a precise alignment of the projected frames.
An improved solution has been implemented andtested in the current version of our scanner, based onthe use of colored patterns. For each step we divideeach region in two subregions, drawing a one-pixel-wide green line in the middle of the region and assign-ing red or blue colors to the points on the left and onthe right of this dividing line (an example of the re-cursive process is in Figure 5*). The adoption of thisnew hybrid approach, which uses colored bands andlines, has some advantages. The colored bands allowto reconstruct easily the Gray code and the indexingof the single vertical lines (the green ones). Shape re-construction is operated by extracting from the imagethe center line of a thin green line (which is analo-gous to the approach used in laser scanning), insteadof detecting the discontinuity between two regions ofdifferent color. The latter solution has the disadvan-tage of being less precise due to the widening effectthat a brighter light band has towards a darker one:the CCD response shifts the discontinuity border to-wards the darker band. Conversely, a bright green linecan be slightly widened by the CCD, but its medialaxis remains correct if the brightness of the two sur-rounding bands is approximately the same.
3.2. Scanner calibration
The initialization phase concerns the calibration of thescanning unit with respect to the object to be ac-quired, i.e. with respect to a given acquisition volume.It has to be performed only when the respective loca-
c© The Eurographics Association and Blackwell Publishers 2001.

Rocchini, Cignoni, Montani, Pingi and Scopigno / A low cost 3D scanner
Figure 5: * The set of RGB patterns adopted, pro-duced by recursive subdivision.
tion of the scanning unit and the object vary. Systemcalibration entails:
• Camera intrinsic calibration. It is done once, af-ter fixing: focus, zoom and exposition (diaframma)of the camera. It detects the intrinsic parameters ofthe camera: focus distance, perspective focus, radialdistortion;
• Projector intrinsic calibration. It is done once,after fixing projector’s focus and zoom. It detectsthe 3D parameters of the set of planes generated byeach projector’s vertical line of pixels;
• Overall system calibration. It is a by product ofthe previous steps, and returns the roto-translationof the projector with respect to the camera.
The camera calibration is performed by acquiring acalibration panel (see Figure 6) which is put in a setof known position in the scene such that the entireacquisition volume is swept by the planar calibration
Figure 6: An image of the calibration panel is on theleft; the calibration pattern after filtering and quantiza-tion is on the right, and finally the recognized markerpositions are in the bottom image.
panel†. The calibration panel contains a set of mark-ers, with known relative position, and it is lighted witha uniform white light. The markers are detected fromthe acquired image as follows: the input image is fil-tered and quantized in an adaptive manner; the mark-ers (circle + bar code) are detected; for each marker wecompute the circle baricenter and the principal axesof the projected elliptical shape (with sub-pixel accu-racy); finally, each marker is indexed by decoding theassociated bar code.
Therefore, for each marker center point we have thereconstructed image coordinates (u, v) and the asso-ciated known coordinates in the probe plane. Given asmall set of these corresponding pairs, the camera cali-bration can be computed using the approach proposedby Tsai 21, 22.
The projector calibration is performed by acquiringthe same calibration panel lighted with our structuredlight patterns and placed in two unknown different po-sitions in the scanning volume‡. First, the 3D location
† Please note that this calibration step has to be performedonly once for a given selected camera. This calibration isgenerally performed in the lab, using a track gantry whichallows to sweep the calibration probe precisely in the space,passing through a discrete set of known positions.‡ In contrast with the first calibration step, projector cali-bration is usually performed on site, just before the actualacquisition starts. In this case the calibration panel is po-sitioned in the space by hand, in the approximate locationof the surface that has to be acquired.
c© The Eurographics Association and Blackwell Publishers 2001.
Rocchini, Cignoni, Montani, Pingi and Scopigno / A low cost 3D scanner
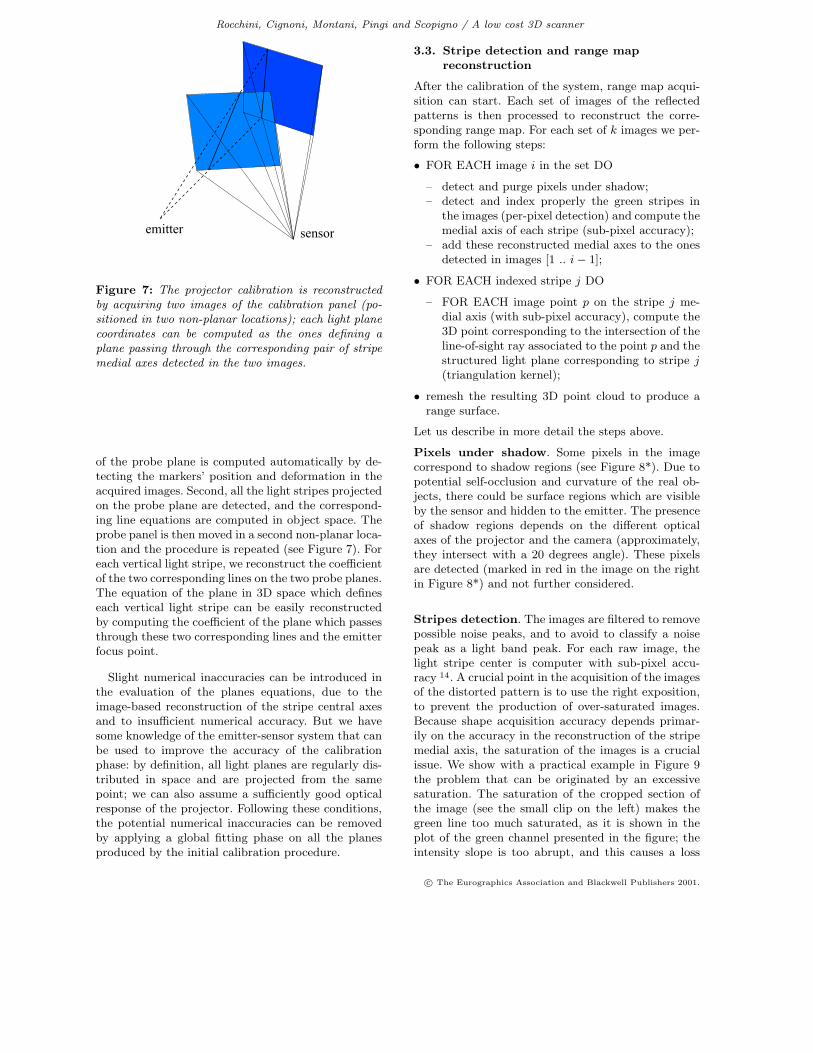
Figure 7: The projector calibration is reconstructedby acquiring two images of the calibration panel (po-sitioned in two non-planar locations); each light planecoordinates can be computed as the ones defining aplane passing through the corresponding pair of stripemedial axes detected in the two images.
of the probe plane is computed automatically by de-tecting the markers’ position and deformation in theacquired images. Second, all the light stripes projectedon the probe plane are detected, and the correspond-ing line equations are computed in object space. Theprobe panel is then moved in a second non-planar loca-tion and the procedure is repeated (see Figure 7). Foreach vertical light stripe, we reconstruct the coefficientof the two corresponding lines on the two probe planes.The equation of the plane in 3D space which defineseach vertical light stripe can be easily reconstructedby computing the coefficient of the plane which passesthrough these two corresponding lines and the emitterfocus point.
Slight numerical inaccuracies can be introduced inthe evaluation of the planes equations, due to theimage-based reconstruction of the stripe central axesand to insufficient numerical accuracy. But we havesome knowledge of the emitter-sensor system that canbe used to improve the accuracy of the calibrationphase: by definition, all light planes are regularly dis-tributed in space and are projected from the samepoint; we can also assume a sufficiently good opticalresponse of the projector. Following these conditions,the potential numerical inaccuracies can be removedby applying a global fitting phase on all the planesproduced by the initial calibration procedure.
3.3. Stripe detection and range mapreconstruction
After the calibration of the system, range map acqui-sition can start. Each set of images of the reflectedpatterns is then processed to reconstruct the corre-sponding range map. For each set of k images we per-form the following steps:
• FOR EACH image i in the set DO
– detect and purge pixels under shadow;– detect and index properly the green stripes in
the images (per-pixel detection) and compute themedial axis of each stripe (sub-pixel accuracy);
– add these reconstructed medial axes to the onesdetected in images [1 .. i − 1];
• FOR EACH indexed stripe j DO
– FOR EACH image point p on the stripe j me-dial axis (with sub-pixel accuracy), compute the3D point corresponding to the intersection of theline-of-sight ray associated to the point p and thestructured light plane corresponding to stripe j(triangulation kernel);
• remesh the resulting 3D point cloud to produce arange surface.
Let us describe in more detail the steps above.
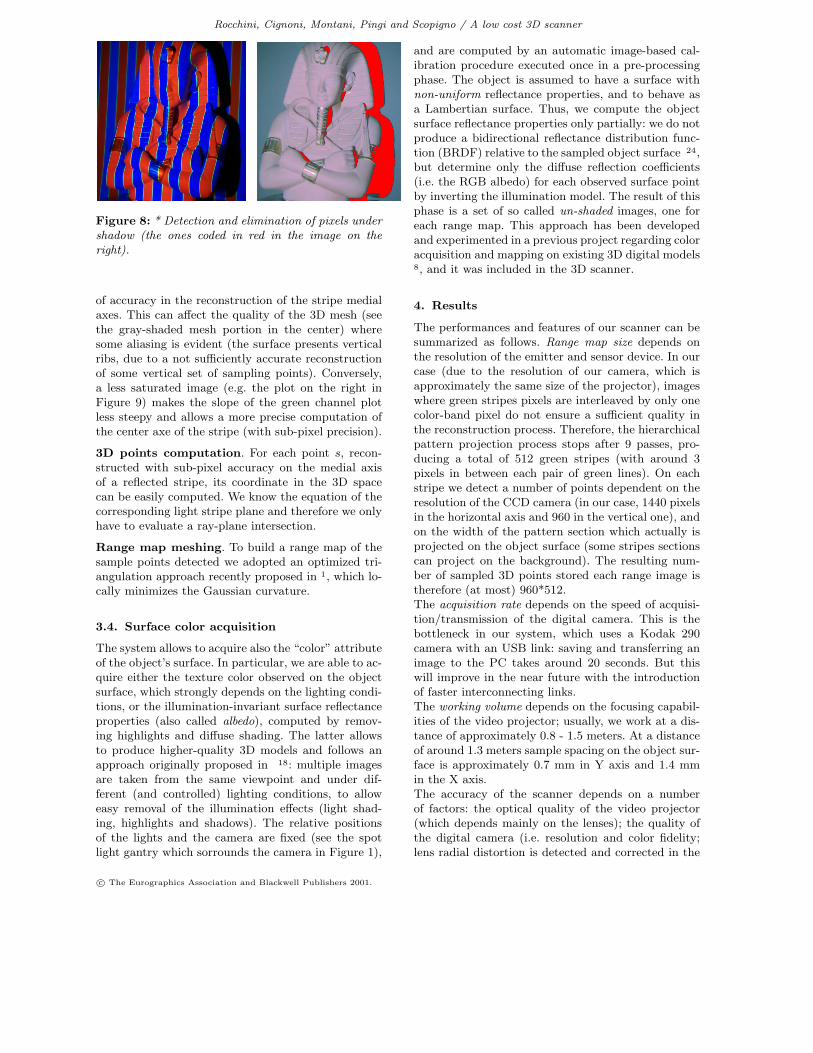
Pixels under shadow. Some pixels in the imagecorrespond to shadow regions (see Figure 8*). Due topotential self-occlusion and curvature of the real ob-jects, there could be surface regions which are visibleby the sensor and hidden to the emitter. The presenceof shadow regions depends on the different opticalaxes of the projector and the camera (approximately,they intersect with a 20 degrees angle). These pixelsare detected (marked in red in the image on the rightin Figure 8*) and not further considered.
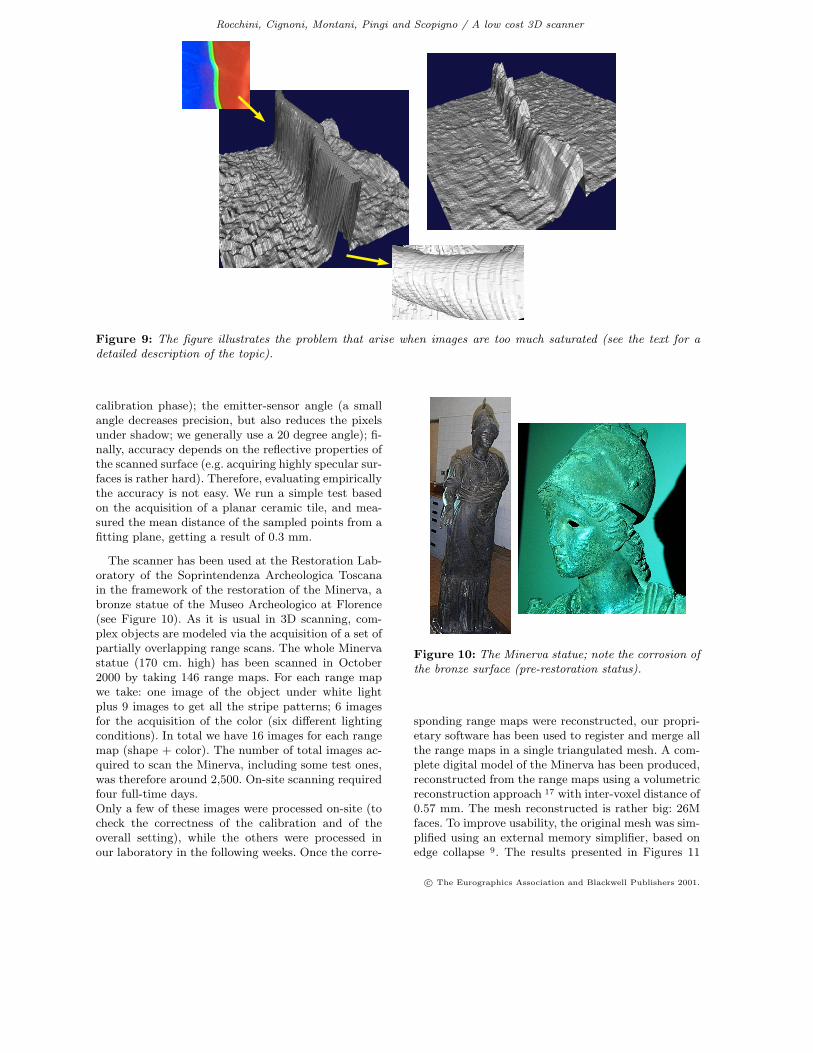
Stripes detection. The images are filtered to removepossible noise peaks, and to avoid to classify a noisepeak as a light band peak. For each raw image, thelight stripe center is computer with sub-pixel accu-racy 14. A crucial point in the acquisition of the imagesof the distorted pattern is to use the right exposition,to prevent the production of over-saturated images.Because shape acquisition accuracy depends primar-ily on the accuracy in the reconstruction of the stripemedial axis, the saturation of the images is a crucialissue. We show with a practical example in Figure 9the problem that can be originated by an excessivesaturation. The saturation of the cropped section ofthe image (see the small clip on the left) makes thegreen line too much saturated, as it is shown in theplot of the green channel presented in the figure; theintensity slope is too abrupt, and this causes a loss
c© The Eurographics Association and Blackwell Publishers 2001.
Rocchini, Cignoni, Montani, Pingi and Scopigno / A low cost 3D scanner
Figure 8: * Detection and elimination of pixels undershadow (the ones coded in red in the image on theright).
of accuracy in the reconstruction of the stripe medialaxes. This can affect the quality of the 3D mesh (seethe gray-shaded mesh portion in the center) wheresome aliasing is evident (the surface presents verticalribs, due to a not sufficiently accurate reconstructionof some vertical set of sampling points). Conversely,a less saturated image (e.g. the plot on the right inFigure 9) makes the slope of the green channel plotless steepy and allows a more precise computation ofthe center axe of the stripe (with sub-pixel precision).
3D points computation. For each point s, recon-structed with sub-pixel accuracy on the medial axisof a reflected stripe, its coordinate in the 3D spacecan be easily computed. We know the equation of thecorresponding light stripe plane and therefore we onlyhave to evaluate a ray-plane intersection.
Range map meshing. To build a range map of thesample points detected we adopted an optimized tri-angulation approach recently proposed in 1, which lo-cally minimizes the Gaussian curvature.
3.4. Surface color acquisition
The system allows to acquire also the “color” attributeof the object’s surface. In particular, we are able to ac-quire either the texture color observed on the objectsurface, which strongly depends on the lighting condi-tions, or the illumination-invariant surface reflectanceproperties (also called albedo), computed by remov-ing highlights and diffuse shading. The latter allowsto produce higher-quality 3D models and follows anapproach originally proposed in 18: multiple imagesare taken from the same viewpoint and under dif-ferent (and controlled) lighting conditions, to alloweasy removal of the illumination effects (light shad-ing, highlights and shadows). The relative positionsof the lights and the camera are fixed (see the spotlight gantry which sorrounds the camera in Figure 1),
and are computed by an automatic image-based cal-ibration procedure executed once in a pre-processingphase. The object is assumed to have a surface withnon-uniform reflectance properties, and to behave asa Lambertian surface. Thus, we compute the objectsurface reflectance properties only partially: we do notproduce a bidirectional reflectance distribution func-tion (BRDF) relative to the sampled object surface 24,but determine only the diffuse reflection coefficients(i.e. the RGB albedo) for each observed surface pointby inverting the illumination model. The result of thisphase is a set of so called un-shaded images, one foreach range map. This approach has been developedand experimented in a previous project regarding coloracquisition and mapping on existing 3D digital models8, and it was included in the 3D scanner.
4. Results
The performances and features of our scanner can besummarized as follows. Range map size depends onthe resolution of the emitter and sensor device. In ourcase (due to the resolution of our camera, which isapproximately the same size of the projector), imageswhere green stripes pixels are interleaved by only onecolor-band pixel do not ensure a sufficient quality inthe reconstruction process. Therefore, the hierarchicalpattern projection process stops after 9 passes, pro-ducing a total of 512 green stripes (with around 3pixels in between each pair of green lines). On eachstripe we detect a number of points dependent on theresolution of the CCD camera (in our case, 1440 pixelsin the horizontal axis and 960 in the vertical one), andon the width of the pattern section which actually isprojected on the object surface (some stripes sectionscan project on the background). The resulting num-ber of sampled 3D points stored each range image istherefore (at most) 960*512.The acquisition rate depends on the speed of acquisi-tion/transmission of the digital camera. This is thebottleneck in our system, which uses a Kodak 290camera with an USB link: saving and transferring animage to the PC takes around 20 seconds. But thiswill improve in the near future with the introductionof faster interconnecting links.The working volume depends on the focusing capabil-ities of the video projector; usually, we work at a dis-tance of approximately 0.8 - 1.5 meters. At a distanceof around 1.3 meters sample spacing on the object sur-face is approximately 0.7 mm in Y axis and 1.4 mmin the X axis.The accuracy of the scanner depends on a numberof factors: the optical quality of the video projector(which depends mainly on the lenses); the quality ofthe digital camera (i.e. resolution and color fidelity;lens radial distortion is detected and corrected in the
c© The Eurographics Association and Blackwell Publishers 2001.
Rocchini, Cignoni, Montani, Pingi and Scopigno / A low cost 3D scanner
Figure 9: The figure illustrates the problem that arise when images are too much saturated (see the text for adetailed description of the topic).
calibration phase); the emitter-sensor angle (a smallangle decreases precision, but also reduces the pixelsunder shadow; we generally use a 20 degree angle); fi-nally, accuracy depends on the reflective properties ofthe scanned surface (e.g. acquiring highly specular sur-faces is rather hard). Therefore, evaluating empiricallythe accuracy is not easy. We run a simple test basedon the acquisition of a planar ceramic tile, and mea-sured the mean distance of the sampled points from afitting plane, getting a result of 0.3 mm.
The scanner has been used at the Restoration Lab-oratory of the Soprintendenza Archeologica Toscanain the framework of the restoration of the Minerva, abronze statue of the Museo Archeologico at Florence(see Figure 10). As it is usual in 3D scanning, com-plex objects are modeled via the acquisition of a set ofpartially overlapping range scans. The whole Minervastatue (170 cm. high) has been scanned in October2000 by taking 146 range maps. For each range mapwe take: one image of the object under white lightplus 9 images to get all the stripe patterns; 6 imagesfor the acquisition of the color (six different lightingconditions). In total we have 16 images for each rangemap (shape + color). The number of total images ac-quired to scan the Minerva, including some test ones,was therefore around 2,500. On-site scanning requiredfour full-time days.Only a few of these images were processed on-site (tocheck the correctness of the calibration and of theoverall setting), while the others were processed inour laboratory in the following weeks. Once the corre-
Figure 10: The Minerva statue; note the corrosion ofthe bronze surface (pre-restoration status).
sponding range maps were reconstructed, our propri-etary software has been used to register and merge allthe range maps in a single triangulated mesh. A com-plete digital model of the Minerva has been produced,reconstructed from the range maps using a volumetricreconstruction approach 17 with inter-voxel distance of0.57 mm. The mesh reconstructed is rather big: 26Mfaces. To improve usability, the original mesh was sim-plified using an external memory simplifier, based onedge collapse 9. The results presented in Figures 11
c© The Eurographics Association and Blackwell Publishers 2001.
Rocchini, Cignoni, Montani, Pingi and Scopigno / A low cost 3D scanner
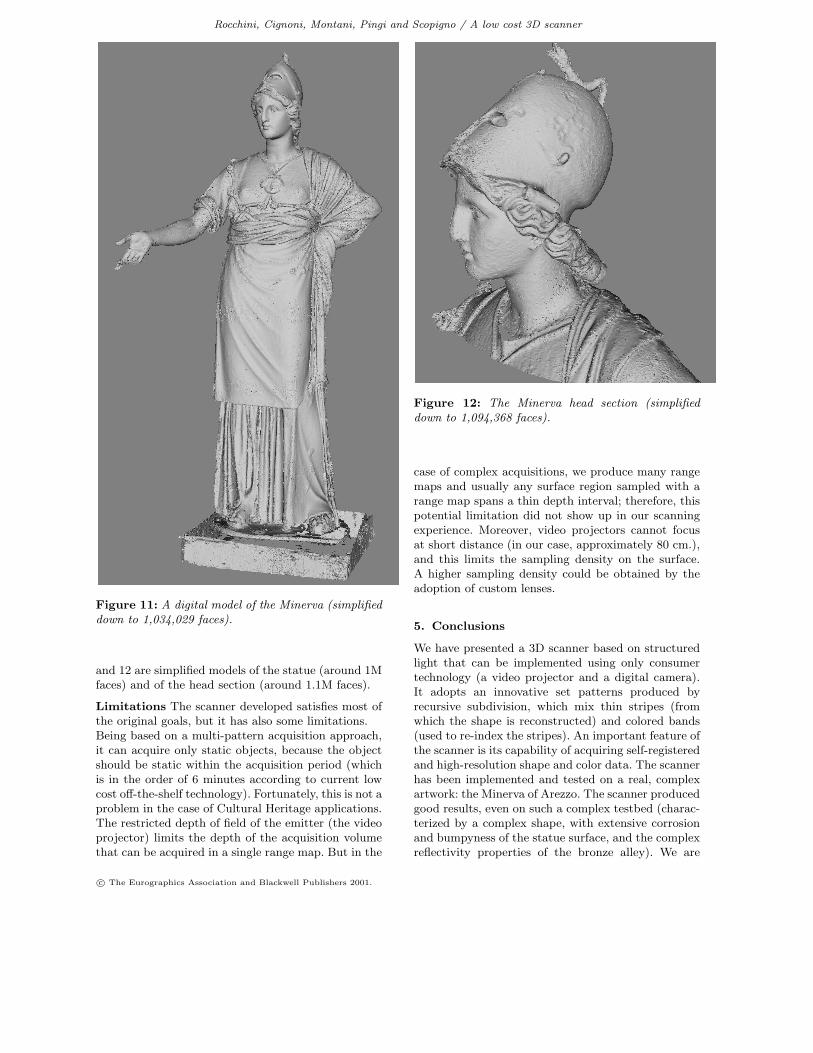
Figure 11: A digital model of the Minerva (simplifieddown to 1,034,029 faces).
and 12 are simplified models of the statue (around 1Mfaces) and of the head section (around 1.1M faces).
Limitations The scanner developed satisfies most ofthe original goals, but it has also some limitations.Being based on a multi-pattern acquisition approach,it can acquire only static objects, because the objectshould be static within the acquisition period (whichis in the order of 6 minutes according to current lowcost off-the-shelf technology). Fortunately, this is not aproblem in the case of Cultural Heritage applications.The restricted depth of field of the emitter (the videoprojector) limits the depth of the acquisition volumethat can be acquired in a single range map. But in the
Figure 12: The Minerva head section (simplifieddown to 1,094,368 faces).
case of complex acquisitions, we produce many rangemaps and usually any surface region sampled with arange map spans a thin depth interval; therefore, thispotential limitation did not show up in our scanningexperience. Moreover, video projectors cannot focusat short distance (in our case, approximately 80 cm.),and this limits the sampling density on the surface.A higher sampling density could be obtained by theadoption of custom lenses.
5. Conclusions
We have presented a 3D scanner based on structuredlight that can be implemented using only consumertechnology (a video projector and a digital camera).It adopts an innovative set patterns produced byrecursive subdivision, which mix thin stripes (fromwhich the shape is reconstructed) and colored bands(used to re-index the stripes). An important feature ofthe scanner is its capability of acquiring self-registeredand high-resolution shape and color data. The scannerhas been implemented and tested on a real, complexartwork: the Minerva of Arezzo. The scanner producedgood results, even on such a complex testbed (charac-terized by a complex shape, with extensive corrosionand bumpyness of the statue surface, and the complexreflectivity properties of the bronze alley). We are
c© The Eurographics Association and Blackwell Publishers 2001.

Rocchini, Cignoni, Montani, Pingi and Scopigno / A low cost 3D scanner
working to some extensions of the system, mainlyoriented to improving color acquisition in the caseof non-Lambertian surfaces (such as the bronze alley).
Acknowledgements This project has been devel-oped in cooperation with the Centro di Restauro(Restoration Laboratory) of the SoprintendenzaArcheologica Toscana in Florence and with the Isti-tuto Nazionale di Ottica. In particular we would liketo thank M. Cygielman, R. Giachetti, M. Giovanelli,G. Gori and L. Pezzati for the fruitful collaboration.We acknowledge the financial support of the ProgettoFinalizzato CNR “Beni Culturali” and of the TuscanyRegion’s RIS+ Project.
References
1. L. Alboul, G. Kloosterman, C.R. Traas, and R.M. vanDamme, Best data-dependent triangulations, Tech.Report TR-1487-99, University of Twente, 1999.
2. F. Bernardini and H. E. Rushmeier, 3D Model Acqui-sition, Eurographics 2000, State of the Art ReportsProceedings, Eurographics Association, August 24–25 2000, pp. 41–62.
3. P. J. Besl, Active, optical range imaging sensors, Ma-chine Vision and Applications 1 (1988), 127–152.
4. K. L. Boyer and A. C. Kak, Color-encoded structuredlight for rapid active ranging, IEEE Transactions onPattern Analysis and Machine Intelligence 9 (1987),no. 1, 14–28.
5. Brian Carrihill and Robert Hummel, Experimentswith the intensity ratio depth sensor, Computer Vi-sion, Graphics, and Image Processing 32 (1985), no. 3,337–358.
6. D. Caspi, N. Kiryati, and J. Shamir, Range imagingwith adaptive color structured light, IEEE Transac-tions on Pattern Analysis and Machine Intelligence20 (1998), no. 5, 470–480.
7. C.S. Chen, Y.P. Hung, C.C. Chiang, and J.L. Wu,Range data acquisition using color structured lightingand stereo vision, Image and Vision Computing 15(1997), 445–456.
8. P. Cignoni, C. Montani, C. Rocchini, and R. Scopigno,Multiple textures stitching and blending on 3d objects,Rendering Techniques ’99, Springer-Verlag Wien,1999, pp. 119–130.
9. , External memory management and simplifi-cation of huge meshes, Tech. Report B4-01, I.E.I. –C.N.R., Pisa, Italy, Gennaio 2001.
10. Brian Curless and Steven Seitz, 3D Photography,ACM Siggraph ’00 Course Notes, Course No. 19, Au-gust 24th 2000.
11. M. Gaiani, M. Balzani, and F. Uccelli, Reshaping the
Coliseum in Rome, Computer Graphics Forum (Eu-rographics 2000) (M. Gross and F. R. A. Hopgood,eds.), vol. 19(3), 2000, pp. 369–378.
12. E. Horn and N. Kiryati, Toward optimal struc-tured light patterns, Image and Vision Computing 17(1999), no. 5, 87–97.
13. S. Inokuchi, K. Sato, and F. Matsuda, Range-imagingsystem for 3-D object recognition, Seventh Inter-national Conference on Pattern Recognition (Mon-treal, Canada, July 30-August 2, 1984), IEEE, 1984,pp. 806–808.
14. R. Jain, R. Kasturi, and B.G. Schunck, Machine vi-sion, Mc Graw Hill, 1995.
15. M. Levoy, K. Pulli, B. Curless, S. Rusinkiewicz, etal., The Digital Michelangelo Project: 3D scanning oflarge statues, Comp. Graph. Proc., Annual Conf. Se-ries (Siggraph ’00), ACM SIGGRAPH, Addison Wes-ley, July 24-28 2000, pp. 131–144.
16. J. L. Posdamer and M. D. Altschuler, Surface mea-surement by space-encoded projected beam systems,Computer Graphics and Image Processing 18 (1982),no. 1, 1–17.
17. C. Rocchini, P. Cignoni, C. Montani, and R. Scopigno,The Marching Intersections algorithm for mergingrange images, Technical Report B4-61-00, I.E.I. -C.N.R., Pisa, Italy, June 2000.
18. H. Rushmeier and F. Bernardini, Computing consis-tent normals and colors from photometric data, Proc.Second Int. Conf. on 3D Digital Imaging and Model-ing (Ottawa, Canada), 1999, pp. 99–108.
19. H. Rushmeier, F. Bernardini, J. Mittleman, andG. Taubin, Acquiring input for rendering at appropri-ate levels of detail: digitizing a pieta, Rendering Tech-niques ’98 (G. Drettakis and N. Max, eds.), SpringerWien, 1998, pp. 81–92.
20. K. Sato and S. Inokuchi, Three-dimensional surfacemeasurement by space encoding range imaging, J.Robotic Systems 2 (1985), 27–39.
21. R. Tsai, A versatile camera calibration technique forhigh accuracy 3D machine vision metrology using off-the-shelf TV cameras and lenses, IEEE Journal ofRobotics and Automation RA-3 (1987), no. 4.
22. Reg Willson, Tsai camera cali-bration software, More info on:http://www.cs.cmu.edu/˜rgw/TsaiDesc.html, 1995.
23. H. S. Yang, K. L. Boyer, and A. C. Kak, Range dataextraction and interpretation by structural light, TheFirst Conference on Artificial Intelligence Applica-tions (Denver, CO, December 5-7, 1984), IEEE, 1984,pp. 199–205.
24. Y. Yu and J. Malik, Recovering photometric propertiesof architectural scenes from photographs, SIGGRAPH98 Conference Proceedings (Michael Cohen, ed.), An-nual Conference Series, ACM SIGGRAPH, AddisonWesley, July 1998, pp. 207–218.
c© The Eurographics Association and Blackwell Publishers 2001.