Embed Size (px)
Citation preview
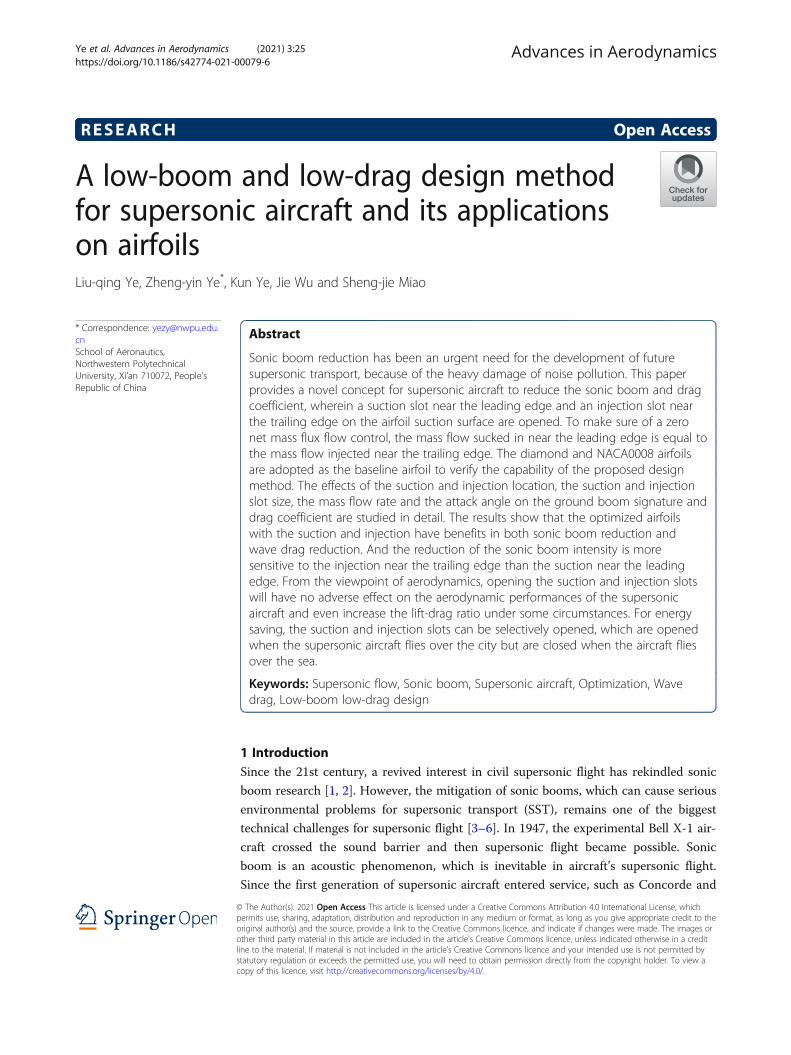
RESEARCH Open Access
A low-boom and low-drag design methodfor supersonic aircraft and its applicationson airfoilsLiu-qing Ye, Zheng-yin Ye*, Kun Ye, Jie Wu and Sheng-jie Miao
* Correspondence: [email protected] of Aeronautics,Northwestern PolytechnicalUniversity, Xi’an 710072, People’sRepublic of China
Abstract
Sonic boom reduction has been an urgent need for the development of futuresupersonic transport, because of the heavy damage of noise pollution. This paperprovides a novel concept for supersonic aircraft to reduce the sonic boom and dragcoefficient, wherein a suction slot near the leading edge and an injection slot nearthe trailing edge on the airfoil suction surface are opened. To make sure of a zeronet mass flux flow control, the mass flow sucked in near the leading edge is equal tothe mass flow injected near the trailing edge. The diamond and NACA0008 airfoilsare adopted as the baseline airfoil to verify the capability of the proposed designmethod. The effects of the suction and injection location, the suction and injectionslot size, the mass flow rate and the attack angle on the ground boom signature anddrag coefficient are studied in detail. The results show that the optimized airfoilswith the suction and injection have benefits in both sonic boom reduction andwave drag reduction. And the reduction of the sonic boom intensity is moresensitive to the injection near the trailing edge than the suction near the leadingedge. From the viewpoint of aerodynamics, opening the suction and injection slotswill have no adverse effect on the aerodynamic performances of the supersonicaircraft and even increase the lift-drag ratio under some circumstances. For energysaving, the suction and injection slots can be selectively opened, which are openedwhen the supersonic aircraft flies over the city but are closed when the aircraft fliesover the sea.
Keywords: Supersonic flow, Sonic boom, Supersonic aircraft, Optimization, Wavedrag, Low-boom low-drag design
1 IntroductionSince the 21st century, a revived interest in civil supersonic flight has rekindled sonic
boom research [1, 2]. However, the mitigation of sonic booms, which can cause serious
environmental problems for supersonic transport (SST), remains one of the biggest
technical challenges for supersonic flight [3–6]. In 1947, the experimental Bell X-1 air-
craft crossed the sound barrier and then supersonic flight became possible. Sonic
boom is an acoustic phenomenon, which is inevitable in aircraft’s supersonic flight.
Since the first generation of supersonic aircraft entered service, such as Concorde and
© The Author(s). 2021 Open Access This article is licensed under a Creative Commons Attribution 4.0 International License, whichpermits use, sharing, adaptation, distribution and reproduction in any medium or format, as long as you give appropriate credit to theoriginal author(s) and the source, provide a link to the Creative Commons licence, and indicate if changes were made. The images orother third party material in this article are included in the article's Creative Commons licence, unless indicated otherwise in a creditline to the material. If material is not included in the article's Creative Commons licence and your intended use is not permitted bystatutory regulation or exceeds the permitted use, you will need to obtain permission directly from the copyright holder. To view acopy of this licence, visit http://creativecommons.org/licenses/by/4.0/.
Advances in AerodynamicsYe et al. Advances in Aerodynamics (2021) 3:25 https://doi.org/10.1186/s42774-021-00079-6
Tupolev TU-144, scientists and engineers from around the world have made extensive
efforts in sonic boom research and have completed the standard sonic boom theory [7].
There are many excellent reviews [7–11] that present the generation, the prediction
methods and the mitigation strategies of sonic boom. Owing to the fact that the noise
created by a sonic boom can not satisfy regulations in most of the countries, these
supersonic aircrafts are not allowed to fly over land and then even withdrew from the
historical stage. However, it cannot be ignored that there is enormous potential busi-
ness value for supersonic transport [12]. Therefore, reducing or even eliminating
the sonic boom has been a hot issue both in engineering and academic domains.
In order to design a low-boom supersonic aircraft, two main technologies are used to
reduce sonic booms: (1) aerodynamic minimization and (2) exotic configurations. The
first technology [13, 14] is a traditional method mostly discussed in early studies, which
mainly adopts aerodynamic means to minimize the sonic boom signals. Seebass [9]
reviewed some of these methods, such as, reducing the engine streamtube area, de-
creasing annoying signatures of the aircraft, increasing lift/drag ratio, decreasing the
structural weight, reducing the consumption of fuel and so on. In the last two decades,
engineers and scientists have paid more attention to the second technology. Jones [15]
and Carlson [16] are the first to reduce the sonic boom by aircraft shaping. They de-
fined an equivalent-body shape, which can produce N-wave signature with a “lower-
bound” overpressure and impulse. Carlson [17] further investigated the influence of
configuration arrangement on the features of sonic boom. George and Seebass [18, 19]
developed a relatively complete theory in which the area distribution is determined to
minimize the head and tail shock, and it laid the theoretical foundation for the sonic
boom minimization method. However, the nose shape determined by the area distribu-
tion is so blunt that the drag is significantly increased. And this method sacrifices the
front fuselage size, and then results in the reduction in fuselage space utilization. For
reducing the drag resulting from the blunt nose shape, Darden [20] modified and con-
trolled the bluntness of the area distribution near the nose and further developed this
minimization method. The inverse design approaches have been widely adopted for the
low-boom supersonic configurations [21, 22]. This approach mainly designates a target
near-field or far-field pressure signature and achieves it by shaping the aircraft. Based
on the augmented Burgers equation and Proper Orthogonal Decomposition (POD)
method, Zhang [23] developed an inverse design framework for supersonic low-boom
configuration. Recently, some innovative concepts have been proposed to reduce the
sonic boom and wave drag of supersonic aircraft. Placing a swept forward keel normal
to the Mach plane to increase the apparent length of the aircraft, Marconi [24] has
proved that this method is effective to alleviate the sonic boom. Howe [25] proposed a
Quiet Spike concept to mitigate the sonic boom. An extendable and retractable spike is
mounted on the nose to produce a series of weak shock waves, and then the sonic
boom can be reduced. However, the additional spike will significantly increase the
weight of aircraft, and it must be equipped with adequate stiffness to avoid the aero-
elastic instability [26]. Ban [27] adopted a supersonic biplane concept and a supersonic
twin-body concept to reduce the sonic boom and wave drag of supersonic transport.
Establishing the multidisciplinary methodologies for supersonic transport, Sun et al.
[28, 29] evaluated the sonic boom characteristics and aerodynamics of six business-
Ye et al. Advances in Aerodynamics (2021) 3:25 Page 2 of 27

class configurations. And they finally found out the low-boom and low-drag design
solutions.
This paper proposes a novel concept for supersonic aircraft to reduce the sonic boom
and drag coefficient, wherein a suction slot near the leading edge and an injection slot
near the trailing edge on the airfoil suction surface are opened. Compared with the
above low-boom methods, the novel method proposed in this paper not only avoids
the weight penalty and substantial increment of drag but also the sacrifice of fuselage
space. On the other hand, this method has the advantages of simple operation and easy
control. For energy saving, the suction and injection slots are opened when the super-
sonic aircraft flies over the city, and they are closed when the aircraft flies over the sea.
In order to verify the capability of the proposed design method, the diamond and
NACA0008 airfoils are adopted as the baseline airfoil. This paper is organized as fol-
lows: Section 2 introduces the specific strategy for reducing the sonic-boom and drag
coefficient. In Section 3, firstly the optimal locations for suction and injection slots are
found, and then the suction slot and the injection slot are placed at the corresponding
optimal locations, and the effects of suction and injection slot size, the mass flow rate
and the attack angle on the ground boom signature and drag coefficient are numeric-
ally studied in detail. The concluding remarks are provided in Section 4.
2 The strategy for reducing the sonic-boom and drag coefficient2.1 Sonic-boom formation and propagation
A sonic boom results from the natural nonlinear evolution of shock waves and near-
field pressure disturbances [30]. The near-field pressure disturbances propagate away
from the supersonic aircraft, and several different shock waves produced by the aircraft
features coalesce into the classic N-wave in the far field, shown in Fig. 1. The classic N-
wave, which denotes the shape of pressure signatures, is formed by a leading and
Fig. 1 Schematic of sonic boom propagation (not to scale)
Ye et al. Advances in Aerodynamics (2021) 3:25 Page 3 of 27
trailing shock. An almost linear pressure expansion separates the leading shock from
the trailing shock. When a part of the effective acoustic energy reaches the ground, the
human ear perceives sound and it is called a sonic boom. Only a single bang can be
perceived by the human ear when the aircraft is small. This results from the fact that
the leading shock is very close to the trailing shock. For a relatively long or large air-
craft, a boom-boom will be perceived by the human ear. There is an expansion between
the leading shock and the trailing shock, which can not be perceived by the human ear
because of its sufficiently low frequency.
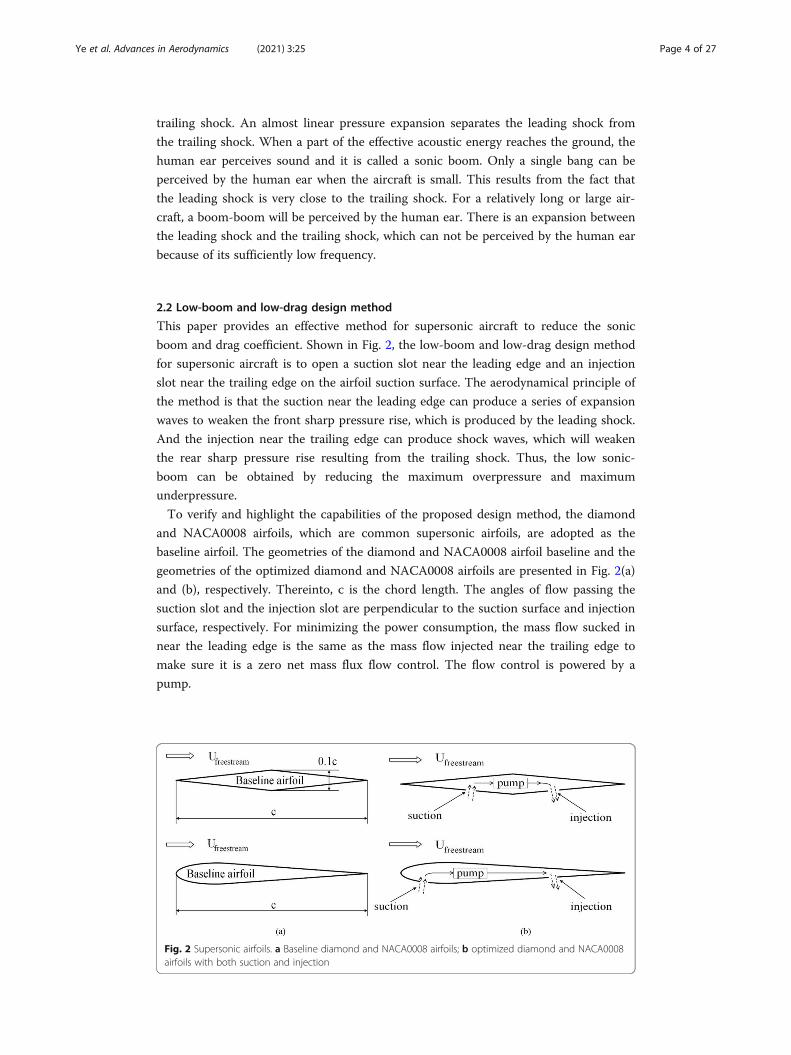
2.2 Low-boom and low-drag design method
This paper provides an effective method for supersonic aircraft to reduce the sonic
boom and drag coefficient. Shown in Fig. 2, the low-boom and low-drag design method
for supersonic aircraft is to open a suction slot near the leading edge and an injection
slot near the trailing edge on the airfoil suction surface. The aerodynamical principle of
the method is that the suction near the leading edge can produce a series of expansion
waves to weaken the front sharp pressure rise, which is produced by the leading shock.
And the injection near the trailing edge can produce shock waves, which will weaken
the rear sharp pressure rise resulting from the trailing shock. Thus, the low sonic-
boom can be obtained by reducing the maximum overpressure and maximum
underpressure.
To verify and highlight the capabilities of the proposed design method, the diamond
and NACA0008 airfoils, which are common supersonic airfoils, are adopted as the
baseline airfoil. The geometries of the diamond and NACA0008 airfoil baseline and the
geometries of the optimized diamond and NACA0008 airfoils are presented in Fig. 2(a)
and (b), respectively. Thereinto, c is the chord length. The angles of flow passing the
suction slot and the injection slot are perpendicular to the suction surface and injection
surface, respectively. For minimizing the power consumption, the mass flow sucked in
near the leading edge is the same as the mass flow injected near the trailing edge to
make sure it is a zero net mass flux flow control. The flow control is powered by a
pump.
Fig. 2 Supersonic airfoils. a Baseline diamond and NACA0008 airfoils; b optimized diamond and NACA0008airfoils with both suction and injection
Ye et al. Advances in Aerodynamics (2021) 3:25 Page 4 of 27
2.3 Sonic-boom prediction
In order to verify the capabilities of the method in reducing the sonic boom and drag
coefficient, it is significant to accurately predict the ground sonic boom signatures. At
present, the international mainstream strategy of a sonic-boom prediction first pro-
posed by Cheung [31] and Siclari [32], which is also adopted in this paper, consists of
two main steps. First, using the wind tunnel experiment or a computational fluid dy-
namics (CFD) calculation, the near-field pressure signatures can be obtained. Then, the
off-body-pressure distribution in the near-field region is propagated to the ground to
achieve the ground sonic boom signature by utilizing quasi-linear theory derived from
Whitham [33] and methods originating from the nonlinear Burger’s [34] and Tricomi’s
equation [35, 36].
The mesh tool, ICEM, is utilized to provide the structured mesh. For capturing the
shock features more accurately, the grid surface is parallel to the shock surface and the
grid near the shock surface is densified. By solving 2-D Euler equation, the commercial
CFD software, Fluent, is used to obtain the near-field pressure distribution by calculat-
ing the flow field. Xu [37] conducted CFD calculations and analyses on the standard
model proposed by the 1st AIAA Sonic Boom Prediction Workshop (SBPW-1), and
then pointed out that the viscous effect can be ignored in the analysis of sonic boom
with a simple shape, in other words, the model error of the Euler equation can be
ignored.
Based on the modified supersonic linearization theory developed by Whitham [33],
the linear far-field propagation methodology of Thomas [38] and geometrical acoustics,
the authors’ Division has developed an in-house package FL-BOOM [2] to estimate the
effects of the far-field propagation. As a comprehensive sonic boom signal propagation
and analysis tool, it has already been proved that FL-BOOM can provide an acceptable
result for the prediction of sonic-boom signatures in Ref [2], and it is used to conduct
the far-field calculation in this paper.
The linearized theory of sonic boom prediction was developed by Whitham from the
linearized theory for the supersonic slender body of revolution in 1952. Whitham
thought that the assumption that the characteristic lines are parallel to each other is
not reasonable in the calculation of a sonic boom. He modified the characteristic line
equation, proposed the linearized theory of sonic boom and also gave the description
for characteristic lines with high precision. According to the linearized theory for
the supersonic slender body of revolution, the small perturbation velocities of revolu-
tion bodies are
uV∞
¼ ∂ϕ∂x
¼ −12π
Z x−Br
0
S00 ξð Þdξffiffiffiffiffiffiffiffiffiffiffiffiffiffiffiffiffiffiffiffiffiffiffiffiffix−ξð Þ2−B2r2
qvV∞
¼ ∂ϕ∂r
¼ −12πr
Z x−Br
0
S00 ξð Þ x−ξð Þdξffiffiffiffiffiffiffiffiffiffiffiffiffiffiffiffiffiffiffiffiffiffiffiffiffix−ξð Þ2−B2r2
q
8>>>>><>>>>>:
ð1Þ
where u and v are small perturbation velocities, V∞ is flow velocity at infinity, ϕ is vel-
ocity potential, x and r are cylindrical coordinates, B ¼ffiffiffiffiffiffiffiffiffiffiffiffiffiffiffiMa2−1
p, Ma is Mach number,
ξ is integration variable, S(ξ) is sectional area and S''(ξ) is the second derivative of the
cross section.
Ye et al. Advances in Aerodynamics (2021) 3:25 Page 5 of 27
The characteristic line equation x − Br = const is changed to x − Br = y(x, r). It means
that the relationship between x and r is not linear, and this relationship is related to
space coordinates (x, r). Thus, the eq. (1) can be expressed as
uV∞
¼ −12π
Z y
0
S00 ξð Þdξffiffiffiffiffiffiffiffiffiffiffiffiffiffiffiffiffiffiffiffiffiffiffiffiffiffiffiffiffiffiffiffiffiffiffiffiy−ξð Þ y−ξ þ 2Brð Þp
vV∞
¼ −1
2πr
Z y
0
S00 ξð Þ yþ Br−ξð Þdξffiffiffiffiffiffiffiffiffiffiffiffiffiffiffiffiffiffiffiffiffiffiffiffiffiffiffiffiffiffiffiffiffiffiffiffiy−ξð Þ y−ξ þ 2Brð Þp
8>>><>>>:
ð2Þ
Because the characteristic line of disturbance is initiated from the object surface, y =
x − Br = x − BR when r = R, and y is of the same order of magnitude as the axial length
of the body of revolution. For r≫ R, it obtains y/Br≪ 1, also considering ξ = ο(y), then
we can obtain
uV∞
¼ −12π
Z y
0
1ffiffiffiffiffiffiffiffi2Br
p S00 ξð Þdξffiffiffiffiffiffiffiffiy−ξ
p¼ −
1ffiffiffiffiffiffiffiffi2Br
p F yð Þð3Þ
F yð Þ ¼ 12π
Z y
0
S00 ξð Þdξffiffiffiffiffiffiffiffiffiffiffiy−ξð Þp ð4Þ
The above eq. (4) gives the expression of the function F(y), which is very important
in the sonic boom prediction theory.
According to the Bernoulli’s equation, it obtains
Δp ¼ 12ρ0 V 2
∞−V2
� �
Δp ¼ 12ρ0 V 2
∞− V∞ þ uð Þ2−v2� � ð5Þ
Considering u≪V∞, v≪V∞, the eq. (5) can be expressed as follows
Δp ¼ −ρ0V∞u ð6Þ
Substituting eq. (3) into eq. (6), it obtains
Δpp0
¼ rMa2ffiffiffiffiffiffiffiffi2Br
p F yð Þ ð7Þ
where Δp/p0 is the overpressure and Δp = p − p0. p is the local pressure at the observa-
tion point and p0 is the environmental pressure.
Here the expression of characteristic line is given as follows
x ¼ Br−kF yð Þ ffiffir
p þ yy ¼ x0−Br0k ¼ 2−1=2 γ þ 1ð ÞMa4B−3=2
8<: ð8Þ
where γ is the specific ratio, and x0, r0 are the initial position coordinates.
When the waveform shape on the ground is obtained, according to the references
[28, 39], we can select the maximum overpressure and maximum underpressure as the
main indices of sonic boom intensity. Here, Δp _ o represents the maximum overpres-
sure and Δp _ u indicates the maximum underpressure.
Ye et al. Advances in Aerodynamics (2021) 3:25 Page 6 of 27

3 Results and discussionThe freestream Mach number adopted in this Section is Ma = 1.7 for the numerical
computation. The chord length of the airfoil is 1 m. The boundary condition of the suc-
tion is set as the pressure outlet condition, and the boundary condition of the injection
is simulated with the velocity inlet condition. By adjusting the velocity value of the jet
at the velocity inlet condition, the mass flow passing the injection slot is controlled to
be the same as that sucked in the suction slot. For the far-field propagation, the ground
signatures for the airfoil baseline and the designed airfoil are propagated with FL-
BOOM from the near-field pressure distributions calculated with CFD at two body
lengths away from the aircraft, i.e. H/L = 2. The real aircraft is assumed at an altitude
of 16764 m and in a no-wind U.S. Standard Atmosphere [2].
In this Section, we compare the ground sonic boom signatures and drag coefficients
of the designed airfoils with that of the airfoil baselines to verify the capabilities of the
proposed design method, which can significantly reduce the sonic boom and drag coef-
ficient of the supersonic aircraft. During the calculation of aerodynamic coefficients,
two factors (i.e. (1) momentum fluxes of the suction and injection slots (2) pressures at
the suction and injection slots) have been considered. Based on dimensional analysis,
momentum flux means the force per unit area. According to the momentum theory,
the acting force of this part on the suction and injection slots can be obtained. For the
pressures at the suction and injection slots, they are obtained when the flow field is
solved. In Section 3.1, the mesh convergence analysis is conducted. In Section 3.2, the
sonic boom prediction model is verified. In Section 3.3, without opening the suction
and injection slots simultaneously, here we only open a suction slot near the leading
edge or an injection slot near the trailing edge at different locations. Then the effects of
suction and injection location on the ground sonic boom signatures are studied, and
the optimal location for the suction slot and the injection slot is found. In Section 3.4,
3.5 and 3.6, opening the suction and injection slots simultaneously and putting the suc-
tion slot and the injection slot at the optimal location found in Section 3.3, the effects
of the suction and injection slot size, the mass flow rate and the attack angle on the
ground boom signature and drag coefficient are numerically studied, respectively. The
mass flow sucked in near the leading edge is equal to the mass flow injected near the
trailing edge.
3.1 Mesh convergence
Three structured meshes, i.e. coarse, medium, and fine, were generated to conduct the
mesh convergence analysis for the present test cases. The different grid refinement
levels can be distinguished by different line types. The number of nodes of the grid at
the next finer level is four times as much as that at the last level. The near-field pres-
sure distributions at H/L = 2 for optimized diamond airfoil with suction injection
(Fig. 3(a)) and for optimized NACA0008 airfoil with suction injection (Fig. 3(b)) are cal-
culated. The mass flow rate at the suction slot is the same as that at the injection slot.
In the case of optimized diamond airfoil, the numbers of the grid nodes are 190 ×
200, 290 × 400 and 390 × 800, respectively. The suction slot is located at 21.0%c from
the leading edge, and the injection slot is located at 79.0%c from the leading edge. The
mass flow rate at the suction and injection slot is 1 kg/s, and the size of suction and
Ye et al. Advances in Aerodynamics (2021) 3:25 Page 7 of 27
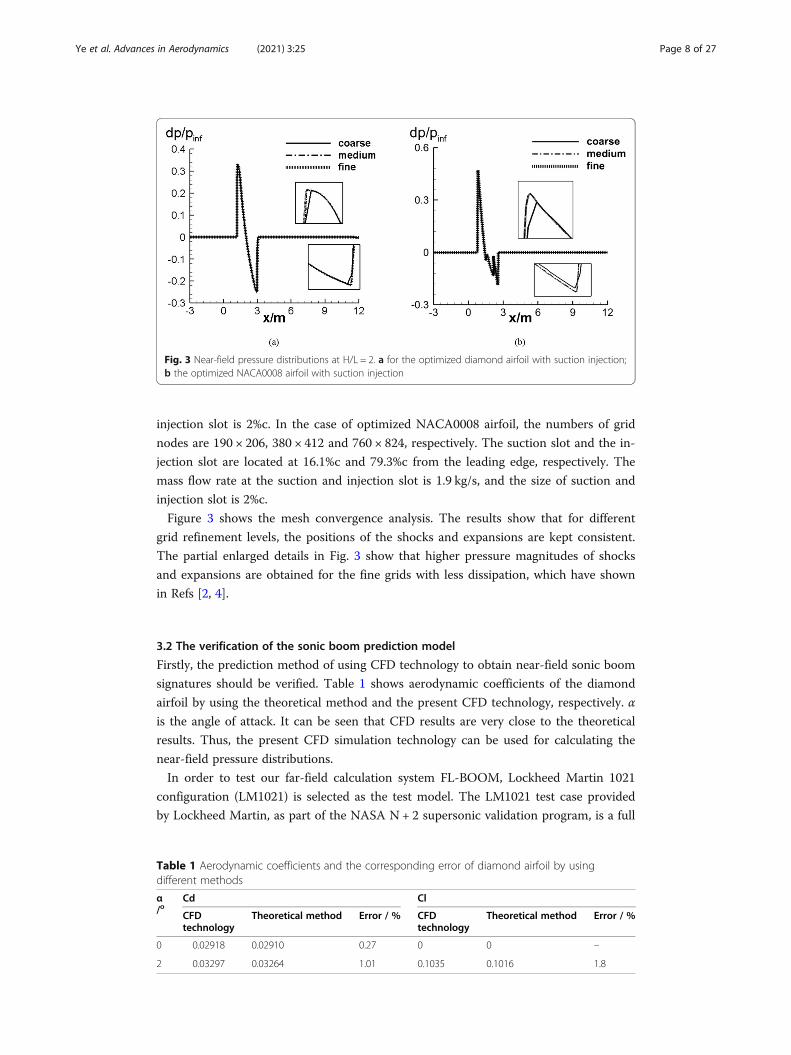
injection slot is 2%c. In the case of optimized NACA0008 airfoil, the numbers of grid
nodes are 190 × 206, 380 × 412 and 760 × 824, respectively. The suction slot and the in-
jection slot are located at 16.1%c and 79.3%c from the leading edge, respectively. The
mass flow rate at the suction and injection slot is 1.9 kg/s, and the size of suction and
injection slot is 2%c.
Figure 3 shows the mesh convergence analysis. The results show that for different
grid refinement levels, the positions of the shocks and expansions are kept consistent.
The partial enlarged details in Fig. 3 show that higher pressure magnitudes of shocks
and expansions are obtained for the fine grids with less dissipation, which have shown
in Refs [2, 4].
3.2 The verification of the sonic boom prediction model
Firstly, the prediction method of using CFD technology to obtain near-field sonic boom
signatures should be verified. Table 1 shows aerodynamic coefficients of the diamond
airfoil by using the theoretical method and the present CFD technology, respectively. α
is the angle of attack. It can be seen that CFD results are very close to the theoretical
results. Thus, the present CFD simulation technology can be used for calculating the
near-field pressure distributions.
In order to test our far-field calculation system FL-BOOM, Lockheed Martin 1021
configuration (LM1021) is selected as the test model. The LM1021 test case provided
by Lockheed Martin, as part of the NASA N + 2 supersonic validation program, is a full
Fig. 3 Near-field pressure distributions at H/L = 2. a for the optimized diamond airfoil with suction injection;b the optimized NACA0008 airfoil with suction injection
Table 1 Aerodynamic coefficients and the corresponding error of diamond airfoil by usingdifferent methods
α/o
Cd Cl
CFDtechnology
Theoretical method Error / % CFDtechnology
Theoretical method Error / %
0 0.02918 0.02910 0.27 0 0 –
2 0.03297 0.03264 1.01 0.1035 0.1016 1.8
Ye et al. Advances in Aerodynamics (2021) 3:25 Page 8 of 27

complex configuration with three nacelles and a V tail mounted on a blade support.
The detailed geometry of LM1021 configuration can be seen in Ref. [2]. The inviscid
simulation results of near-field signatures for h/L = 1.42 and off-track angle φ deg are
propagated to the ground. The full-scale vehicles are assumed to be at an altitude
of 16764 m and a Mach number of 1.6 in a no-wind U.S. Standard Atmosphere. Figure 4
shows the comparison of propagated ground signatures from FL-BOOM and from the
submissions of the 1st AIAA Sonic Boom Prediction Workshop (SBPW-1). It can be
seen in Fig. 4 that the far-field signature generated by FL-BOOM catches shocks cor-
rectly and gives a generally acceptable shape of the waveform.
3.3 The effects of suction and injection location
To achieve optimal results (i.e. the lowest sonic boom level) when the present method
is used, the optimal locations for the suction slot and the injection slot should be
found. Without opening the suction and injection slot simultaneously, here we only
open a suction slot near the leading edge at different locations and study the effects of
suction location on the maximum overpressure, then the optimal suction location can
be found. Similarly, opening only an injection slot near the trailing edge at different lo-
cations, the effects of injection location on the maximum underpressure are studied
and then the optimal injection location can be determined. x_s is the distance between
the suction slot and the leading edge, and x_i denotes the distance between the injec-
tion slot and the leading edge. To compare the performance of optimized diamond air-
foil and the diamond baseline airfoil, the maximum overpressure and the ground sonic
Fig. 4 Results of FL-BOOM VS. workshop submissions
Ye et al. Advances in Aerodynamics (2021) 3:25 Page 9 of 27
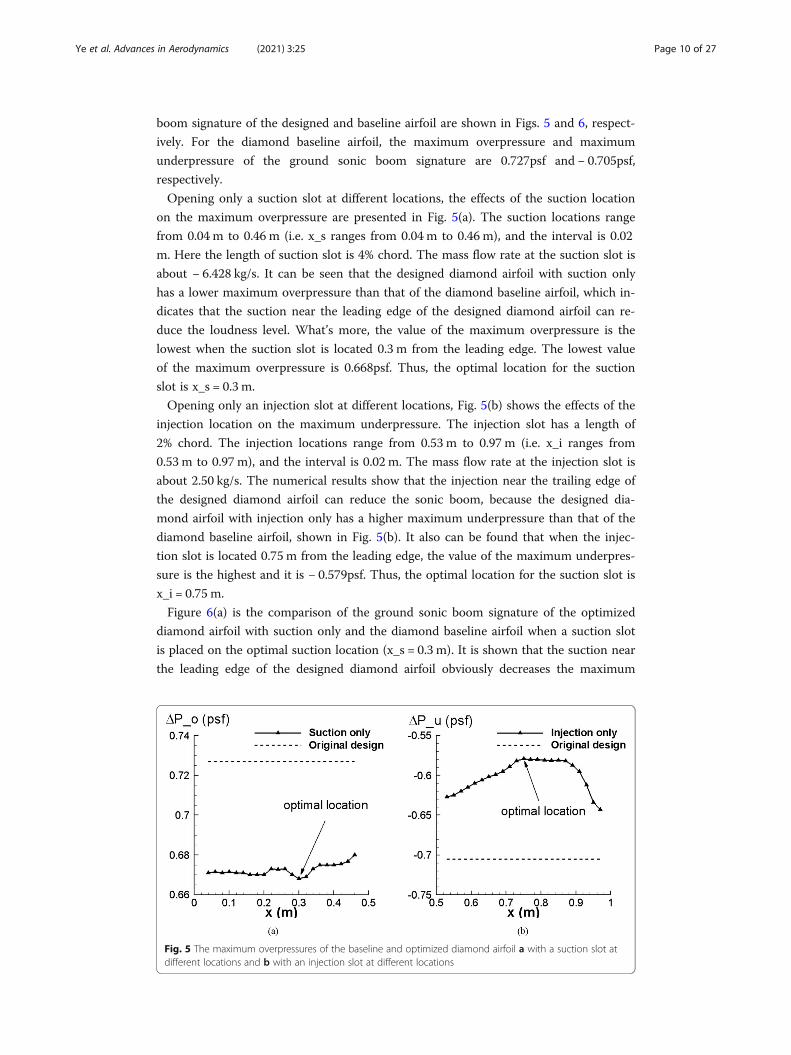
boom signature of the designed and baseline airfoil are shown in Figs. 5 and 6, respect-
ively. For the diamond baseline airfoil, the maximum overpressure and maximum
underpressure of the ground sonic boom signature are 0.727psf and − 0.705psf,
respectively.
Opening only a suction slot at different locations, the effects of the suction location
on the maximum overpressure are presented in Fig. 5(a). The suction locations range
from 0.04 m to 0.46 m (i.e. x_s ranges from 0.04 m to 0.46 m), and the interval is 0.02
m. Here the length of suction slot is 4% chord. The mass flow rate at the suction slot is
about − 6.428 kg/s. It can be seen that the designed diamond airfoil with suction only
has a lower maximum overpressure than that of the diamond baseline airfoil, which in-
dicates that the suction near the leading edge of the designed diamond airfoil can re-
duce the loudness level. What’s more, the value of the maximum overpressure is the
lowest when the suction slot is located 0.3 m from the leading edge. The lowest value
of the maximum overpressure is 0.668psf. Thus, the optimal location for the suction
slot is x_s = 0.3 m.
Opening only an injection slot at different locations, Fig. 5(b) shows the effects of the
injection location on the maximum underpressure. The injection slot has a length of
2% chord. The injection locations range from 0.53 m to 0.97 m (i.e. x_i ranges from
0.53 m to 0.97 m), and the interval is 0.02 m. The mass flow rate at the injection slot is
about 2.50 kg/s. The numerical results show that the injection near the trailing edge of
the designed diamond airfoil can reduce the sonic boom, because the designed dia-
mond airfoil with injection only has a higher maximum underpressure than that of the
diamond baseline airfoil, shown in Fig. 5(b). It also can be found that when the injec-
tion slot is located 0.75m from the leading edge, the value of the maximum underpres-
sure is the highest and it is − 0.579psf. Thus, the optimal location for the suction slot is
x_i = 0.75 m.
Figure 6(a) is the comparison of the ground sonic boom signature of the optimized
diamond airfoil with suction only and the diamond baseline airfoil when a suction slot
is placed on the optimal suction location (x_s = 0.3 m). It is shown that the suction near
the leading edge of the designed diamond airfoil obviously decreases the maximum
Fig. 5 The maximum overpressures of the baseline and optimized diamond airfoil a with a suction slot atdifferent locations and b with an injection slot at different locations
Ye et al. Advances in Aerodynamics (2021) 3:25 Page 10 of 27
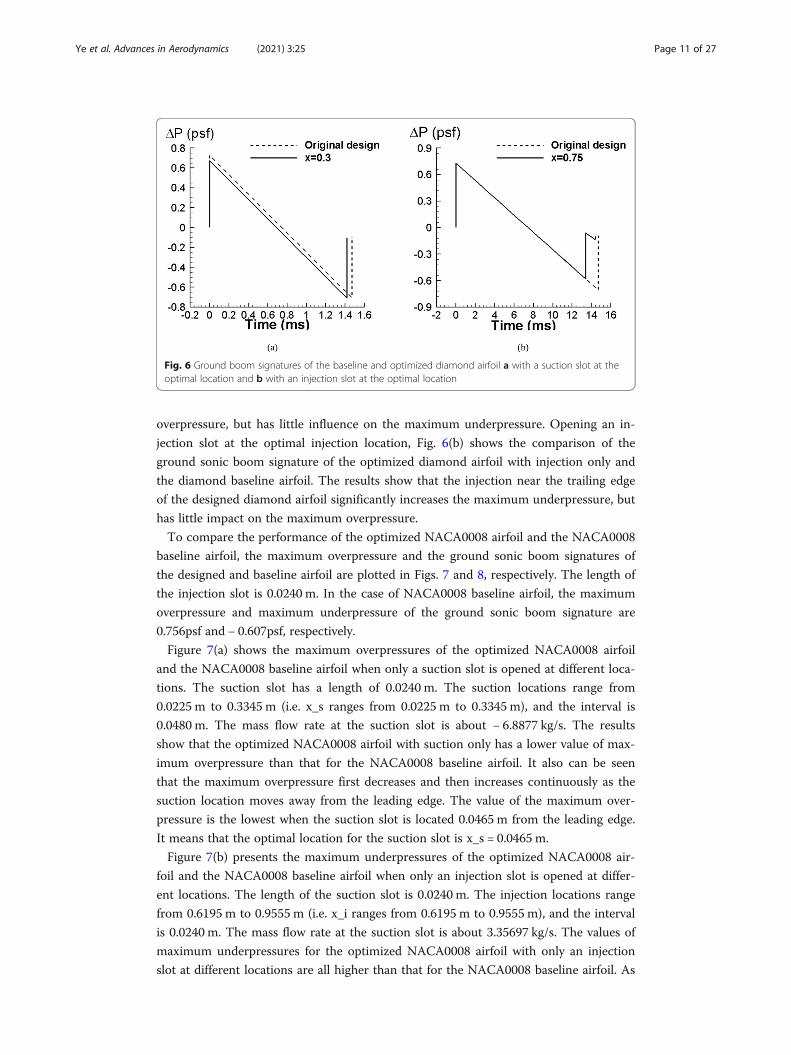
overpressure, but has little influence on the maximum underpressure. Opening an in-
jection slot at the optimal injection location, Fig. 6(b) shows the comparison of the
ground sonic boom signature of the optimized diamond airfoil with injection only and
the diamond baseline airfoil. The results show that the injection near the trailing edge
of the designed diamond airfoil significantly increases the maximum underpressure, but
has little impact on the maximum overpressure.
To compare the performance of the optimized NACA0008 airfoil and the NACA0008
baseline airfoil, the maximum overpressure and the ground sonic boom signatures of
the designed and baseline airfoil are plotted in Figs. 7 and 8, respectively. The length of
the injection slot is 0.0240 m. In the case of NACA0008 baseline airfoil, the maximum
overpressure and maximum underpressure of the ground sonic boom signature are
0.756psf and − 0.607psf, respectively.
Figure 7(a) shows the maximum overpressures of the optimized NACA0008 airfoil
and the NACA0008 baseline airfoil when only a suction slot is opened at different loca-
tions. The suction slot has a length of 0.0240 m. The suction locations range from
0.0225 m to 0.3345 m (i.e. x_s ranges from 0.0225 m to 0.3345 m), and the interval is
0.0480 m. The mass flow rate at the suction slot is about − 6.8877 kg/s. The results
show that the optimized NACA0008 airfoil with suction only has a lower value of max-
imum overpressure than that for the NACA0008 baseline airfoil. It also can be seen
that the maximum overpressure first decreases and then increases continuously as the
suction location moves away from the leading edge. The value of the maximum over-
pressure is the lowest when the suction slot is located 0.0465 m from the leading edge.
It means that the optimal location for the suction slot is x_s = 0.0465 m.
Figure 7(b) presents the maximum underpressures of the optimized NACA0008 air-
foil and the NACA0008 baseline airfoil when only an injection slot is opened at differ-
ent locations. The length of the suction slot is 0.0240 m. The injection locations range
from 0.6195 m to 0.9555 m (i.e. x_i ranges from 0.6195 m to 0.9555m), and the interval
is 0.0240 m. The mass flow rate at the suction slot is about 3.35697 kg/s. The values of
maximum underpressures for the optimized NACA0008 airfoil with only an injection
slot at different locations are all higher than that for the NACA0008 baseline airfoil. As
Fig. 6 Ground boom signatures of the baseline and optimized diamond airfoil a with a suction slot at theoptimal location and b with an injection slot at the optimal location
Ye et al. Advances in Aerodynamics (2021) 3:25 Page 11 of 27
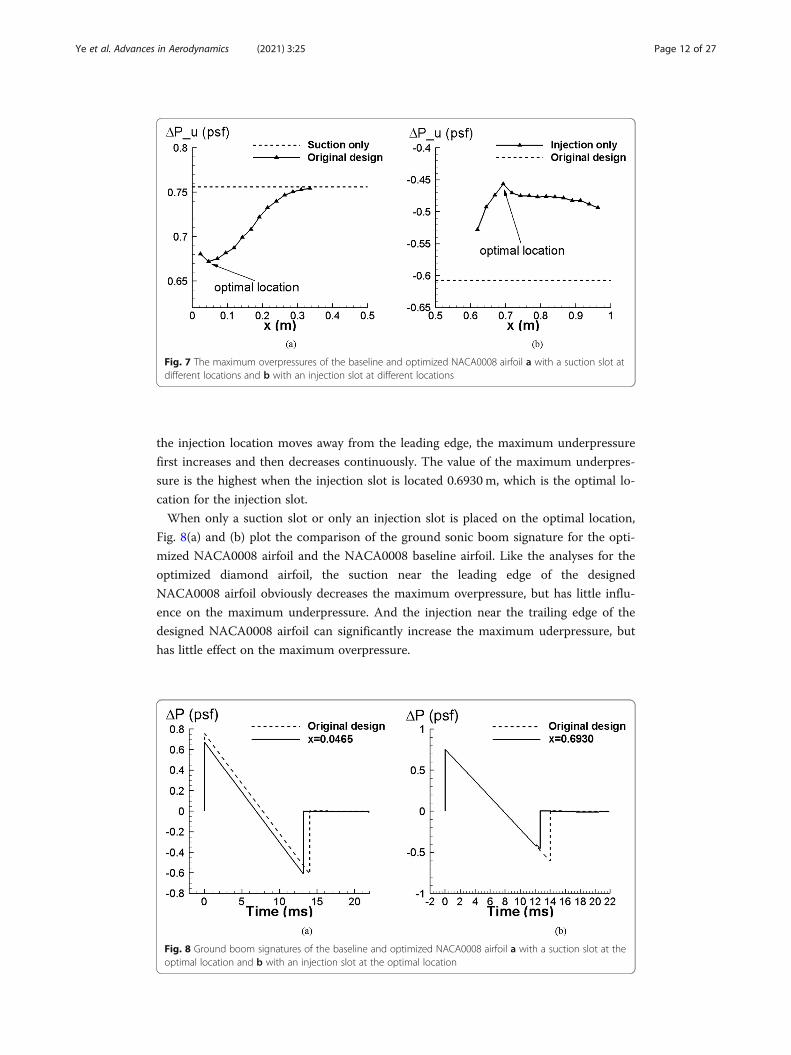
the injection location moves away from the leading edge, the maximum underpressure
first increases and then decreases continuously. The value of the maximum underpres-
sure is the highest when the injection slot is located 0.6930m, which is the optimal lo-
cation for the injection slot.
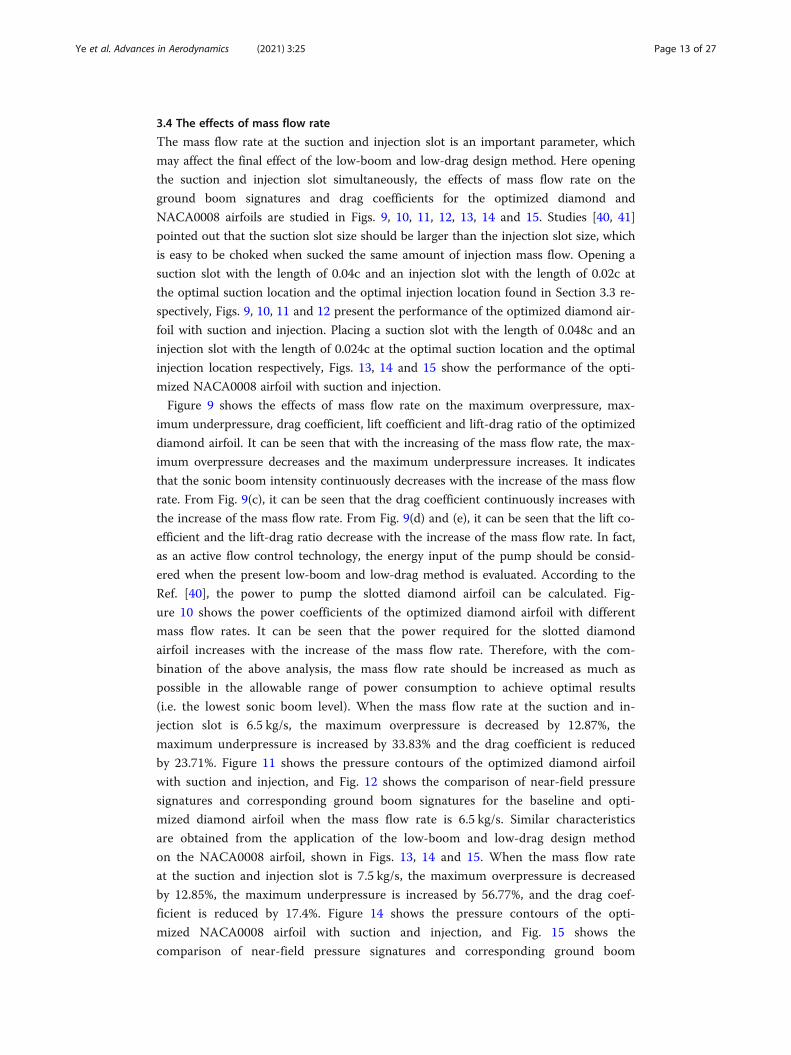
When only a suction slot or only an injection slot is placed on the optimal location,
Fig. 8(a) and (b) plot the comparison of the ground sonic boom signature for the opti-
mized NACA0008 airfoil and the NACA0008 baseline airfoil. Like the analyses for the
optimized diamond airfoil, the suction near the leading edge of the designed
NACA0008 airfoil obviously decreases the maximum overpressure, but has little influ-
ence on the maximum underpressure. And the injection near the trailing edge of the
designed NACA0008 airfoil can significantly increase the maximum uderpressure, but
has little effect on the maximum overpressure.
Fig. 7 The maximum overpressures of the baseline and optimized NACA0008 airfoil a with a suction slot atdifferent locations and b with an injection slot at different locations
Fig. 8 Ground boom signatures of the baseline and optimized NACA0008 airfoil a with a suction slot at theoptimal location and b with an injection slot at the optimal location
Ye et al. Advances in Aerodynamics (2021) 3:25 Page 12 of 27
3.4 The effects of mass flow rate
The mass flow rate at the suction and injection slot is an important parameter, which
may affect the final effect of the low-boom and low-drag design method. Here opening
the suction and injection slot simultaneously, the effects of mass flow rate on the
ground boom signatures and drag coefficients for the optimized diamond and
NACA0008 airfoils are studied in Figs. 9, 10, 11, 12, 13, 14 and 15. Studies [40, 41]
pointed out that the suction slot size should be larger than the injection slot size, which
is easy to be choked when sucked the same amount of injection mass flow. Opening a
suction slot with the length of 0.04c and an injection slot with the length of 0.02c at
the optimal suction location and the optimal injection location found in Section 3.3 re-
spectively, Figs. 9, 10, 11 and 12 present the performance of the optimized diamond air-
foil with suction and injection. Placing a suction slot with the length of 0.048c and an
injection slot with the length of 0.024c at the optimal suction location and the optimal
injection location respectively, Figs. 13, 14 and 15 show the performance of the opti-
mized NACA0008 airfoil with suction and injection.
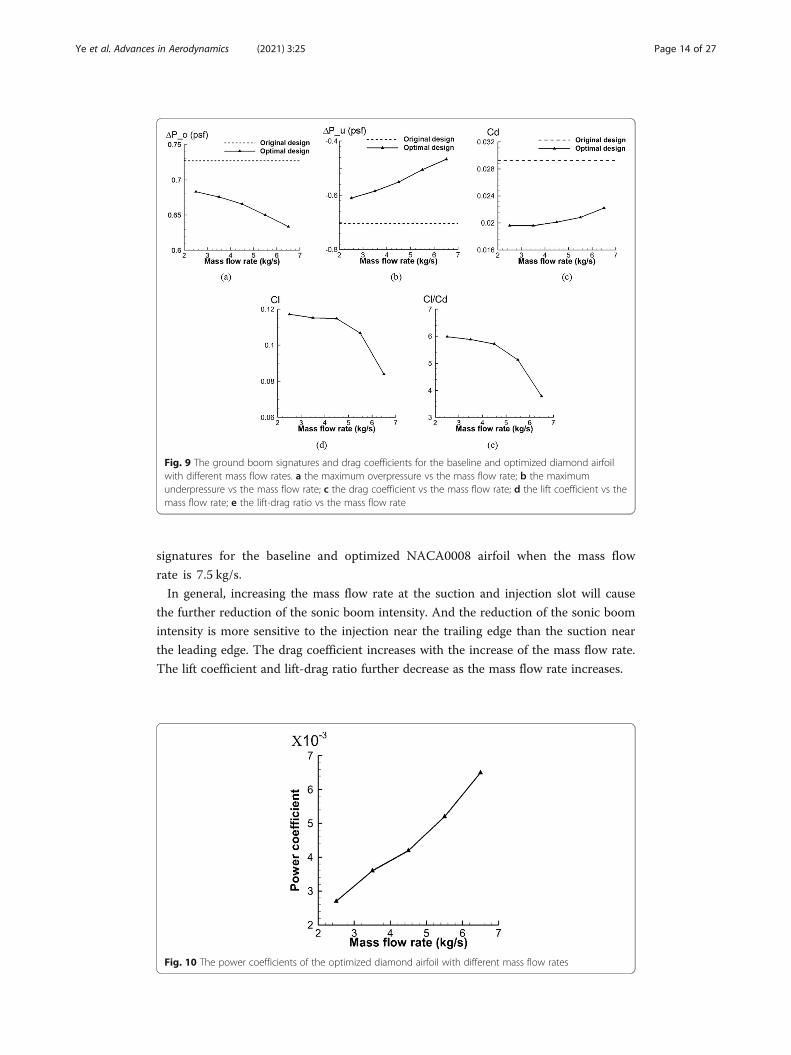
Figure 9 shows the effects of mass flow rate on the maximum overpressure, max-
imum underpressure, drag coefficient, lift coefficient and lift-drag ratio of the optimized
diamond airfoil. It can be seen that with the increasing of the mass flow rate, the max-
imum overpressure decreases and the maximum underpressure increases. It indicates
that the sonic boom intensity continuously decreases with the increase of the mass flow
rate. From Fig. 9(c), it can be seen that the drag coefficient continuously increases with
the increase of the mass flow rate. From Fig. 9(d) and (e), it can be seen that the lift co-
efficient and the lift-drag ratio decrease with the increase of the mass flow rate. In fact,
as an active flow control technology, the energy input of the pump should be consid-
ered when the present low-boom and low-drag method is evaluated. According to the
Ref. [40], the power to pump the slotted diamond airfoil can be calculated. Fig-
ure 10 shows the power coefficients of the optimized diamond airfoil with different
mass flow rates. It can be seen that the power required for the slotted diamond
airfoil increases with the increase of the mass flow rate. Therefore, with the com-
bination of the above analysis, the mass flow rate should be increased as much as
possible in the allowable range of power consumption to achieve optimal results
(i.e. the lowest sonic boom level). When the mass flow rate at the suction and in-
jection slot is 6.5 kg/s, the maximum overpressure is decreased by 12.87%, the
maximum underpressure is increased by 33.83% and the drag coefficient is reduced
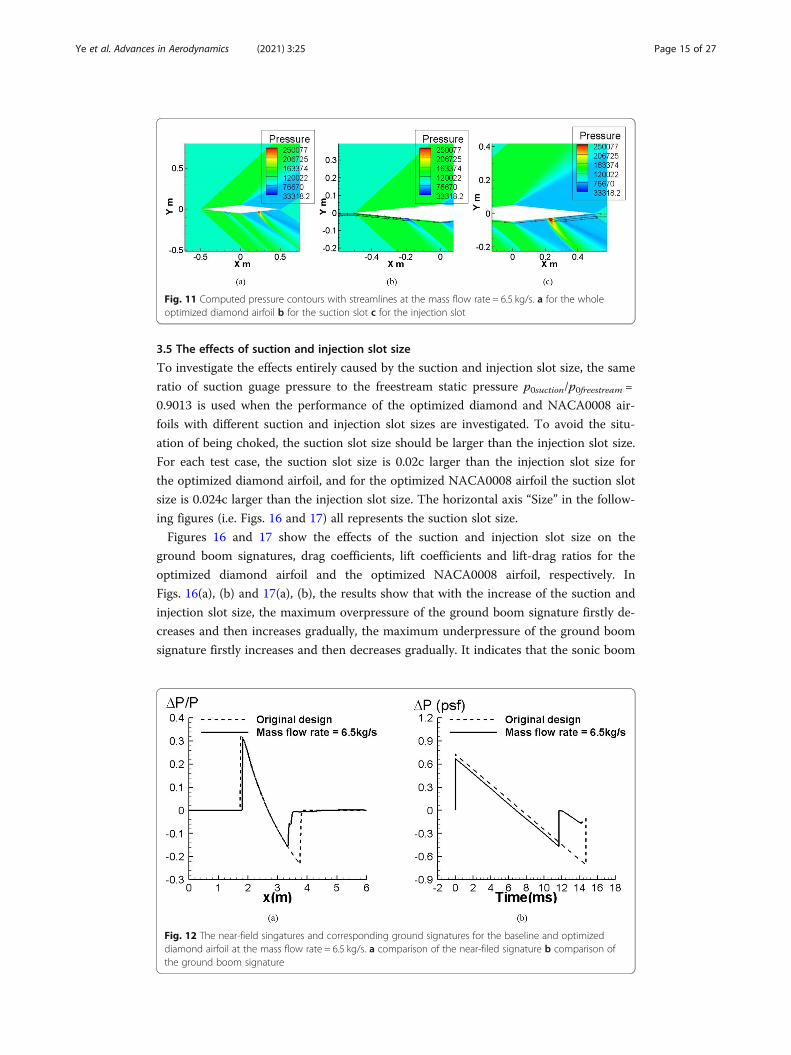
by 23.71%. Figure 11 shows the pressure contours of the optimized diamond airfoil
with suction and injection, and Fig. 12 shows the comparison of near-field pressure
signatures and corresponding ground boom signatures for the baseline and opti-
mized diamond airfoil when the mass flow rate is 6.5 kg/s. Similar characteristics
are obtained from the application of the low-boom and low-drag design method
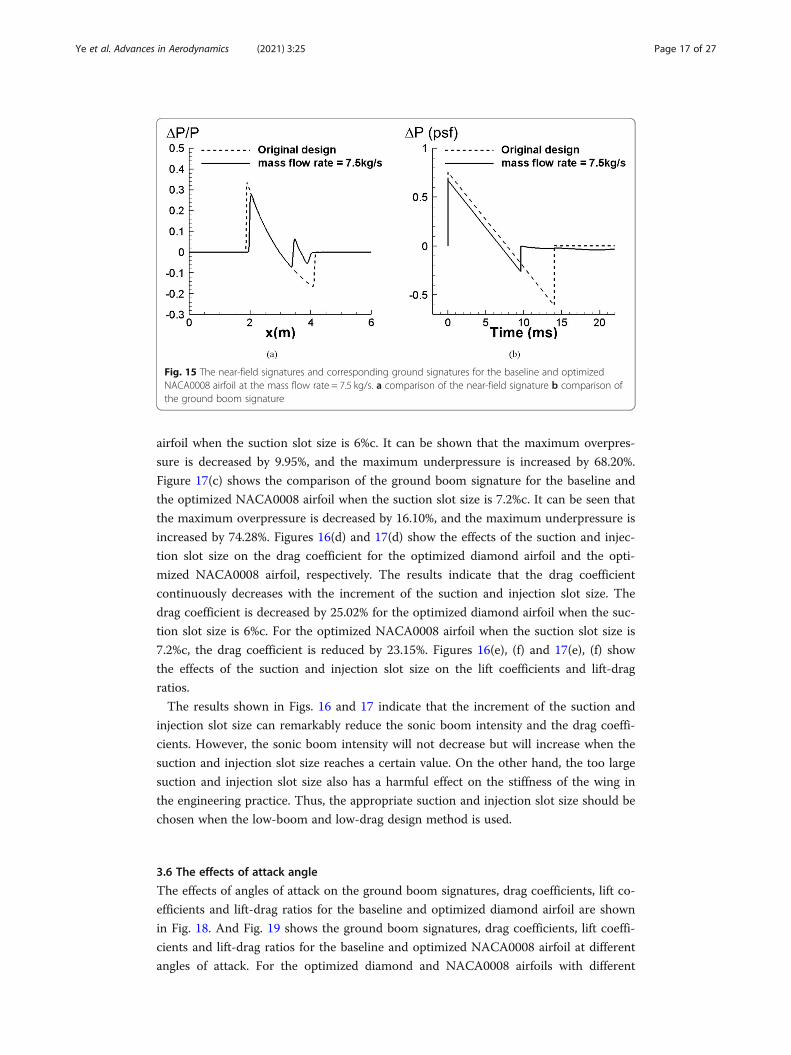
on the NACA0008 airfoil, shown in Figs. 13, 14 and 15. When the mass flow rate
at the suction and injection slot is 7.5 kg/s, the maximum overpressure is decreased
by 12.85%, the maximum underpressure is increased by 56.77%, and the drag coef-
ficient is reduced by 17.4%. Figure 14 shows the pressure contours of the opti-
mized NACA0008 airfoil with suction and injection, and Fig. 15 shows the
comparison of near-field pressure signatures and corresponding ground boom
Ye et al. Advances in Aerodynamics (2021) 3:25 Page 13 of 27
signatures for the baseline and optimized NACA0008 airfoil when the mass flow
rate is 7.5 kg/s.
In general, increasing the mass flow rate at the suction and injection slot will cause
the further reduction of the sonic boom intensity. And the reduction of the sonic boom
intensity is more sensitive to the injection near the trailing edge than the suction near
the leading edge. The drag coefficient increases with the increase of the mass flow rate.
The lift coefficient and lift-drag ratio further decrease as the mass flow rate increases.
Fig. 9 The ground boom signatures and drag coefficients for the baseline and optimized diamond airfoilwith different mass flow rates. a the maximum overpressure vs the mass flow rate; b the maximumunderpressure vs the mass flow rate; c the drag coefficient vs the mass flow rate; d the lift coefficient vs themass flow rate; e the lift-drag ratio vs the mass flow rate
Fig. 10 The power coefficients of the optimized diamond airfoil with different mass flow rates
Ye et al. Advances in Aerodynamics (2021) 3:25 Page 14 of 27
3.5 The effects of suction and injection slot size
To investigate the effects entirely caused by the suction and injection slot size, the same
ratio of suction guage pressure to the freestream static pressure p0suction/p0freestream =
0.9013 is used when the performance of the optimized diamond and NACA0008 air-
foils with different suction and injection slot sizes are investigated. To avoid the situ-
ation of being choked, the suction slot size should be larger than the injection slot size.
For each test case, the suction slot size is 0.02c larger than the injection slot size for
the optimized diamond airfoil, and for the optimized NACA0008 airfoil the suction slot
size is 0.024c larger than the injection slot size. The horizontal axis “Size” in the follow-
ing figures (i.e. Figs. 16 and 17) all represents the suction slot size.
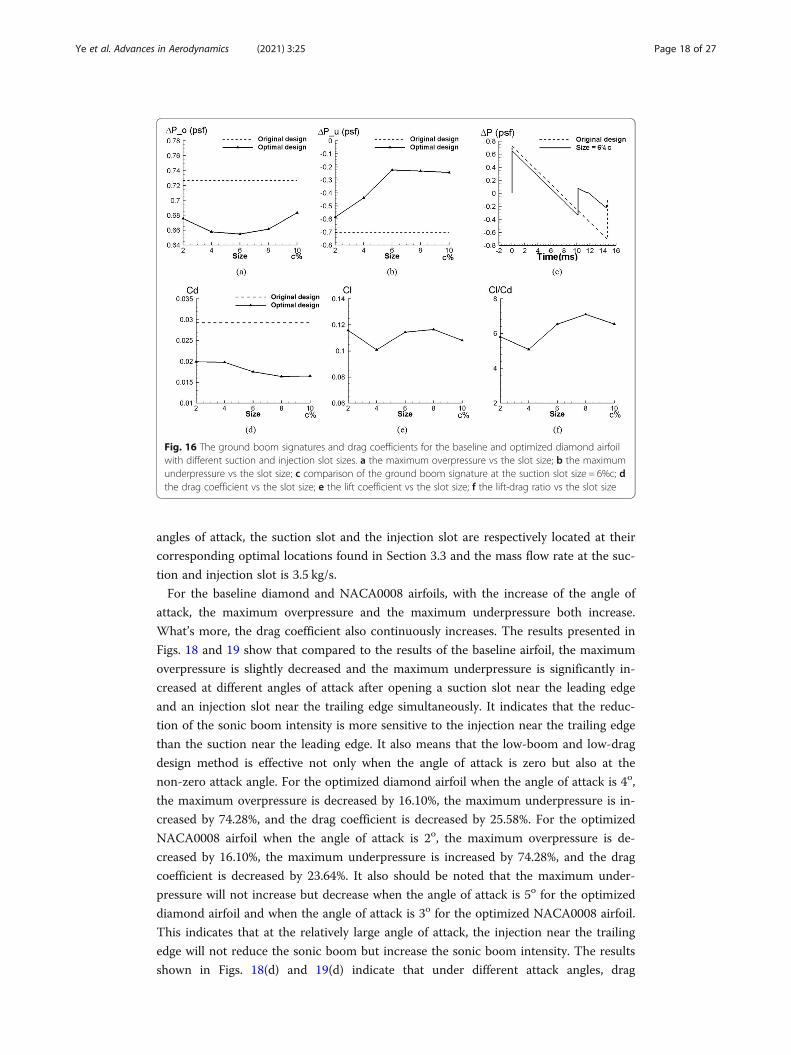
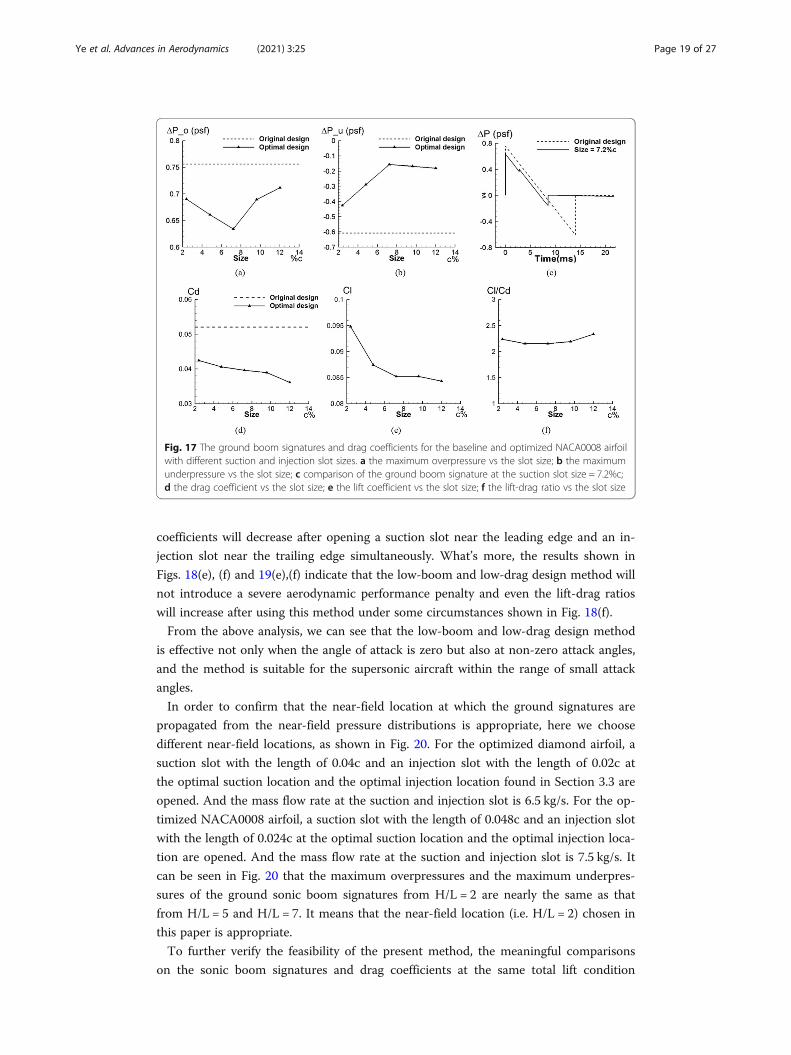
Figures 16 and 17 show the effects of the suction and injection slot size on the
ground boom signatures, drag coefficients, lift coefficients and lift-drag ratios for the
optimized diamond airfoil and the optimized NACA0008 airfoil, respectively. In
Figs. 16(a), (b) and 17(a), (b), the results show that with the increase of the suction and
injection slot size, the maximum overpressure of the ground boom signature firstly de-
creases and then increases gradually, the maximum underpressure of the ground boom
signature firstly increases and then decreases gradually. It indicates that the sonic boom
Fig. 11 Computed pressure contours with streamlines at the mass flow rate = 6.5 kg/s. a for the wholeoptimized diamond airfoil b for the suction slot c for the injection slot
Fig. 12 The near-field singatures and corresponding ground signatures for the baseline and optimizeddiamond airfoil at the mass flow rate = 6.5 kg/s. a comparison of the near-filed signature b comparison ofthe ground boom signature
Ye et al. Advances in Aerodynamics (2021) 3:25 Page 15 of 27

intensity decreases with the increasing of the suction and injection slot size. When the
suction and injection slot size reaches a certain value, the sonic boom intensity will not
decrease but will increase. This is because when the suction slot size is too large, the
suction near the leading edge will affect the flow field near the trailing edge and then
negatively affect the pressure distribution near the trailing edge. Similarly, when the in-
jection slot size is too large, the injection near the trailing edge has an influence on the
flow field near the leading edge and then has a harmful effect on the pressure distribu-
tion near the leading edge. There is a minimum sonic boom intensity for the optimized
diamond airfoil when the suction slot size is 6%c and the injection slot size is 8%c. And
for the optimized NACA0008 airfoil, when the suction slot size is 7.2%c and the injec-
tion slot size is 9.6%c the sonic boom intensity is lowest. Figure 16(c) shows the com-
parison of the ground boom signature for the baseline and the optimized diamond
Fig. 13 The ground boom signatures and drag coefficients for the baseline and optimized NACA0008 airfoilwith different mass flow rates. a the maximum overpressure vs the mass flow rate; b the maximumunderpressure vs the mass flow rate; c the drag coefficient vs the mass flow rate; d the lift coefficient vs themass flow rate; e the lift-drag ratio vs the mass flow rate
Fig. 14 Computed pressure contours with streamlines at the mass flow rate = 7.5 kg/s. a for the wholeoptimized NACA0008 airfoil b for the suction slot c for the injection slot
Ye et al. Advances in Aerodynamics (2021) 3:25 Page 16 of 27
airfoil when the suction slot size is 6%c. It can be shown that the maximum overpres-
sure is decreased by 9.95%, and the maximum underpressure is increased by 68.20%.
Figure 17(c) shows the comparison of the ground boom signature for the baseline and
the optimized NACA0008 airfoil when the suction slot size is 7.2%c. It can be seen that
the maximum overpressure is decreased by 16.10%, and the maximum underpressure is
increased by 74.28%. Figures 16(d) and 17(d) show the effects of the suction and injec-
tion slot size on the drag coefficient for the optimized diamond airfoil and the opti-
mized NACA0008 airfoil, respectively. The results indicate that the drag coefficient
continuously decreases with the increment of the suction and injection slot size. The
drag coefficient is decreased by 25.02% for the optimized diamond airfoil when the suc-
tion slot size is 6%c. For the optimized NACA0008 airfoil when the suction slot size is
7.2%c, the drag coefficient is reduced by 23.15%. Figures 16(e), (f) and 17(e), (f) show
the effects of the suction and injection slot size on the lift coefficients and lift-drag
ratios.
The results shown in Figs. 16 and 17 indicate that the increment of the suction and
injection slot size can remarkably reduce the sonic boom intensity and the drag coeffi-
cients. However, the sonic boom intensity will not decrease but will increase when the
suction and injection slot size reaches a certain value. On the other hand, the too large
suction and injection slot size also has a harmful effect on the stiffness of the wing in
the engineering practice. Thus, the appropriate suction and injection slot size should be
chosen when the low-boom and low-drag design method is used.
3.6 The effects of attack angle
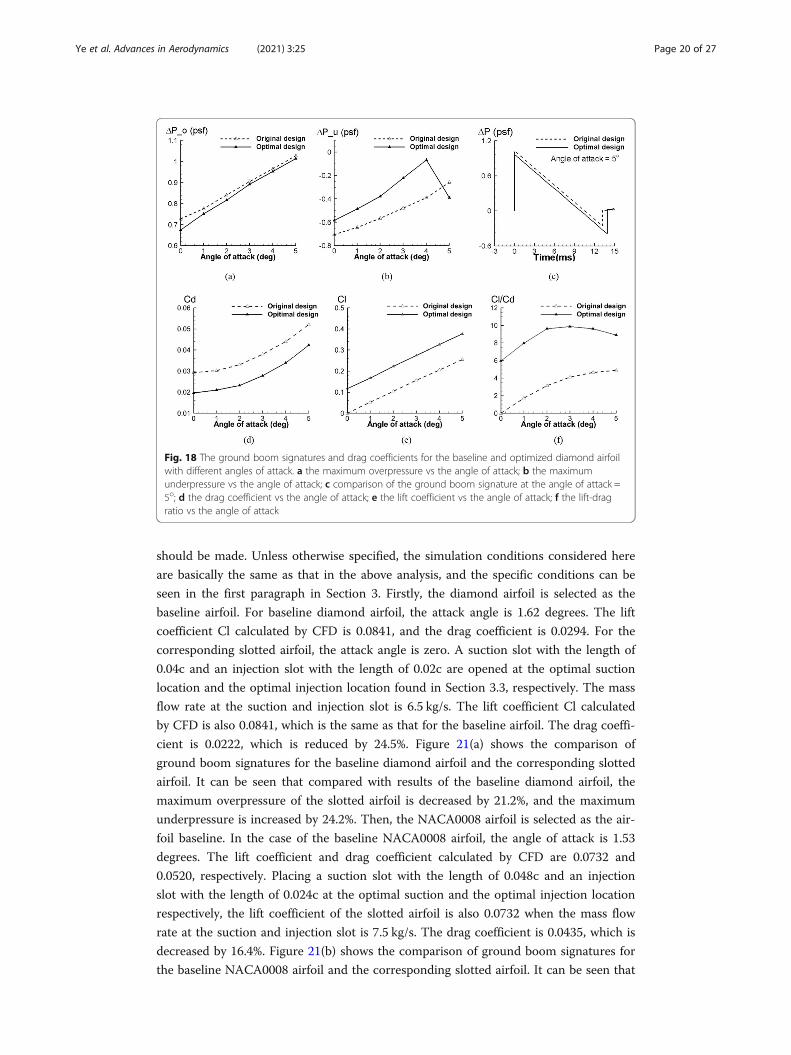
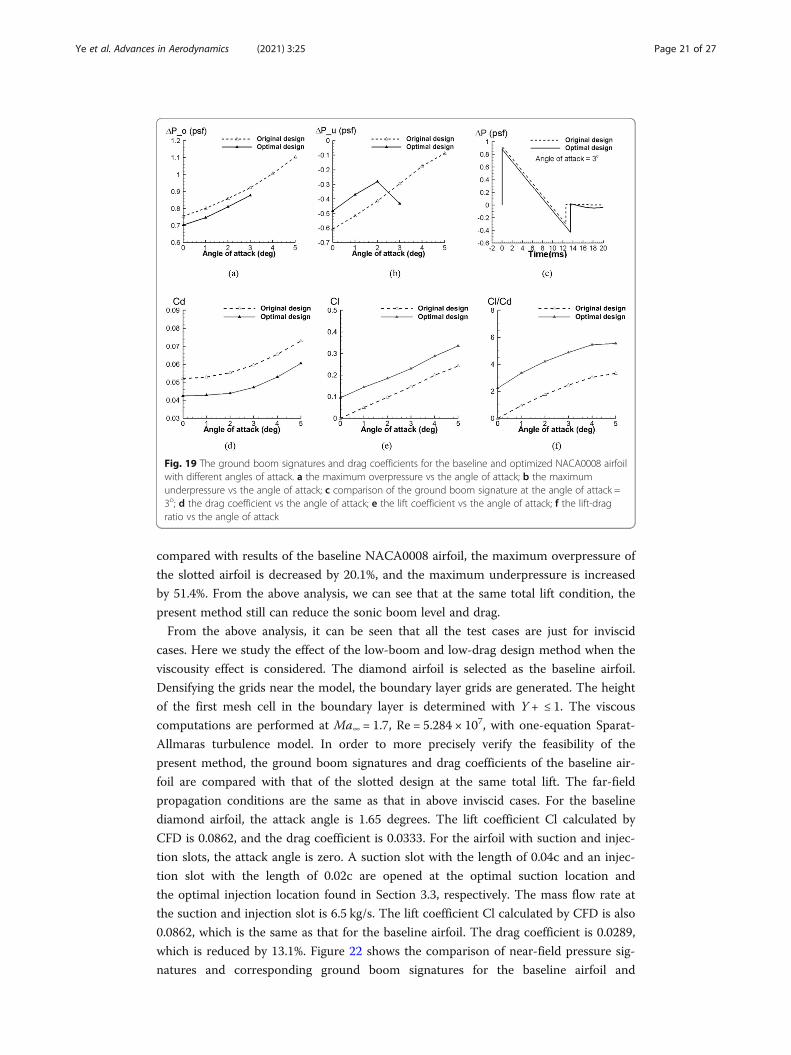
The effects of angles of attack on the ground boom signatures, drag coefficients, lift co-
efficients and lift-drag ratios for the baseline and optimized diamond airfoil are shown
in Fig. 18. And Fig. 19 shows the ground boom signatures, drag coefficients, lift coeffi-
cients and lift-drag ratios for the baseline and optimized NACA0008 airfoil at different
angles of attack. For the optimized diamond and NACA0008 airfoils with different
Fig. 15 The near-field signatures and corresponding ground signatures for the baseline and optimizedNACA0008 airfoil at the mass flow rate = 7.5 kg/s. a comparison of the near-field signature b comparison ofthe ground boom signature
Ye et al. Advances in Aerodynamics (2021) 3:25 Page 17 of 27
angles of attack, the suction slot and the injection slot are respectively located at their
corresponding optimal locations found in Section 3.3 and the mass flow rate at the suc-
tion and injection slot is 3.5 kg/s.
For the baseline diamond and NACA0008 airfoils, with the increase of the angle of
attack, the maximum overpressure and the maximum underpressure both increase.
What’s more, the drag coefficient also continuously increases. The results presented in
Figs. 18 and 19 show that compared to the results of the baseline airfoil, the maximum
overpressure is slightly decreased and the maximum underpressure is significantly in-
creased at different angles of attack after opening a suction slot near the leading edge
and an injection slot near the trailing edge simultaneously. It indicates that the reduc-
tion of the sonic boom intensity is more sensitive to the injection near the trailing edge
than the suction near the leading edge. It also means that the low-boom and low-drag
design method is effective not only when the angle of attack is zero but also at the
non-zero attack angle. For the optimized diamond airfoil when the angle of attack is 4o,
the maximum overpressure is decreased by 16.10%, the maximum underpressure is in-
creased by 74.28%, and the drag coefficient is decreased by 25.58%. For the optimized
NACA0008 airfoil when the angle of attack is 2o, the maximum overpressure is de-
creased by 16.10%, the maximum underpressure is increased by 74.28%, and the drag
coefficient is decreased by 23.64%. It also should be noted that the maximum under-
pressure will not increase but decrease when the angle of attack is 5o for the optimized
diamond airfoil and when the angle of attack is 3o for the optimized NACA0008 airfoil.
This indicates that at the relatively large angle of attack, the injection near the trailing
edge will not reduce the sonic boom but increase the sonic boom intensity. The results
shown in Figs. 18(d) and 19(d) indicate that under different attack angles, drag
Fig. 16 The ground boom signatures and drag coefficients for the baseline and optimized diamond airfoilwith different suction and injection slot sizes. a the maximum overpressure vs the slot size; b the maximumunderpressure vs the slot size; c comparison of the ground boom signature at the suction slot size = 6%c; dthe drag coefficient vs the slot size; e the lift coefficient vs the slot size; f the lift-drag ratio vs the slot size
Ye et al. Advances in Aerodynamics (2021) 3:25 Page 18 of 27
coefficients will decrease after opening a suction slot near the leading edge and an in-
jection slot near the trailing edge simultaneously. What’s more, the results shown in
Figs. 18(e), (f) and 19(e),(f) indicate that the low-boom and low-drag design method will
not introduce a severe aerodynamic performance penalty and even the lift-drag ratios
will increase after using this method under some circumstances shown in Fig. 18(f).
From the above analysis, we can see that the low-boom and low-drag design method
is effective not only when the angle of attack is zero but also at non-zero attack angles,
and the method is suitable for the supersonic aircraft within the range of small attack
angles.
In order to confirm that the near-field location at which the ground signatures are
propagated from the near-field pressure distributions is appropriate, here we choose
different near-field locations, as shown in Fig. 20. For the optimized diamond airfoil, a
suction slot with the length of 0.04c and an injection slot with the length of 0.02c at
the optimal suction location and the optimal injection location found in Section 3.3 are
opened. And the mass flow rate at the suction and injection slot is 6.5 kg/s. For the op-
timized NACA0008 airfoil, a suction slot with the length of 0.048c and an injection slot
with the length of 0.024c at the optimal suction location and the optimal injection loca-
tion are opened. And the mass flow rate at the suction and injection slot is 7.5 kg/s. It
can be seen in Fig. 20 that the maximum overpressures and the maximum underpres-
sures of the ground sonic boom signatures from H/L = 2 are nearly the same as that
from H/L = 5 and H/L = 7. It means that the near-field location (i.e. H/L = 2) chosen in
this paper is appropriate.
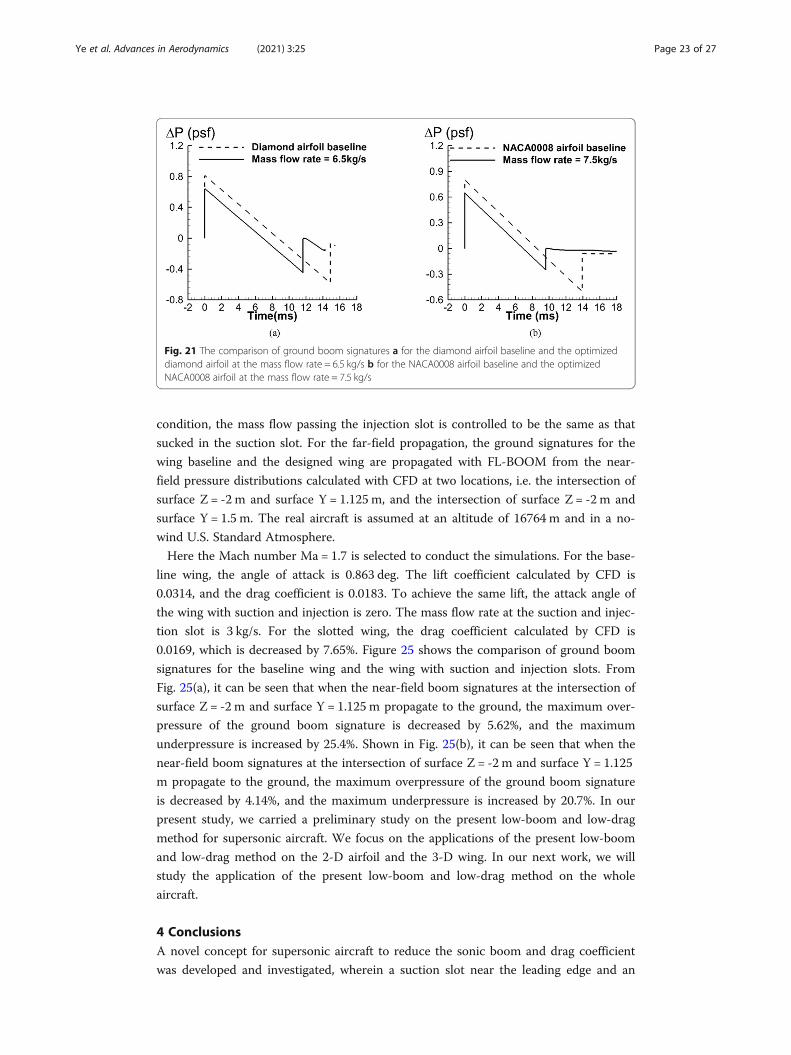
To further verify the feasibility of the present method, the meaningful comparisons
on the sonic boom signatures and drag coefficients at the same total lift condition
Fig. 17 The ground boom signatures and drag coefficients for the baseline and optimized NACA0008 airfoilwith different suction and injection slot sizes. a the maximum overpressure vs the slot size; b the maximumunderpressure vs the slot size; c comparison of the ground boom signature at the suction slot size = 7.2%c;d the drag coefficient vs the slot size; e the lift coefficient vs the slot size; f the lift-drag ratio vs the slot size
Ye et al. Advances in Aerodynamics (2021) 3:25 Page 19 of 27
should be made. Unless otherwise specified, the simulation conditions considered here
are basically the same as that in the above analysis, and the specific conditions can be
seen in the first paragraph in Section 3. Firstly, the diamond airfoil is selected as the
baseline airfoil. For baseline diamond airfoil, the attack angle is 1.62 degrees. The lift
coefficient Cl calculated by CFD is 0.0841, and the drag coefficient is 0.0294. For the
corresponding slotted airfoil, the attack angle is zero. A suction slot with the length of
0.04c and an injection slot with the length of 0.02c are opened at the optimal suction
location and the optimal injection location found in Section 3.3, respectively. The mass
flow rate at the suction and injection slot is 6.5 kg/s. The lift coefficient Cl calculated
by CFD is also 0.0841, which is the same as that for the baseline airfoil. The drag coeffi-
cient is 0.0222, which is reduced by 24.5%. Figure 21(a) shows the comparison of
ground boom signatures for the baseline diamond airfoil and the corresponding slotted
airfoil. It can be seen that compared with results of the baseline diamond airfoil, the
maximum overpressure of the slotted airfoil is decreased by 21.2%, and the maximum
underpressure is increased by 24.2%. Then, the NACA0008 airfoil is selected as the air-
foil baseline. In the case of the baseline NACA0008 airfoil, the angle of attack is 1.53
degrees. The lift coefficient and drag coefficient calculated by CFD are 0.0732 and
0.0520, respectively. Placing a suction slot with the length of 0.048c and an injection
slot with the length of 0.024c at the optimal suction and the optimal injection location
respectively, the lift coefficient of the slotted airfoil is also 0.0732 when the mass flow
rate at the suction and injection slot is 7.5 kg/s. The drag coefficient is 0.0435, which is
decreased by 16.4%. Figure 21(b) shows the comparison of ground boom signatures for
the baseline NACA0008 airfoil and the corresponding slotted airfoil. It can be seen that
Fig. 18 The ground boom signatures and drag coefficients for the baseline and optimized diamond airfoilwith different angles of attack. a the maximum overpressure vs the angle of attack; b the maximumunderpressure vs the angle of attack; c comparison of the ground boom signature at the angle of attack =5o; d the drag coefficient vs the angle of attack; e the lift coefficient vs the angle of attack; f the lift-dragratio vs the angle of attack
Ye et al. Advances in Aerodynamics (2021) 3:25 Page 20 of 27
compared with results of the baseline NACA0008 airfoil, the maximum overpressure of
the slotted airfoil is decreased by 20.1%, and the maximum underpressure is increased
by 51.4%. From the above analysis, we can see that at the same total lift condition, the
present method still can reduce the sonic boom level and drag.
From the above analysis, it can be seen that all the test cases are just for inviscid
cases. Here we study the effect of the low-boom and low-drag design method when the
viscousity effect is considered. The diamond airfoil is selected as the baseline airfoil.
Densifying the grids near the model, the boundary layer grids are generated. The height
of the first mesh cell in the boundary layer is determined with Y + ≤ 1. The viscous
computations are performed at Ma∞ = 1.7, Re = 5.284 × 10⁷, with one-equation Sparat-
Allmaras turbulence model. In order to more precisely verify the feasibility of the
present method, the ground boom signatures and drag coefficients of the baseline air-
foil are compared with that of the slotted design at the same total lift. The far-field
propagation conditions are the same as that in above inviscid cases. For the baseline
diamond airfoil, the attack angle is 1.65 degrees. The lift coefficient Cl calculated by
CFD is 0.0862, and the drag coefficient is 0.0333. For the airfoil with suction and injec-
tion slots, the attack angle is zero. A suction slot with the length of 0.04c and an injec-
tion slot with the length of 0.02c are opened at the optimal suction location and
the optimal injection location found in Section 3.3, respectively. The mass flow rate at
the suction and injection slot is 6.5 kg/s. The lift coefficient Cl calculated by CFD is also
0.0862, which is the same as that for the baseline airfoil. The drag coefficient is 0.0289,
which is reduced by 13.1%. Figure 22 shows the comparison of near-field pressure sig-
natures and corresponding ground boom signatures for the baseline airfoil and
Fig. 19 The ground boom signatures and drag coefficients for the baseline and optimized NACA0008 airfoilwith different angles of attack. a the maximum overpressure vs the angle of attack; b the maximumunderpressure vs the angle of attack; c comparison of the ground boom signature at the angle of attack =3o; d the drag coefficient vs the angle of attack; e the lift coefficient vs the angle of attack; f the lift-dragratio vs the angle of attack
Ye et al. Advances in Aerodynamics (2021) 3:25 Page 21 of 27

the airfoil with suction and injection slots. It can be seen that compared with the re-
sults of the baseline airfoil, the maximum overpressure of the slotted airfoil is decreased
by 20.27%, and the maximum underpressure is increased by 11.35%.
In order to verify the feasibility of the present method in 3-D case, a wing based on
the airfoil of NACA0008 is adopted as the baseline wing. Figure 23 shows the geomet-
rical properties of the wing with suction and injection slots. As shown in Fig. 23, the
tip chord is cr = 1 m, the chord length of the wing tip is ct = 0.25 m, the leading edge
sweepback angle is Λ = 60o, the length of the semispan is 1/2b = 2 m, and the taper ra-
tio of the wing is ct/cr = 4.
When the present low-boom and low-drag method is applied on the 3-D wing, a suc-
tion slot near the leading edge and an injection slot near the trailing edge are opened
as shown in Fig. 23(a). For each airfoil section, the ratio of the distance between the suc-
tion slot and the leading edge to the local chord length is the same as each other, i.e., x
_ s3d/c = const. c is the local chord length, for example, c = cr for the airfoil at the wing
root and c = ct for the airfoil at the wingtip. Similarly, for each airfoil section, the ratio
of the distance between the injection slot and the leading edge to the local chord length
is the same as each other, i.e., x _ i3d/c = const. The ratios of x _ s3d/c = 4.65% and x _
i3d/c = 69.3% are selected. Shown in Fig. 23(b), the size of the suction slot is equal to
that of the injection slot, and they are both denoted as d. For an arbitrary airfoil sec-
tion, the size of the suction or injection slot is 2.4%c. For example, d = 0.024 m at
the wing root and d = 0.006 m at the wingtip.
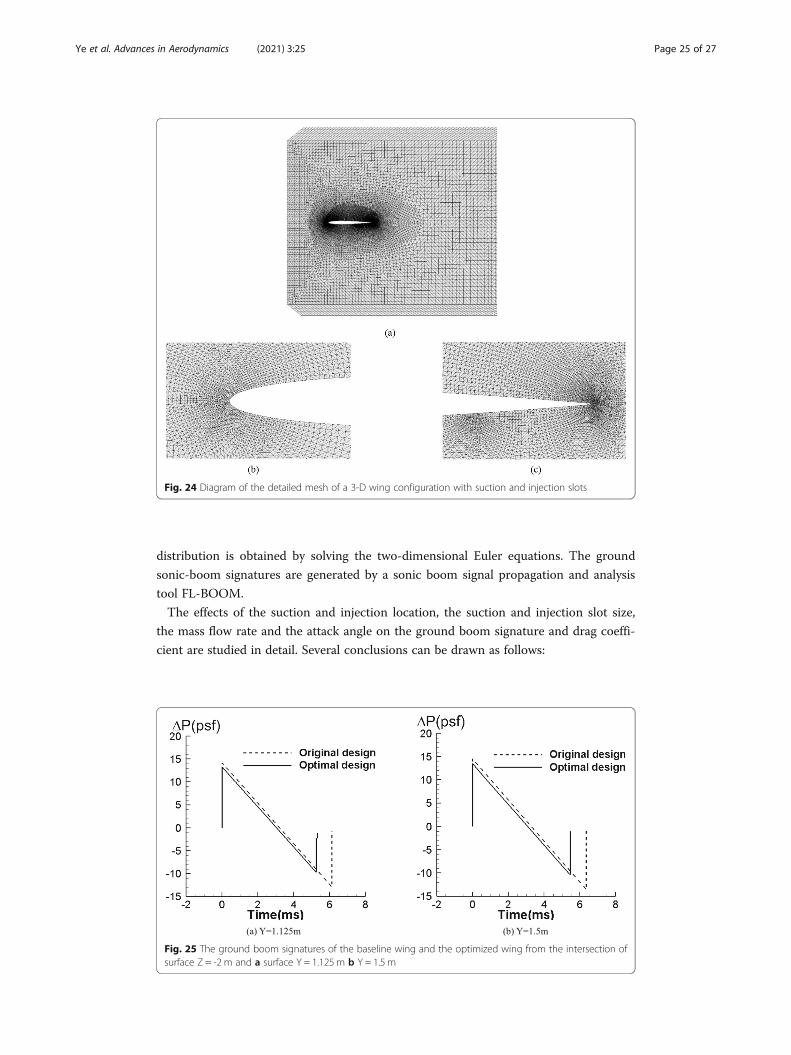
The hybrid meshes are generated for inviscid simulations for the baseline wing and
the wing with suction and injection slots, as shown in Fig. 24. The local mesh refine-
ment approach is adopted to ensure the accuracy of computations near the suction and
injection slot. For the wing with suction and injection slots, the node and cell numbers
are 3,120,363 and 10,644,795, respectively. The mesh convergence analysis has proved
that the present mesh can provide satisfactory results, and the mesh convergence ana-
lysis is not shown here. The boundary condition of the suction is set as the pressure
outlet condition, and the boundary condition of the injection is simulated with the vel-
ocity inlet condition. By adjusting the velocity value of the jet at the velocity inlet
Fig. 20 The ground boom signatures at H/L = 2, 5, 7 for a the baseline and optimized diamond airfoil andb the baseline and optimized NACA0008 airfoil
Ye et al. Advances in Aerodynamics (2021) 3:25 Page 22 of 27
condition, the mass flow passing the injection slot is controlled to be the same as that
sucked in the suction slot. For the far-field propagation, the ground signatures for the
wing baseline and the designed wing are propagated with FL-BOOM from the near-
field pressure distributions calculated with CFD at two locations, i.e. the intersection of
surface Z = -2 m and surface Y = 1.125 m, and the intersection of surface Z = -2 m and
surface Y = 1.5 m. The real aircraft is assumed at an altitude of 16764 m and in a no-
wind U.S. Standard Atmosphere.
Here the Mach number Ma = 1.7 is selected to conduct the simulations. For the base-
line wing, the angle of attack is 0.863 deg. The lift coefficient calculated by CFD is
0.0314, and the drag coefficient is 0.0183. To achieve the same lift, the attack angle of
the wing with suction and injection is zero. The mass flow rate at the suction and injec-
tion slot is 3 kg/s. For the slotted wing, the drag coefficient calculated by CFD is
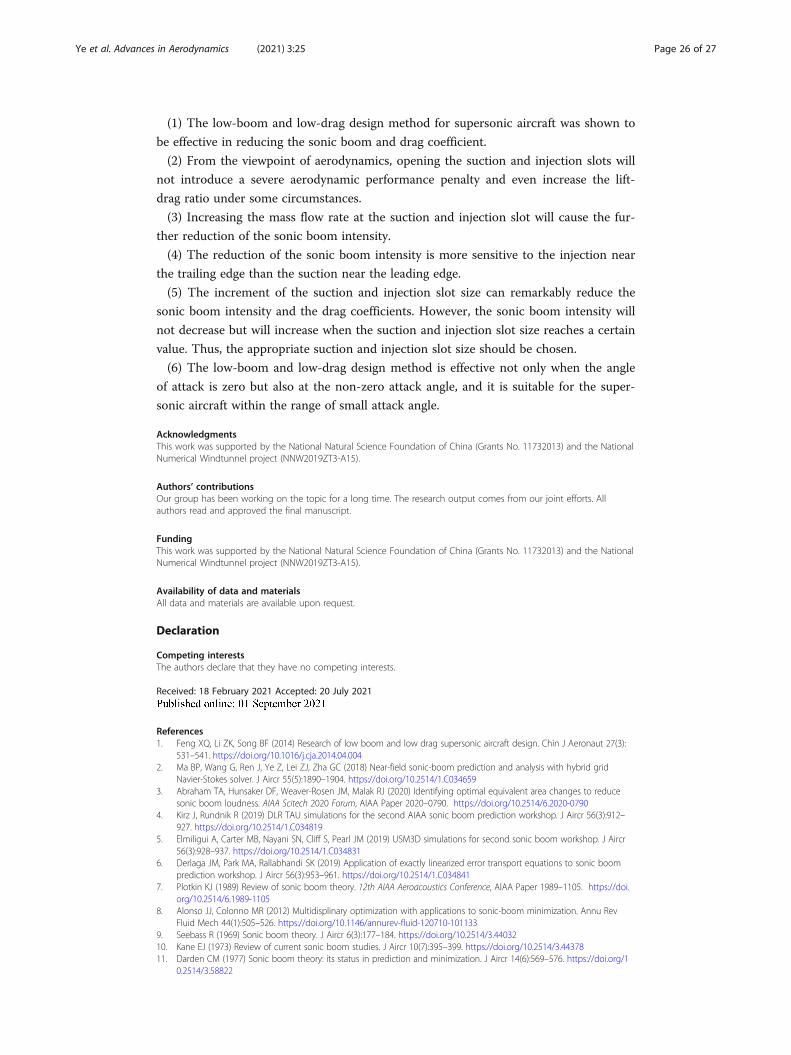
0.0169, which is decreased by 7.65%. Figure 25 shows the comparison of ground boom
signatures for the baseline wing and the wing with suction and injection slots. From
Fig. 25(a), it can be seen that when the near-field boom signatures at the intersection of
surface Z = -2 m and surface Y = 1.125 m propagate to the ground, the maximum over-
pressure of the ground boom signature is decreased by 5.62%, and the maximum
underpressure is increased by 25.4%. Shown in Fig. 25(b), it can be seen that when the
near-field boom signatures at the intersection of surface Z = -2 m and surface Y = 1.125
m propagate to the ground, the maximum overpressure of the ground boom signature
is decreased by 4.14%, and the maximum underpressure is increased by 20.7%. In our
present study, we carried a preliminary study on the present low-boom and low-drag
method for supersonic aircraft. We focus on the applications of the present low-boom
and low-drag method on the 2-D airfoil and the 3-D wing. In our next work, we will
study the application of the present low-boom and low-drag method on the whole
aircraft.
4 ConclusionsA novel concept for supersonic aircraft to reduce the sonic boom and drag coefficient
was developed and investigated, wherein a suction slot near the leading edge and an
Fig. 21 The comparison of ground boom signatures a for the diamond airfoil baseline and the optimizeddiamond airfoil at the mass flow rate = 6.5 kg/s b for the NACA0008 airfoil baseline and the optimizedNACA0008 airfoil at the mass flow rate = 7.5 kg/s
Ye et al. Advances in Aerodynamics (2021) 3:25 Page 23 of 27

injection slot near the trailing edge on the airfoil suction surface are opened. For en-
ergy saving, the suction and injection slots can be selectively opened, which are opened
when the supersonic aircraft flies over the city but are closed when the aircraft flies
over the sea. To make sure of a zero net mass flux flow control, the mass flow sucked
in near the leading edge is equal to the mass flow injected near the trailing edge. The
diamond and NACA0008 airfoils are adopted as the baseline airfoil to verify the cap-
ability of the proposed design method. Using the structured grid, the near field pressure
Fig. 22 The near-field signatures and corresponding ground signatures for the baseline airfoil andthe optimized diamond airfoil at the mass flow rate = 6.5 kg/s. a comparison of the near-field signature bcomparison of the ground boom signature
Fig. 23 Diagrams of configurations for a 3-D wing with suction and injection slots
Ye et al. Advances in Aerodynamics (2021) 3:25 Page 24 of 27
distribution is obtained by solving the two-dimensional Euler equations. The ground
sonic-boom signatures are generated by a sonic boom signal propagation and analysis
tool FL-BOOM.
The effects of the suction and injection location, the suction and injection slot size,
the mass flow rate and the attack angle on the ground boom signature and drag coeffi-
cient are studied in detail. Several conclusions can be drawn as follows:
Fig. 24 Diagram of the detailed mesh of a 3-D wing configuration with suction and injection slots
Fig. 25 The ground boom signatures of the baseline wing and the optimized wing from the intersection ofsurface Z = -2 m and a surface Y = 1.125 m b Y = 1.5 m
Ye et al. Advances in Aerodynamics (2021) 3:25 Page 25 of 27
(1) The low-boom and low-drag design method for supersonic aircraft was shown to
be effective in reducing the sonic boom and drag coefficient.
(2) From the viewpoint of aerodynamics, opening the suction and injection slots will
not introduce a severe aerodynamic performance penalty and even increase the lift-
drag ratio under some circumstances.
(3) Increasing the mass flow rate at the suction and injection slot will cause the fur-
ther reduction of the sonic boom intensity.
(4) The reduction of the sonic boom intensity is more sensitive to the injection near
the trailing edge than the suction near the leading edge.
(5) The increment of the suction and injection slot size can remarkably reduce the
sonic boom intensity and the drag coefficients. However, the sonic boom intensity will
not decrease but will increase when the suction and injection slot size reaches a certain
value. Thus, the appropriate suction and injection slot size should be chosen.
(6) The low-boom and low-drag design method is effective not only when the angle
of attack is zero but also at the non-zero attack angle, and it is suitable for the super-
sonic aircraft within the range of small attack angle.
AcknowledgmentsThis work was supported by the National Natural Science Foundation of China (Grants No. 11732013) and the NationalNumerical Windtunnel project (NNW2019ZT3-A15).
Authors’ contributionsOur group has been working on the topic for a long time. The research output comes from our joint efforts. Allauthors read and approved the final manuscript.
FundingThis work was supported by the National Natural Science Foundation of China (Grants No. 11732013) and the NationalNumerical Windtunnel project (NNW2019ZT3-A15).
Availability of data and materialsAll data and materials are available upon request.
Declaration
Competing interestsThe authors declare that they have no competing interests.
Received: 18 February 2021 Accepted: 20 July 2021
References1. Feng XQ, Li ZK, Song BF (2014) Research of low boom and low drag supersonic aircraft design. Chin J Aeronaut 27(3):
531–541. https://doi.org/10.1016/j.cja.2014.04.0042. Ma BP, Wang G, Ren J, Ye Z, Lei ZJ, Zha GC (2018) Near-field sonic-boom prediction and analysis with hybrid grid
Navier-Stokes solver. J Aircr 55(5):1890–1904. https://doi.org/10.2514/1.C0346593. Abraham TA, Hunsaker DF, Weaver-Rosen JM, Malak RJ (2020) Identifying optimal equivalent area changes to reduce
sonic boom loudness. AIAA Scitech 2020 Forum, AIAA Paper 2020–0790. https://doi.org/10.2514/6.2020-07904. Kirz J, Rundnik R (2019) DLR TAU simulations for the second AIAA sonic boom prediction workshop. J Aircr 56(3):912–
927. https://doi.org/10.2514/1.C0348195. Elmiligui A, Carter MB, Nayani SN, Cliff S, Pearl JM (2019) USM3D simulations for second sonic boom workshop. J Aircr
56(3):928–937. https://doi.org/10.2514/1.C0348316. Derlaga JM, Park MA, Rallabhandi SK (2019) Application of exactly linearized error transport equations to sonic boom
prediction workshop. J Aircr 56(3):953–961. https://doi.org/10.2514/1.C0348417. Plotkin KJ (1989) Review of sonic boom theory. 12th AIAA Aeroacoustics Conference, AIAA Paper 1989–1105. https://doi.
org/10.2514/6.1989-11058. Alonso JJ, Colonno MR (2012) Multidisplinary optimization with applications to sonic-boom minimization. Annu Rev
Fluid Mech 44(1):505–526. https://doi.org/10.1146/annurev-fluid-120710-1011339. Seebass R (1969) Sonic boom theory. J Aircr 6(3):177–184. https://doi.org/10.2514/3.4403210. Kane EJ (1973) Review of current sonic boom studies. J Aircr 10(7):395–399. https://doi.org/10.2514/3.4437811. Darden CM (1977) Sonic boom theory: its status in prediction and minimization. J Aircr 14(6):569–576. https://doi.org/1
0.2514/3.58822
Ye et al. Advances in Aerodynamics (2021) 3:25 Page 26 of 27
12. Liebhardt B, Luetjens K, Gollnick V (2011) Estimation of the market potential for supersonic airliners via analysis of theglobal premium ticket market. 11th AIAA Aviation Technology, Integration, and Operations (ATIO) Conference, AIAA Paper2011–6806. https://doi.org/10.2514/6.2011-6806
13. Cheung SH, Edwards TA, Lawrence SL (1992) Application of computational fluid dynamics to sonic boom near- andmid-field prediction. J Aircr 29(5):920–925. https://doi.org/10.2514/3.46263
14. Nadarajah SK, Jameson A, Alonso JJ (2002) Sonic boom reduction using an adjoint method for wing-bodyconfigurations in supersonic flow. 9th AIAA/ISSMO Symposium on Multidisciplinary Analysis and Optimization Conference,AIAA Paper 2002–5547. https://doi.org/10.2514/6.2002-5547
15. Jones LB (1961) Lower bounds for sonic bangs. J Aeronamutical Soc 65(606):433–436. https://doi.org/10.1017/s0368393100074757
16. Carlson HW (1962) The lower bound of attainable sonic-boom overpressure and design methods of approaching thislimit. NASA TN-D-1494
17. Carlson HW (1964) Influence of airplane configuration on sonic boom characteristics. J Aircr 1(2):82–86. https://doi.org/10.2514/3.43562
18. George AR, Seebass R (1971) Sonic boom minimization including both front and rear shocks. AIAA J 9(10):2091–2093.https://doi.org/10.2514/3.6478
19. Seebass R, George AR (1972) Sonic boom minimization. J Acoustic Soc Am 51(2):684–694. https://doi.org/10.1121/1.1975937
20. Darden CM (1979) Sonic-boom minimization with nose-bluntness relaxation. NASA TP-1348, p .1–5821. Ordaz I, Li W (2016) Approximation of off-body sonic-boom analysis for low-boom conceptual design. J Aircr 53(1):14–
19. https://doi.org/10.2514/1.C03315922. Minelli A, Din IS, Carrier G (2014) Inverse design approach for low-boom supersonic configurations. AIAA J 52(10):2198–
2212. https://doi.org/10.2514/1.J05283423. Zhang YD, Huang JT, Gao ZH, Wang C, Shu B (2019) Inverse design of low boom configurations using proper
orthogonal decomposition and augmented Burgers equation. Chin J Aeronaut 32(6):1380–1389. https://doi.org/10.1016/j.cja.2019.03.017
24. Marconi F, Bowersox R, Schetz J (2003) Sonic boom alleviation using keel configurations. J Aircr 40(2):363–369. https://doi.org/10.2514/2.3101
25. Howe DC (2005) Improved sonic boom minimization with extendable nose spike. 43rd AIAA Aerospace Sciences Meetingand Exhibit, AIAA Paper 2005–1014. https://doi.org/10.2514/6.2005-1014
26. Freund D, Simmons F, Spivey ND, Schuster L (2007) Quiet Spike™ prototype flight test results. 48th AIAA/ASME/ASCE/AHS/ASC Structures, Structural Dynamics, and Materials Conference, AIAA Paper 2007–1778. https://doi.org/10.2514/6.2007-1778
27. Ban N, Yamazaki W, Kusunose K (2018) Low-boom/low-drag design optimization of innovative supersonic transportconfiguration. J Aircr 55(3):1071–1080. https://doi.org/10.2514/1.C034171
28. Sun Y, Smith H (2019) Low-boom low-drag solutions through the evaluation of different supersonic business jetconcepts. Aeronautic J 124(1271):76–95. https://doi.org/10.1017/aer.2019.131
29. Sun Y, Smith H (2019) Low-boom low-drag optimization in a multidisciplinary design analysis optimization environment.Aerosp Sci Technol 94:1–20. https://doi.org/10.1016/j.ast.2019.105387
30. Anthonv RP (2007) Spectrally accurate prediction of sonic boom signals. AIAA J 45(9):2149–2156. https://doi.org/10.2514/1.28159
31. Cheung S, Edwards T, Lawrence S (1990) Application of CFD to sonic boom near and midfield prediction. NASA TM-102867
32. Siclari MJ, Darden CM (1993) Euler code prediction of near-field to midfield sonic boom pressure signatures. J Aircr30(6):911–917. https://doi.org/10.2514/3.46434
33. Whitham GB (1952) The flow pattern of a supersonic projectile. Commun Pure Appl Math 5(3):301–348. https://doi.org/10.1002/(ISSN)1097-0312
34. Rallabhandi SK (2011) Advanced sonic boom prediction using the augmented Burgers equation. J Aircr 48(4):1245–1253.https://doi.org/10.2514/1.C031248
35. Auger T, Coulouvrat F (2002) Numerical simulation of sonic boom focusing. AIAA J 40(9):1726–1734. https://doi.org/10.2514/2.1877
36. Kanamori M, Takahashi T, Makino Y (2017) Effect of low-boom waveform on focus boom using lossy nonlinear Tricomianalysis. AIAA J 55(6):2029–2042. https://doi.org/10.2514/1.J055226
37. Xu R (2016) Numerical comparison of prediction methods for ground sonic boom evaluation on supersonic vehicle.National Conference on Aeroacoustics (in Chinese)
38. Thomas CL (1972) Extrapolation of sonic boom pressure signatures by the waveform parameter method. NASA TN D-6832
39. Leatherwood JD, Sullivan BM, Shepherd KP (2002) A summary of recent NASA studies of human response to sonicbooms. J Acoustic Soc Am 111(1):586–598. https://doi.org/10.1121/1.1371767
40. Zha GC, Paxton CD, Conley CA, Wells A, Carroll BF (2006) Effect of injection slot size on the performance of coflow jetairfoil. J Aircr 43(4):987–995. https://doi.org/10.2514/1.16999
41. Zha G-C, Paxton C (2004) A novel airfoil circulation augment flow control method using co-flow jet. NASA CP-2005-213509, June 2005; also AIAA Paper 2004–2208
Publisher’s NoteSpringer Nature remains neutral with regard to jurisdictional claims in published maps and institutional affiliations.
Ye et al. Advances in Aerodynamics (2021) 3:25 Page 27 of 27