Embed Size (px)
Citation preview

A lock-in-based method to examine the thermalsignatures of magnetic nanoparticles in the liquid,solid and aggregated states†
C. A. Monnier,a M. Lattuada,a D. Burnand,b F. Crippa,a J. C. Martinez-Garcia,a
A. M. Hirt,c B. Rothen-Rutishauser,a M. Bonmarin*d and A. Petri-Fink*a,b
We propose a new methodology based on lock-in thermography to study and quantify the heating power
of magnetic nanoparticles. Superparamagnetic iron oxide nanoparticles exposed to a modulated alternat-
ing magnetic field were used as model materials to demonstrate the potency of the system. Both quanti-
tative and qualitative information on their respective heating power was extracted at high thermal
resolutions under increasingly complex conditions, including nanoparticles in the liquid, solid and aggre-
gated states. Compared to conventional techniques, this approach offers a fast, sensitive and non-intru-
sive alternative to investigate multiple and dilute specimens simultaneously, which is essential for
optimizing and accelerating screening procedures and comparative studies.
1. Introduction
Magnetic nanoparticles (NPs) are fascinating materials fordesigning nanoscale tools, as their behaviour can be tailoredand remotely controlled. In this context, iron oxide NPs(SPIONs) are frequently used candidates owing to their super-paramagnetic properties.1,2 These NPs generate heat whenexposed to an alternating magnetic field (AMF) as a result ofrelaxation processes,1,3 which in turn render them intriguingfor a wide range of applications.4–11 One notable implicationof this feature is using the converted energy for medical pur-poses (e.g. for cancer therapy by means of magnetic fluidhyperthermia),8,12 and both research and development are cur-rently ongoing to translate this technology to the bedside.7,8,13
Effective conversion of magnetic energy into heat is essen-tial to keep administration dosages minimal and therapeuticefficiency maximal. This factor, usually represented in theliterature by the Specific Adsorption Rate (SAR),2,14,15 is knownto be dictated by many specific material properties, such asthe NP type, size, polydispersity, surface or surface chemistry,
crystallinity or state of dispersion.3,14,16–21 Experimentallyassessing the heating efficiency of the respective NPs is thus aprerequisite prior to their usage, given the numerous variableswhich may affect the energy output. Evidently, reliable andsuitable analytical methods are required for this task.
With respect to magnetic NPs and their heating power,standard calorimetric methods, which rely on measuring thetransient temperature rise of the sample as a function of time,are among the most straightforward and widely usedapproaches.2,22 The SAR can, amongst other methods,15 bededuced by assessing the initial heating slope (i.e., Δtempera-ture/Δtime).15,22,23 Although increasingly popular, numerousuncertainties are linked to the experimental parameters (e.g.the AMF field strength and frequency) and data analysismethods (e.g. at what time point to set the fit),15 and areknown to significantly affect the final outcomes.22–24 As aresult, considerable divergence in SAR values can be observedin the literature, rendering direct comparison difficult betweensynthetic procedures, research groups and institutions.14,24
Differences are found between the used characterizationsensors as well, with fiberoptic cables being the most rep-resented in the field.2,22 Being “immune” to the effects of anAMF, they are ideal to record temperature variations over timewithin a (colloidal) solution. However, the data acquisition isone-dimensional, and single-point measurements cover only asmall fraction of the sample, which renders the probe suscep-tible to selective positioning.22 As an example, it has beenshown that reported SAR values, amongst others, depend onthe positioning of the temperature sensor.22,25 Moreover, fiber-optic cables are invasive, implicating that any sample of
†Electronic supplementary information (ESI) available. See DOI: 10.1039/c6nr02066f
aAdolphe Merkle Institute, University of Fribourg, Chemin des Verdiers 4,
1700 Fribourg, Switzerland. E-mail: [email protected] Department, University of Fribourg, Chemin du Musée 9, 1700 Fribourg,
SwitzerlandcInstitute of Geophysics, ETH Zurich, Sonneggstrasse 5, CH-8092 Zurich, SwitzerlanddInstitute of Computational Physics, Zurich University of Applied Sciences,
Technikumstrasse 9, 8400 Winterthur, Switzerland.
E-mail: [email protected]
1
Published in "Nanoscale 8(27): 13321–13332, 2016" which should be cited to refer to this work.

interest needs to be compliant enough to be investigated.Thermal imaging – or thermography – is another option whichprovides a two-dimensional,26 non-invasive thermal overviewof the sample surface,27 offering the possibility of investigatingseveral samples at once along with controls. However, thermalwaves from localized hotspots diffuse rapidly and blur thelocation of the heat sources. Moreover, heat losses to the sur-rounding occurring over time, either by convection or conduc-tion, subsequently affect the sample temperature and limit thespatial resolution,28 accuracy, precision and clarity. In thisrespect, an analytical method which combines the aforemen-tioned positive attributes with specificity, simplicity, objective-ness in data analysis and user-friendliness has not yet beenreported, but would offer a considerably broader range ofanalytical and experimental opportunities.
A promising and rather unexplored alternative is offered bylock-in thermography (LIT), a methodology pioneered in 1984which is based on the modulation of thermal radiation.29 Inshort, the heat-generating stimulus is periodically modulatedover a specified number of cycles while an infrared cameracontinuously records the thermal events. The data acquisitionand output are unlike other methods in that rather thanrecording variations of temperature over time, the amplitude,or the magnitude of the temperature oscillations during themodulation cycles, is determined. In turn, thermal signalsunrelated to the induced heat (e.g. steady temperature drifts orreflections) are selectively filtered out. Temperature variationsas low as 0.001 K can be detected,28,29 and lateral heat spread-ing is suppressed if the modulation frequency is set highenough. LIT with all its benefits is thus currently a standardmethod used to test composite materials and electronic com-ponents (e.g. solar panels).28,30 Though this method has notestablished itself in the field of magnetic NPs, it offers distinctadvantages when addressing the previously mentioned con-cerns in investigating them. For example, magnetic NPs can bedetected by LIT if the AMF is modulated.26,31 Whether quanti-tative data can be extracted from these measurements has,however, not been addressed to date.
In this study, we demonstrate that LIT can be used as botha qualitative as well as a quantitative tool to examine thethermal signatures of magnetic NPs. SPIONs exposed to amodulated AMF were chosen as model heat-generating NPsdue to their versatility and prominence in medical research.This method is then applied to systematically screen theirheating power by deducing the initial heating slope from therecorded amplitude images. By doing so, we show that quan-titative data can be derived directly without any post-proces-sing steps (e.g. fitting), thus avoiding the repetitivelyaddressed uncertainties and subjectivity in data analysis.15,22
For validation, data are compared to results obtained by con-ventional methods (i.e., fiberoptic cables or standard thermo-graphy) and simulations,3 which highlight both the precisionand sensitivity of the approach. The implication of theseadvantages is underlined by showing the thermal behaviourof these NPs of different sizes, concentrations and states ofdispersion.
LIT yields a two-dimensional, contactless overview of therespective heating slopes in the regions of interest. Thisenables the investigation of multiple samples simultaneously,along with controls. We show as well that more complexsamples, such as semi-solid or solid models, can be investi-gated while avoiding the previously addressed concerns.22 Inreturn, the reliability of fiberoptic cables and two-dimensionalfeatures of thermal imaging devices are combined with LIT,which is further enhanced by rapidity and objectiveness. Giventhe need of using more standardized equipment and complexmodels,16,32 this method helps by predicting the thermal be-haviour of NPs in any state of matter, which will consequentlyaid in enhancing their applicative value.
2. Experimental methodsIron oxide nanoparticles
Iron oxide NPs coated with oleic acid were prepared bythermal decomposition.33,34 Prior to this, an iron oleatecomplex was prepared by boiling a mixture of iron chlorideand sodium oleate in a 1 : 3 ratio overnight and subsequentlywashing it with Milli-Q water. Oleic acid and iron oleate werethen mixed in a 250 mL round bottom flask and kept in avacuum oven (50 °C, 2 h) prior to usage. The mixture was thenthermally decomposed in high boiling solvents under inertatmospheres (argon) and magnetic stirring. Defined heatingramps were used for every synthesis (ESI†). The respective NPsizes were tuned by using different reactant ratios (i.e., ironoleate : oleic acid ratios between 1.5 : 1 and 2.2 : 1), solvents(i.e., trioctylamine and docosan) and decomposition tempera-tures (i.e., 320 and 335 °C). The final temperature and the reac-tion time at the maximum temperature were varied accordingto the desired NP size. A detailed summary of all these para-meters along with representative transmission electron micro-graphs is provided in the ESI.† The reaction was then cooleddown quickly, resulting in a black-brownish suspension. Theparticles were then precipitated/washed three times withethanol/hexane (5 : 1 volume ratio) and centrifuged (30 000g,3 minutes) and finally re-suspended in hexane.
Ligand exchange and surface polymer synthesis
As a first step, oleic acid was exchanged with citric acid torender the hydrophobic NPs hydrophilic.35 The NPs were pre-cipitated by ethanol and collected with a strong magnet, andthen redispersed in a 1 : 1 DMF : DCB (volume ratio) solution.Citric acid was then added (1–2 mg per mg Fe) to the mixture,which was then heated at 100 °C for 24 h. The particles werethen precipitated again with ethanol and a strong magnet,washed three times with acetone and redispersed in Milli-Qwater. 1–2 droplets of aqueous ammonia were added torender the solution optically homogeneous. As a second step,citric acid as a surface molecule was exchanged with catechol-PEG-maleimide (5 kDa).36 The synthesis of the latter wasadapted from a previously described method.37 A solution ofdopamine hydrochloride (304 mg, 1.602 mmol, 10.0 eq.) and
2

saturated NaHCO3 was degassed with argon for 10 minutes.Maleimide-PEG-carbonate-NHS (630 mg, 0.1602 mmol, 1 eq.)was then added portionwise. The reaction was stirred forthree hours at room temperature under an inert atmosphere(argon). The polymer was then purified by dialysis overnight.The following day, the dialysis content was acidified to pH1–2 with 1 M HCl, and then extracted three times with CHCl3.The combined organic layers were dried over MgSO4 and pre-cipitated three times in ice-cold hexane (final yield = 244 mg,30%). For subsequent ligand exchange, the polymer was dis-solved in Milli-Q water. Iron oxide NPs coated with citric acidwere then mixed with a catechol-PEG-maleimide solution(10 mg of Cat-PEG-Mal per mg Fe). The mixture was then soni-cated overnight at room temperature. Excess polymer wasremoved by dialysis.
Nanoparticle characterization
Iron concentrations were determined with an Optima 7000 DVinductively coupled plasma optical emission spectrometer(ICP-OES, PerkinElmer). The NP suspensions were dissolved in37% HCl solutions overnight and investigated the followingday. The core diameters were determined by transmission elec-tron microscopy (TEM). The NP suspensions were dried oncopper carbon-coated mesh grids (300 mesh, Plano GmbH)and investigated with a FEI Tecnai F20 transmission electronmicroscope operating at 200 kV. The acquired micrographswere then used to determine the diameter of the variousbatches by automated size distribution analysis (ImageJ,v. 1.46r).
Hysteresis and First-Order-Reversal Curve (FORC) measure-ments were performed using a Princeton Measurements Cor-poration (PCM) vibrating sample magnetometer (VSM), model3900. 30 μL of sample solution (5.0 mg Fe per mL) were used.Low temperature measurements were made on the sameinstrument with the PCM cryostat. Hysteresis loops weremade using a measurement averaging time of 100 ms, and avariable field increment. The field increment was 5 Oe(307.89 A m−1) in H < 20 Oe or 1.592 kA m−1; 20 Oe (1591.55A m−1) steps in intermediate fields (200–2000 Oe), and 100Oe (7.957 kA m−1) above 2000 Oe (159.155 kA m−1). FORCdiagrams were made using 140 first-order reversal curves(increment of 30 Oe, 2.39 kA m−1). Samples were first satu-rated in a 10 kOe field (795.7 kA m−1), and then ramped backto the reversal field to measure the reversal curve. Data wereprocessed using the MatLab code described by Winklhoferand Zimanyi.38
Thermal measurements, SAR and ILP calculations
The alternating magnetic field was generated by using a com-mercial coil system (Magnetherm™ V1.5, nanoTherics Ltd)comprising a water-cooled coil, a function generator(SFG-2004, GW Instek) and a laboratory power supply (EA-PS3032-20B, EA Elektro Automatic). The device was set to operateat 110 kHz/18.0 mT and 535 kHz/12.5 mT respectively. Theinfrared camera (Onca-MWIR-InSb-320, XenICs) was mountedon a standard microscope stand (Leica Microsystems) to allow
a precise positioning and reduce mechanical vibrationscoming from the Stirling motor-based camera cooling system(ESI Fig. 2†). The InSb array (320 × 256 pixels) recorded infra-red radiation between 3 and 5 μm at an image resolution of0.017 K and a full frame rate of up to 250 Hz. A Digital-to-Ana-logue acquisition card (DAQ) was used to generate the ampli-tude modulation signal. The acquired infrared images weretransferred in real-time to a personal computer via a Camera-Link-based frame grabber. All measurements were performedat modulation frequencies of 0.5 Hz.
For all standard measurements, either the infrared camerawas used or a Luxtron FOT Lab Kit fiberoptic cable system ( f =1 Hz, three individual probes) were used to record temperaturechanges over time exposed to the AMF. The fiberoptic cableswere calibrated in 20 °C Milli-Q water prior to every measure-ment. Changes in temperature were measured over a timescalebetween 120 and 180 s. A linear regression fit was applied tothe initial five measurement seconds to assess the heatingslope β.
The heating slope β was then used to calculate the SARusing the following equation:
SAR ¼ β � cPmFe
cp being the heat capacity of the solution and mFe the mass ofmagnetic material within it.14,15,22 These values were then nor-malized to the AMF frequency and square of the magneticfield strength to obtain the ILP.13
Nanoparticles in biological media
SPIONs (d = 21.7 ± 0.9 nm) coated with either citric acid orcatechol-PEG-maleimide were diluted down to a concentrationof 0.5 mg Fe per mL in Milli-Q with/without Fetal BovineSerum (FBS, 10%), phosphate buffered saline (PBS) with/without FBS and Dulbecco’s Modified Eagle Medium (DMEM)with/without FBS (10%). The suspensions were kept at 37 °Cfor 24 h. Following this, the suspensions were investigated byLIT at a field frequency/strength of 535 kHz/12.5 mT. Theywere subsequently examined by TEM to assess their condition.
Nanoparticles embedded in polyacrylamide gel
SPIONs (d = 21.7 ± 0.9 nm, coated with citric acid), 30% acryl-amide/bis solution and tetramethylethylenediamine (TEMED)and Milli-Q water (see ESI for ratios†) were mixed and stirredin a round bottom flask for 10 minutes. Following this, thesolution was split into two Eppendorf tubes (500 μL each), towhich fresh ammonium persulfate (APS, 10%, 5 μL) wasadded. 100 μL of the polymerization mixture was then sand-wiched between two cover slips (one has been functionalizedwith 3-(trimethoxysilyl)-propylmethacrylate, the other one isnot). Gelation began after five minutes and was complete afterone hour. Finally, the non-functionalized cover slip wasremoved, and the gel was washed in Milli-Q water for threedays under gentle agitation. All gels were subsequently investi-gated at a magnetic field frequency/strength of 535 kHz/12.5 mT.
3

Mathematical model
Among the several approaches proposed in the literature tocompute the energy dissipated by magnetic NPs when exposedto an AMF, we chose the Linear Response Theory (LRT) formu-lated by Rosensweig.3
According to the LRT, it is assumed that the magnetizationM is proportional to the applied field H:
M ¼ χH ¼ ½ðχ′� iχ″ÞeiωtH0� ð1ÞIn eqn (1), the applied field is a periodic function of time,
and the magnetic susceptibility χ is formulated as a complexfunction in order to account for an in-phase and an out-of-phase component with respect to the magnetic field. Thepower per unit volume dissipated is given by the product ofthe energy dissipated during one cycle (area contained in thehysteresis loop) multiplied by the frequency. After some calcu-lations, the final expression is:
P ¼ �f μ0þMdH ¼ πμ0H0
2χ′′f ð2Þ
The following relation for the dynamic susceptibility isused in the LRT:
χ ¼ χ01þ 2iπf τ
!χ′ ¼ χ0
1
1þ ð2iπf τÞ2
χ′′ ¼ χ02πf τ
1þ ð2iπf τÞ2
8>>><>>>:
ð3Þ
The equilibrium susceptibility is obtained from Langevin’smodel:
χ0 ¼ χi3ξ
cothðξÞ � 1ξ
� �¼ μ0Ms
2Vp3kTρp
3ξ
cothðξÞ � 1ξ
� �ð4Þ
In eqn (4), Ms is the saturation magnetization of the par-ticle, Vp the core particle volume, and ρp the particle densityand ξ is defined as:
ξ ¼ μ0MsVpH0
kTð5Þ
The decay time τ is a combination of two characteristictimes, one from Brownian relaxation (τB) and the other forNéel relaxation (τN):
1τ¼ 1
τBþ 1τN!
τB ¼ 3ηVH
kT
τN ¼ffiffiffiπ
p2
τ0exp σð Þffiffiffi
σp ¼
ffiffiffiπ
p2
τDexp σð Þσ
ffiffiffiσ
p
8>><>>:
ð6Þ
σ ¼ KVVpkT
; τD ¼ τ0σ
In eqn (6), σ is the dynamic viscosity of the liquid surroundingthe particle, VH the hydrodynamic volume of the particle, andKV the anisotropy constant of magnetocrystalline origin(identifying the direction of the easy axis of magnetization).The characteristic time constant τ0 is assumed to be equalto ∼10−9 s.
Since the particles used in this work have a finite poly-dispersity, eqn (2) needs to be averaged over all particles, inorder to obtain the total power generated PT per unit particlemass:
PT ¼ πμ0H02f
ðχ′′ Rð ÞgðrÞdR ð7Þ
where g(R)dR is the volume fraction occupied by particles witha radius between R and R + dR.
In order to simulate the time change of the temperatureprofile during a magnetic heating experiment, the followingdifferential equation is used:
cΔTΔt¼ PTw ð8Þ
In eqn (8), c is the heat capacity of the particle suspension,and w the mass fraction of particles in the suspension. Theheat capacity of the particle suspension is computed as aweighted average of water and particles heat capacities.
Eqn (8) is used when heat transfer of the suspension withthe surrounding environment is negligible. Even though PTdepends on temperature, it turns out that the temperature pro-files computed by means of eqn (8) are almost linear in time.Since some experimental data, especially those involving largeparticles and higher concentrations, show a profiles that arestrongly nonlinear, a heat transfer mechanism is introduced.Then, eqn (8) is modified as follows:
cΔTΔt¼ PTwþ hðT0 � TÞ ð9Þ
where h is the heat transfer coefficient and T0 the outer temp-erature, which is assumed to be equal to the room tempera-ture. The heat transfer coefficient is treated as a fittingparameter, since the exact mechanism for heat transfer is notwell known.
Most of the parameters required in the simulations havebeen obtained experimentally. The results of the simulationsindicate that the LRT can adequately predict the experi-mentally measured temperature profiles, as well as the SARvalues. However, two parameters cannot easily be accessedexperimentally and have been adapted in order to achievesuch a good behaviour: the heat transfer coefficient has beenvaried, since the exact nature of the heat transfer mechanismis difficult to predict a priori, and the magnetocrystalline an-isotropy constant KV. KV has been found to be not only afunction of the particle size, which is not surprising giventhat different particle sizes also have different saturationmagnetization values, but also a function of the frequency,especially for the particles that produce the largest amountof heat. For both the smallest and the largest particles,instead, the amount of heat produced is so low that noreliable value can be estimated. While similar effects havealready been observed in the literature, the physical expla-nation is not entirely clear, and might underline an intrinsiclimitation of the LRT. All the applied values are summarizedin the ESI.†
4

3. Results
Standard calorimetric methods, independent of the sensortype, generally rely on recording the temperature changes ofthe sample over time (Fig. 1A). Measurements can be per-formed under both adiabatic or non-adiabatic conditions, theformer being usually more time-consuming22 and the latterless accurate.23 These data are then typically used to calculatethe slope of the heating curve (i.e., Δtemperature/Δtime, β),which is assessed within the first few seconds of the measure-ment when heat losses to the surroundings are negligible(Fig. 1A).15 When dealing with magnetic NPs, this parameter isoften used to calculate the SAR, and thus gives an account oftheir biomedical effectiveness.15 However, it is known that thisapproach may be misleading,15 as the final results may varyconsiderably between the selected fits and time points (ESIFig. 1†).14,25 This is especially prominent in samples with weaksignals, leaving a degree of subjectivity in the data analysis.Additional uncertainties can add up when considering theprobes themselves: fiberoptic cables, for example, are invasiveand depend on where they are placed,22 and infrared camerasare very susceptible to disruptive signals arising from lateralheat dissipation, reflections and thermal drift (Fig. 1B).
With lock-in thermography, the functional principle is fun-damentally different.29 This method assumes that the externalstimulus (i.e., the AMF) is periodically modulated at a constantfrequency (Fig. 1C), while infrared images are synchronouslyrecorded and stacked. The stack is then Fourier-transformed,resulting in a two-dimensional amplitude image which is eval-uated at the modulation frequency (Fig. 1D). This amplitude
signal describes the magnitude of the sample surface tempera-ture oscillations that would result from a perfectly harmonicAMF modulation, and is proportional to the dissipated powerat the sample surface.28
Fourier transformation is computationally demanding.Therefore approximation methods are frequently favoured, asthe amplitude needs to be evaluated at only one frequency(i.e., the modulation frequency). Different algorithms areemployed and described in the literature.39 In our setup, thetemperature measurement is synchronously recorded with themagnetic field amplitude modulation, and the frequency is setat a low level compared to the infrared camera frame rate (i.e.,0.5–2 Hz versus 100–250 Hz). Under these conditions, synchro-nous narrow two-channel correlation is the optimal digitallock-in algorithm.28 The advantage of this method is that thetransient temperature images do not need to be stored on thecomputer or camera memory, and the correlation can beachieved in real time. This way, the measurement can bestopped as soon as the desired sensitivity is reached by tuningthe measurement duration (ESI†).
In summary, the lock-in demodulation formalism worksunder the assumption that the measurement is performedunder quasi-steady-state conditions, i.e., the sample surfacetemperature oscillates with time around a steady mean temp-erature. In practice, at the beginning of the modulation, thetemperature varies during an initial non-steady-state phase.This initial period, or thermal relaxation time, will induce anamplitude shift in the demodulated signal.40 Theoretically, thequasi-steady-state should be reached before demodulating theIR images; however, this takes several minutes and conse-quently slows down the measurement process in practice. Tosolve this problem, we chose the solution introduced by Guptaand Breitenstein,40 in which errors caused by temperature driftare compensated by a simple correction formula based on themeasurement of the temperature drift image. This method hasthe advantage that it can be achieved on-line without the needof storing all the infrared images in the computer memory.
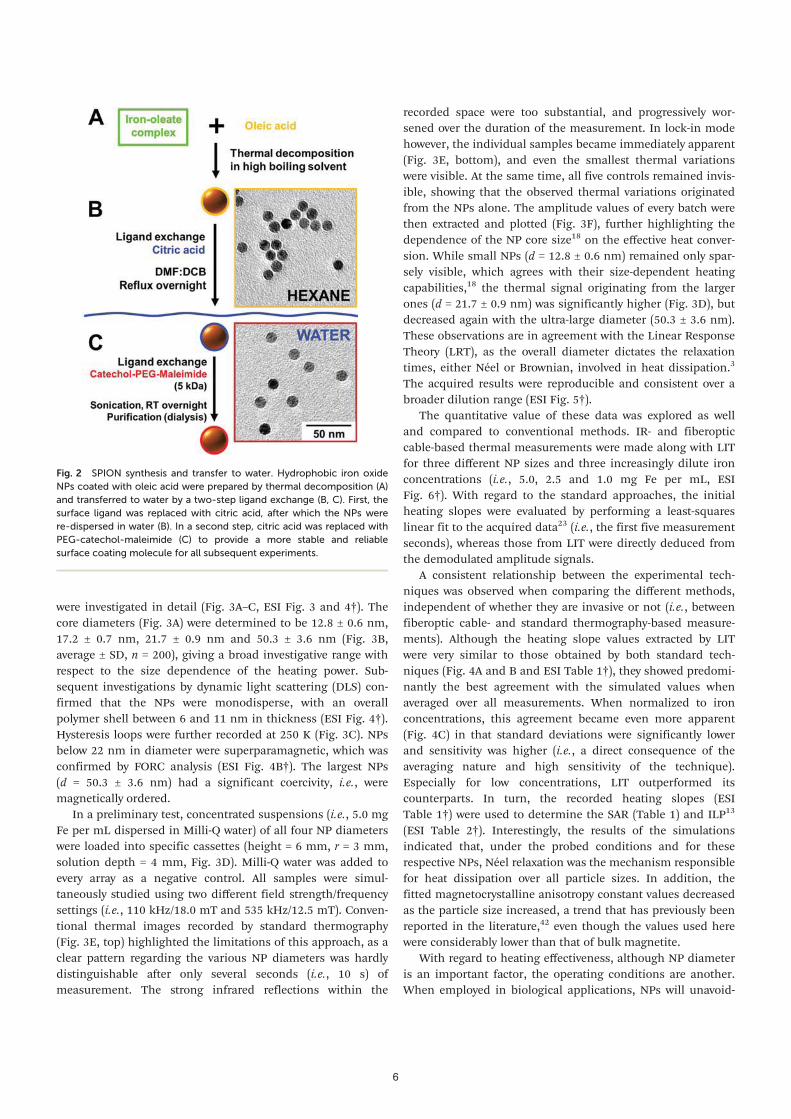
To highlight the utility of this method for these particularapplications, iron oxide NPs were chosen as model stimuli-responsive nanomaterials due to their ability to convert mag-netic energy from an AMF into heat. Very narrow size distri-butions and high circularity were required to ensure anaccurate correlation between diameter and heating efficiency.In this regard, four NP batches with different core sizes wereprepared by thermal decomposition (Fig. 2A).33,34 The respect-ive core sizes were tuned by varying the synthetic conditions,amongst others the precursor ratios and boiling solvents(ESI†). Phase transfer to water was achieved via a two-stepligand exchange in order to obtain monodisperse NPs insteadof clusters.41 Exchanging oleic acid with citric acid (Fig. 2B)35
was the first step, which was followed by a custom-made cate-chol-PEG-maleimide polymer (Fig. 2C) to ensure a tight graft-ing of the surface molecule to the NP surface.36 These NPswere used for all subsequent thermal measurements withoutany further modification. Prior to any thermal measurement,the magnetic and structural properties of all NP populations
Fig. 1 A general comparison between the standard and lock-inthermography concepts. In standard thermography (ST), the transienttemperature rise of the sample is tracked over time (A). The probe, forexample an infrared camera, continuously records the overall change intemperature (B). In accordance with these data, the initial heating slopeβ is fitted and extracted (ESI Fig. 1†), which in turn reflects the heatingpower of the NPs. In lock-in mode (LIT), the stimulus, and thus thethermal emission signal, is periodically modulated (C). The signal is thenFourier-transformed to extract an image rendering the amplitude of thethermal modulations (D). From these averaged data, the initial heatingslope can be computed at a very high degree of accuracy without theneed for any fitting procedures.
5
were investigated in detail (Fig. 3A–C, ESI Fig. 3 and 4†). Thecore diameters (Fig. 3A) were determined to be 12.8 ± 0.6 nm,17.2 ± 0.7 nm, 21.7 ± 0.9 nm and 50.3 ± 3.6 nm (Fig. 3B,average ± SD, n = 200), giving a broad investigative range withrespect to the size dependence of the heating power. Sub-sequent investigations by dynamic light scattering (DLS) con-firmed that the NPs were monodisperse, with an overallpolymer shell between 6 and 11 nm in thickness (ESI Fig. 4†).Hysteresis loops were further recorded at 250 K (Fig. 3C). NPsbelow 22 nm in diameter were superparamagnetic, which wasconfirmed by FORC analysis (ESI Fig. 4B†). The largest NPs(d = 50.3 ± 3.6 nm) had a significant coercivity, i.e., weremagnetically ordered.
In a preliminary test, concentrated suspensions (i.e., 5.0 mgFe per mL dispersed in Milli-Q water) of all four NP diameterswere loaded into specific cassettes (height = 6 mm, r = 3 mm,solution depth = 4 mm, Fig. 3D). Milli-Q water was added toevery array as a negative control. All samples were simul-taneously studied using two different field strength/frequencysettings (i.e., 110 kHz/18.0 mT and 535 kHz/12.5 mT). Conven-tional thermal images recorded by standard thermography(Fig. 3E, top) highlighted the limitations of this approach, as aclear pattern regarding the various NP diameters was hardlydistinguishable after only several seconds (i.e., 10 s) ofmeasurement. The strong infrared reflections within the
recorded space were too substantial, and progressively wor-sened over the duration of the measurement. In lock-in modehowever, the individual samples became immediately apparent(Fig. 3E, bottom), and even the smallest thermal variationswere visible. At the same time, all five controls remained invis-ible, showing that the observed thermal variations originatedfrom the NPs alone. The amplitude values of every batch werethen extracted and plotted (Fig. 3F), further highlighting thedependence of the NP core size18 on the effective heat conver-sion. While small NPs (d = 12.8 ± 0.6 nm) remained only spar-sely visible, which agrees with their size-dependent heatingcapabilities,18 the thermal signal originating from the largerones (d = 21.7 ± 0.9 nm) was significantly higher (Fig. 3D), butdecreased again with the ultra-large diameter (50.3 ± 3.6 nm).These observations are in agreement with the Linear ResponseTheory (LRT), as the overall diameter dictates the relaxationtimes, either Néel or Brownian, involved in heat dissipation.3
The acquired results were reproducible and consistent over abroader dilution range (ESI Fig. 5†).
The quantitative value of these data was explored as welland compared to conventional methods. IR- and fiberopticcable-based thermal measurements were made along with LITfor three different NP sizes and three increasingly dilute ironconcentrations (i.e., 5.0, 2.5 and 1.0 mg Fe per mL, ESIFig. 6†). With regard to the standard approaches, the initialheating slopes were evaluated by performing a least-squareslinear fit to the acquired data23 (i.e., the first five measurementseconds), whereas those from LIT were directly deduced fromthe demodulated amplitude signals.
A consistent relationship between the experimental tech-niques was observed when comparing the different methods,independent of whether they are invasive or not (i.e., betweenfiberoptic cable- and standard thermography-based measure-ments). Although the heating slope values extracted by LITwere very similar to those obtained by both standard tech-niques (Fig. 4A and B and ESI Table 1†), they showed predomi-nantly the best agreement with the simulated values whenaveraged over all measurements. When normalized to ironconcentrations, this agreement became even more apparent(Fig. 4C) in that standard deviations were significantly lowerand sensitivity was higher (i.e., a direct consequence of theaveraging nature and high sensitivity of the technique).Especially for low concentrations, LIT outperformed itscounterparts. In turn, the recorded heating slopes (ESITable 1†) were used to determine the SAR (Table 1) and ILP13
(ESI Table 2†). Interestingly, the results of the simulationsindicated that, under the probed conditions and for theserespective NPs, Néel relaxation was the mechanism responsiblefor heat dissipation over all particle sizes. In addition, thefitted magnetocrystalline anisotropy constant values decreasedas the particle size increased, a trend that has previously beenreported in the literature,42 even though the values used herewere considerably lower than that of bulk magnetite.
With regard to heating effectiveness, although NP diameteris an important factor, the operating conditions are another.When employed in biological applications, NPs will unavoid-
Fig. 2 SPION synthesis and transfer to water. Hydrophobic iron oxideNPs coated with oleic acid were prepared by thermal decomposition (A)and transferred to water by a two-step ligand exchange (B, C). First, thesurface ligand was replaced with citric acid, after which the NPs werere-dispersed in water (B). In a second step, citric acid was replaced withPEG-catechol-maleimide (C) to provide a more stable and reliablesurface coating molecule for all subsequent experiments.
6

ably interact with biomacromolecules (e.g. proteins, lipidsetc.)43 and electrolytes, which all exert a broad range of forceson them and define their physical properties.44 In this regard,the guiding factor is colloidal stability: when compromised theNPs aggregate,45 which impacts not only the physicochemicaland magnetic properties, but also the experimental results andreproducibility.46 When testing NPs in water, these factors arenot reflected. Investigating them in physiological surroundingsis thus critical to correctly interpret data and validate thematerials and their surface chemistry for subsequent appli-cation. The LIT method was thus applied for this task andused to monitor changes in the NP heating power and screenan array of differently coated NPs. These NPs were coated witheither citric acid (Fig. 5A), a surface molecule which leads to amoderate degree of aggregation (i.e., a threefold increase ofdiameter from the non-aggregated state) in biological or phys-iological environments,47 or catechol-PEG-maleimide (Fig. 5B),with which the NPs show no sign of aggregation over pro-longed time periods.44 Both models were diluted in commonly
used and increasingly complex biological media, whereby theTEM and LIT measurements were performed after 24 h ofincubation. Subsequent TEM imaging confirmed the presenceof aggregates in all compromised samples (Fig. 5A, center andright, in comparison to the ones diluted in Milli-Q water), andwas further confirmed by visible sedimentation in the suspen-sions. The NPs with catecholic anchors however were still per-ceived as monodisperse by TEM (Fig. 5B) and remainedoptically isotropic in their respective media for weeks. Interest-ingly, these observations could be directly linked to the LITinvestigations: NPs which aggregated in biological media (i.e.,with a citric acid coating) entirely lost their thermal signal(Fig. 5C and D). On the other hand, SPIONs coated with cate-chol-PEG-maleimide, which remained stable and mono-disperse,36 did not lose their heating power over the entirebuffer scale. In return, the quality of the respective NP coatingmolecule and its resilience under more challenging conditionswere effectively shown in a standardized way without anyadditional instrumentation.
Fig. 3 Investigating SPIONs of distinct sizes and their thermal signatures by lock-in thermography. Four NP suspensions of increasing diameterswere prepared, functionalized and investigated by TEM (A). Their core diameters and particle size distribution were then deduced from these micro-graphs (B). Hysteresis measurements were performed as well to show the magnetic properties of these respective NPs (C). These same NPs were allsimultaneously investigated by LIT by loading them into individual cassettes along with water controls (D). Standard thermal imaging recordingswere made on these arrays after being placed within the magnetic coil. However, the individual wells were not distinguishable anymore after afew seconds of measurement, as the blurring effects became too significant (E, top). In lock-in mode, all signals unrelated to NP heat generationwere suppressed (E, bottom), yielding the distinct heat signatures originating from the NPs in their respective wells (E). These corresponding ampli-tude values were then extracted from LIT captions recorded at two different field strengths and frequencies and plotted as a function of the NPdiameter (F).
7

Fig. 4 Slope values extracted from LIT are in agreement with conventional methods and theoretical predictions. SPIONs of three different coresizes at three different iron concentrations were investigated by conventional methods (i.e., fiberoptic cables (FOC) and IR imaging-based standardthermography (ST)) and lock-in thermography (LIT), at two different field strengths and frequencies (A, B). These values were then normalized toconcentration and compared to the theoretical values (C, D, mean ± SD). LIT results in comparatively more precise and reproducible results withlower standard deviations.
Table 1 A summary of the specific absorption rates obtained by different probes. The measured and simulated heating slopes were used to deter-mine the different SAR values and compared to the ones obtained by LIT. These values were consistent with each other, whereas the LIT methodexhibited lower standard deviations in almost all cases
SAR SAR
535 kHz/12.5 mT, W g−1 Fe 110 kHz/18.0 mT, W g−1 F
LIT ST FOC SIM LIT ST FOC SIM
d = 12.8 ± 0.6 nmMean 4.9 5.9 4.0 7.8 3.9 5.4 3.9 1.9SD 2.6 3.4 3.0 0.0 2.8 3.5 2.2 0.0
d = 17.2 ± 0.7 nmMean 21.7 23.0 14.9 21.6 7.0 7.0 6.3 6.6SD 3.0 3.8 4.8 0.0 1.6 3.1 3.6 0.0
d = 21.7 ± 0.9 nmMean 127.4 123.6 144.3 128.9 62.1 58.4 56.9 61.4SD 8.4 18.4 21.2 0.0 3.1 9.9 15.8 0.0
8

Finally, measuring heating performance in liquid suspen-sions and biological buffers is only a transitional step on theway to therapeutic application, as the properties in these set-tings are not representative enough to predict their effectivebehavior in vivo.22,32 In this context, SPIONs were embedded inpolyacrylamide gels (thickness = 0.5 mm), which are regularlyemployed as tissue phantom models,32 to move closer to clini-cally relevant settings. In this manner, the ability of LIT tomap the thermal heat distribution and NP behavior in a semi-solid state (Fig. 6) was tested, and single-point measurementsrecorded with fiberoptic cables (Fig. 6A, bottom, 6C) were usedas comparisons and controls. Fig. 6C in particular highlightsthe limitations of these conventional measurements. Besidesthe fact that measuring within semi-solid samples is cumber-some and invasive (i.e., the probe needs to be inserted into the
sample), consistent differences in the heating profilesmeasured at different points were apparent as well.22 Whetherthese discrepancies occurred over a defined pattern could notbe deduced from these data. In contrast, this limitation wascircumvented with LIT and the heating behaviour mapped(Fig. 6B) over two dimensions. Once again, the slope valueswere in accordance with the ones recorded with fiberopticcables. However, the two-dimensional output offered a moreelaborate impression of the sample: the LIT method revealedan inhomogeneous heating pattern over the entire specimen,which was not linked to the NP distribution within it (ESIFig. 8†). These investigations were repeated with gels contain-ing different NP concentrations (Fig. 6E), and revealed in thisparticular case that the non-uniformity in the heating profilewas a result of the magnetic field inhomogeneity (Fig. 6F).
Fig. 5 SPIONs in complex biological environments. Iron oxide NPs coated with either citric acid (A) or catechol-PEG-maleimide (B) were incubatedfor 24 h in increasingly complex biological media (with and without the addition of 10% FBS, c = 0.5 mg Fe per mL) to study their behaviour in phys-iological surroundings. They were then investigated by TEM to visualize any differences between aggregated (A, middle and right columns) and non-aggregated samples (B). The implications of this effect on the heating power of all individual NP batches were then quantified by LIT (C, D), whichimmediately showed that in this situation, aggregation leads to complete loss of their heating signal (C). In comparison, the NPs, which remainedstable, either while still in Milli-Q water (C, left) or in protein-containing surroundings (D), retained their heating power.
9

These results stress the difficulty in choosing the proper areaof interest while relying on one dimension, as well as perceiv-ing a pattern within the variations. Finally, the complementarysimulations (ESI Fig. 7B†) indicated once more that Néel relax-ation was the predominant mechanism responsible for heatdissipation from these NPs. Moreover, they emphasized thatthe LIT method yielded results comparable to standardmethods and consistent with simulation results.
4. Discussion
The heating efficiency of magnetic NPs is a factor influencedby a myriad of parameters, many of which are not directlylinked to the NPs themselves. In this context, iron oxide NPsare paradigms: not all SPIONs are created equal, even whenprepared under quasi-identical conditions,13 and unavoidablevariations, such as in size or crystalline lattice, affect theirphysical properties.14 The agglomeration state, different coat-
ings, surrounding environment/buffer, state of dispersion,magnetic field strength, frequency and field heterogeneity arefurther parameters which dictate the heating performance andhence the SAR. Alas, all these factors render the developmentof fast, reliable and reproducible characterization protocolspressing to facilitate the optimization of these materials formedical purposes.
In this respect, LIT offers a standardized platform with con-siderable advantages in addressing these issues. First and fore-most, measurements can be performed under quasi-adiabaticconditions, as convective, conductive or radiative phenomenaoccur on a longer timescale than the modulation period.22
Heat loss effects are negligible at high modulation frequenciesas well, and bulk heating effects can thus be kept at aminimum. In return, the amplitude signal is not influenced byany of these factors, especially when a sample is homo-geneously heated (i.e., at high modulation frequencies). Visual-ization over a two-dimensional space is critical as well, as itenables the simultaneous analysis of multiple samples, includ-ing controls, under identical experimental conditions. Withregard to thermal resolution, the signal-to-noise ratio is inver-sely proportional to the square root of the measurement dur-ation. Accordingly, the sensitivity of the setup can be adjustedby increasing the number of cycles until the desired thermalresolution is reached.28 Given the adjustability of the detectionlimit, very small sample concentrations and volumes areneeded, and high spatial resolutions can be reached as well.Although not presented in this study, it has been reported thatresolutions of down to 1 μm can be reached by using solidimmersion lenses.48 In the light of these developments, themeans to investigating heat signatures of NPs on a cellularlevel are feasible as well.
With respect to all these benefits, the LIT method is anideal approach to quantify the heating power, especially theheating slopes, of magnetic NPs. This is particularly appar-ent when comparing results to standard calorimetricmeasurements. As demonstrated and repetitively criticised inthe literature,15,22 standard ΔT/Δt methods are not alwaysthe most precise, practical and reproducible approaches.Especially when conducting comparative or analyticalstudies, uncertainties may be easily introduced during dataacquisition and amplified during processing. As shown,many of these concerns are avoided by using LIT. Post-processing procedures entirely fall away. The measured physicalparameter, i.e., the amplitude, is independent, and directlyrelated to the heating slope. Subjective assessments knownto affect accuracy, such as on how and where to begin thefit,24 are thus bypassed. Consequently, the exact same datacan be extracted in a more analytical, statistically relevantand straightforward context while offering a much smallerwindow to error.
When addressing the NPs, accounting for every variation inthe heating power is critical to unfold their maximum poten-tial. With magnetic NPs, the best heating performance isfound when the diameter is close to the boundary beforeundergoing magnetic blocking, where magnetic susceptibility
Fig. 6 LIT investigations on SPION-containing substrates highlight theNP heating distribution in a hydrogel as well as heterogeneities in theheating profiles. Investigating the heating power of SPIONs in anembedded state is critical to evaluate their physical behaviour in tissues.In this context, SPION-containing polyacrylamide gels (A, scale bar =10 mm) were used as basic models to fix the NPs in a quasi-realisticstate. This sample was investigated by LIT (B) and fiberoptic cables (C).The initial heating slopes obtained by both techniques are summarizedin (D) (crosses mark the data acquisition points). However, using fiberop-tic cables (FOC) underrepresented the overall heating pattern of thesample (A, C), as the values varied considerably when placed in differentlocations (A, bottom image, crosses signify points of insertion). In con-trast, LIT provided a full overview of the sample (B). Again, the heatingslopes from the respective points (B, crosses signify the extracted pixelvalues) were directly related to the initial slope values obtained withfiberoptic cables (D). Further investigations of substrates containingvarying NP concentrations (E) highlighted inhomogeneities in theheating power related to the AMF (F).
10

is the highest. This was the case with these SPIONs, and theheating slope values measured by LIT were consistent withtheoretical predictions. However, it was shown as well howquickly this situation may deteriorate if the materials are com-promised, i.e., if they aggregate. While the consequences ofthis phenomenon on the heating power, although previouslyaddressed,14,42,49–55 are still not fully understood, they relate tothe basic contributions between relaxation mechanisms. Withthese SPIONs, Néel relaxation seemed to be the dominatingrelaxation mechanism. While this assumption is underlinedby the results obtained from embedded NPs, the LIT methodwas pivotal in collecting these data systematically with lessuncertainty. In particular with solid samples, standardapproaches were troublesome and limited in the informationthey provided. This was evident in relation to the occurringheterogeneities, which were accounted for by LIT withoutsacrificing quality or precision. All these results were in agree-ment with the results of calculations, demonstrating thatthe LIT method is applicable in the uttermost complexenvironments, such as gel samples, which are clinically morerelevant.32
In all, these points not only demonstrate the complexity ofthese NP systems, but show how their analysis can be facili-tated by applying a rapid and standardized method. The directresult is that more precise and extensive information can beobtained on their quality and heating power.32 Given howchanges in the surroundings affect these parameters – bothdirectly and indirectly – screening them in a systematicway is highly encouraged to ensure maximum therapeuticeffectiveness.
5. Conclusion
In conclusion, the LIT method yields both quantitative andqualitative information on the thermal effectiveness of ironoxide NPs in any kind of state of matter. Although thisstudy was narrowed down to magnetic NPs, the presentedfunctional principle is applicable to any kind of stimuli-responsive material, provided that the stimulus can bemodulated. Given the vast potential of such systems, theseresults offer an insight into the usefulness and versatility ofthis method.
Acknowledgements
This work was supported by the Swiss National Science Foun-dation (126104, 159803, PP00P2-123373/1 and PP00P2133597/1), the Adolphe Merkle Foundation, the University of Fribourgand the Zurich University of Applied Sciences (ZHAW). Parts ofthe research were supported by the National Centre of Com-petence in Research Bio-Inspired Materials. The support fromthe Dr Alfred Bretscher Fund is gratefully acknowledged, andaccess to TEM was kindly provided by the Microscopy ImagingCentre of the University of Bern.
Notes and references
1 S. Laurent, D. Forge, M. Port, A. Roch, C. Robic, L. VanderElst and R. N. Muller, Chem. Rev., 2008, 108, 2064–2110.
2 S. Laurent, S. Dutz, U. O. Häfeli and M. Mahmoudi, Adv.Colloid Interface Sci., 2011, 166, 8–23.
3 R. E. Rosensweig, J. Magn. Magn. Mater., 2002, 252, 370–374.4 Q. A. Pankhurst, J. Connolly, S. Jones and J. Dobson,
J. Phys. D: Appl. Phys., 2003, 36, R167.5 D. L. Thorek, A. K. Chen, J. Czupryna and A. Tsourkas, Ann.
Biomed. Eng., 2006, 34, 23–38.6 J. Qin, S. Laurent, Y. S. Jo, A. Roch, M. Mikhaylova,
Z. M. Bhujwalla, R. N. Muller and M. Muhammed, Adv.Mater., 2007, 19, 1874–1878.
7 A. Jordan, P. Wust, H. Fähling, W. John, A. Hinz andR. Felix, Int. J. Hyperthermia, 2009, 25, 499–511.
8 B. Thiesen and A. Jordan, Int. J. Hyperthermia, 2008, 24,467–474.
9 C. Bonnaud, C. A. Monnier, D. Demurtas, C. Jud,D. Vanhecke, X. Montet, R. Hovius, M. Lattuada, B. Rothen-Rutishauser and A. Petri-Fink, ACS Nano, 2014, 8, 3451–3460.
10 M. Mahmoudi, S. Sant, B. Wang, S. Laurent and T. Sen,Adv. Drug Delivery Rev., 2011, 63, 24–46.
11 B. Chertok, B. A. Moffat, A. E. David, F. Yu, C. Bergemann,B. D. Ross and V. C. Yang, Biomaterials, 2008, 29, 487–496.
12 A. Jordan, R. Scholz, P. Wust, H. Fähling and R. Felix,J. Magn. Magn. Mater., 1999, 201, 413–419.
13 M. Kallumadil, M. Tada, T. Nakagawa, M. Abe, P. Southernand Q. A. Pankhurst, J. Magn. Magn. Mater., 2009, 321,1509–1513.
14 A. E. Deatsch and B. A. Evans, J. Magn. Magn. Mater., 2014,354, 163–172.
15 I. Andreu and E. Natividad, Int. J. Hyperthermia, 2013, 29,739–751.
16 R. Hergt, S. Dutz, R. Müller and M. Zeisberger, J. Phys.:Condens. Matter, 2006, 18, S2919.
17 C. S. Kumar and F. Mohammad, Adv. Drug Delivery Rev.,2011, 63, 789–808.
18 B. Mehdaoui, A. Meffre, J. Carrey, S. Lachaize,L. M. Lacroix, M. Gougeon, B. Chaudret and M. Respaud,Adv. Funct. Mater., 2011, 21, 4573–4581.
19 D. L. Leslie-Pelecky and R. D. Rieke, Chem. Mater., 1996, 8,1770–1783.
20 W. J. Atkinson, I. A. Brezovich and D. P. Chakraborty, IEEETrans. Biomed. Eng., 1984, 70–75.
21 A. K. Gupta and M. Gupta, Biomaterials, 2005, 26, 3995–4021.
22 R. Wildeboer, P. Southern and Q. Pankhurst, J. Phys. D:Appl. Phys., 2014, 47, 495003.
23 E. Natividad, M. Castro and A. Mediano, Appl. Phys. Lett.,2008, 92, 093116.
24 S.-Y. Wang, S. Huang and D. Borca-Tasciuc, IEEE Trans.Magn., 2013, 49, 255–262.
25 S. Huang, S. Wang, A. Gupta, D. Borca-Tasciuc andS. Salon, Meas. Sci. Technol., 2012, 23, 035701.
11

26 A. Levy, A. Dayan, M. Ben-David and I. Gannot, Nano-medicine, 2010, 6, 786–796.
27 M. Vollmer and K.-P. Möllmann, Infrared thermal imaging:fundamentals, research and applications, John Wiley & Sons,2010.
28 O. Breitenstein, W. Warta and M. Langenkamp, Lock-inthermography: Basics and use for evaluating electronic devicesand materials, Springer, 2010.
29 P. K. Kuo, T. Ahmed, L. D. Favro, H. Jin and R. L. Thomas,J. Nondestruct. Eval., 1989, 8, 97–106.
30 X. P. V. Maldague, Theory and practice of infrared technologyfor nondestructive testing, Wiley, 2001.
31 J. Y. Kim, K. S. Chang, M. H. Kook, S. Y. Ryu, H. Y. Choi,K. S. Hong, W. J. Choi, G. Kim, T. H. Jeon and J. Y. Lee,Infrared Phys. Technol., 2013, 57, 76–80.
32 S. Dutz and R. Hergt, Nanotechnology, 2014, 25, 452001.33 J. Park, K. An, Y. Hwang, J.-G. Park, H.-J. Noh, J.-Y. Kim,
J.-H. Park, N.-M. Hwang and T. Hyeon, Nat. Mater., 2004, 3,891–895.
34 S. Sun and H. Zeng, J. Am. Chem. Soc., 2002, 124, 8204–8205.
35 M. Lattuada and T. A. Hatton, Langmuir, 2007, 23, 2158–2168.
36 E. Amstad, T. Gillich, I. Bilecka, M. Textor and E. Reimhult,Nano Lett., 2009, 9, 4042–4048.
37 J. L. Dalsin, L. Lin, S. Tosatti, J. Vörös, M. Textor andP. B. Messersmith, Langmuir, 2005, 21, 640–646.
38 M. Winklhofer and G. T. Zimanyi, J. Appl. Phys., 2006, 99,08E710.
39 J. Liu, W. Yang and J. Dai, Infrared Phys. Technol., 2010, 53,348–357.
40 R. Gupta and O. Breitenstein, Temperature drift correc-tion for fast lock-in infrared thermography, Proceedings21st European Photovoltaic Solar Energy Conference,ed. J. Poortmans, H. Ossenbrink, E. Dunlop and P. Helm,WIP, Munich, Germany, 2006, pp. 332–335.
41 D. Burnand, C. A. Monnier, A. Redjem, M. Schaefer,B. Rothen-Rutishauser, A. Kilbinger and A. Petri-Fink,J. Magn. Magn. Mater., 2015, 380, 157–162.
42 G. Salas, J. Camarero, D. Cabrera, H. Takacs, M. Varela,R. Ludwig, H. Dahring, I. Hilger, R. Miranda,M. D. Morales and F. J. Teran, J. Phys. Chem. C, 2014, 118,19985–19994.
43 A. E. Nel, L. Mädler, D. Velegol, T. Xia, E. M. Hoek,P. Somasundaran, F. Klaessig, V. Castranova andM. Thompson, Nat. Mater., 2009, 8, 543–557.
44 T. L. Moore, L. Rodriguez-Lorenzo, V. Hirsch, S. Balog,D. Urban, C. Jud, B. Rothen-Rutishauser, M. Lattuada andA. Petri-Fink, Chem. Soc. Rev., 2015, 44, 6287–6305.
45 K. Rausch, A. Reuter, K. Fischer and M. Schmidt, Biomacro-molecules, 2010, 11, 2836–2839.
46 Y. Piñeiro-Redondo, M. Bañobre-López, I. Pardiñas-Blanco,G. Goya, M. A. López-Quintela and J. Rivas, Nanoscale Res.Lett., 2011, 6, 1–7.
47 S. Balog, L. Rodriguez-Lorenzo, C. A. Monnier, M. Obiols-Rabasa, B. Rothen-Rutishauser, P. Schurtenberger andA. Petri-Fink, Nanoscale, 2015, 7, 5991–5997.
48 O. Breitenstein, F. Altmann, T. Riediger, D. Karg andV. Gottschalk, Microelectron. Reliab., 2006, 46, 1508–1513.
49 A. S. Eggeman, S. A. Majetich, D. Farrell andQ. A. Pankhurst, IEEE Trans. Magn., 2007, 43, 2451–2453.
50 C. L. Dennis, A. J. Jackson, J. A. Borchers, R. Ivkov,A. R. Foreman, J. W. Lau, E. Goernitz and C. Gruettner,J. Appl. Phys., 2008, 103.
51 K. D. Bakoglidis, K. Simeonidis, D. Sakellari, G. Stefanouand M. Angelakeris, IEEE Trans. Magn., 2012, 48, 1320–1323.
52 P. De la Presa, Y. Luengo, M. Multigner, R. Costo,M. P. Morales, G. Rivero and A. Hernando, J. Phys. Chem. C,2012, 116, 25602–25610.
53 F. J. Teran, C. Casado, N. Mikuszeit, G. Salas, A. Bollero,M. P. Morales, J. Camarero and R. Miranda, Appl. Phys.Lett., 2012, 101.
54 G. Salas, S. Veintemillas-Verdaguer and M. D. Morales,Int. J. Hyperthermia, 2013, 29, 768–776.
55 D. Cabrera, J. Camarero, D. Ortega and F. J. Teran, J. Nano-part. Res., 2015, 17.
12