Embed Size (px)
Citation preview
A LIFE CYCLE ASSESSMENT OF THE COTTON TEXTILE CHAIN
E. Barnes, J. Reed, M. Wallace, M. Peterson and P. O’Leary Cotton Incorporated, Cary, North Carolina, USA
Life Cycle Assessment (LCA) is a systematic evaluation of the potential environmental impact and resource utilization of a product from raw material through disposal. Underlying the LCA is the Life Cycle Inventory or LCI, a quantification of energy and material inputs and environmental release or emissions data associated with product creation and use. The primary purpose of this project was to provide robust and up-to-date LCI data for global cotton fibre production and textile manufacturing so that cotton is accurately represented in LCAs. A secondary objective was to use the LCI data to conduct a cradle-to-grave LCA of a hypothetical knit shirt and woven pant to better understand all aspects of the environmental impact of cotton textiles so the cotton industry can target research and resources to reduce future impacts. Cotton cultivation data in the United States (U.S.), China, and India represented the years 2005 to 2009 (averaged to reduce variation due to weather and other environmental conditions) and was collected by production regions within the U.S. (4 regions), China (3 regions), and India (3 regions). The three countries where data were collected represented 63% of the world’s cotton fibre production in 2010. Data collection included soil types, climate, seed and chemical inputs, fuel use, and dates of key operations (e.g., planting, fertilizer application, and harvest). These data were then input to a crop cultivation model developed by PE International to estimate the nitrogen and carbon cycles in each of the regions. Data on fabric production for both knit and woven fabrics were collected from representative mills in four regions: Turkey, India, China, and Latin America that produced 51% of knit and 66% of woven fabric manufactured in 2009. Candidate textile mills were identified by first reviewing interviews from site visits to more than 40 cotton textile companies representing over 75% of global textile processing in regions of China, India, Turkey, Southeast Asia, and the Americas during a previous study by Cotton Incorporated. Data was obtained from 17 mills representing nine knitting and nine weaving operations. This information was combined with Cotton Incorporated staff technical service experiences to identify “typical” mills that would accurately represent the overall textile production practices in the countries of interest. Data collection included raw material inputs and outputs; energy inputs by source; dye/chemical input, output, and emissions; water use and solid waste pathway (e.g., recycled, sold, and landfill). Results were evaluated across three primary phases of the life cycle: 1) fibre production (agricultural field practices and ginning); 2) textile manufacturing; and 3) garment use (cut/sew, consumer laundering, and end-of-life). Transportation throughout the life cycle was also included. Across a majority of the impact categories considered, the consumer use phase was the largest relative contribution to potential impact, followed by textile production, and finally fibre production. Sources contributing to potential impact were identified within each phase and
research recommendations were developed. Also, included in this paper is a discussion of the challenges faced in conducting this LCI/LCA of an agricultural product and pitfalls to be aware of when attempting to compare LCAs of products made from different textile fibres. LCA is a demonstrated method to objectively and scientifically evaluate the environmental impact and resource utilization of a product, from the raw materials used in its creation to the disposal of the product at the end of life. LCA consists of four basic stages: goal and scope definition; inventory analysis; impact assessment; and interpretation. System boundaries and processes to be included in the LCA are defined in the goal and scope phase. During inventory analysis the relevant energy, material inputs, and environmental release data associated with the identified processes are quantified. The quality and integrity of this inventory, also called a Life Cycle Inventory (LCI), are crucial since the determination of environmental impact is based on this data. With the growing interest in minimizing environmental impact, companies are turning to LCAs to fully understand the risks and liabilities across their supply chain. Major textile brands such as Levi Strauss have performed product-level LCAs and are changing business practices as a result of those assessments (http://www.levistrauss.com/sustainability/product/life-cycle-jean). Broader efforts, such as The Sustainability Consortium, which includes a diverse group of companies such as Coca-Cola, Kellogg’s, McDonalds, WalMart, and Marks & Spencer, are adopting metrics based on LCA approaches to define product environmental performance. This has resulted in the use of LCI data during product design to select materials that will minimize a product’s environmental impact. Therefore, not only will this LCA project allow the cotton industry to perform an environmental self-assessment, it will also ensure cotton is accurately represented whenever LCA methodologies are applied. There have been other LCAs conducted of cotton products, and the most recent was a study published by Grace (2009) that evaluated a cotton t-shirt. The study was limited in scope to Australian cotton and focused only on energy and greenhouse gas emissions. Matlock et al. (2008) used LCA tools to assess the energy requirements for the cotton production phase from a global perspective, and one of the conclusions of their study was that a high degree of uncertainty exists in estimates for many regions of the world due to lack of publicly available data. Data entries for cotton production and textile manufacturing also exist in the Ecoinvent LCI database (e.g, Nemecek et al. 2004); however, many of those datasets were collected from the literature, and some of the data contributing to those entries were obsolete. A current, robust and clearly documented cotton LCA, a “gold standard”, so to speak, is clearly needed. Therefore, the objectives of this study were to:
1. Build current, representative, and well-documented Life Cycle Inventories (LCIs) for cotton products so they can be easily integrated into both proprietary and publicly available LCI databases (e.g., the U.S. Life Cycle Inventory database, and Ecoinvent).
2. Provide a Life Cycle Assessment (LCA) of textile products (golf shirt for knits, khaki pants for wovens) constructed from cotton.
Materials & Methods The purpose of this project was to develop and publish detailed global average Life Cycle Inventories (LCIs) for cradle-to-gate production of cotton fibre and fabric. Additionally, Life Cycle Assessments (LCAs) were performed to evaluate the environmental impacts of fibre and fabric production and cotton garments, specifically knit golf shirts and woven casual pants. As part of the Vision 21 project, the Cotton Foundation commissioned PE Americas to perform these analyses according to the principles of the ISO 14040 series of standards for Life Cycle Assessment (ISO 2006). The project was managed by The National Cotton Council of America, Cotton Incorporated, and Cotton Council International. Cotton Incorporated’s Agricultural and Environmental Research, Product Development and Implementation, Global Supply Chain Marketing, and Corporate Strategy and Program Metrics divisions were responsible for data collection and analysis of cotton production, textile production, and consumer data, respectively. The LCI data from this study will be published in proprietary and open-source LCA databases to replace obsolete information. To ensure data quality the study was reviewed by a third-party critical review team comprised of cotton, agricultural, LCA, and textile experts. The LCI data have also been submitted to The Carbon Trust, a not-for-profit company in the UK, for certification to bring additional third-party review and credibility to the data. The LCI consists of primary and secondary data collected in the following categories: cotton fibre production, textile manufacturing, transportation, garment creation, use, and end-of-life. Primary data were collected by Cotton Incorporated through partnerships with researchers, industry, and co-operators, and are representative for the years 2005 through 2010. The primary data were supplemented with literature and industry averages. The LCA model was created using the GaBi 4 software system developed by PE International (GaBi 4, 2006). The databases contained in the GaBi software provided the secondary LCI data used to model energy production, raw and process materials, transport, wastewater treatment, etc. For example, although the electrical energy needed to operate a spinning frame may be the same regardless of the country where the machine is operated; the environmental impact of the power plant used to generate the electricity and the efficiency with which that energy is delivered across the grid can vary dramatically between countries. The GaBi software provides the data needed to characterize such differences. LCI data for fibre production represents a global average of U.S., China, and India for the years 2005 – 2009 and is based on regional production-weighted averages. The U.S., China, and India represented 63.3% of the world’s cotton fibre production in 2010 (USDA, 2011). Data covers raw material production from field through ginning (cradle-to-gate) and includes soil types, climate, seed and chemical inputs, fuel use, and dates of key operations (e.g., planting, fertilizer application, and harvest). These data were entered into a cultivation model developed by PE International to estimate the nitrogen and carbon cycles in each of the regions. Impacts were calculated for a functional unit of 1,000 kilograms (kg) of cotton fibre.
Data on fabric production for both knit and woven fabrics, also represented as a global average, were collected from representative mills in four regions: Turkey, India, China, and Latin America. These areas represented 51% of knit and 66% of woven world fabric manufacturing in 2009 (ITMF, 2009). Candidate textile mills were identified by first reviewing interviews from site visits to more than 40 cotton textile companies in regions of China, India, Turkey, Southeast Asia, and the Americas during a previous study by Cotton Incorporated. Data was obtained from 17 mills representing nine knitting and nine weaving operations. This information was combined with Cotton Incorporated staff technical service experiences to identify “typical” mills that would accurately represent the overall textile production practices in the countries of interest. The data cover the fibre LCI plus bale opening, yarn preparation, spinning, knitting or weaving, wet preparation, dyeing, and finishing, and included raw material inputs and outputs; energy inputs by source; dye/chemical input, output, and emissions; and solid waste (e.g. recycled, sold, and landfill). Impacts for fabric manufacturing are calculated for 1,000 kg of knit fabric or 1,000 kg of woven fabric, as appropriate. Additionally, cradle-to-grave LCA’s that encompassed fibre production through consumer use and disposal were conducted for 1,000 kg of golf shirts and 1,000 kg of casual pants. After accounting for cut-and-sew losses, it was calculated that 1000 kg of knit fabric would yield 2,780 golf shirts and 1,000 kg of woven fabric would yield 1,764 pairs of casual pants (0.36 kg per shirt; 0.57 kg per pant). The mill data for textile production and for cut-and-sew processes were supplemented with process energy calculations from machinery manufacturers and data available from Cotton Incorporated experts. Background data on ancillary materials, energy and fuels, transportation, and end-of-life were taken from PE International’s GaBi database. Background data on use phase energy and materials were taken from existing government publications, literature values, and PE International GaBi data. Those data were combined with consumer behaviour data from Cotton Incorporated’s Lifestyle Monitor™ survey, an on-going Internet survey of U.S. consumers who are representative of the U.S. Census based on education, income, ethnicity, marital status, and geography. U.S. consumers surveyed were 60% female, 40% male, between the ages of 13 to 70 years old. Approximately 1,000 people were asked questions about their use and laundering practices for knit shirts and woven pants. Thirty home launderings was used as the lifetime of the garment according to AATCC (American Association of Textile Chemists and Colorists) standards. The life cycle of a cotton garment was modelled as three overall phases: 1) fibre production (agricultural processes); 2) fabric production (textile processes); and 3) fabric and garment use (cut/sew, consumer use or laundering, and end-of-life). Primary data collection for the LCI ended with fabric production so the cut and sew operations were included with the use phase. Data for the use phase came primarily from secondary sources. The system boundaries and functional units for this fibre, fabric, and garments are illustrated below in Figure 1. When a process yields more than one valuable output, environmental burden is shared, or allocated, between the different co-products. A notable need for allocation
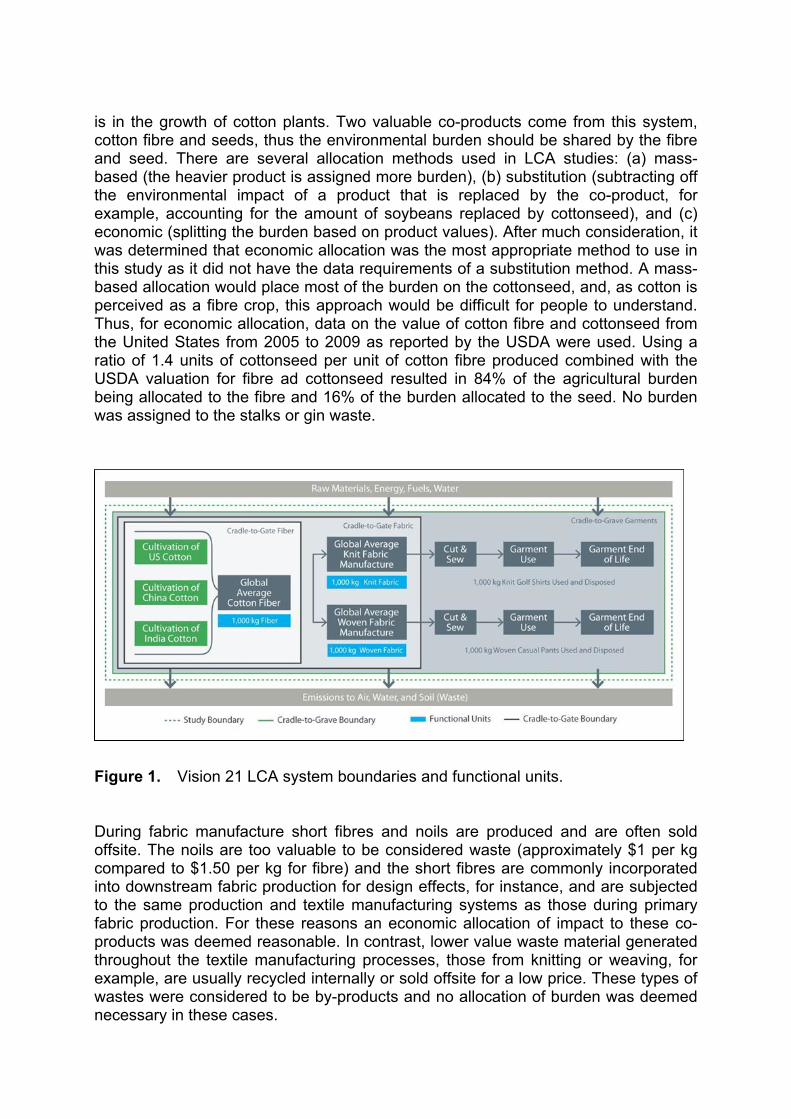
is in the growth of cotton plants. Two valuable co-products come from this system, cotton fibre and seeds, thus the environmental burden should be shared by the fibre and seed. There are several allocation methods used in LCA studies: (a) mass-based (the heavier product is assigned more burden), (b) substitution (subtracting off the environmental impact of a product that is replaced by the co-product, for example, accounting for the amount of soybeans replaced by cottonseed), and (c) economic (splitting the burden based on product values). After much consideration, it was determined that economic allocation was the most appropriate method to use in this study as it did not have the data requirements of a substitution method. A mass-based allocation would place most of the burden on the cottonseed, and, as cotton is perceived as a fibre crop, this approach would be difficult for people to understand. Thus, for economic allocation, data on the value of cotton fibre and cottonseed from the United States from 2005 to 2009 as reported by the USDA were used. Using a ratio of 1.4 units of cottonseed per unit of cotton fibre produced combined with the USDA valuation for fibre ad cottonseed resulted in 84% of the agricultural burden being allocated to the fibre and 16% of the burden allocated to the seed. No burden was assigned to the stalks or gin waste.
Figure 1. Vision 21 LCA system boundaries and functional units. During fabric manufacture short fibres and noils are produced and are often sold offsite. The noils are too valuable to be considered waste (approximately $1 per kg compared to $1.50 per kg for fibre) and the short fibres are commonly incorporated into downstream fabric production for design effects, for instance, and are subjected to the same production and textile manufacturing systems as those during primary fabric production. For these reasons an economic allocation of impact to these co-products was deemed reasonable. In contrast, lower value waste material generated throughout the textile manufacturing processes, those from knitting or weaving, for example, are usually recycled internally or sold offsite for a low price. These types of wastes were considered to be by-products and no allocation of burden was deemed necessary in these cases.
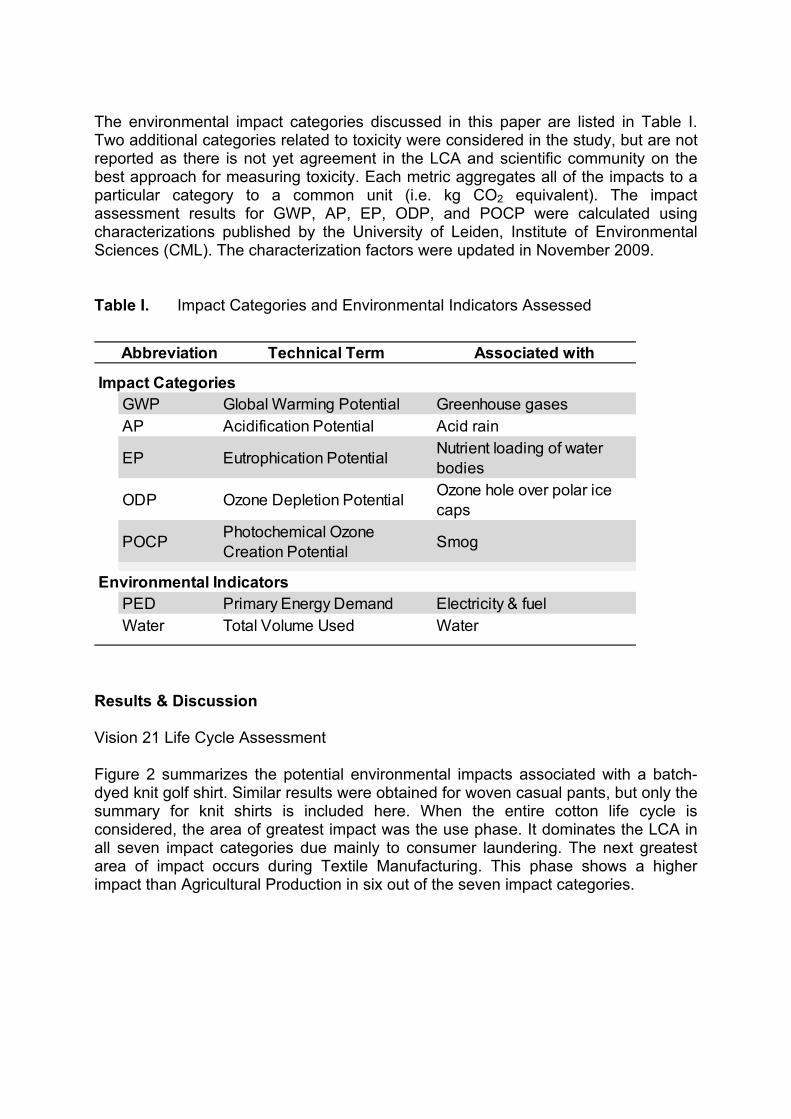
The environmental impact categories discussed in this paper are listed in Table I. Two additional categories related to toxicity were considered in the study, but are not reported as there is not yet agreement in the LCA and scientific community on the best approach for measuring toxicity. Each metric aggregates all of the impacts to a particular category to a common unit (i.e. kg CO2 equivalent). The impact assessment results for GWP, AP, EP, ODP, and POCP were calculated using characterizations published by the University of Leiden, Institute of Environmental Sciences (CML). The characterization factors were updated in November 2009. Table I. Impact Categories and Environmental Indicators Assessed
Abbreviation Technical Term Associated with
Impact CategoriesGWP Global Warming Potential Greenhouse gasesAP Acidification Potential Acid rain
EP Eutrophication Potential Nutrient loading of water bodies
ODP Ozone Depletion Potential Ozone hole over polar ice caps
POCP Photochemical Ozone Creation Potential Smog
Environmental IndicatorsPED Primary Energy Demand Electricity & fuel Water Total Volume Used Water
Results & Discussion Vision 21 Life Cycle Assessment Figure 2 summarizes the potential environmental impacts associated with a batch-dyed knit golf shirt. Similar results were obtained for woven casual pants, but only the summary for knit shirts is included here. When the entire cotton life cycle is considered, the area of greatest impact was the use phase. It dominates the LCA in all seven impact categories due mainly to consumer laundering. The next greatest area of impact occurs during Textile Manufacturing. This phase shows a higher impact than Agricultural Production in six out of the seven impact categories.
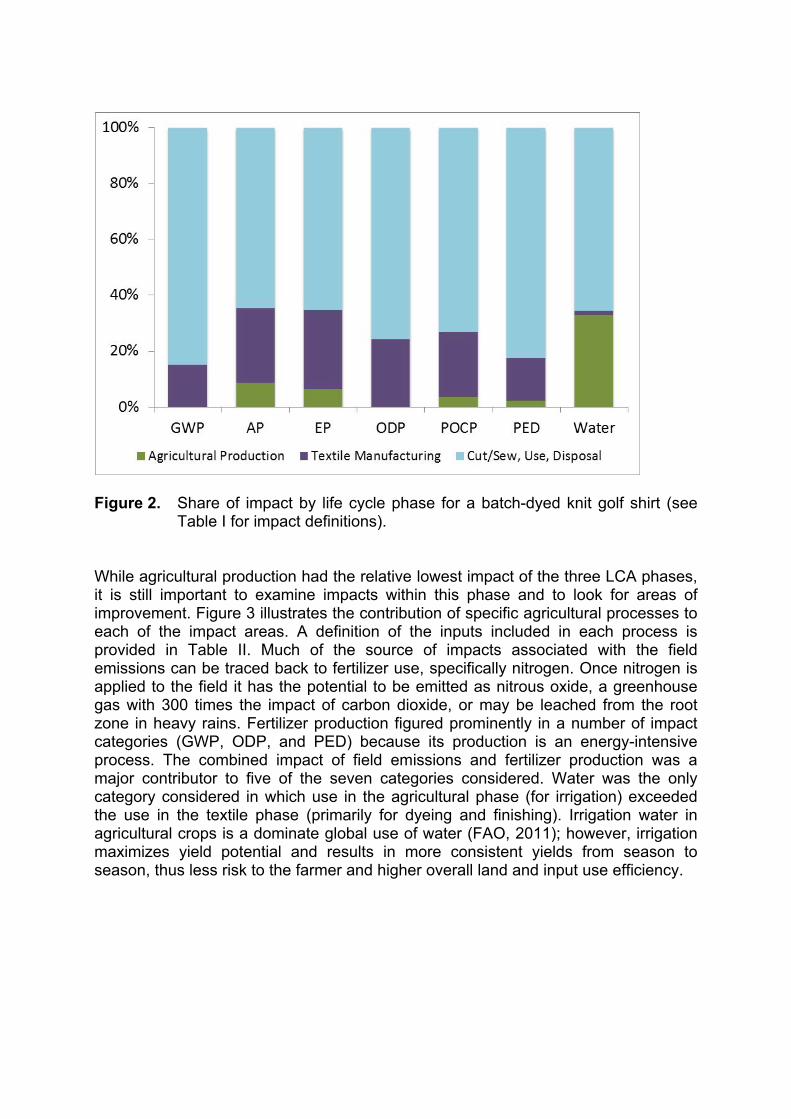
Figure 2. Share of impact by life cycle phase for a batch-dyed knit golf shirt (see
Table I for impact definitions). While agricultural production had the relative lowest impact of the three LCA phases, it is still important to examine impacts within this phase and to look for areas of improvement. Figure 3 illustrates the contribution of specific agricultural processes to each of the impact areas. A definition of the inputs included in each process is provided in Table II. Much of the source of impacts associated with the field emissions can be traced back to fertilizer use, specifically nitrogen. Once nitrogen is applied to the field it has the potential to be emitted as nitrous oxide, a greenhouse gas with 300 times the impact of carbon dioxide, or may be leached from the root zone in heavy rains. Fertilizer production figured prominently in a number of impact categories (GWP, ODP, and PED) because its production is an energy-intensive process. The combined impact of field emissions and fertilizer production was a major contributor to five of the seven categories considered. Water was the only category considered in which use in the agricultural phase (for irrigation) exceeded the use in the textile phase (primarily for dyeing and finishing). Irrigation water in agricultural crops is a dominate global use of water (FAO, 2011); however, irrigation maximizes yield potential and results in more consistent yields from season to season, thus less risk to the farmer and higher overall land and input use efficiency.
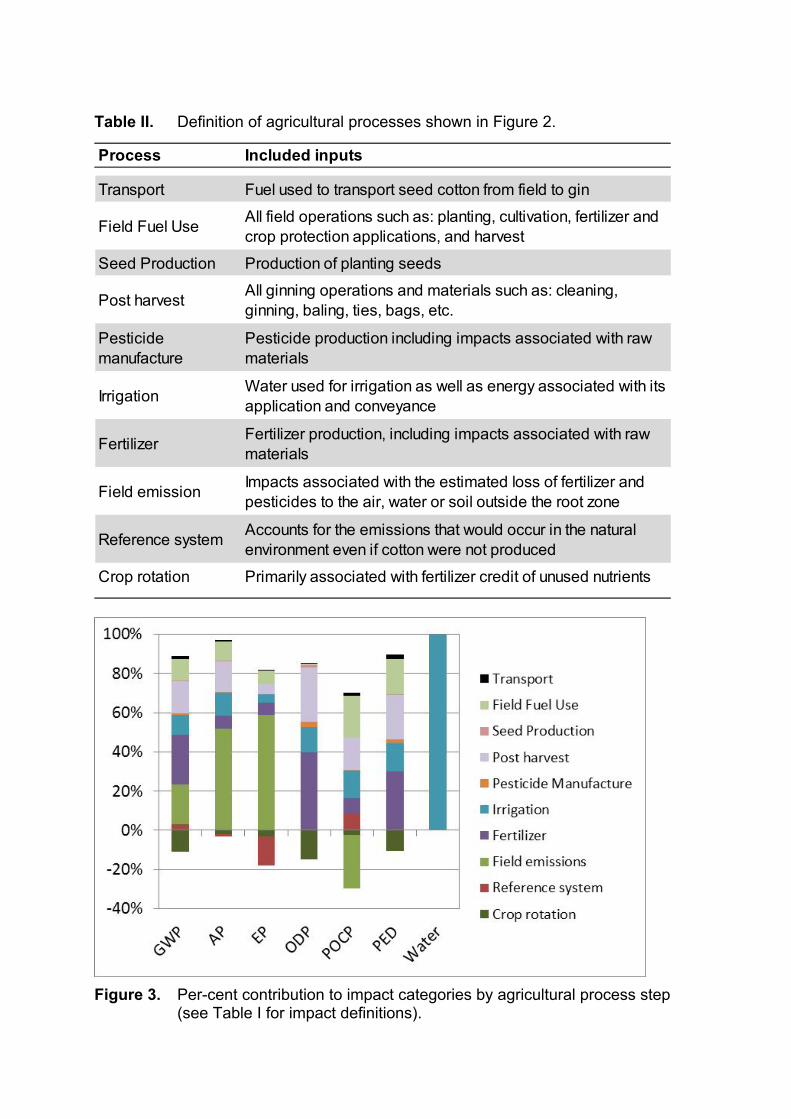
Table II. Definition of agricultural processes shown in Figure 2.
Process Included inputs
Transport Fuel used to transport seed cotton from field to gin
Field Fuel Use All field operations such as: planting, cultivation, fertilizer and crop protection applications, and harvest
Seed Production Production of planting seeds
Post harvest All ginning operations and materials such as: cleaning, ginning, baling, ties, bags, etc.
Pesticide manufacture
Pesticide production including impacts associated with raw materials
Irrigation Water used for irrigation as well as energy associated with its application and conveyance
Fertilizer Fertilizer production, including impacts associated with raw materials
Field emission Impacts associated with the estimated loss of fertilizer and pesticides to the air, water or soil outside the root zone
Reference system Accounts for the emissions that would occur in the natural environment even if cotton were not produced
Crop rotation Primarily associated with fertilizer credit of unused nutrients
Figure 3. Per-cent contribution to impact categories by agricultural process step
(see Table I for impact definitions).
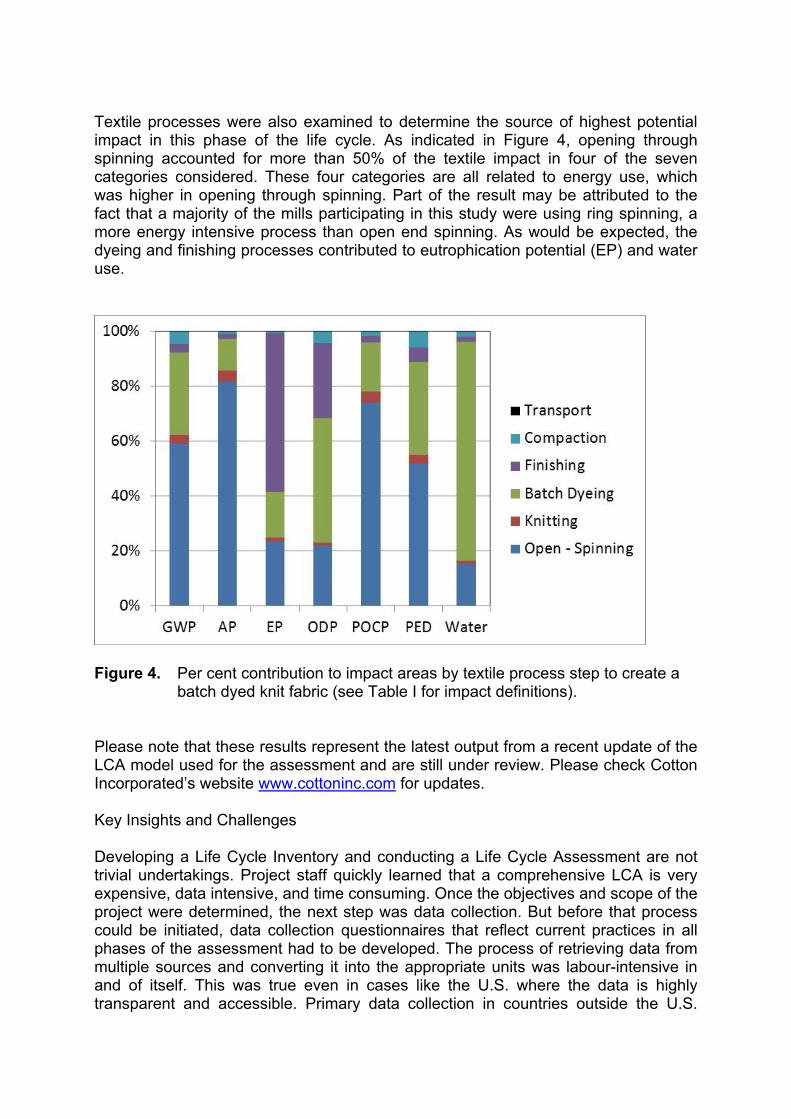
Textile processes were also examined to determine the source of highest potential impact in this phase of the life cycle. As indicated in Figure 4, opening through spinning accounted for more than 50% of the textile impact in four of the seven categories considered. These four categories are all related to energy use, which was higher in opening through spinning. Part of the result may be attributed to the fact that a majority of the mills participating in this study were using ring spinning, a more energy intensive process than open end spinning. As would be expected, the dyeing and finishing processes contributed to eutrophication potential (EP) and water use.
Figure 4. Per cent contribution to impact areas by textile process step to create a
batch dyed knit fabric (see Table I for impact definitions). Please note that these results represent the latest output from a recent update of the LCA model used for the assessment and are still under review. Please check Cotton Incorporated’s website www.cottoninc.com for updates. Key Insights and Challenges Developing a Life Cycle Inventory and conducting a Life Cycle Assessment are not trivial undertakings. Project staff quickly learned that a comprehensive LCA is very expensive, data intensive, and time consuming. Once the objectives and scope of the project were determined, the next step was data collection. But before that process could be initiated, data collection questionnaires that reflect current practices in all phases of the assessment had to be developed. The process of retrieving data from multiple sources and converting it into the appropriate units was labour-intensive in and of itself. This was true even in cases like the U.S. where the data is highly transparent and accessible. Primary data collection in countries outside the U.S.
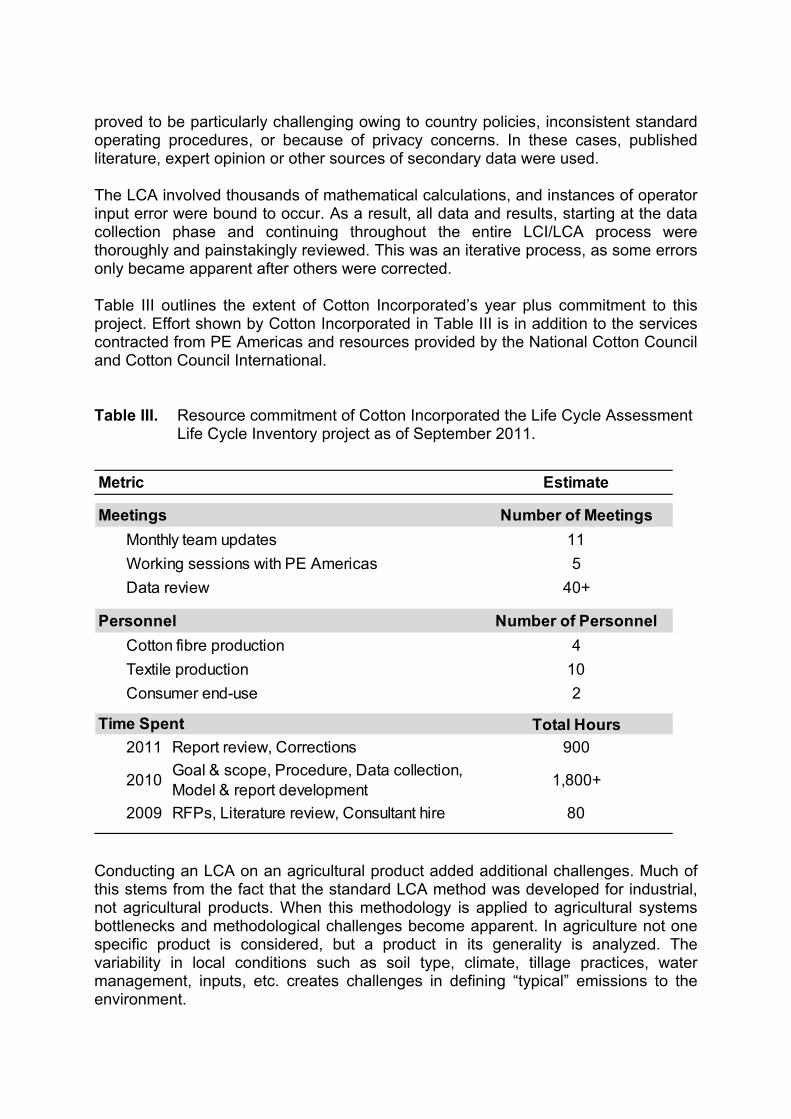
proved to be particularly challenging owing to country policies, inconsistent standard operating procedures, or because of privacy concerns. In these cases, published literature, expert opinion or other sources of secondary data were used. The LCA involved thousands of mathematical calculations, and instances of operator input error were bound to occur. As a result, all data and results, starting at the data collection phase and continuing throughout the entire LCI/LCA process were thoroughly and painstakingly reviewed. This was an iterative process, as some errors only became apparent after others were corrected. Table III outlines the extent of Cotton Incorporated’s year plus commitment to this project. Effort shown by Cotton Incorporated in Table III is in addition to the services contracted from PE Americas and resources provided by the National Cotton Council and Cotton Council International. Table III. Resource commitment of Cotton Incorporated the Life Cycle Assessment
Life Cycle Inventory project as of September 2011.
Metric Estimate
Number of MeetingsMonthly team updates 11Working sessions with PE Americas 5Data review 40+
Number of PersonnelCotton fibre production 4Textile production 10Consumer end-use 2
Total Hours2011 Report review, Corrections 900
2010 Goal & scope, Procedure, Data collection, Model & report development 1,800+
2009 RFPs, Literature review, Consultant hire 80
Meetings
Personnel
Time Spent
Conducting an LCA on an agricultural product added additional challenges. Much of this stems from the fact that the standard LCA method was developed for industrial, not agricultural products. When this methodology is applied to agricultural systems bottlenecks and methodological challenges become apparent. In agriculture not one specific product is considered, but a product in its generality is analyzed. The variability in local conditions such as soil type, climate, tillage practices, water management, inputs, etc. creates challenges in defining “typical” emissions to the environment.
Factors associated with the application of pesticide use were not originally addressed in LCA methodology developed for industrial processes confined to a manufacturing plant. As a result, methodologies applied to pesticide use are not well-developed and have a high degree of uncertainty. This uncertainty exists for several reasons. First, in LCA models an agricultural field is considered to be an “open” system where chemical use in that field is regarded as an emission to the environment regardless of the fact that a chemical may never leave the field. In addition, characterization, or emission factors used for modelling pesticides are not well-developed or only exist for a small percentage of the chemicals used. This requires that a proxy chemical or chemical class be used which can lead to an under- or over-estimation of impact. Another factor leading to uncertainty in the evaluation of pesticides is that LCA models typically consider only the toxicity component of a chemical and do not take into account the likelihood of exposure to the chemical, as is the case with a risk hypothesis, a rigorous scientific safety assessment used by regulatory bodies such as the U.S. Environmental Protection Agency (EPA) in the evaluation of new chemicals for commercialization. Human labour is an important aspect of agriculture that is not addressed by an LCA. This study revealed large differences in hours per acre for cotton production between countries owing to hand-picking of cotton versus mechanization. For example, in the U.S., cotton production takes 2.5 hours per hectare versus an estimated 1,408 and 2,458 hours per hectare in India and China, respectively. Inputs and are considered for machinery but not for human labour. This may mask any efficiency attributable to mechanization and might result in greater impacts in countries using mechanization than for those employing hand labours. Water in an LCA is accounted for in terms of consumption and is classified and reported as an environmental indicator rather than ascribed to an impact. Further, an agricultural LCA considers irrigation water only and does not account for precipitation. Factors related to a particular location such as environment, stage of plant growth, site conditions or soil type can dictate the fate of precipitation. Precipitation can possibly be used by the plant, evaporated from the soil, infiltrated into the soil to recharge the water table, or it might run off from the field and into rivers and lakes. A water footprint method which takes into account effective crop water requirement would be more appropriate for agricultural crops. In an industrial setting, the system is relatively simple compared to the complexity of an agricultural system that is characterized as an open system, involving land, biodiversity, and a range of interrelated chemical and biological processes. Data relating to agricultural processes are generally less available in LCA inventories than the energy data required by industrial processes. Agrarian LCA models do exist, but for the most part they are proprietary making the underlying methodologies difficult to assess. Fibre Comparisons A common inclination is to use LCI and LCA data sets to make comparisons among competitive textile fibres. This can be very challenging if not impossible. The production of different textile fibres is highly variable making a comparison between
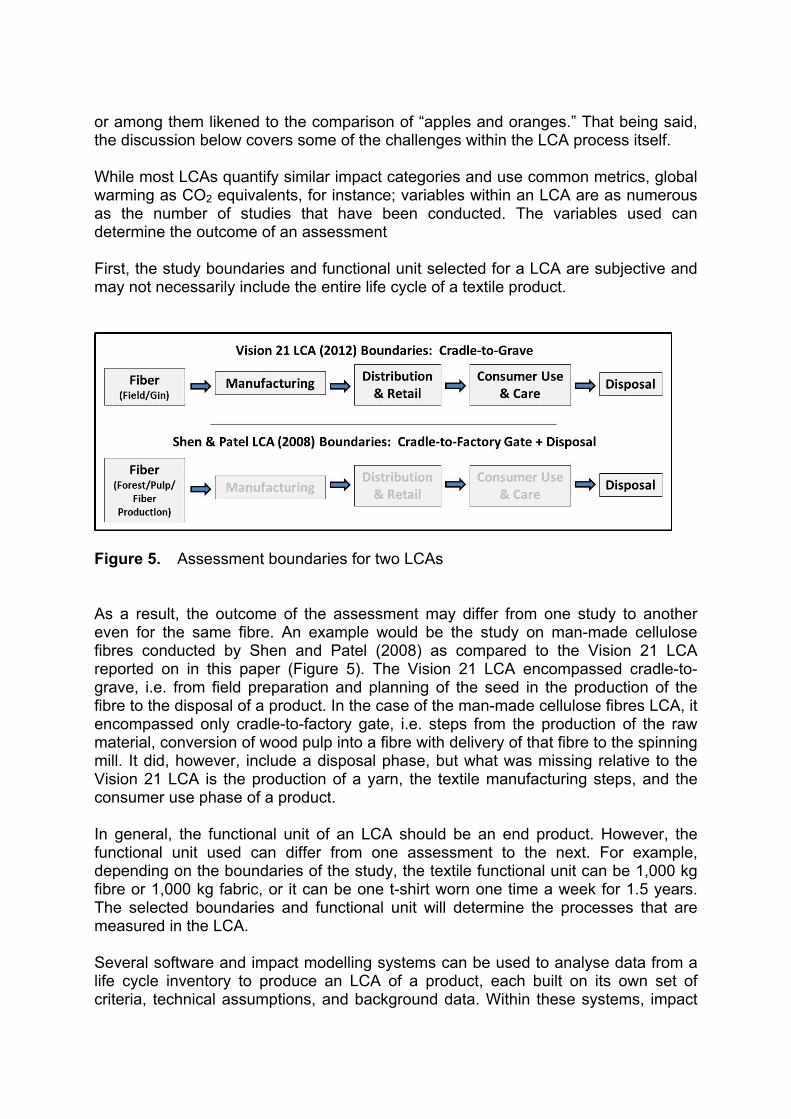
or among them likened to the comparison of “apples and oranges.” That being said, the discussion below covers some of the challenges within the LCA process itself. While most LCAs quantify similar impact categories and use common metrics, global warming as CO2 equivalents, for instance; variables within an LCA are as numerous as the number of studies that have been conducted. The variables used can determine the outcome of an assessment First, the study boundaries and functional unit selected for a LCA are subjective and may not necessarily include the entire life cycle of a textile product.
Figure 5. Assessment boundaries for two LCAs As a result, the outcome of the assessment may differ from one study to another even for the same fibre. An example would be the study on man-made cellulose fibres conducted by Shen and Patel (2008) as compared to the Vision 21 LCA reported on in this paper (Figure 5). The Vision 21 LCA encompassed cradle-to-grave, i.e. from field preparation and planning of the seed in the production of the fibre to the disposal of a product. In the case of the man-made cellulose fibres LCA, it encompassed only cradle-to-factory gate, i.e. steps from the production of the raw material, conversion of wood pulp into a fibre with delivery of that fibre to the spinning mill. It did, however, include a disposal phase, but what was missing relative to the Vision 21 LCA is the production of a yarn, the textile manufacturing steps, and the consumer use phase of a product. In general, the functional unit of an LCA should be an end product. However, the functional unit used can differ from one assessment to the next. For example, depending on the boundaries of the study, the textile functional unit can be 1,000 kg fibre or 1,000 kg fabric, or it can be one t-shirt worn one time a week for 1.5 years. The selected boundaries and functional unit will determine the processes that are measured in the LCA. Several software and impact modelling systems can be used to analyse data from a life cycle inventory to produce an LCA of a product, each built on its own set of criteria, technical assumptions, and background data. Within these systems, impact
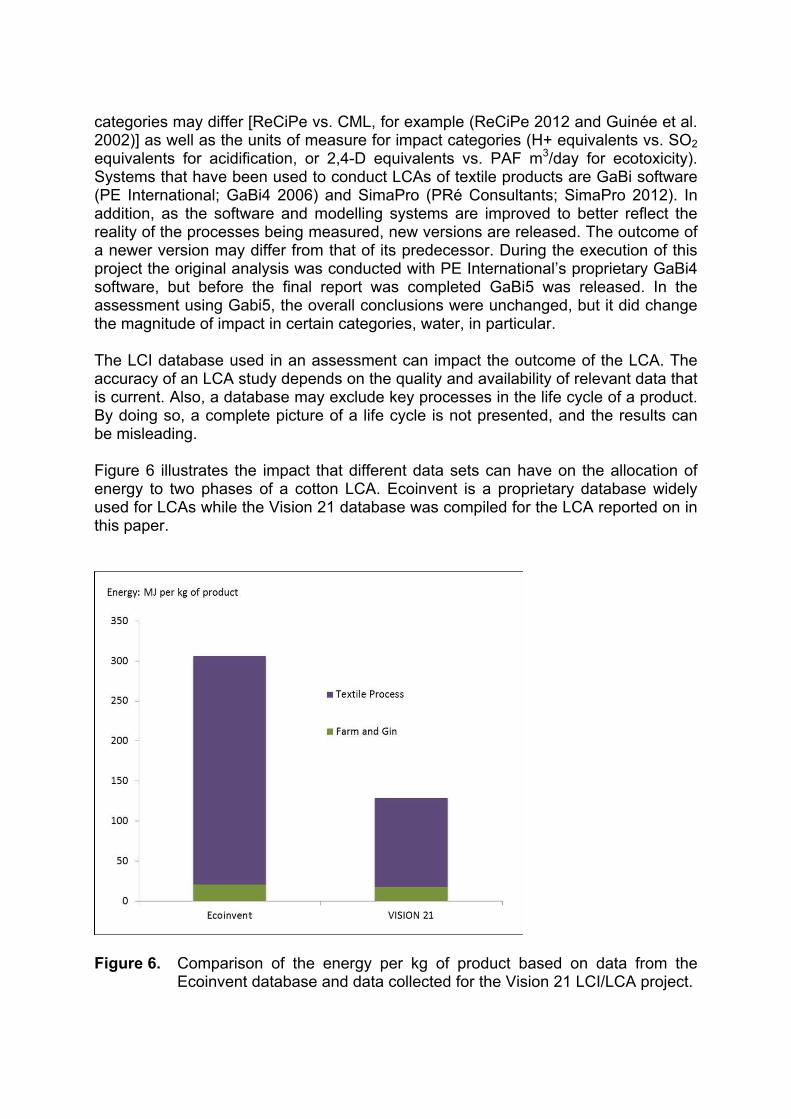
categories may differ [ReCiPe vs. CML, for example (ReCiPe 2012 and Guinée et al. 2002)] as well as the units of measure for impact categories (H+ equivalents vs. SO2 equivalents for acidification, or 2,4-D equivalents vs. PAF m3/day for ecotoxicity). Systems that have been used to conduct LCAs of textile products are GaBi software (PE International; GaBi4 2006) and SimaPro (PRé Consultants; SimaPro 2012). In addition, as the software and modelling systems are improved to better reflect the reality of the processes being measured, new versions are released. The outcome of a newer version may differ from that of its predecessor. During the execution of this project the original analysis was conducted with PE International’s proprietary GaBi4 software, but before the final report was completed GaBi5 was released. In the assessment using Gabi5, the overall conclusions were unchanged, but it did change the magnitude of impact in certain categories, water, in particular. The LCI database used in an assessment can impact the outcome of the LCA. The accuracy of an LCA study depends on the quality and availability of relevant data that is current. Also, a database may exclude key processes in the life cycle of a product. By doing so, a complete picture of a life cycle is not presented, and the results can be misleading. Figure 6 illustrates the impact that different data sets can have on the allocation of energy to two phases of a cotton LCA. Ecoinvent is a proprietary database widely used for LCAs while the Vision 21 database was compiled for the LCA reported on in this paper.
Figure 6. Comparison of the energy per kg of product based on data from the
Ecoinvent database and data collected for the Vision 21 LCI/LCA project.
Assumptions made in conducting an LCA can greatly impact the outcome of the assessment. Examples of areas relative to textile fibres that can have an impact are:
• Water use – groundwater vs. surface water vs. rainfall • Renewable energy – Sunlight vs. municipal solid waste incineration vs.
biomass • Use and care – Hand washed vs. machine washed (washer efficiency, water
temperature, load size, etc.); Line dried vs. machine dried (machine type, temperature, load size, etc.)
• Disposal of the product – Incineration vs. landfill vs. recycled/repurposed Finally, an LCA may or may not have been conducted according to ISO standards. Standards and methods used to conduct an LCA internally in an organization, say for research purposes, are flexible. However, when an LCA is used to make “public” comparisons, specific ISO standards must be met for the study to be considered creditable. Addressed in these additional requirements are: (a) data quality; (b) a peer review process of the LCA; (c) validity of the impact assessment; and (d) criteria for comparing different systems. Furthermore, any LCA used in the public context must have transparency and be publicly available. Summary & Conclusions The value of this study lies primarily in the LCI data, as not only is existing cotton LCI data obsolete, but the sources, in some cases, cannot be verified. By undertaking this study the cotton industry has a clear understanding of the data sources, as well as the data gaps, and now has a solid foundation upon which to further build the dataset. Impact assessment results, although important, should be regarded as a benchmark based on the data for the years of 2005-2010, and are not only subject to interpretation, but will change as the LCI expands. The LCI team is in the process of understanding the results and implications of this study and determining how to guide future research. However, the following next steps have been identified as most critical:
• Continue to conduct research to improve cotton’s water and nitrogen use efficiencies.
• Work with mills to measure additional spinning and wet processing energy demands and water use which will identify opportunities for further reductions in the burdens associated with textile manufacturing.
• Continue to support wastewater reduction research. • Educate and engage with consumers to significantly reduce the impacts at the
use phase level. The focus should be on the choice of water temperature and washer type.
Completing the LCI followed by the LCA of a cotton product proved to be a resource intensive project requiring considerable commitment of all involved. Adding to the complexity and challenges were the difficulties encountered in adopting the LCA methodology to an agricultural product. This was particularly true where water and pesticides were concerned. Also, caution must be taken when comparing these results with competitive textile fibres. There are many pitfalls that must be avoided for such comparisons to be creditable.
References Ecoinvent Centre. 2012. http://www.ecoinvent.org/database/ FAO. 2011. AQUASTAT: FAO's Information System on Water and Agriculture. Food and Agricultural Organization of the United Nations. http://www.fao.org/nr/water/aquastat/water_use/index.stm GaBi 4. 2006. Software and Databases for Life-Cycle-Assessment and Life-Cycle-Engineering, LBP University of Stuttgart and PE INTERNATIONAL GmbH, Leinfelden-Echterdingen. Guinée, J.B., M. Gorrée, R. Heijungs, G. Huppes, R. Kleijn, A. deKoning, L. van Oers, A. Wegener Sleeswijk, H. Udo de Haes, H. de Bruijn, R. van Duin, and M.A.J. Huijbregts. 2002. Handbook on life cycle assessment. Operational guide to the ISO standards. I: LCA in perspective. IIa: Guide. IIb: Operational annex. III: Scientific background. Kluwer Academic Publishers, ISBN 1-4020-0228-9, Dordrecht, 692 pp. Grace, P. 2009. Life cycle assessment of a 100% Australian-cotton t-shirt. Institute for Sustainable Resources, Queensland University of Technology, BRISBANE QLD. 107 pp. International Organization for Standardization (ISO). 2006. Environmental Management – Life Cycle Assessment – Principles and Framework. Series 14040 and 14044. International Textile Manufacturers Federation (ITMF). 2009. International Textile Machinery Shipment Statistics. Vol 32. Matlock, M., G. Thoma, D. Nutter, and T. Costello. 2008. Energy Use Life Cycle Assessment for Global Cotton Production Practices. Center for Agricultural and Rural Sustainability. University of Arkansas Division of Agriculture. Final report. UA Division of Agriculture LCA for Cotton. http://asc.uark.edu/Cotton_Incorporated_Energy_LCA_Final.doc Nemecek T., A. Heil, O. Huguenin, S. Meier, S. Erzinger, S. Blaser, D. Dux, and A. Zimmermann. 2004. Life Cycle Inventories of Agricultural Production Systems. Ecoinvent 2000 No. 15. Agroscope FAL Reckenholz and FAT Taenikon, Swiss Centre for Life Cycle Inventories, Dübendorf, CH. ReCiPe. 2012, http://www.lcia-recipe.net Shen, L., and M. K. Patel. 2008. Life cycle assessment of man-made cellulose fibres. Utrecht, The Netherlands. SimaPro. 2012. http://www.pre-sustainability.com/content/simapro-lca-software United States Department of Agriculture (USDA). 2011. Official USDA estimates, Retrieved from http://www.fas.usda.gov/psdonline/psdQuery.aspx.