Embed Size (px)
Citation preview
Penn State Law eLibrary
Journal Articles Faculty Works
1-1-1996
A Lawyer's Guide to Modern Valuation Techniquesin Mergers and AcquisitionsSamuel C. Thompson Jr.Penn State Law
Follow this and additional works at: http://elibrary.law.psu.edu/fac_works
Part of the Tax Law Commons
This Article is brought to you for free and open access by the Faculty Works at Penn State Law eLibrary. It has been accepted for inclusion in JournalArticles by an authorized administrator of Penn State Law eLibrary. For more information, please contact [email protected].
Recommended CitationSamuel C. Thompson Jr., A Lawyer's Guide to Modern Valuation Techniques in Mergers and Acquisitions, 21 J. Corp. L. 457 (1996).

A Lawyer's Guide to Modern Valuation Techniques inMergers and Acquisitions
Samuel C. Thompson, Jr.*
I. INTRODUCTION .......................................... 459
II. IMPORTANCE OF MODERN VALUATION CONCEPTS FOR NON-VALUATION
EXPERT'S .............................................. 463A. Impact in Appraisal Proceedings Under Delaware Law ........... 463B. Impact in Fairness Opinions and in SEC Disclosure Documents ..... 466
C. Impact in Other Contexts ................................ 468
Ill. INTRODUCTION TO PRESENT VALUE, NET PRESENT VALUE, AND INTERNAL
RATE OF RETURN ........................................ 469
A. The Basic Concept of Present Value (PV) ..................... 469
B. The Basic Concept of Net Present Value (NPV) ................. 471
C. The Basic Concept of Internal Rate of Return (IRR) ............. 472
D. The Relationship Between NPV and IRR ..................... 473
E. Reasons for Use of Net Present Value in MakingInvestment Decisions ................................... 474
1. In General ........................................ 474
2. NPV and Economic Rents ............................. 474
F. Capital Rationing and NPV ............................... 475
IV. PRESENT VALUE OF MULTIYEAR INCOME FLOWS: THE DISCOUNTED CASH
FLOW AND NET PRESENT VALUE FORMULAS ..................... 476
A. Introduction ......................................... 476
B. The Five Basic Steps in Using DCF and NPV .................. 477
C. Use of DCF and Other Methodologies in Time's Acquisition of Warner 479
* Dean, University of Miami School of Law. The author would like to thank the following individuals
for their helpful comments on prior drafts of this article: Professor William Klein, UCLA School of Law; Pro-
fessor Michael Knoll, University of Southern California Law Center; Ted Kosloff, Skadden Alps, San Francis-
co; Robert H. Mundheim, General Counsel Solomon Brothers, Inc.; Mark Pinkerton, Lehman Brothers; Pro-
fessor Alan C. Shapiro, University of Southern California Business School; Barry Sanders, Latham and
Watkins, Los Angeles; Professor Elliot Manning, University of Miami School of Law; and Professor Andrea
Heuson, University of Miami Business School. Also, he would like to thank his research assistants, Julian
Nguyen, a 1992 graduate of the Joint JD/MBA program at UCLA, and Daniel Bosis and Byron W. Cooper,
who graduated from the UCLA Law School in 1993, for their assistance in the preparation of this article.
Finally, the author thanks Mark Jones, a 1995 graduate of the UCLA Law School, for his helpful comments.

The Journal of Corporation Law
V. ESTIMATING FREE (OR NEGATIVE) CASH FLOWS AND TERMINAL VALUE . . 481A. Introduction ......................................... 481B. General Principles ..................................... 481C. Estimating Cash Flows .................................. 481D. Estimating Cash Flows on an Incremental Basis ................ 483E. Separating the Investment Decision from the Financing Decision .... 483F. Treating Inflation Consistently ............................. 484G. Illustration of Estimation of Free (or Negative) Cash Flows ........ 484H. Use of a Formula in Estimating Free Cash Flow ............... 486I. Estimating Terminal Value ................................ 489
1. Introduction ....................................... 4892. Estimating Terminal Value Through the Constant Growth Model .. 4903. Estimating Terminal Value Through the Competitive
Equilibrium Model .................................. 4924. Estimating Terminal Value by Reference to Price/Earning Ratios . . 4955. Estimating Terminal Value by Reference to Market/Book Ratios ... 4966. Summary of the Results Under the Four Methods ............. 4977. Estimating Terminal Value in Time-Warner Acquisition: Multiple of
Cash Flow Method .................................. 498J. Use of Formulas for Measuring an Infinite Series of Free Cash Flows . 498K. Sensitivity Analysis .................................... 499L Summary ............................................ 500
VI. USE OF THE CAPITAL ASSET PRICING MODEL (CAPM) IN DETERMININGTHE APPROPRIATE DISCOUNT RATE ............................ 501A. Introduction ......................................... 501B. Systematic and Unsystematic Risk .......................... 502C. Beta: The Measure of Market Risk .......................... 504
1. Introduction ...................................... 5042. Statistical Derivation of Beta ........................... 5043. Further Elaboration on Beta ........................... 509
D. Risk-Free Rate and Market Risk Premium .................... 510E. The Capital Asset Pricing Model ........................... 511F. Asset and Equity Betas .................................. 514G. FAMA and French Critique of CAPM and Responses ............ 517
VII. USE OF ARBITRAGE PRICING THEORY (APT) IN DETERMINING THEAPPROPRIATE DISCOUNT RATE ............................... 520
VIII. INTERACTION BETWEEN INVESTMENT AND FINANCING DECISIONS: USE OFADJUSTED NET PRESENT VALUE TECHNIQUE ....................... 521
IX. USE OF THE WEIGHTED AVERAGE COST OF CAPITAL (WACC) INDETERMINING THE APPROPRIATE DISCOUNT RATE .................. 522
X. APPLICATION OF DCF IN ACQUISITIONS THAT PRODUCE SYNERGIES ..... 525
[Spring

Modern Valuation Techniques in Mergers and Acquisitions
XI. ILLUSTRATION OF THE APPLICATION OF DCF, NPV, AND CAPM IN AN
ACQUISITION CONTEXT .................................... 528
XII. NON-DCF VALUATION TECHNIQUES: COMPARABLE COMPANIES AND
COMPARABLE TRANSACTIONS ................................ 530
A. Introduction to the Direct Comparisons ...................... 530B. Equivalence Between Direct Comparison and Direct Capitalization ... 532C. Selecting Comparable Companies and Determining Multiples ....... 533D. Selecting the Value Indicator and the Observable Variable ......... 534E. Accounting for Control Premiums: The Comparable Transactions
Approach . ........................................... 537F. Applicability of the Direct Comparison Approach in Time-Warner. ... 537
XIII. CONCLUSION ........................................... 538
APPENDIX A: Excerpts from Joint Time and Warner Information Statement and TimeProspectus, dated December 6, 1989.
APPENDIX B: Fairness Opinion to Warner Board from Lazard Freres & Co. (Lazard),dated June 16, 1989.
APPENDIX C: Excerpts from Joint Presentation by Wasserstein Perella & Co., Inc.and Shearson Lehman Hutton, Inc. to Time's Board: Exhibit (b)(5)to Schedule 13E-3.
APPENDIX D: Excerpts from the Presentation to the Warner Board by LazardRegarding the Valuation of Warner: Exhibit (b)(2) to theTime/Warner Schedule 13E-3.
APPENDIX E: Solvency Opinion Issued by the Manufacturer's Appraisal Company tothe Lenders in Time's Acquisition of Warner: Schedule (b)(15) to theTime/Warner Schedule 13E-3.
APPENDIX F: Excerpt from Joint Bank America (BAC) and Security Pacific (SPC)Proxy Statements and Bank America Prospectus, dated November 14,1991.
I. INTRODUCTION'
The starting point for both the buyer and the seller in any merger or acquisitiontransaction is to determine the value of the target corporation. For the buyer (i.e., theacquiring corporation), this is a capital budgeting decision2 similar to any other.invest-
1. For a good introduction to valuation concepts, see Cede & Co. v. Tedhnicolor, Inc., No. CIV.A.7129, 1990 WL 161084 (Del. Ch. Oct. 19, 1990).
2. J. FRED WESTON Er AL., MERGERS REsrRUCrURING AND CORPORATE CONTROL 132 (1990) [herein-
19961

The Journal of Corporation Law
ment decision, such as the decision to build a new plant. For the seller (i.e., either thetarget corporation in a sale of assets or its shareholders in a sale of stock), the determi-nation of the target's value sets the reservation price at which the seller will stop hold-ing and sell.
There are many techniques for determining the value of the assets or shares of atarget corporation. These include: (1) valuation based on comparable target corpora-tions3-similar to the traditional technique for valuing real estate; (2) valuation basedon comparable transactions 4 -looking to transactions that are similar to the one inwhich the stock or assets of the target are being acquired; (3) valuation based on theliquidation value of the assets of the target corporation; (4) valuation based on the re-placement value of the target's assets; (5) valuation based on a leveraged buyout (LBO)analysis by a financial5 buyer; and (6) valuation based on the discounting to presentvalue of the target's expected future cash flows through the use of the discounted cashflow (DCF) technique, with the discount rate determined by the use of (a) the capitalasset pricing model (CAPM), (b) arbitrage pricing theory (APT), or (c) the weightedaverage cost of capital (WACC). This article focuses on DCF, CAPM, APT, andWACC,' modem valuation techniques based on economic models of valuation.7 TheDCF model provides the mechanism for discounting to present value the target's ex-pected future cash flows, with the discount rate provided by either the CAPM model,the APT model, or the WACC model.
Modem finance theory teaches that the value of an investment, such as a targetcorporation, is not determined by accounting conventions, but rather equals the presentvalue of the cash flows expected to be produced by the investment, discounted at a ratethat properly reflects the risk associated with the investment Thus, expected net cash
after WESTON ET AL, MERGERS] (explaining that "capital budgeting is a form of cost-benefit analysis, amethod of determining whether benefits exceed costs when both are properly measured and evaluated").
3. This technique is commonly known as "the comparable company technique."4. This technique is commonly known as "the comparable transaction technique."5. A strategic buyer intends to operate the target's assets for the long term. By contrast, a financial
buyer intends to buy the target and then dispose of its assets in the short term at a profit.6. This article principally relies on several of the leading treatises and books dealing with corporate
finance, valuation, and the financial aspects of mergers and acquisitions. See, e.g., ZvI BODIE Er AL, INVEST-MENTS (1989) [hereinafter INvESTMENTs]; RICHARD A. BREALtY & STEWART C. MYERS, PRINCIPLES OFCORPORATE FINANCE (4th ed. 1991) [hereinafter BREALEY & MYERS]; THOMAS E. COPELAND & J. FREDWESTON, FINANCIAL THEORY AND CORPORATE POLICY (3d ed. 1988) [hereinafter COPELAND & WESTON];THOMAS E. COPELAND Er AL, VALUATION: MEASURING AND MANAGING THE VALUE OF COMPANIES (1990)[hereinafter COPELAND Er AL, VALUATION]; BRADFORD CORNELL, CORPORATE VALUATION: Toots FOREFFECrivE APPRAISAL AND DECISION MAKING (1993) (hereinafter CORNELL, CORPORATE VALUATION]; ROB-ERT A. HAUGEN, MODERN INvESTMENT THEORY (2d ed. 1990) [hereinafter HAUGEN]; ALFRED RAPPAPORT,CREATING SHAREHOLDER VALUE (1986) [hereinafter RAPPAPORT]; ALAN C. SHAPIRO, MODERN CORPORATEFINANCE (1990) [hereinafter SHAPIRO]; WESTON Er AL, MERGERS, supra note 2. For a collection of materialson valuation, see RONALD J. GILSON & BERNARD S. BLACK, THE LAW AND FINANCE OF CORPORATE ACQUI-srroNs 62-154 (2d ed. 1995) [hereinafter GILSON & BLACK, LAW AND FINANCE]; RONALD J. GILSON &BERNARD S. BLACK, (SOME OF) THE ESSENTIALS OP FINANCE AND INvESTMENT (1993); SHANNON P. PRATT,ROBERT F. REILLY & ROBERT P. SCHWEIHS, VALUING A BUSINESS: THE ANALYSIS AND APPRAISAL OFCLOSELY HELD COMPANIES (1996).
7. See, e.g., COPELAND Er AL, VALUATION, supra note 6, at 75.8. See, e.g., BREALEY & MYERS, supra note 6, ch. 2; SHAPIRO, supra note 6, ch. 2. See generally Steve
[Spring
Modem Valuation Techniques in Mergers and Acquisitions
flow, and not reported financial earnings, is one of the key elements in modern valua-
tion techniques. The DCF, CAPM, APT, and WACC models are the principal tools forimplementing this modem theory. These models are regularly employed by investment
bankers and other valuation specialists involved in mergers and acquisitions.In many situations it may be appropriate to utilize multiple techniques in valuing a
target 9 For that reason, references here are also made to the comparable transactionsand comparable companies' techniques, which are also often used by valuation special-
ists. The option valuation approach, which may be used when future investment deci-
sions are not known at the inception of a project, is not examined here."This article is written for lawyers, judges, and other non-valuation specialists who
may be involved in mergers, acquisitions, and related transactions through proceduressuch as appraisal and fairness proceedings. Although such professionals are not requiredto be experts in valuation techniques, in many instances they need a basic understandingof the DCF, CAPM, APT, and WACC models."
In their treatise on corporate finance, Professors Brealey and Myers emphasize theimportance of the DCF method of valuation, stating that "[vialue today always equals
future cash flow discounted at the opportunity cost of capital."'" Brealey and Myersexplain that the opportunity cost of capital-the discount or "hurdle"'3 rate-is the "re-
turn foregone by investing in the [target] rather than securities."' 4 According toBrealey and Myers, CAPM is the "best-known model of risk and return'"' and is pre-
ferred over the APT model, 6 due to the APT model's elaborateness and complexity,
for determining the discount rate to be used within the DCF model.Both CAPM and APT are derived from the efficient capital markets hypothesis,
which asserts that if information is easily available to investors in a securities market,
security prices will reflect all relevant and ascertainable information.'7 However, a1992 empirical study of CAPM by Professors Fama and French has called into question
the validity of the hypothesis. 8 Their findings have been challenged by Professors Roll
and Ross. 9 In any event, it seems likely that financial analysts and investment bankers
N. Kaplan & Richard S. Ruback, The Valuation of Cash Flow Forecasts: An Empirical Analysis, 50 J. FIN.
1059 (1995) (finding empirical evidence that the DCF technique provides reliable estimates of market value).
9. See, e.g., Brian H. Saffer, Touching All Bases in Setting Merger Prices, MERGERS AND AcQuisI-TIONS 42 (Fall 1984).
10. See, e.g., SHAPIRO, supra note 6, at 223-30.11. See, e.g., Hanson Trust PLC v. MLSCM Acquisition Inc., 781 F.2d 264, 275 (2d Cir. 1986) (noting
that in evaluating a hostile tender offer the target's board was obligated to become familiar with the invest-
ment banker's report).12. BREALEY & MYERS, supra note 6, at 63.13. Id. at 13.14. Id.15. Id. at 174.16. Id. (explaining that the APT model "offers an alternative theory of risk and return").
17. Eugene F. Fama, Efficient Capital Markets II, 46 J. FIN. 1575, 1589-99 (1991) [hereinafter Fama,
Efficient Capital Markets I]; see also BREALEY & MYERS, supra note 6, chs. 8, 13. This article does not deal
generally with the efficient capital markets hypothesis. For a general discussion of the hypothesis, see Ronald
J. Gilson & Reinier H. Kraakman, The Mechanism of Market Efficiency, 70 VA. L REV. 549 (1984).
18. Eugene F. Fama & Kenneth R. French, The Cross-Section of Expected Stock Returns, 47 J. FIN. 427
(1992) [hereinafter Fama & Frenchl.
19. Richard Roll & Stephen A. Ross, On the Cross-Sectional Relation Between Expected Returns and
1996]
The Journal of Corporation Law
will continue to use CAPM. The model enjoys prominence in the leading texts on cor-porate finance* and has been taught to thousands of MBA students.
The Fama and French critique of CAPM, discussed below,21 may both increasethe use of APT in determining discount rates and possibly decrease the importance ofthe DCF model. The model has no utility without the use of an appropriate discountrate. On the other hand, as demonstrated in the discussion of APT,22 in many instancesthe discount rate determined using CAPM approximates the rate determined using APT.Thus, although CAPM may not produce the precise cost of capitals, it should produce arate that is a close approximation. Since valuation is an inexact science, it would not beappropriate at this time to completely abandon CAPM.
Part II of this Article outlines various types of acquisitions and other contexts inwhich a knowledge of modem valuation concepts can be important to persons who arenot valuation experts. Part III introduces the concepts of present value and net presentvalue (NPV), which are at the heart of the DCF technique. Part III also discusses therelated concept of internal rate of return (IRR). Part IV expands on the DCF and NPVtechniques in situations involving multiple cash flows. Part V provides guidelines forestimating the free cash flows and terminal value used in the DCF technique. Part VIexplores the determination, through the use of CAPM, of the discount rate used in theDCF model. Part VI.G discusses the recent critique of CAPM by Professors Fama andFrench.
Part VII discusses the use of the APT model in determining the discount rate usedin the DCF model. This APT model is based on multiple factors, many of which aredifficult to identify and quantify, whereas CAPM is based on three factors, each ofwhich generally can be easily determined. Part VIII examines the interaction betweenthe investment decision and the financing decision. Part IX discusses the weighted aver-age cost of capital (WACC) approach, which in appropriate circumstances may be usedin lieu of CAPM or APT for determining the discount rate to be used in the DCF mod-el.
Part X discusses the use of DCF in acquisitions that produce synergies. Synergiesarise when the combination of the acquiror and the target results in reduced costs orincreased revenue that could not be realized if the two firms remained independent.Part XI illustrates the application of DCF and CAPM in determining the price of atarget in a merger. Part XII provides an introduction to non-DCF valuation techniques.Finally, Part XIII contains the conclusion.
The Appendices contain excerpts from various documents that were prepared inconnection with Time, Inc.'s acquisition of Warner Communications, Inc. These docu-ments relate to the valuation of Warner by the board of directors of both Warner, thetarget, and Time, the acquiror. In addition, Appendix F contains excerpts from theproxy statement involving the recent acquisition by Bank America of Security Pacific.
Betas, 49 J. FIN. 101 (1994) [hereinafter Roll & Ross].20. See, e.g., BREALEY & MYERS, supra note 6, ch. 9; SHAPIRO, supra note 6, at 275-96.21. See infra part VI.G (examining the critique of CAPM).22. See infra part VII (discussing the APT method).
[Spring
Modem Valuation Techniques in Mergers and Acquisitions
II. IMPORTANCE OF MODERN VALUATION CONCEPTS FOR NON-VALUATION EXPERTS
A. Impact in Appraisal Proceedings Under Delaware Law
The Delaware Supreme Court's decision in Weinberger v. UOP, Inc.2" highlights
the importance of modem valuation concepts. In Weinberger, a controlling corporate
shareholder of the target acquired the target in a freeze-out merger.24 The Delaware
Supreme Court found that the controlling shareholder breached its fairness duty to the
public shareholders.' Although the court granted recovery to the public shareholders
in their challenge to the merger, the court held that for subsequent proceedings the
remedy for complaining shareholders is to formally dissent from the transaction and to
have their shares appraised.!6 The court further held that in determining the value of
stock in appraisal proceedings, Delaware courts are no longer required to use the Dela-
ware Block Method exclusively, but may follow a more "liberal approach." This lib-
eral approach is to include "proof of value by any techniques or methods which are
generally considered acceptable in the financial community." '2 In Weinberger, the
plaintiff's investment analyst used both the DCF technique and the comparable transac-
tions approach in valuing the target company.Under the Delaware Block Method, the value of a firm is determined by taking a
weighted average of the following four factors:
(1) the market or trading value of the target's shares before the merger;
(2) the value of the target's shares determined by multiplying its averagerecent earnings by an appropriate multiple (i.e., capitalization of earnings);
(3) the value of the target determined by considering the net asset value of
the target (i.e., fair market value of assets less liabilities); and(4) the value of the target based on its past dividend stream.29
The weights for the four factors are determined by the particular facts and circumstanc-
es, and in appropriate cases, a factor may have a weight of zero.The Delaware Block Method has been followed by other states; 0 however, in the
view of the authors of a leading casebook on corporations, "no professional analyst
would deem it acceptable."' These same authors say that although some Delaware
23. 457 A.2d 701 (Del. 1983). See generally Note, Valuation Problems in the Appraisal Remedy, 16
CARDOZO L REV. 649, 662-66 (1994) (discussing Weinberger) [hereinafter Valuation Problems].
24. 457 A.2d at 701.25. 1d26. Id.27. Id.28. Id. at 713. In In re Shell Oil Co., 607 A.2d 1213, 1223 (Del. 1992), the Delaware Supreme Court
recommended that the Court of Chancery appoint its own valuation expert in an appraisal proceeding. This
was done in Kleinwort Benson, Ltd. v. Silgon Corp., Del. Ch. C.A. 11107 (June 15, 1995). See generally
Joseph E. Calio, New Appraisals of Old Problems: Reflections on the Delaware Appraisal Proceedings, 2 AM.
Bus. LJ. 1, 64-66 (1994) (discussing court appointed experts).
29. See, e.g., Universal City Studio v. Francis I. DuPont & Co., 312 A.2d 344 (Del. Ch. 1973), affd,
334 A.2d 216 (Del. 1975). See generally Valuation Problems, supra note 23, at 659-62 (discussing the
Delaware Block Method).
30. See, e.g., Piemonte v. New Boston Garden Corp., 387 N.E.2d 1145 (Mass. 1979); In re Valuation of
Common Stock of Libby, McNeill & Libby, 406 A.2d 54 (Me. 1979).31. JESSE H. CHOPER Er AL, CASES AND MATERIALS ON CORPORATIONS 1187 (3d ed. 1989) [hereinafter
1996]
464 The Journal of Corporation Law [Spring
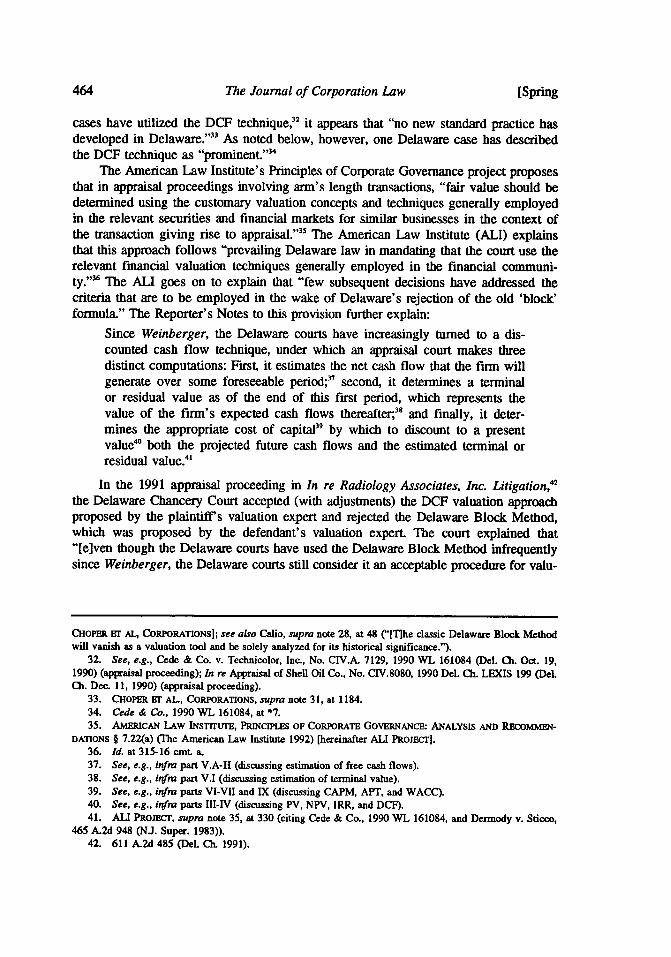
cases have utilized the DCF technique," it appears that "no new standard practice hasdeveloped in Delaware."33 As noted below, however, one Delaware case has describedthe DCF technique as "prominent."'
The American Law Institute's Principles of Corporate Governance project proposesthat in appraisal proceedings involving arm's length transactions, "fair value should bedetermined using the customary valuation concepts and techniques generally employedin the relevant securities and financial markets for similar businesses in the context ofthe transaction giving rise to appraisal."35 The American Law Institute (ALI) explainsthat this approach follows "prevailing Delaware law in mandating that the court use therelevant financial valuation techniques generally employed in the financial communi-ty." The ALl goes on to explain that "few subsequent decisions have addressed thecriteria that are to be employed in the wake of Delaware's rejection of the old 'block'formula." The Reporter's Notes to this provision further explain:
Since Weinberger, the Delaware courts have increasingly turned to a dis-counted cash flow technique, under which an appraisal court makes threedistinct computations: First, it estimates the net cash flow that the firm willgenerate over some foreseeable period;" second, it determines a terminalor residual value as of the end of this first period, which represents thevalue of the firm's expected cash flows thereafter;" and finally, it deter-mines the appropriate cost of capital 9 by which to discount to a presentvalue' both the projected future cash flows and the estimated terminal orresidual value."
In the 1991 appraisal proceeding in In re Radiology Associates, Inc. Litigation,"2
the Delaware Chancery Court accepted (with adjustments) the DCF valuation approachproposed by the plaintiff's valuation expert and rejected the Delaware Block Method,which was proposed by the defendant's valuation expert. The court explained that"[e]ven though the Delaware courts have used the Delaware Block Method infrequentlysince Weinberger, the Delaware courts still consider it an acceptable procedure for valu-
CHOPER Hr AL., CORPORATIONS]; see also Calio, supra note 28, at 48 ('The classic Delaware Block Methodwill vanish as a valuation tool and be solely analyzed for its historical significance.").
32. See, e.g., Cede & Co. v. Technicolor, Inc., No. CIV.A. 7129, 1990 WL 161084 (Del. Cli. Oct. 19,1990) (appraisal proceeding); In re Appraisal of Shell Oil Co., No. CIV.8080, 1990 Del. Ch. LEXIS 199 (Del.Ch. Dec. 11, 1990) (appraisal proceeding).
33. CHOPER ET AL., CORPORATIONS, supra note 31, at 1184.34. Cede & Co., 1990 WL 161084, at *7.35. AMEucAN LAW INsTrTTE, PRINCIPLES OF CORPORATE GOvERNANCE: ANALYSIS AND RECOMMEN-
DATIONS § 7.22(a) (The American Law institute 1992) [hereinafter AL PROIECT].36. Id at 315-16 cmL a.37. See, e.g., infra part V.A-H (discussing estimation of free cash flows).38. See, e.g., infra part V.I (discussing estimation of terminal value).39. See, e.g., infra parts VI-VII and IX (discussing CAPM, APT, and WACC).40. See, e.g., infra parts Ill-IV (discussing PV, NPV, IRR, and DCF).41. ALI PROJECT, supra note 35, at 330 (citing Cede & Co., 1990 WL 161084, and Dermody v. Sticco,
465 A.2d 948 (N.J. Super. 1983)).42. 611 A.2d 485 (Del. Cli 1991).

Modem Valuation Techniques in Mergers and Acquisitions
ing a company." '43 The court, however, gave "no weight" to the asset value, marketvalue, or earnings value used by the defendant's expert in applying the Delaware BlockMethod."
The court in Radiology Associates found that the DCF technique used by theplaintiffs expert was basically sound!5 The projected revenues and terminal valuewere found to be objectively based and reasonable after adjustment by the court, andthe discount rate was appropriately determined through the use of both CAPM andWACC.
46
The court in Radiology Associates rejected use by the plaintiff s expert of the com-parable companies methodology because of a failure to identify a group of comparablecompanies.' The court explained that under this approach, after the first step of identi-fying comparable public companies the "approach calculates the value of the companythrough the use of earnings and other multiples." 8
In a similar appraisal proceeding in Cede & Co. v. Technicolor, Inc.,41 the Dela-ware Chancery Court performed a detailed analysis of the DCF techniques employed bythe experts for each side. In introducing the DCF concept the court stated:
In many situations, the discounted cash flow technique is in theory the sin-gle best technique to estimate the value of an economic asset. Prior to ourSupreme Court's decision in Weinberger. . . , however, that technique wasnot typically employed in appraisal cases in this jurisdiction. But withWeinberger's implicit encouragement, this technique has become promi-nent."°
The Technicolor court also gave the following general description of the DCF tech-nique:
The DCF model entails three basic components: an estimation of net cashflows that the firm will generate and, when, over some period; a terminal orresidual value equal to the future value, as of the end of the projection peri-od, of the firm's cash flows beyond the projection period; and finally a costof capital with which to discount to a present value both the projected netcash flows and the estimated terminal or residual value."
Although both of the experts in the Technicolor case" used the DCF technique,the court said that the experts' opinions of the value "cover[ed] an astonishing
43. Id. at 496.44. Id. at 498; see also Harris v. Rapid-American Corp, No. CIV. 6462,1990 LEXIS 166, (Del. Ch. Oct
2, 1990) (approving the use of the comparable companies method).45. Radiology Assocs., 611 A.2d at 493.46. Id. at 492-93.47. Id. at 489-90.48. Id. at 489. The use of the comparable companies method was approved by the court in Harris v.
Rapid-American Carp, No. CIV. 6462, 1990 LEXIS 166, (Del. Ch. Oct. 2, 1990).49. No. CIV.A. 7129, 1990 WL 161084 (Del. CI. Oct. 19, 1990).50. Id. at *7.51. Id.52. One of whom was Professor Rappaport, whose book, CIRATINO SHAREHOLDER VALUE, is cited
throughout this article.
19961

466 The Journal of Corporation Law [Spring
range."'53 The court explained: "Two experts looking at the same historic data and eachemploying a discounted cash flow valuation technique arrive at best estimates as differ-ent as $13.14 per share and $62.75 per share."'
The Technicolor court correctly explains why it is possible to get such a differencein valuations using the DCF technique:
While the basic three-part structure of the two DCF models of the samefirm, as of the same date, will be the same, it is probably the case (and iscertainly true here) that the details of the analysis may be quite different.That is, not only will assumptions about the future differ, but differentmethods may be used within the model to generate inputs."s
B. Impact in Fairness Opinions and in SEC Disclosure Documents
The DCF technique is likely to be employed by investment bankers as one of thebases for the issuance of fairness opinions in a variety of contexts, including mergers,tender offers, and leveraged buyouts.56 Although investment bankers have no estab-lished industry guidelines for rendering fairness opinions,51 "[a]lmost without excep-tion" they use some form of DCF in conjunction with an analysis of comparable trans-actions, comparable companies, and liquidation value.5" Both Lazard andWasserstein/Shearson used, among other things, DCF, comparable companies, and com-parable transactions in valuing Warner.
As an example of a fairness opinion, Appendix B contains excerpts from the opin-ion issued by Lazard to the board of directors of Warner. The opinion does not indicatethe methodology utilized in preparing the valuation, but merely states the factual back-
53. Cede & Co., 1990 WL 161084, at *7.54. Id.55. Id. at "8.56. See, e.g., Lucian Arye Babchuk & Marcel Kahan, Fairness Opinions: How Fair Are They and What
Can Be Done About It?, 1989 DuKE LJ. 27 (1989). This article briefly describes the DCF and CAPM tech-niques. Id. at 34-35. Other valuation techniques mentioned in the article are: (1) the value of the firm's net as-sets; (2) a multiple of the firm's past earnings; (3) the discounted value of future dividends; (4) the marketprice of the shares; and (5) an average of these measures. Id at 34-35; see also William J. Carney, FairnessOpinions: How Fair Are They and Why We Should Do Nothing, 70 WAH. U. LQ. 523 (1992) (arguing forno liability except in cases of fraud); Leonard Chazen, Fairness from a Financial Point of View in Acquisi-tions of Public Companies: Is "Third-Party Sale Value" the Appropriate Standard?, 36 Bus. LAW. 1439(1981); Charles M. Elson, Fairness Opinions: Are They Fair or Should We Care?, 53 OHio ST. LJ. 951(1992); Ted J. Fiflis, Responsibility of Investment Bankers to Shareholders, 70 WAH. U. LQ. 497 (1992)(proposing gatekeeper liability); Robert J. Giuffra, Jr., Note, Investment Banker's Fairness Opinions in Corpo-rate Control Transactions, 96 YALE LJ. 119, 132 (1986) (arguing that when directors rely on fairness opin-ions they should be obligated "(1) to select the investment banker with care, (2) to disclose accurate infor-mation to the investment banker, (3) to determine whether the investment banker followed accepted valuationprocedures, and (4) to examine the investment banker's conclusions") [hereinafter Investment Banker's Fair-ness Opinions]; Dale A. Osterlie, Fairness Opinions as Magic Pieces of Paper, 70 WAsH. U. L.Q. 541 (1992)(arguing that the legal relationship between the investment banker and the firm should be governed by fidu-ciary principles rather than straight contract law).
57. Investment Banker's Fairness Opinions, supra note 56, at 137.58. Id. at 137-38.

Modem Valuation Techniques in Mergers and Acquisitions
ground and expresses the opinion of Lazard that the merger consideration is fair to theWarner shareholders from a financial viewpoint. Appendix D, which contains excerptsfrom Lazard's valuation study, illustrates how Lazard utilized the DCF technique as oneof the bases for rendering its fairness opinion.
Fairness opinions have become particularly important in mergers and acquisitionsin view of the Delaware Supreme Court's opinion in Smith v. Van Gorkom.5 Thepractical effect of the Van Gorkom decision is to force publicly held firms to seek fair-ness opinions from investment bankers in merger, acquisition, and similar corporatechange transactions.6' Further, the Second Circuit in Hanson Trust PLC v. MLSCMAcquisition Inc. held that in order for the business judgment rule to apply in the contextof a hostile tender offer, the target's board was obligated to become familiar with theinvestment banker's report.6 The importance of the fairness opinions in establishingthe due care taken by the boards of Time and Warner is illustrated in the discussions ofthe opinions in the Time and Warner Joint Information Statement and Time Prospectus,which is attached as Appendix A.
Although a fairness opinion is not required in a going private transaction62 gov-erned by SEC Rule 13E-3,63 that rule requires the parties to indicate whether the trans-action is fair or unfair to the target's shareholders and whether a fairness opinion wasreceived in the transaction. If a fairness opinion is utilized in a going private transac-tion, Item 9(b) of Schedule 13E-3 requires a detailed description of the opinion includ-ing the procedures followed in preparing the opinion and the "bases for and methods ofarriving at [the] findings or recommendations." Thus, this provision requires disclosureof the information in the "blue books" prepared by the investment bankers for presenta-tion to the boards of directors.'
The excerpt.in Appendix A from the Time and Warner Joint Information Statementand Time Prospectus illustrates this type of disclosure in the context of the final goingprivate merger in which Time completed its acquisition of Warner. This transaction wasgoverned by Rule 13e-3 and Schedule 13E-3. Appendices C and D contain excerptsfrom the blue books of the investment bankers for Time and Warner. These blue bookswere required to be filed with the SEC as part of Schedule 13E-3.
A similar type of comprehensive disclosure is also sometimes required now by theSEC staff in arm's length acquisitions that are not going private transactions. Both Item
59. 488 A.2d 858 (Del. 1985). In Van Gorkom the court held that the directors of the target corporationviolated their duty of care in agreeing to have the target acquired in a friendly merger. The court found thatthe target's directors had not adequately informed themselves as to the value of the target, having relied prin-cipally on the chairman for the valuation. One factor which influenced the court's decision was the directors'failure to follow the normal (although not legally required) practice of obtaining an opinion of an investmentbanker to the effect that the transaction was fair to the target's shareholders.
60. See, e.g., Daniel R. Fischel, The Business Judgment Rule and the Trans Union Case, 40 Bus. L.Aw.1437 (1985); Bayless Manning, Reflections and Practical Tips on Life in the Boardroom After Van Godcom,41 Bus. LAW. 1, 3 (1985).
61. 781 F.2d 264, 275 (2d Cir. 1986).62. A going private transaction consists of certain acquisitions of publicly held corporations by control-
ling shareholders.63. 17 C.F.R. § 240.13e-3 (1985).64. The "blue book" contains the analysis which serves as the basis of the fairness opinion.
1996]

The Journal of Corporation Law
14(a)(10) of Schedule 14A65 and Item 4(b) of Form S-4" provide that if a fairnessopinion materially relating to an arm's length acquisition subject to those provisions hasbeen received, and the opinion is referred to in the prospectus or proxy statement, thenthe parties are required to furnish the same information that would be required by Item9(b) of Schedule 13E-3 under the going private rules. Thus, the same detailed disclo-sures concerning fairness opinions and blue books are required in both going privateand arm's length acquisitions of publicly held firms. There is no requirement, however,to file the blue books in arm's length transactions.'
Notwithstanding this uniformity in the disclosure requirements, the SEC staff haspreviously permitted summary disclosures regarding fairness opinions and blue books inarm's length transactions. This policy has recently changed, at least in significant arm'slength transactions, and the staff now generally requires detailed disclosure of the analy-ses on which any fairness opinion is based. 8 Appendix E, which is an excerpt fromthe Bank America and Security Pacific Joint Proxy Statement and Bank America Pro-spectus, illustrates this type of complete disclosure in the arm's length acquisition ofSecurity Pacific by Bank America. As indicated in Appendix E, Bank America's invest-ment banker used, inter alia, the comparable company, the comparable transaction, andthe DCF techniques. Obviously, it is incumbent on those involved in the preparation ofSEC disclosure documents in which fairness opinions are discussed to be generallyfamiliar with the valuation techniques utilized.
C. Impact in Other Contexts
DCF, CAPM, APT, and WACC may also be employed in determining whether afraudulent transfer has occurred in a leveraged buyout (LBO) or similar transaction. Insuch situations, the secured creditors provide new debt to fund the LBO, and unless thetarget's assets have a sufficient value, the transaction may be viewed as operating as afraud on the unsecured creditors.69 The issue is whether the LBO firm is solvent afterthe transaction. If the firm is insolvent, a fraudulent transfer has occurred.
Courts use two basic valuation standards in determining whether a firm is sol-vent:7" (1) the liquidation method; and (2) the going concern method. One writer hasargued that the going concern method is the appropriate standard?' and that the DCFtechnique should be used in determining going concern value: 2
In LBOs and similar transactions, it is common for the lenders to receive from anappraisal company an opinion that the target will be solvent after the acquisition. Ap-pendix E contains an excerpt from the solvency opinion that was issued to the lenders
65. Schedule 14A contains the SEC proxy rules.66. Form S-4 is the SEC's business combination registration statement.67. See, e.g., Memorandum prepared by law firm of Wachtell, Upton, Rosen & Katz (Oct. 1991) (on file
with author) (discussing fairness opinions and "blue book" analyses).68. Id.69. See, e.g., Alemante G. Selassie, Valuation Issues in Applying Fraudulent Transfer Law to Leveraged
Buyouts, 32 B.C. L. REV. 377 (1991).70. Id. at 384.71. Id. at 422-25.72. Id. at 426-28.
[Spring
Modem Valuation Techniques in Mergers and Acquisitions
in Time's acquisition of Warner. The opinion defines the "fair salable value" of theresulting company as "the aggregate amount at which the assets of the company, valuedin its entirety as a going concern, would change hands in the open market." It appearsfrom the opinion that the DCF model was one of the techniques employed."'
Finally, DCF, CAPM, APT, and WACC may be used in other valuation contexts,such as determining the offering price of shares in an initial public offering and deter-mining the division of new securities issued in a bankruptcy reorganization. CAPM,APT, and WACC may also be utilized in utility rate-making cases to determine the rateof return a regulated utility should be allowed to earn. 74 In summary, although this Ar-ticle focuses on the use of these modem techniques in the valuation of acquisition tar-gets, these concepts have significance in a variety of contexts.
III. INTRODUCTION TO PRESENT VALUE, NET PRESENT VALUE, AND INTERNAL RATEOF RETURNs
A. The Basic Concept of Present Value (PV)
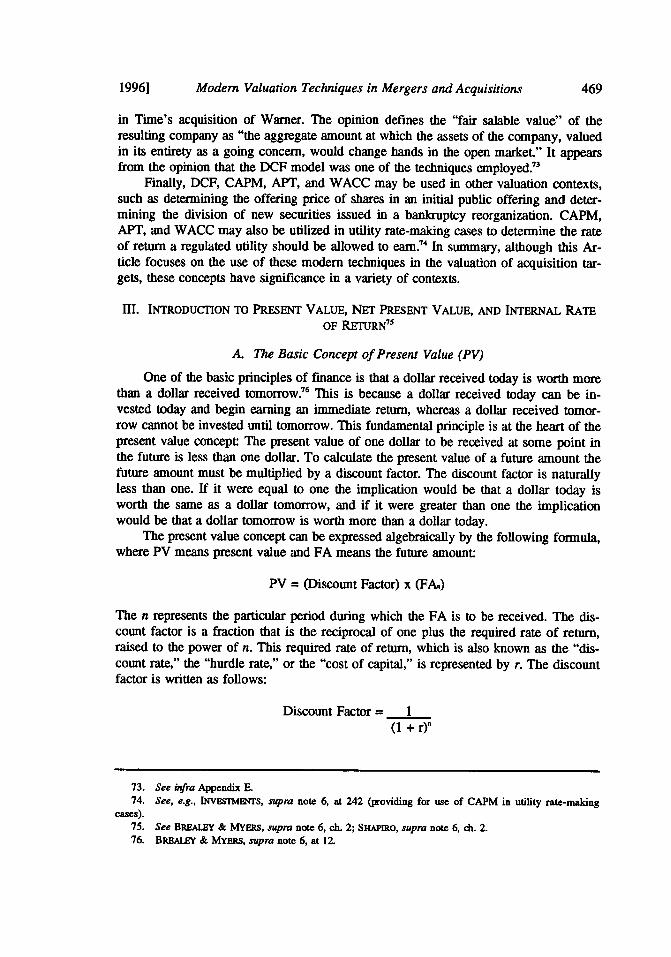
One of the basic principles of finance is that a dollar received today is worth morethan a dollar received tomorrow.76 This is because a dollar received today can be in-vested today and begin earning an immediate return, whereas a dollar received tomor-row cannot be invested until tomorrow. This fundamental principle is at the heart of thepresent value concept: The present value of one dollar to be received at some point inthe future is less than one dollar. To calculate the present value of a future amount thefuture amount must be multiplied by a discount factor. The discount factor is naturallyless than one. If it were equal to one the implication would be that a dollar today isworth the same as a dollar tomorrow, and if it were greater than one the implicationwould be that a dollar tomorrow is worth more than a dollar today.
The present value concept can be expressed algebraically by the following formula,where PV means present value and FA means the future amount:
PV = (Discount Factor) x (FA.)
The n represents the particular period during which the FA is to be received. The dis-count factor is a fraction that is the reciprocal of one plus the required rate of return,raised to the power of n. This required rate of return, which is also known as the "dis-count rate," the "hurdle rate," or the "cost of capital," is represented by r. The discountfactor is written as follows:
Discount Factor = 1(1 + r)
73. See infra Appendix E.74. See, e.g., INvEsTMu s, supra note 6, at 242 (providing for use of CAPM in utility rate-making
cases).75. See BRA.z & MYERs, supra note 6, ch. 2; SHAPIRo, supra note 6, ch. 2.76. BREALEY & MYERs, supra note 6, at 12.
1996]

470 The Journal of Corporation Law [Spring
The discount rate (r) is the reward that investors demand for making an investmenttoday, and n represents the number of periods (e.g., years) that elapse before the partic-ular payment (i.e., FA) is received The discount factor can be obtained from stan-dard charts which generally have on the vertical axis the number of years which mustrun until the payment is received (i.e., n) and on the horizontal axis the discount rate(i.e., r)!' These charts are generally provided as appendices to texts about corporatefinance and are similar to the following:
Number Interest Rate Per Year (r)of Years
(n)1 5 10 15
Discount Factors
1 .990 .952 .909 .870
2 .980 .907 .826 .756
3 .971 .864 .751 .658
5 .951 .784 .621 .497
10 .905 .614 .386 .247
The greater the number of years to run before the FA is to be received and the higherthe interest rate, the lower the discount factor and the present value of the payment.
The greater the risk associated with an investment, the greater the reward investorswill demand for making the investment. The present value of a future payment of a safedollar is worth more than the present value of the future payment of a risky dollar.79
Therefore, the greater the risk, the greater the required return. One of the purposes ofCAPM, APT, and WACC is to determine the appropriate discount rate given the partic-ular level of risk associated with the investment.
These concepts are illustrated as follows:
Example (1). Assume that acquiring corporation (AC) is considering theacquisition of all the stock of a closely held target corporation (TC) and ACwants to determine how much it should pay for the stock of TC. Assumefurther that AC is confident that after operating TC for one year it can sellall the stock of TC for $1 million, and that AC intends to make such a sale.Consequently, in this situation n equals one year because that is when theFA will be paid. Also, assume that because TC is in a growth business itwill not be paying any dividends during the year that AC plans to hold itsstock. Thus, there will be only one FA of $1 million. Finally, assume thatAC has determined (by using CAPM, APT, or WACC) that given the riskassociated with an investment in TC, the required discount rate is 15% (i.e.,
77. In this article the compounding interval is assumed to be a year, which is the general interval used invaluing acquisition targets. Compounding can occur more frequently than once a year. For example, intereston bonds is generally compounded semiannually. See, e.g., SHAPIRO, supra note 6, at 29.
78. BREALEY & MYERS, supra note 6, app. tbl. 1. The computation of present value on a calculator isdiscussed below.
79. Id. at 13.
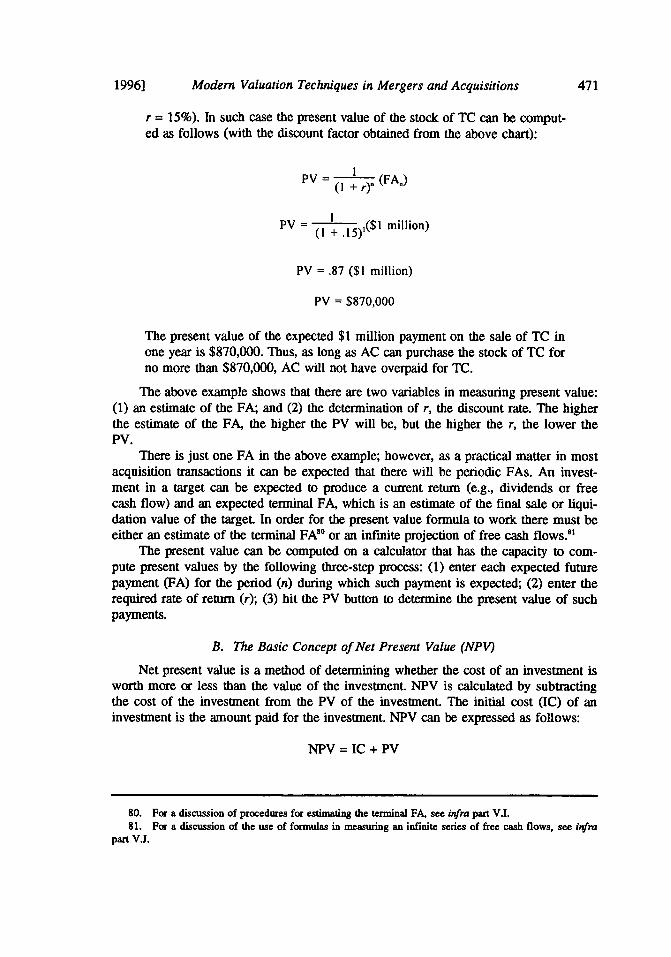
Modern Valuation Techniques in Mergers and Acquisitions
r = 15%). In such case the present value of the stock of TC can be comput-ed as follows (with the discount factor obtained from the above chart):
PV I 1 (FA)
PV ( + /15)($1 million)
PV = .87 ($1 million)
PV = $870,000
The present value of the expected $1 million payment on the sale of TC inone year is $870,000. Thus, as long as AC can purchase the stock of TC forno more than $870,000, AC will not have overpaid for TC.
The above example shows that there are two variables in measuring present value:(1) an estimate of the FA; and (2) the determination of r, the discount rate. The higherthe estimate of the FA, the higher the PV will be, but the higher the r, the lower thePV.
There is just one FA in the above example; however, as a practical matter in mostacquisition transactions it can be expected that there will be periodic FAs. An invest-ment in a target can be expected to produce a current return (e.g., dividends or freecash flow) and an expected terminal FA, which is an estimate of the final sale or liqui-dation value of the target. In order for the present value formula to work there must beeither an estimate of the terminal FA!° or an infinite projection of free cash flows."'
The present value can be computed on a calculator that has the capacity to com-pute present values by the following three-step process: (1) enter each expected futurepayment (FA) for the period (n) during which such payment is expected; (2) enter therequired rate of return (r); (3) hit the PV button to determine the present value of suchpayments.
B. The Basic Concept of Net Present Value (NPV)
Net present value is a method of determining whether the cost of an investment isworth more or less than the value of the investment. NPV is calculated by subtractingthe cost of the investment from the PV of the investment. The initial cost (IC) of aninvestment is the amount paid for the investment. NPV can be expressed as follows:
NPV = IC + PV
80. For a discussion of procedures for estimating the terminal FA, see infra part V.I.81. For a discussion of the use of formulas in measuring an infinite series of free cash flows, see infra
part V.I.
19961

The Journal of Corporation Law
The algebraic formula for computing NPV can be written as follows:82
NPV = IC + I (FA)(0 + 0
IC is a negative number because it represents a cash outflow and
1 (FA)( + r)
is a positive number.Thus, if
1 (FA)
is greater than IC, the NPV of the investment is positive. These concepts are illustratedas follows:
Example (2). Assume that in Example (1) AC is able to purchase the stockof TC for $800,000 even though the value of TC to AC is $870,000. In thatcase the investment has a positive NPV of $70,000 computed as follows:
NPV = IC + I (FA,)(1 +r)"
NPV = (-$800,000) + 1 + .15 ($1 million)
NPV = (-$800,000) + .870 ($1 million)
NPV = (-$800,000) + $870,000
NPV = $70,000
Thus the value of AC should increase by $70,000 if it makes the acquisi-tion.
C. The Basic Concept of Internal Rate of Return (IRR)
The internal rate of return is the rate of return that discounts expected futureamounts (FAs) to an amount equal to the initial cost of an investment. Therefore, theIRR is the discount rate that produces a zero NPV.83 The IRR is the same as the con-
82. BREALEY & MYERS, supra note 6, at 13.83. Id. at 80.
[Spring
Modem Valuation Techniques in Mergers and Acquisitions
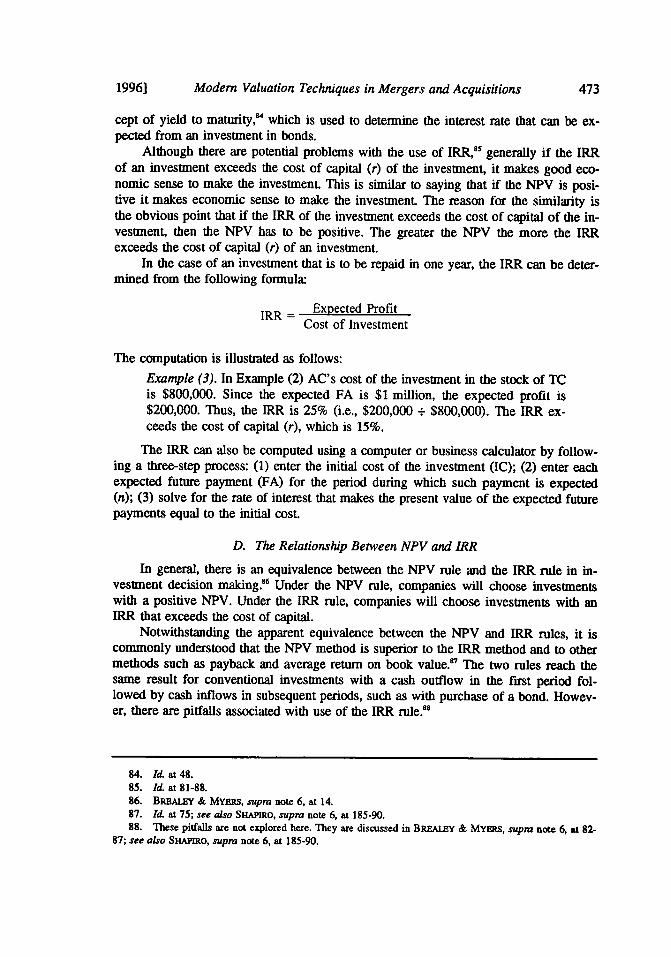
cept of yield to maturity," which is used to determine the interest rate that can be ex-pected from an investment in bonds.
Although there are potential problems with the use of IRR," generally if the IRRof an investment exceeds the cost of capital (r) of the investment, it makes good eco-nomic sense to make the investment. This is similar to saying that if the NPV is posi-tive it makes economic sense to make the investment. The reason for the similarity isthe obvious point that if the IRR of the investment exceeds the cost of capital of the in-vestment, then the NPV has to be positive. The greater the NPV the more the IRRexceeds the cost of capital (r) of an investment.
In the case of an investment that is to be repaid in one year, the IRR can be deter-mined from the following formula:
IRR = Expected ProfitCost of Investment
The computation is illustrated as follows:
Example (3). In Example (2) AC's cost of the investment in the stock of TCis $800,000. Since the expected FA is $1 million, the expected profit is$200,000. Thus, the IRR is 25% (i.e., $200,000 + $800,000). The IRR ex-ceeds the cost of capital (r), which is 15%.
The IRR can also be computed using a computer or business calculator by follow-ing a three-step process: (1) enter the initial cost of the investment (IC); (2) enter eachexpected future payment (FA) for the period during which such payment is expected(n); (3) solve for the rate of interest that makes the present value of the expected futurepayments equal to the initial cost.
D. The Relationship Between NPV and IRR
In general, there is an equivalence between the NPV rule and the IRR rule in in-vestment decision making." Under the NPV rule, companies will choose investmentswith a positive NPV. Under the IRR rule, companies will choose investments with anIRR that exceeds the cost of capital.
Notwithstanding the apparent equivalence between the NPV and IRR rules, it iscommonly understood that the NPV method is superior to the IRR method and to othermethods such as payback and average return on book value.' The two rules reach thesame result for conventional investments with a cash outflow in the first period fol-lowed by cash inflows in subsequent periods, such as with purchase of a bond. Howev-er, there are pitfalls associated with use of the IRR rule."
84. Id. at 48.85. Id. at 81-88.86. BREALEY & MYERS, supra note 6, at 14.87. Id. at 75; see also SHAPIRO, supra note 6, at 185-90.88. These pitfalls are not explored here. They are discussed in BREL & MYERS, supra note 6, at 82-
87; see also SHAPIRo, supra note 6, at 185-90.
19961

474 The Journal of Corporation Law [Spring
E. Reasons for Use of Net Present Value in Making Investment Decisions
1. In General
Shareholder wealth is enhanced if the firm invests in projects with positive NPVs.Such projects add value to the firm because the expected returns exceed the firm's costof capital. 9 Since the firm can always distribute the cash to its shareholders and letthem invest in the capital markets, the cost of capital is the opportunity cost of invest-ing in a particular project, rather than in the capital markets." The cost of capital isthe return shareholders could have earned had they invested the funds on their own insimilar projects with comparable risk. Therefore, the discounting of a project's cashflows by the cost of capital measures how much investors would be prepared to pay forthe project?' This opportunity-cost concept is sensible when comparing assets ofequivalent risk.92
2. NPV and Economic Rents
Brealey and Myers explain that if a project has a positive NPV then in a classicaleconomic sense the project produces economic rents.93 Economic rents are profits inexcess of the firm's opportunity cost of capital.94 These rents may be either persistent,indicating that the firm has monopoly or market power, or temporary (i.e., quasi rents),indicating that the firm is not in long-run equilibrium.9" A positive NPV is nothingmore than the present value of the economic rents.
Professor Shapiro makes a similar point:
The message from this analysis is clear the run-of-the-mill firm operatingin a highly competitive, commodity-type industry is doomed from the startin its search for positive net present value projects. Only firms that canbring to bear on new projects competitive advantages that are difficult toreplicate have any assurance of earning excess returns in the long run 6
Therefore, as a practical matter whenever there is a positive NPV the firm should havesome identifiable advantage over other firms in the market. As Professor Shapiro says,"successful investments (those with positive NPVs) share a common characteristic:They are investments that create, preserve, enhance, and/or capitalize on competitiveadvantages that serve as barriers to entry."
Thus, acquiring corporations should be careful to avoid the tendency to be overoptimistic in the preparation of cash flow estimates because such optimism can lead to
89. BRIAizY & MYERS, supra note 6, at 73-75; see also SHAPIRO, supra note 6, at 177-81.90. BREALEY & MYERS, supra note 6, at 74.91. Id. at 74-75.92. ld. at 75.93. Id. at 248.94. Id.95. BRBALSY & MYERS, supra note 6, at 248.96. Alan Shapiro, Corporate Strategy and the Capital Budgeting Decision, MIDLAND CORP. FIN. J.,
Spring 1985, at 22, 24.97. SHAPIRO, supra note 6, at 308-09.
Modem Valuation Techniques in Mergers and Acquisitions
an overstated NPV. This type of over optimism is apparently one of the principal rea-sons for unsuccessful acquisitions. Of course, an overstated NPV may also result froman underestimate of the cost of capital, but for reasons that will become clear later, thecost of capital is generally based on standard financial processes and, therefore, is lesssusceptible to errors in calculation.
This optimism in the preparation of cash flow projections can lead to the "winner'scurse,"98 which can occur in an auction. Even though the average bidder in an auctionmay accurately assess the value of the thing being sold (e.g., the target), some biddersmay underestimate the target's value and others may overestimate. The winner may beone who overestimates. Professor Roll argues that the winner's curse in acquisitionsmay result from hubris,99 which is overconfidence by the managers of an acquiringcorporation that their valuation of a target is correct and that the lower market valuationdoes not fully reflect the economic value of the target. Hubris may manifest itself in anoverestimate of free cash flows.1'°
F. Capital Rationing and NPV
In many cases the capital available for acquisitions or other investments is limited.And, even if capital is not limited, management capacity may restrict the amount of afirm's new investments.' A firm may have multiple acquisition or investment oppor-tunities that have positive NPVs. In such cases the firm must decide which of the vari-ous opportunities to pursue. Thus, the firm is faced with choosing among several invest-ment opportunities all of which produce a positive NPV. If capital and managementresources were unlimited, the firm would invest in each project."°
One way of solving this capital rationing problem is to choose the project or pro-jects with the highest profitability index.'" The profitability index is the ratio of thepresent value of the project to the initial cost:
Present Value of ProiectInitial Cost of Project
If the profitability index for a project is one, the project's NPV is zero because thepresent value of the project equals the initial cost. The more the profitability indexexceeds one, the greater the profitability of the project. For example, a project with aprofitability index of 1.41 returns $1.41 in present value for each dollar of invest-ment."° Thus, selection of projects with the highest profitability index produces thegreatest present value return on investment. There are several more elaborate capitalrationing techniques."
98. WESTON EL" AL., MERGERS, supra note 2, at 254.99. Richard Roll, The Hubris Hypothesis in Corporate Takeovers, J. Bus., Apr. 1986, at 197.
100. WESTON E" AL., MERGERS, supra note 2, at 254-55.101. Id. at 56.102. Id.103. BREALEY & MYERS, supra note 6, at 113-14; see also SHAPIRO, supra note 6, at 192-93.104. SHAPIRO, supra note 6, at 190.105. BREALEY & MYERS, supra note 6, at 114-17.
19961

The Journal of Corporation Law
IV. PRESENT VALUE OF MULTIYEAR INCOME FLOWS: THE DISCOUNTED CASH FLOWAND NET PRESENT VALUE FORMULAS
A. Introduction
The formula for computing the present value of a cash flow is as follows:
PV = (Discount Factorn)(FA)
PV= I (FA)
This assumes that the required rate of return (r) is the same for each period (n); that is,the required rate for discounting an FA to be received in year two is the same as therequired rate that is used for discounting an FA to be received in year ten. As will beseen in the discussion of CAPM, the r is generally assumed to be the same for all peri-ods. However, because of the term structure of interest rates, which shows the relation-ship between short-term rates and long-term rates, it may be appropriate to use a differ-ent discount rate for each period." I
Although r is assumed to be the same each period, the discount factor (i.e., (i + ))
is different for each period. The greater the time until a particular payment date, thesmaller the discount factor.
Assuming that future payments (FAs) are to be received at the end of years one,two, and three, the present value or discounted cash flow (DCF) formula can be writtenas follows:
PV FA, + FA 2 + FA3
(1+r) (I +r) 2 (1+r)3
The shorthand expression for the DCF formula is:"°
FA(1 +
Interest is automatically compounded in the DCF formula." The assumption in thismodel (which is often the assumption in capital budgeting)"° is that cash flows (FAs)
106. COPELAND & WESTON, supra note 6, at 70-71. An illustration shows that the NPV of two differentprojects can differ depending on whether the cash flows are discounted at a single rate or the rates implied inthe term structure. Id. at 71.
107. BREALEY & MYERS, supra note 6, at 30.108. Id. at 37.109. Id. at 41.
[Spring

Modern Valuation Techniques in Mergers and Acquisitions
are paid at the end of the year. This need not be the case, however. For example, inter-est on U.S. bonds is generally paid semiannually."0 If FAs are paid more frequentlythan annually, the annual yield (r) must be adjusted to reflect such payments. For exam-ple, if the yield to maturity on a bond is 10% annually and the bond makes semiannualpayments, the semiannual yield (r) is 5%.
The net present value is determined by merely adding to the DCF formula theinitial cost of the investment' as follows:
NPV = IC + PV = IC + E FAn
(1 + rn
In essence, this involves subtracting from the present value of the cash flows the initialcost of the investment.
B. The Five Basic Steps in Using DCF and NPV
There are five basic steps in using the DCF and NPV concepts."' First, the ana-lyst must estimate the amount and timing of the income stream,"3 or the negative in-come stream"4 an investment will generate for each year of the investment's life."'This requires an estimate of the terminal value of the investment. The terminal value ofthe investment is the amount to be realized when the investment is finally disposed ofor liquidated. The analyst simplifies the calculation of the present value of what is oth-erwise an infinite series of cash flows by using a terminal value.
An investment may have a negative cash flow for a particular year. A negativecash flow occurs when the required investment of cash for that year exceeds the netcash flow generated from operations for that year. Second, the analyst must determinethe appropriate discount rate for the particular investment. Although there are manytechniques for determining the discount rate, three leading techniques are discussedhere: (1) the capital asset pricing model (CAPM)," 6 (2) the arbitrage pricing theory(APT),"17 and (3) the weighted average cost of capital (WACC)."' Section IX dem-onstrates that the cost of equity in the WACC model may be determined through theuse of CAPM or APT.
Third, the analyst must discount the free and negative cash flows for each periodand the ternnal value to present value using the DCF formula. The discounting of anegative cash flow results in a negative present value for that particular flow. Fourth,
110. Id. at 38.111. IC is a negative number because it is a present cash outflow.112. These five steps are based on the four-step process outlined in BREALBY & MYERS, supra note 6, at
73.113. Income stream accounts for free cash flow, not accounting profits.114. Negative income stream means negative cash flow.115. See infra part V (exploring the estimation process).116. See infra part VI (discussing the use of CAPM).117. See infra part VII (discussing the use of APT).118. See infra part IX (discussing the use of WACC).
19961

The Journal of Corporation Law
the analyst must determine the present value of the investment by adding the positivepresent values of the free cash flows and the terminal value and subtracting the aggre-gate of the negative present values of the negative cash flows. This amount is represent-ed algebraically as follows:
FA,
(1 +r) °
FA. represents both the free or negative cash flow for each period and the terminalvalue for the last period. The discount rate is r.
Finally, to compute the NPV of the investment, the analyst must subtract the initialcost (IC) of the investment from the present value of the investment. The NPV formulais as follows:
NPV = IC + . FAn(1 +r)
NPV = IC + FA, + FA2 + FA3 ... + Terminal Value
(I +r)' (I +r) 2 (I +r) 3 (I +r)
If the result is positive, then the investment has a positive NPV and should be undertak-en unless there are other projects with positive NPVs and the firm's capital rationingtechnique, such as the profitability index, indicates that the firm should undertake oneor more of such other projects instead."9
If the target has multiple lines of business, the acquiror should follow this five-stepprocess in valuing each line, with a separate discount rate determined for each line ofbusiness.
This process can be illustrated as follows:
Example (4). Acquiring corporation (AC) is considering the acquisition ofall of the assets of target corporation (TC). TC is asking $1.5 million for allthe assets, and this is a firm, non-negotiable price. TC has no outstandingdebt. AC expects to dispose of the acquired assets three years after the ac-quisition. AC uses a five-step process in determining whether to make thisinvestment:
First, AC estimates that TC's assets will generate $100,000 of free cashflow at the end of the first year of operation and $400,000 at the end of thesecond year. At the end of the third year AC expects to sell TC for$2 million. AC does not foresee any free cash flow from the operation ofTC during the third year.
119. See supra part III.F.
[Spring

Modern Valuation Techniques in Mergers and Acquisitions
Second, using CAPM, APT, or WACC, AC determines that the appro-priate discount rate for an investment in TC's assets is 15%.
Third, AC determines the present value of the $100,000 and $400,000free cash flows and of the $2 million terminal value:'
PV = I ( +r)" (FAn)
PV ( + .15) 0 0 ,000) + (1 + .15)2 ($400,000) + (I + .15) 3 ($2,000,000)
PV = .870($100,0000) + .756($400,000) + .658($2 million)
PV = $87,000 + $302,400 + $1,316,000
Fourth, AC adds the present values of the cash flows and the terminalvalue. This results in a present value of the investment of $1,705,400:
Present Value of $100,000 $ 87,000Present Value of $400,000 302,400Present Value of $2,000,000 1,316,000
$1,705,400The same computation could be made on a business calculator by enter-ing each of the free cash flow amounts and the terminal value for the appli-cable period and then discounting these figures to present value at the 15%discount rate.
Finally, in order to compute the net present value of the investment, ACsubtracts from the present value of the investment the initial cost of theinvestment, which is the $1.5 million asking price for the shares. Thus, theinvestment has an NPV of $205,400 and should be undertaken, unless thereare other potential projects with positive NPVs and the firm's capital ration-ing model indicates that one or more of those other projects should be pur-sued instead of this one.
C. Use of DCF and Other Methodologies in Time's Acquisition of Warner
The use of the DCF methodology in Time's acquisition of Warner is illustrated inthe Wasserstein/Shearson presentation to the Time board' and in Lazard's presenta-tion to the Warner board.'" Wasserstein/Shearson estimated the free cash flow
120. See supra part l.A (providing chart and discount factors).121. See inffm Appendix C.122. See inffm Appendix D.
1996]

The Journal of Corporation Law
amounts for Warner's Film Entertainment segment.n The present value of the FilmEntertainment segment was computed using three different discount rates and threedifferent estimates of the terminal value." However, the appendix does not indicatehow the range of discount rates was determined. The different terminal values are ap-parently determined by multiplying the projected free cash flow amount for the terminalyear by one of four multipliers."z A similar DCF process is followed for each ofWarner's other business segments.
Wasserstein/Shearson also utilized the comparable transaction technique" andthe comparable company technique"v in valuing each of Warner's business segments.The Wasserstein/Shearson summary of the pre-tax segment valuations of each ofWarner's business segments utilizing DCF, comparable acquisitions, and comparablecompanies is included in Appendix C." This is a valuation of the operating assets ofeach segment without taking account of associated debt." Appendix C also showshow the range of asset values for the various business segments are adjusted to producean estimate of the equity value of Warner.'3 On a per share basis, this estimate rang-es from a low of $68.40 to a high of $77.12. In computing equity value, cash and in-vestments, which are not included in the DCF analysis, are added to the asset value,and debt is subtracted. The reason for first valuing the assets and then valuing the equi-ty by, among other things, subtracting the outstanding debt is discussed below. 3 1
Lazard prepared a DCF analysis of potential prices of Warner's stock for 1991 and1992, discounted back to June 30, 1989.132 Three different equity discount rates areutilized in the discounting. In determining the expected terminal value, three differentprice/earning multiples are utilized for determining the expected prices of Warner stockin 1991 and 1992.133 Lazard presented a consolidated unleveraged DCF analysis ofWarner." In this analysis the expected free cash flows for years 1989 to 1994 are setforth, and these amounts, together with the expected terminal value, are discounted topresent value as of June 30, 1989. Five different discount rates are utilized. A range ofterminal values is obtained by utilizing three different multiples of expected free cashflow for the terminal year (1994)."3
Lazard determined a range of values for Warner's Film Entertainment segmentbased upon a public market range, a private market range, and a discounted cash flow
123. See infra Appendix C, page C-2; see also nfra part V (discussing the estimation process).124. See infra Appendix C, page C-3.125. For a discussion of this method of determining terminal value, see infra part V.17.126. See, e.g., Appendix C, page C-4.127. See, e.g., Appendix C, page C-5.128. See infra Appendix C, page C-6.129. See infra part V.E (discussing the reasons for separating the investment decision from the financing
decision).130. See infra Appendix C, page C-7.131. See infra part VI.F (discussing the difference between asset betas and equity betas).132. See hifra Appendix D, page D-4.133. For a discussion of the price/earning method of determining terminal value, see part V.L4.134. See Kra Appendix D, pages D-2 to D-3.135. See infra part V.1.7 (discussing the estimation of terminal value in the Time-Warner acquisition).
[Spring

Modem Valuation Techniques in Mergers and Acquisitions
range." Similar valuation ranges were provided for Warner's other segments. Boththe Wasserstein/Shearson and the Lazard valuation methodologies are discussed in theexcerpts from the Time/Warner Information Statement and Time Prospectus.'"
V. ESTIMATING FREE (OR NEGATIVE) CASH FLOWS AND TERMINAL VALUE
A. Introduction
The following are two key elements in the DCF and NPV techniques:(1) estimation of the cash flows and terminal value, and (2) determination of the appro-priate discount rate. This section provides some guidelines for estimating the periodicfree or negative cash flows from a project and the terminal value of a project. Unless aninfinite series of cash flows is projected," both periodic cash flows and a terminalvalue are needed for the DCF model to function. Sections V, VI, and VII deal with thesecond key element of the DCF and NPV models: determination of the discount rate.
B. General Principles
Four general rules govern the preparation of a cash flow statement. First, the onlyrelevant factor is cash flow; thus, accounting earnings are irrelevant. Second, cash flowis estimated on an incremental basis, meaning that only the cash flows resulting fromthe investment are taken into account. Third, the investment decision is separated fromthe financing decision. Fourth, inflation must be treated consistently.'39
C. Estimating Cash Flows"40
Cash flow is the difference between "dollars-in" and "dollars-out."'' Cash flowis different from the accounting earnings or profits of a finn. 42 In computing profits,accountants may defer reporting certain cash receipts to future periods or report in anearlier period certain expected future cash receipts. Also, accountants divide cash out-flows between deductible expenses and capital expenditures, which are recoveredthrough depreciation deductions. Thus, accounting profits are not the same as cash flow.
After-tax cash flow is determined by deducting taxes in the year actually paid, notwhen the liability accrues. 43 The taxes are computed as if the fin had no debt and,therefore, no deductible interest. Taxes are determined on the basis of the projected
136. See infra Appendix D, pages D-5 to D-6.137. See infra Appendix A.138. See infra part V.J.139. BREALEY & MYmts, supra note 6, at 96.140. For an elaborate discussion of the details of estimating free cash flows, see COPELAND ET AL, VAL-
UATION, supra note 6, at 109-69; CoRNEUL, CORIPORATE VALUATION, supra note 6, at 108-43; see alsoKeinwort Benson LTD. v. Silgan Corp., 1995 WL 376911, at *5-6 (Del. Ch. 1995) (discussing estimation offree cash flows); SHAPIRO, supra note 6, at 204-30; Gale & Branch, Cash Flow Analysis: More ImportantThan Ever, HARv. Bus. REv. 131 (July-August 1981).
141. BRBALEY & MYERS, supra note 6, at 96.142. Id143. Id.
1996]
The Journal of Corporation Law
actual tax liability'- (not the book tax liability) for an all-equity financed transac-tion."4 Thus, cash flow is computed without taking account of the manner in whichthe project is financed. The result of this computation is called the unlevered cash flow.This means that the cash flow does not take into account any tax savings from interestdeductions. 46
One of two methods is used to account for interest deductions. The first method isthe adjusted net present value method (APV).' 4 Under the APV method, projected taxsavings from interest deductions are separately determined and then are discounted backto present value. The present value of tax savings is then added to the NPV of the pro-ject, which yields APV. The second method uses the weighted average cost of capital(WACC) to determine the discount rate. 4 Any tax savings from the use of debt is au-tomatically accounted for by the use of a lower discount rate. Correctly used, these twomethods should produce the same result.
Noncash deductions that are allowed in computing earnings, such as depreciationand amortization deductions, are added back in computing cash flow. Cash expendituresthat are not deductible in computing earnings, such as capital expenditures, are deductedin computing cash flow. Thus, computing cash flow is merely a process of subtractingdollars going out from dollars coming in.
Also, the working capital needs of the firm should be recognized as a cash expen-diture in estimating cash flows. 9 Working capital is the excess of cash investments,accounts receivable, and inventory over accounts payable. Working capital should growwith growth of the firm.
The only exception to the "dollars-in" rule is that the proceeds of debt and equityfinancing are not included as cash in; the only exception to the "dollars-out" rule is thatinterest payments to debt holders and dividends to shareholders are not deducted. Thereason for these two exceptions is that under the DCF model,"S the financing decisionis separated from the investment decision.
The above principles are set forth in the following equation:Free Cash Flow (FCF) = (Revenue) - (Non-Interest Expense, including
Depreciation) - (Taxes) + (Depreciation) - (Working Capital) - (Capital Ex-penditures).
A positive free cash flow (FCF) indicates the amount of funds available to pay theproviders of capital."' A negative FCF indicates the amount of funds that must bemade available to the firm by the providers of capital.' In a normal investment, thecapital providers fund the initial period investment, which is a negative cash flow. Thecapital providers receive the subsequent period free cash flows as compensation for
144. Id.145. Id. at 106-07.146. The unlevered cash flow is illustrated infra at Appendix C, page C-2.147. See bfra part VIII (discussing the adjusted net present value tedinique).148. See infra part IX (discussing the use of WACC).149. BREAIBY & MYEmts, supra note 6, at 97.150. See fra part Vm (discussing the interaction of the investment decision and the financing decision).151. The providers of capital include both shareholders and creditors.152. COPELAND Er AL, VALUATION, supra note 6, at 111.
[Spring

Modem Valuation Techniques in Mergers and Acquisitions
providing the initial investment. If the present value of the subsequent period free cashflows exceeds the amount of the initial negative free cash flow, the project has a posi-tive net present value. In that case, the capital providers can expect to receive theirinvestment back plus an adequate return.
D. Estimating Cash Flows on an Incremental Basis
In projecting cash flows only additional flows that arise because of the project areconsidered.' 3 For example, accounting conventions may allocate part of the overheadcost of an acquiring corporation, such as supervisory salaries, rent, heat, and lights, to anewly acquired target corporation. However, in projecting the cash flows expected to begenerated by the target, only the extra overhead cost that can be expected to result fromthe acquisition of the target should be included." Thus, in computing free cash flowsin the acquisition context, only those additional cash flows directly attributable to theacquisitions are taken into account.
E. Separating the Investment Decision from the Financing Decision
The investment decision is separate from the financing decision in applying theDCF model. Therefore, debt proceeds used to make the investment are ignored andinterest and principal payments on debt are not treated as cash flows. Thus, the projectis treated as if it were completely financed with equity, with all cash outflows comingfrom shareholders and all cash inflows going to them."55 The financing decision ismade only after a computation of NPV."t
Although the impact of debt acquisition financing is ignored in applying the DCFmethodology, the amount of debt that can be used to finance the transaction is in a realway constrained by the free cash flow available for the payment of interest and princi-pal on the debt. This takes into account, of course, the deductibility of interest, whichreduces the tax liability.
The analysis of the debt repayment ability after an acquisition is often done bycomparing (1) the operating cash flow, which can be estimated using earnings beforedepreciation, interest, and taxes (EBDIT), with (2) the interest and debt repaymentcosts. Other analyses can be undertaken, as well, including a comparison of the balancesheets, operating costs, and earnings per share of the acquiring corporation after theacquisition under various financing proposals." Other analyses include the assump-tion of an acquisition with 50% cash and 50% stock.
The cost and benefits associated with the financing decision, such as issuance costand the tax savings from interest deductions, are separately determined and then dis-
153. BRBALEY & MYERs, sura note 6, at 96-98.154. Id. at 98.155. Id. at 103.156. Id.157. See infra Appendix C, at C-8 (illustrating this type of financing analysis in the context of Time's
acquisition of Warner; containing a portion of Wasserstein/Shearson's analysis of the financial effects of anall cash acquisition of Warner).
19961
The Journal of Corporation Law
counted back to present value.'- This process is not used, however, if the discountrate is determined by using WACC, which takes into account the financing decision.
F. Treating Inflation Consistently
The projected cash flows should reflect the projected effects of inflation becausethe discount rate generally reflects such effects. The discount rate is stated in nominalterms rather than real terms,' and it would be inconsistent to discount cash flowsstated in real terms at the nominal rate. Thus, it is important to state both the cashflows and the discount rate on a nominal basis." ° This means that an estimate of in-flation must be taken into account in making the cash flow projections.
G. Illustration of Estimation of Free (or Negative) Cash Flows
In estimating cash flows, the starting point is to estimate the target's inflation-ad-justed sales for each year, running from the acquisition date to the termination date.This sales forecast often is the most important part of a cash flow forecasL 61 All oth-er elements in the cash flow projection are driven by projected sales. The inflation-ad-justed cost of goods sold and other operating expenses are then subtracted from thesales to arrive at operating profit. This leaves earnings before interest and taxes (EBIT).
Next, taxes are subtracted from operating profit to reach an estimate ofunleveraged net cash flow from operations, that is, cash flow without taking into ac-count any debL Any noncash deductions included in operating expenses, such as depre-ciation, amortization of goodwill, and deferred taxes, are added to this amount.
Finally, any needed inflation adjusted capital investments and inflation-adjustedincreases in working capital are subtracted. The resulting figure is unleveraged free cashflow. Wasserstein/Shearson followed this process in their presentation to Time'sboard. 62 The process is illustrated in the following example:
Example (5). Acquiring corporation (AC) is considering the acquisitionof target corporation (TC). AC has prepared the following inflation-adjustedestimates of TC's free cash flow for the five-year period after the date ofthe acquisition. AC plans to dispose of TC at the end of the five-year peri-od.
158. See infra part VIII (discussing the interaction between the investment decision and the financingdecision).
159. "Real terms" consist of rate minus expected inflation.160. BRIALEY & MYERs, supra note 6, at 98-100.161. CORNEU, CORPORATE VALUATION, supra note 6, at 126.162. See infra Appendix C, at C-2.
[Spring

1996] Modem Valuation Techniques in Mergers and Acquisitions 485
Year 1 2 3 4 5
(I) Sales $1,600,000 S1,700.000 S1.800,000 $1,900,000 $2.100,000,Minus)
(2) Cost of Goods 350,000 475.000 500,000 575,000 650,000Sold land)
(3) Other Operating 150,000 125,000 I00,000 75,000 50,000Expenses (IncludingDepreciation)[Equals]
(4) Operating Profit 1,100,000 1,100,000 1,200.000 1,250,000 1,400,000(Minus)
(5) Taxes 300,000 300,000 350,000 350.000 350,000[Equals)
(6) Unleveragcd Net 800.000 800,000 850,000 900,000 1,050,000Cash Flow[Plus)
(7) Depreciation [and) 100.000 75,000 50,000 25.000 --
(8) Amortization of 0,000 10,000 10,000 10,000 10,0O0Goodwill[and]
(9) Deferred Taxes ?? ?? I? ??[and]
(t0) Any other ?? ?? ??Noncash Expenses[Minus)
(It) Capital 300,000 165,000 90,000 ??Expenditures[and)
(12) Increases in 10,000 20,000 20,000 35,000 60,000Working Capital[and]
(13) Any Other Non. ? ? ?? ??Deductible Cash Ex.penditures[Equals]
(14) Unleseragcd Free $ 600,000 S 700,000 S 800,000 S 900,000 S 1,000,000Cash Flow

The Journal of Corporation Law
H. Use of a Formula in Estimating Free Cash Flows
If specific projections of the elements of a target's free cash flows are not avail-able, a projected cash flow statement may be prepared by using a formula that makescertain assumptions about (1) the expected growth in sales, (2) the operating profitmargin, (3) the incremental fixed capital investment rate, and (4) the incremental work-ing capital investment rate."' This method may be used, for example, when the ac-quiring corporation does not have access to the target's internal cash flow projections.Professor Rappaport states the formula as follows:
Cash Flow = (Cash In) - (Cash Out)= [(Sales in Prior Year)(1 + Sales Growth Rate)
(Operating Profit Margin)(l - Cash Income Tax Rate)]- [(Increase in Sales)(Incremental Fixed Capital Investment Rate)+ (Increase in Sales)(Incremental Working Capital Investment
Rate)]'6
The "Cash In" is determined by multiplying sales in the prior year by (1 + SalesGrowth Rate), producing the expected sales for the next year. This amount multipliedby the Operating Profit Margin produces the expected operating profit for the year. TheOperating Profit Margin is the ratio of pre-interest, pre-tax operating profit to sales.tBy focussing on pre-interest operating profit, the formula properly does not take interestexpense into account in computing free cash flow.
The expected operating profit includes allowances for depreciation, but deprecia-tion is eliminated from the formula as discussed below." The expected operatingprofit multiplied by (1 - Cash Income Tax Rate) gives the expected after-tax earningsfor the year, or "Cash In." The term (1 - Cash Income Tax Rate) gives the after-taxrate. For example, if the Cash Income Tax Rate is 34%, the after-tax rate is 66%. Theactual tax rate rather than the book rate is used.
The sum of the two Cash Out amounts are deducted from the expected after-taxearning (Cash In) to come up with free cash flow. The first deductible amount is theIncremental Fixed Capital Investment, which is estimated by multiplying the expectedIncrease in Sales for the year by the historical Incremental Fixed Capital InvestmentRate for the business. This represents the historical relationship between increase insales and increase in capital investment. Incremental Fixed Capital Investment takes intoaccount capital expenditures minus depreciation expense, thereby eliminating deprecia-
163. RAPPAPORT, supra note 6, at 51-55.164. Id.165. For example, if sales are $10 million and all expenses except interest and taxes are $8 million, the
operating profit is $2 million and the Operating Profit Margin is 20%.166. Expected Operating Profit = (Sales in Prior Year)(1 + Sales Growth Rate)(Operating Profit Margin).
[Spring

Modem Valuation Techniques in Mergers and Acquisitions
tion from the formula. The Incremental Fixed Capital Investment Rate is computed bydividing Incremental Fixed Capital Investment by Incremental Sales:
Incremental Fixed (Capital Expenditures) - (Depreciation Expense)Capital Investment Incremental SalesRate (%)
Incremental Fixed Capital InvestmentIncremental Sales
The second deductible amount is the Incremental Working Capital Investment,
which is estimated by multiplying the expected Increase in Sales for the year by the
historical Incremental Working Capital Investment Rate. This represents the historical
relationship between the Increase in Sales and the increase in working capital. The In-
cremental Working Capital Investment, which "represents the net investment in ac-
counts receivable, inventory, accounts payable and accruals that are required to support
sales growth,"' ' is expressed as a percentage of sales:
Incremental Working Incremental Working Capital InvestmentCapital Rate (%) Incremental Sales
Adjustments to this formula may be required for adding back amortization and othernoncash deductions.
Example (6). The above formula can be illustrated as follows. Assumethe following basic information concerning the target:
Sales in Prior Year: 10,000,000Sales Growth Rate: 10%Operating Profit Margin: 10%Cash Income Tax Rate: 40%Incremental Fixed CapitalInvestment Rate: 10%Incremental Working CapitalInvestment Rate: 5%
Historical data are used in estimating the target's Sales Growth Rate, Oper-ating Profit Margin, Incremental Fixed Capital Investment Rate, and Incre-mental Working Capital Investment Rate.
In computing expected Cash In for next year, the Sales in Prior Year of$10 million are multiplied by (1 + Sales Growth Rate), or 110%, to comeup with the expected sales in the next year, $11 million. This number is
167. RAPPAPORT, supra note 6, at 54.
19961
488 The Journal of Corporation Law [Spring
multiplied by the Operating Profit Margin of 10% to come up with the ex-pected operating profit for next year of $1.1 million. This amount is multi-plied by (1 - Cash Income Tax Rate of 40%), which produces an expectedCash In for next year of $660,000.
In computing expected Cash Out for next year, the expected Increase inSales for next year of $1 million is multiplied by the Incremental FixedCapital Investment Rate of 10% to get the expected increase in investmentof $100,000. This means that the target can be expected to make capital ex-penditures of $100,000 in excess of depreciation for the next year.
Next, in computing Cash Out, the $1 million expected Increase in Salesfor next year is multiplied by the Incremental Working Capital InvestmentRate of 5% to get an expected $50,000 increase in working capital for nextyear. This increase in working capital is needed to support the $1 millionincrease in sales. The expected increase in capital investment for next yearof $100,000 plus the expected increase in working capital for next year of$50,000 are added to equal an expected Cash Out for next year of $150,000.
Finally, the expected Cash Out of $150,000 is deducted from the ex-pected Cash In of $660,000 to equal an expected operating cash flow fornext year of $510,000. Amortization or other noncash deductions would beadded to this amount.
Professor Rappaport used this model with some variation in his valuation study inthe Technicolor case. The court describes his approach as follows:
Again a discounted cash flow analysis was used [by ProfessorRappaport's firm Alcar.] North Hollywood's net operating profit during theforecast period was estimated through a process informed by history andjudgment. First a base (1983) year forecast was established, and then as-sumptions about growth during the forecast period were made.
For his base forecast, Professor Rappaport adopted management's pro-jections for calendar year 1983 sales at North Hollywood. Alcar then as-sumed that the company would achieve a 19% operating profit margin dur-ing 1983. The 19% figure was based on historic margins at North Holly-wood. Alcar normalized the historic data in a responsible way to eliminatethe effect that abnormal silver reclamation profits had had upon NorthHollywood's profit margin during fiscal years 1980 and 1981. From thesales and profit margin figures, Alcar derived the costs and net operatingprofit projections for North Hollywood. For years 1984-1987, Alcar adjustedits sales estimate to account for the loss of United Artists as a client, andotherwise assumed flat (zero) growth. Sales were assumed to be constant byAlcar for reasons that on balance I find reasonable and operating profitswere estimated to remain at 19% throughout the forecast period."l
168. Cede & Co., 1990 WL 161084, at *14.

Modem Valuation Techniques in Mergers and Acquisitions
Wasserstein/Shearson also used a similar process in estimating Warner's Cash Inand Cash Out for 1991 through 1998." s In the discussion of the Wasserstein/Shearsonvaluation in the Joint Time and Warner Information Statement and Time Prospec-tus,17 it is explained that the cash flow projections for Warner were based on "certainestimated financial information for 1989 and 1990 provided to [Wasserstein/Shearson]by [Warner] and on extrapolations of such projections through 1998 performed by[Wasserstein/Shearson]."'
Weston et al., in Mergers, Acquisitions, and Corporate Control, criticize the mea-surement of profits under the Rappaport formula and demonstrate how the formula canbe restated in a more precise mathematical model.7 As a practical matter, if the prof-it margin adequately expresses profits for a firm, the Rappaport model is appropriateand understandable by those not heavily schooled in mathematics. For those who arecomfortable with mathematics, the Weston et al. model may be more appropriate.
I. Estimating Terminal Value
1. Introduction
The DCF model does not work unless there is either an estimate of the final salesor liquidation value of the target or an infinite series of periodic cash flows. 3 In mostcases involving a target, the parties estimate the cash available from the final disposi-tion of the target. This was the method used by both Lazard and Wasserstein/Shearsonin their valuation of Warner. 4 The terminal date is often chosen arbitrarily,"7 " andterminal (or residual or horizon) value is often the largest portion of the firm's val-ue. 76 Professor Rappaport points out that "for most businesses only a small proportionof value can be reasonably attributed to its estimated cash flow for the next five or tenyears.'
Brealey & Myers discuss two models and two rules of thumb for determining ter-minal value: 78 (1) the constant growth model,'79 (2) the competitive equilibrium
169. See infra Appendix C, at C-2 and Appendix A, at A-4.170. See infra Appendix A, at A-4.171. Id.172. WESTON Er AL, MERGERS, supra note 2, at 159-61; see also infra part VJ (discussing the mathe-
matical models in WESTON El" AL, MERGERS).173. See imfra part V.J (discussing formulas that can be used in the DCF model when there is an infinite
series of cash flows).174. See infra Appendix C, at C-3 (Wasserstein/Shearson); Appendix D, at D-4 (Lazard).175. BRAi.EY & MYERS, supra note 6, at 64.176. See infra Appendix C, at C-3 (showing that under all assumptions, the present value of the terminal
value exceeds the present value of the free cash flows).177. RAPPAPORT, supra note 6, at 59; see also Kleinwort Benson LTD. v. Silgon Corp., 1995 WL
376911, at *7-8 (Del. Ch. 1995) (discussing terminal value); Edward L Mcrris, Why Acquirers May Need toRethink Terminal Value, 29 MERGERS AND ACQUISTIONS 24 (1994).
178. BREALEY & MYERS, supra note 6, at 64-67.179. See infra part V.1.2.
1996]

The Journal of Corporation Law
model," (3) the price/earnings rule of thumb,' and (4) the market/book rule ofthumb."
Brealey and Myers state that "[a] rule of thumb, artfully employed, sometimesbeats a complex discounted cash flow calculation hands down,"" acknowledging theimperfections in the DCF process. After a discussion of the above techniques,"" thisArticle discusses the multiple of cash flow technique." Finally, this Article discussesthe use of mathematical formulas for measuring an infinite series of free cashflows."
None of the methods for estimating terminal value involves an explicit estimate ofterminal free cash flow. Thus, one may ask why the methods for estimating terminalvalue are not used in the current time period to determine the present value of the tar-get. In the words of Professor Cornell, "Why not define the current time to be the ter-minal date and value the firm today using whatever procedure is employed to estimatethe continuing value? Such a simplification would eliminate both the need to forecastcash flows and the need to calculate present values.' ' v Professor Cornell explains that"simplified procedures are applicable only when the firm has reached an 'equilibriumstate' and is no longer evolving rapidly."" Professor Cornell then adds the followingimportant insight: "By postponing the date at which the simplified models are applied,the impact of errors produced by these models is mitigated by the discounting pro-cess.""8
9
As will be seen below, the different models for estimating terminal value can pro-duce dramatically different results. On this point Professor Cornell states:
Given the strengths and weaknesses of each procedure, it is wise to usemore than one model to calculate the continuing value. If the different mod-els produce similar continuing values, confidence in the estimate rises. If thedifferent models produce different values, further research is suggested toreconcile the discrepancies."9
2. Estimating Terminal Value Through the Constant Growth Model
The constant growth formula first requires an estimate of the free cash flow for thefirst year in which the target is likely to settle into a long-run growth rate. This requiresan estimate of the point at which the target can be expected to grow at a constant
180. See infra part V.I3.181. See infra part V.I.4.182. See infra part V.1.5.183. BREALEY & MYERS, supra note 6, at 66.184. See infra parts V.1.2-6.185. See infra part V.1.7. This technique was utilized by both Lazard and Wasserstein/Shearson in their
valuation of Warner.186. See infra part V.J.187. CORNELL, CORPoRATE VALUATION, supra note 6, at 144.188. Id.189. Id.190. Id. at 168
[Spring

Modem Valuation Techniques in Mergers and Acquisitions
rate.' The second element in the formula is an estimate of the rate of long-termgrowth of free cash flow. The terminal value is then determined pursuant to the follow-ing formula:
(FCF)(r)- (g)
For this formula to work, the discount rate must exceed the long-term growth rate. Thisformula is similar to the constant-dividend growth valuation model often used by ana-lysts in valuing marketable securities." In that model, the numerator is the expecteddividend, and the denominator is the cost of equity capital minus the dividend growthrate.
The constant growth model is illustrated as follows:
Example (7). Acquiring corporation estimates that five years after the acqui-sition of the target corporation (TC), TC's inflation-adjusted free cash flowwill settle into a long-term growth pattern at an expected growth rate of 5%.The estimated free cash flow for year five is $1 million. Thus, in year six,for example, free cash flow is expected to be $1,050,000 (i.e., $1 million x1.05). The required discount rate is 15%. The estimated terminal value (TV)of TC at the end of year five, therefore, is $10 million computed as follows:
Free Cash Flow in Year 5(Required Discount Rate) - (Rate of Long-Term Growth)
$1,000,000.15-.05
1,000,000 = $10,000,000.10
The denominator of .10 is the equivalent of a price/earning multiple of ten,that is $1 million/.10 is the same as 10 times $1 million. The .10 is some-times referred to as the capitalization rate, the rate used in determining the
191. BREALEY & MYERS, supra note 6, at 64.192. INVESTMENTS, supra note 6, at 474-77.
19961

The Journal of Corporation Law
capital value of the income stream produced by an investment. The presentvalue of this $10 million terminal value is computed as follows:93
(I + r)" (TVm)
1
(I + .15) 5 ($10,000,000)
.497 x $10 million = $4,970,000
This process involves two discounting steps. First, the free cash flows for the ter-minal year are discounted at a rate equal to the cost of capital minus the growth rate todetermine the terminal value. Second, the terminal value is discounted at the cost ofcapital to arrive at the present value of the terminal value.
This constant growth model for estimating terminal value was utilized by theplaintiffs valuation expert and accepted by the Delaware Chancery Court in RadiologyAssociates.' The court accepted this method without discussing the advisability ofusing other methods for determining terminal value.
3. Estimating Terminal Value Through the Competitive Equilibrium Model
The competitive equilibrium model requires a determination of when the "industryis likely to settle into competitive equilibrium," that is, when competitors catch up andeveryone is on an equal footing.'95 At that point the net present value of new growthopportunities is zero. The terminal value at this point is determined by the followingformula:
19
T Free Cash Flow for the Next Period After Termination Date (FCF)Required Discount Rate (r)
This model is similar to the constant growth model. The model says that the terminalvalue in year five is equal to the capitalized value of the free cash flows for yearsix." The denominator, however, is the required discount rate rather than the discountrate minus the growth rate that applies in the constant growth model.'" This model isillustrated as follows:
193. See supra part III.A (providing the discount factor).194. Radiology Associates, Inc. Litigation, No. 9001, 1991 Del. Ch. LEXIS, at 175 (Del. Ch. Oct. 19,
1990).195. BREALEY & MYERS, supra note 6, at 66.196. The numerator of the formula can also be the expected earnings for the next period after the termi-
nation date.197. BREAL.Y & MYERS, supra note 6, at 66.198. Under this competitive equilibrium model, any growth in FCF comes from retained FCFs from prior
periods and this growth is expected to equal the required discount rate (r). Since the capital base for futureperiods grows from retained FCFs, this growth in FCFs can be ignored in computing the terminal value underthe competitive equilibrium formula. Cf., RAPPAPORT, supra note 6, at 61 (elaborating on this point).
[spring

Modem Valuation Techniques in Mergers and Acquisitions
Example (8). Assume that in Example (7) the estimate of earnings foryear six is $1,050,000. This is the year after the year in which the industryis expected to settle into competitive equilibrium. The discount rate is still15%. The TV for year five is therefore $7 million computed as follows:
= FCF for the Next Period After Termination Dater
TV = $1 ,0 5 0 ,000.15
TV = $7,000,000
The present value of this $7 million terminal value is computed as fol-lows: "
(I + r(
1(1 +. 15)5($7,000,000)
(.497)($7,000,000) = $3,479,000
This process also involves two discounting steps. First, the free cash flows for theperiod after the termination date are discounted at the cost of capital to determine theterminal value. Second, the terminal value is discounted at the cost of capital to deter-mine the present value of the terminal value.
Professor Rappaport states that the competitive equilibrium model, which he refersto as the perpetuity method, is generally the best method to use in estimating terminalvalue:
The perpetuity method for estimating residual value is based on...competitive dynamics. It is essentially based on the assumption that a com-pany that is able to generate returns above the cost of capital (i.e., achieveexcess returns) will eventually attract competitors, whose entry into thebusiness will drive returns down to the minimum acceptable or cost of capi-tal rate. Specifically, the perpetuity method assumes that after the forecastperiod, the business will earn, on average, the cost of capital on new invest-ments. Another way of expressing this idea is to say that after the forecastperiod, the business will invest, on average, in strategies whose net presentvalue is zero.
Once the rate of return has been driven down to the cost of capital rate,period-by-period differences in future cash flows do not alter the value ofthe business. Therefore, these future flows can be treated as if they were a
199. See supra part III.A (providing the discount factor).
1996]

The Journal of Corporation Law
'perpetuity' or an infinite stream of identical cash flows.2"
There are several differences between the constant growth model and the competi-tive equilibrium model. The numerator in the constant growth model is the FCF for theterminal year, whereas the numerator in the competitive equilibrium model is the FCFfor the year after the terminal year.2"' Thus, the numerator in the competitive equilib-rium model is larger. The denominator in the constant growth model is the cost of capi-tal minus the growth rate, whereas the denominator in the competitive equilibrium mod-el is the cost of capital. Thus, the denominator in the competitive equilibrium model islarger.
In most cases, the competitive equilibrium model will produce a smaller terminalvalue than the constant growth model. This smaller terminal value results because thevalue-depressing effect of the larger denominator in the competitive equilibrium modelis likely to more than offset the value-increasing effect of the larger numerator in thismodel. This can be seen by comparing Examples (7) and (8). In Example (7), whichillustrates the constant growth model, the FCF for the terminal year is $1,000,000. InExample (8), which illustrates the competitive equilibrium model, the FCF for the yearafter the terminal year is $1,050,000, $50,000 larger than that in the constant growthmodel. The denominator in the constant growth model is 10%, which equals the cost ofcapital of 15% minus the growth rate of 5%. The denominator in the competitive equi-librium model is 15%, the cost of capital. Thus, the denominator for the competitiveequilibrium model is also larger.
The terminal value determined by the constant growth model is $10 million,whereas the terminal value determined by the competitive equilibrium model is only $7million. Thus, the value-depressing effect of the larger denominator in the competitiveequilibrium model significantly offsets the value-increasing effect of the larger numera-tor in that model. For the competitive equilibrium model to produce the same $10 mil-lion estimate of terminal value predicted by the constant growth model, the FCF for theyear after the terminal year would have to be $15 million. This is 50% more than theFCF for the terminal year, an unrealistic assumption. The point is that the estimate ofterminal value can vary significantly under the constant growth model and the competi-tive equilibrium model. In virtually every case, the constant growth model will producea higher terminal value because there is an expected growth in the free cash flows. Thisexpected growth adds value.
The difference in the results from the constant growth model and the competitiveequilibrium model was also illustrated in the Technicolor case.2 The court explainedthat Professor Rappaport, the expert for Technicolor, used the competitive equilibriummodel. Mr. Torkelsen, the expert for the plaintiff shareholders, used the constant growthmodel:
To establish residual value Rappaport capitalizes a constant (last fore-casted year) cash flow; he assumes no new value creation beyond the fore-cast period (but nevertheless much of his total value is attributed to the
200. RAPPAPORT, supra note 6, at 60-61.201. The terminal year is the year the industry is projected to settle into competitive equilibrium202. No. CIV.A. 7129, 1990 WL 161084 (Del. CI. Oct. 19, 1990).
[Spring

Modem Valuation Techniques in Mergers and Acquisitions
residual value). In creating his estimation of residual value Torkelsen, onthe other hand, increases the last forecasted year's net cash flows by 5%each year (for inflation) into infinity, before capitalizing those flows. Theresult--and this is the practical gist of this theoretical difference betweenthe experts-is that Mr. Torkelsen assumes that Technicolor net profits(along with all other aspects of its cash flow) and its value will increaseevery year in perpetuity, while Professor Rappaport assumes there willcome a time when, while it may make profits, Technicolor will not be in-creasing in value."
The court explained the theory behind Professor Rappaport's approach as follows:
The most basic conceptual difference in the two DCF models used isthis: Professor Rappaport assumes (and Mr. Torkelsen does not) that forevery company its particular set of comparative advantages establish, as ofany moment, a future period of same [sic] greater or lesser length duringwhich it will be able to earn rates of return that exceed its cost of capital.Beyond that point, the company (as of the present moment of valuation) canexpect to earn no returns in excess of its cost of capital and therefore, be-yond that point, no additional shareholder value will be created. ProfessorRappaport calls this period during which a company's net returns can bepredicted to exceed its costs of capital, the company's "value growth dura-tion," which is a coined term .... It is an application of elementary notionsof neoclassical economics: profits above the cost of capital in an industrywill attract competitors, who will over some time period drive returns downto the point at which returns equal the cost of capital. At that equilibriumpoint no new competition will be attracted into the field. The leading fi-nance text includes a reference to this concept of a future period beyondwhich there is no further value created. (citation omitted). The existence ofsuch a point in time does not mean that there is no value attributed to theperiod beyond that point, but rather that there is no further valuegrowth.2w
The court "accept[ed] as sound (as a 'technique... generally considered acceptable inthe financial community,' Weinberger, 457 A.2d at 713) the methodology of ProfessorRappaport.
' ' 0
4. Estimating Terminal Value by Reference to Price/Earning Ratios
The first rule of thumb suggested by Brealey and Myers is to look to theprice/earnings ratio of companies "whose scale, risk, and growth prospects today rough-ly match those projected [for the target in the year of termination]." Once the com-parable price/earnings ratio is determined, that ratio is applied to the expected earnings
203. Id. at *34-35.204. Id. at *34.205. Id.206. BRsgY & MYERs, supra note 6, at 65.
19961

496 The Journal of Corporation Law [Spring
of the target for the terminal year to determine the estimated terminal value. This meth-od is illustrated as follows:
Example (9). Assume that in Example (7) the terminal date is at the end ofthe fifth year, target's expected earnings (not free cash flow) for year fiveare $1.1 million, and the price/earnings ratio of comparable companies isten. As a consequence, the estimated terminal value of the target at the endof year five is $11 million, computed as follows:
10 x $1.1 million = $11 million
The present value of this $11 million terminal value is computed as follows:
(1 + r)" (TV,,)
(1 + .15)1 ($11,000,000)
(.497)($11,000,000) = $5,467,000
Professor Rappaport points out several problems with the use of price/earningsratios. Rappaport states that it is inherently inconsistent to commingle cash flows duringthe forecast period with the accounting concept of earnings for the post-forecast peri-od.2" He further points out that the price/earnings approach does not "take into ac-count whether the business can be expected to invest at, below, or above the cost ofcapital in the post-forecast period." ' Finally, he points out that there are "no reliablemodels for accurately forecasting future price/earnings ratios."' The price/earningsmethod is one of the elements used in the comparable companies technique for valuinga target on the basis of present (not future) comparable companies. This can be seen,for example, in Wasserstein/Shearson's valuation of Warner."'
5. Estimating Terminal Value by Reference to Market/Book Ratios
The second rule of thumb discussed by Brealey and Myers is to use the mar-ket/book ratio, which is the ratio of stock price to book value per share. This methodinvolves determining the market/book ratios of companies that are comparable today tothe target's expected composition on the termination date. That ratio is then applied tothe target's expected book value on the termination date. This method is illustrated asfollows:
Example (10). Assume that in Example (7) the terminal date is at the end of
207. RAPPAPORT, supra note 6, at 63.208. Id.209. Id.210. See infra Appendix C, at C-5.

Modern Valuation Techniques in Mergers and Acquisitions
the fifth year, the target's expected book value is $5 million, and the marketbook ratio of comparable companies is 2. In such a case the expected termi-nal value of the target is $10 million (i.e., 2 times $5 million of book val-ue). The present value of this $10 million terminal value is computed asfollows: I1____
(1 + r)" (TV,)
(1 + .15) ($10,000,000)
(.497)($10,000,000) = $4,970,000Professor Rappaport points out that conceptual problems with the price/earnings methodalso exist with the market/book method.2" This market/book method is one of the ele-ments used in applying the comparable companies technique of valuing a target on thebasis of present comparable companies.212
6. Summary of the Results Under the Four Methods
The following is a summary of the estimated terminal values and the present valueof the terminal values under each of the four methods of determining the terminal val-ue:
Method Terminal Value Present Value ofTerminal Value
Constant Growth Model $10,000,000 $4,970,000Competitive Equilibrium Model S 7,000,000 $3,479000Price/Earnings Rule of Thumb $11,000,000 $5,467,000Market/Book Rule of Thumb $10,000,000 $4,970,000
Brealey and Myers explain that although there is no best method for determiningterminal value, the most weight should generally be put on the competitive equilibriummethod, which sets the terminal date at the point at which positive net present valuedisappears.2" They also state that the competitive equilibrium method "forces manag-ers to remember that sooner or later competition catches up," and it is not unusual forthe various methods to produce a broad range of estimates of terminal value. 4 Insummary, they explain, "[d]iscounted cash flow formulas only estimate market value,and the estimates change as forecasts and assumptions change. Managers cannot knowmarket value until an actual transaction takes place.""
211. RAPPAPoRT, supra note 6, at 63-64.212. See infra Appendix C, at C-5.213. BREALaY & MYlts, supra note 6, at 67.214. Id.215. Id.
1996]
498 The Journal of Corporation Law [Spring
7. Estimating Terminal Value in Time-Warner Acquisition: Multiple of Cash FlowMethod
Both Lazard, in its opinion to the Warner board, and Wasserstein/ Shearson, intheir opinion to the Time board, estimated the terminal value of Warner by multiplyingthe expected cash flow for the terminal period by a factor presumably representing alikely multiple of cash flows for comparable companies. In its presentation to Warner'sboard, Lazard used multiples of nine, ten, and eleven times estimated cash flows pre-dicting a range of terminal values for Warner." 6 Lazard, in valuing Warner's variousbusiness segments, used different multiples for each segment. In their presentation toTime's board, Wasserstein/Shearson used multiples of ten, eleven, twelve, and thirteenin estimating the terminal value of Warner's film entertainment segment."
J. Use of Formulas for Measuring an Infinite Series of Free Cash Flows
Weston et al. provide formulas for measuring and discounting an expected infiniteseries of free cash flows."" This method requires neither a projection of free cashflows for a horizon period nor the estimation of a terminal value. Rather, it only re-quires a determination of the free cash flows for either the present year or for both thepresent year and the next year.
They also provide formulas for each of the following assumptions about the growthof free cash flows: (1) the no growth case,21' (2) the constant growth case,2 ' (3) thesupernormal growth followed by no growth case,22' and (4) the supernormal growthfollowed by constant growth case.2"
The formula for the no growth case is similar to the formula used above for deter-mining the terminal value under the competitive equilibrium model.' Under thismethod the present value of an investment that expects no growth in free cash flows isdetermined by the following formula:
Free Cash Flow for Current Period (FCF)Cost of Capital (r)
The formula for the Weston constant growth case is similar to the formula used previ-ously in computing the terminal value under the constant growth case. 2
' The formulasfor supernormal growth followed by either no growth or constant growth are beyond thescope of this article.
216. See infra Appendix D, at D-4.217. See infra Appendix C, at C-3.218. WESTON Er AL., MERGERS, supra note 2, at 132-63.219. Id. at 146.220. Id. at 147.221. Id.222. Id. at 148.223. See supra part V.1.3 (explaining the use of the competitive equilibrium model).224. See supra part V.1.2 (discussing the constant growth model).

Modem Valuation Techniques in Mergers and Acquisitions
K. Sensitivity Analysis
Uncertainty is inherent in the preparation of a cash flow forecast. Therefore, thereis uncertainty in computing a single NPV of a project. As Professor Shapiro explains:
"Often ... [the] single [NPV] number hides a great deal of informa-tion about the riskiness of the proposed project: Because the future is un-knowable, it is evident that today's estimates of future project prices, costs,and volumes are going to be wrong. It is natural, therefore, for decisionmakers to want to study, in advance, how potential estimation errors willaffect the project NPV."'
The effect of potential estimation errors may be analyzed through sensitivity analy-sis. This can involve the preparation of cash flow forecasts on the basis of three possi-ble outcomes: (1) expected, (2) pessimistic, and (3) optimistic.226 Each outcome couldbe prepared on the basis of different variables in the cash flow projections, such as size,market share, variable costs, sales growth, etc.2" For example, a range of NPVs for aproject could be determined by setting each variable at its pessimistic, expected, andoptimistic value, while holding all other variables equal to their expected values.2
The following matrix illustrates the projected NPV ranges for various cash flow projec-tions that are determined on the basis of assumptions about market share, variable costand sales growth.
Cash Flow Range NPV Range
Variable Pessimistic Expected Optimistic Pessimistic Expected Optimistic
(I)Market $9 million $10 million $11 million $10 million $25 million $50 millionShare
(2)Variable Cost $3.5 million $2.5 million $2 million ($2 million) $15 million $20 million
(3)Sales Growth 8% 10% 12% ($10 million) $25 million $60 million
Also, a possible range of NPVs can be determined on the basis of a sensitivityanalysis that relates a range of assumptions concerning one or more cash flow variables,such as sales growth, to a range of possible costs of capital. The following matrix dem-onstrates such a sensitivity analysis.2"
225. SHAPIRo, supra note 6, at 250.226. BREALEY & MYERS, supra note 6, at 216-18.227. Id. at 217.228. Id.229. The matrix is based on RAPPAPORT, supra note 6, at 236-37.
1996]

The Journal of Corporation Law
Range of Cost Sales Growthof Capital
Pessimistic Expected Optimistic
Lower - 12% $1 Million NPV $40 Million NPV $90 Million NPV
Expected - 13% ($10 Million) NPV $25 Million NPV $60 Million NPV
Higher - 14% ($19 Million) NPV $5 Million NPV $30 Million NPV
The expected NPV is $25 million when the cash flows are determined using theexpected sales growth and the cash flows are discounted at the expected cost of capitalof 13%. A similar matrix can be developed that relates a range of assumptions concern-ing two different cash flow variables.
This type of sensitivity analysis was used by both Wasserstein/Shearson andLazard in valuing Warner. Wasserstein/Shearson used three different discount rates andfour different estimates of terminal value in valuing Warner's film entertainment busi-ness.' Lazard used five different discount rates and three different estimates of termi-nal value in determining the present value of Warner's consolidated unleveraged freecash flow! 3
L. Summary
Part V has focused on the numerator in the DCF model for computing the netpresent value (NPV) of a project-the determination of both the periodic and terminalfree cash flows (FCF):
NPV = Initial Cost (IC) + FCF,(1 + r)"
The primary reason for an overstatement of NPV is an over-optimistic FCF projec-tion.232 Acquiring firms should avoid the "winner's curse" by ensuring that their FCFprojections are based on realistic assumptions and that a positive NPV reflects real eco-nomic rents. This Article now addresses the denominator in the NPV formula--thecomputation of the cost of capital (r).
230. See infra Appendix C, at C-3.231. See infra Appendix D, at D-4.232. See supra part III.E.2 (discussing the difficulty of realizing economic rents).
[Spring

Modem Valuation Techniques in Mergers and Acquisitions
VI. USE OF THE CAPITAL ASSET PRICING MODEL (CAPM) IN DETERMINING THEAPPROPRIATE DISCOUNT RATE
A. Introduction
The discount rate (r) in the NPV formula is the cost of capital, the minimum rateof return necessary to induce an acquiring firm to acquire the target. It is the rate atwhich the free cash flows and terminal value of an acquisition candidate are discountedto present value. This part examines the capital asset pricing model (CAPM), whichprovides a method for determining the discount rate. There are two other methods fordetermining the discount rate: the arbitrage pricing theory (APT) 3 and the weightedaverage cost of capital (WACC) M
This Article will separate the financing decision from the investment decision anduse CAPM to determine the discount rate (cost of capital) on the basis of the assump-tion of all-equity financing. Under this method, the benefits or costs associated with thefinancing decision are separately determined and discounted to present value at the costof capital. A similar approach is used with APT.'
WACC provides a method for determining the cost of a firm's debt and equityfinancing. In determining the discount rate, WACC directly takes into account the fi-nancing decision and, therefore, the impact of the interest deduction on the debt. Thus,under WACC, the benefit of the interest deduction is not separately determined and dis-counted, but rather is reflected in a lower cost of capital. In using WACC to determinethe cost of capital, as when using CAPM or APT, the cash flows are projected on thebasis of an all-equity financing.
Copeland et al. recommend the use of either CAPM or APT for determining thecost of equity capital used in WACC." Thus, CAPM and APT have a role even inthe use of WACC. Copeland et al. further state that although both the CAPM and APTapproaches have problems "associated with their application ... , [both] are theoretical-ly correct; they are risk adjusted and account for inflation."'2 They also assert thatother methods for determining the cost of equity, such as the dividend yield model andthe earnings to price ratio model, are "conceptually flawed.1M
Both CAPM and APT are based on the Efficient Capital Markets Hypothesis. 9
This hypothesis, which this Article only outlines, posits that if investors have easy ac-cess to information about a security, the price of that security will properly reflect thatinformation.' Consequently, "[ijf capital markets are efficient, then purchase or saleof any security at the prevailing market price is never a positive NPV transac-
233. See infra part VII (briefly introducing APT).234. See infra part IX (discussing the use of WACC).235. See also infra part VIII (discussing the interaction between the investment and financing decisions).236. COPELAND Er AL, VALUATION, supra note 6, at 192.237. Id.238. ld.239. See, e.g., Fama, Efficient Capital Markets II, supra note 17, at 1589-99 (discussing APT's market
efficiency theory basis).240. BsA n Y & MYERs, supra note 6, at 290.
1996]

The Journal of Corporation Law
tion," 241-the price of the security will equal the present value of the expected cashflows discounted at the appropriate cost of capital. As Brealey and Myers explain, "thecapital asset pricing model boils down to the statement that the market portfolio (i.e., aportfolio of all stocks) is efficient." '242 Thus, the purchase of the market portfoliowould not create a positive NPV.
To understand the principles behind CAPM243 it is first necessary to consider theconcepts of (1) systematic and unsystematic risk,2" (2) the measure of market risk(beta),24 and (3) the market risk premium.2 6 Professors Fama and French have re-cently criticized CAPM, and others have come to the defense of CAPM.2
CAPM gives the rate of return (r) for a particular investment by a formula thattakes into account the following variables: (1) the risk-free rate of return (rf), (2) themarket risk premium (r-rf),24 and (3) the beta (3) of the investment.'" The formulais as follows:'
r = rf = B (rm - rt)
This CAPM formula posits that the required rate of return for an investment isequal to the risk-free rate plus an additional amount equal to the beta for the investmentmultiplied by the market risk premium. The cost of capital determined under CAPMlooks to the returns available to investors in the capital markets on other investmentswith similar risk patterns.25
B. Systematic and Unsystematic Risk
There are two types of risk inherent in investments: systematic risk and unsystem-atic risk. Risk in either context means that future returns are uncertain. 2 Systematicrisk is a function of broad macroeconomic conditions that affect the prices of all as-sets.' Thus, there is systematic risk in holding any asset. Conversely, unsystematicrisk is a function of the characteristics associated with a particular asset as opposed to
241. Id. at 289.242. Id. at 164.243. See infra part VI.E (introducing CAPM).244. See infra part VI.B (discussing systematic and unsystematic risk).245. See infra part VI.C (discussing beta).246. See infra part VI.D (discussing risk-free rate and market risk premium).247. See infra part VLG (discussing the Fama and French critique of CAPM and the responses).248. The market risk premium is the difference between the expected return on the market (r.) and the
risk-free rate (r).249. See infra part VLE (explaining CAPM more fully).250. BRBA.EY & MYERS, supra note 6, at 190-97.251. SHAPIRO, supra note 6, at 276; see Jeffrey N. Gordon & Lewis A. Kornhauser, Efficient Markets,
Costly Information and Securities Research, 60 N.Y.U. L REv. 761, 775-86 (1985) (discussing much of theliterature dealing with CAPM, including some of the critiques of the concept) [hereinafter Gordon &Kornhauser, Efficient Markets].
252. BREALEY & MYERS, supra note 6, at 149; see also GILSON & BLACK, LAW AND FiNANCE, supranote 6, at 81-100.
253. BREAIEY & MYERS, supra note 6, at 137.
[Spring

Modem Valuation Techniques in Mergers and Acquisitions
broad market factors. For example, risk factors such as the rate of growth of GNPor interest rate levels "systematically affect all firms in the economy to a greater orlesser extent."2 5 Comparatively, risk factors such as possible changes in consumertastes, new product developments, and changes in prices of raw materials affect particu-lar firms and, therefore, are referred to as unsystematic risks.25
Diversification can reduce or eliminate unsystematic risk by balancing the losingstocks with winning stocks; such risk is often referred to as diversifiable risk, uniquerisk, residual risk, or specific risk.2 s The specific risk of holding stock in a particularcompany can be diversified away by investing in stocks of other companies, possibly inother industries. Diversification cannot eliminate systematic risk, however. Systematicrisk is often referred to as undiversifiable risk or market risk.258 Since market risk re-sults from broad macroeconomic factors threatening most businesses, stocks have atendency to move in the same direction. 9
Brealey and Myers elaborate on the concepts of unique (or unsystematic) risk andmarket (or systematic) risk:
If you only have a single stock, unique risk is very important, but onceyou have a portfolio of 20 or more stocks, diversification has done the bulkof its work. For a reasonably well-diversified portfolio, only market riskmatters. Therefore, the predominant source of uncertainty for a diversifiedinvestor is that the market will rise or plummet, carrying the investor'sportfolio with it.260
The following graph illustrates total risk as a function of both systematic and unsystem-atic risk and the reduction of unsystematic risk through diversification. 6'
GRAPH A
unsystematic risk toarik..
systematic risk
1 5 10 15 20
254. Id.255. GILSON & BLACK, LAW AND FINANCE, supra note 6, at 108.256. Id. at 107.257. See BREALEY & MYERS, supra note 6, at 137.258. Id.259. Id. at 139.260. Id.261. Id.; see also GILSON & BLACK, LAW AND FINANCE, supra note 6, at 89-93.
1996]

The Journal of Corporation Law
This graph illustrates that the greater the diversification (represented on the hori-zontal axis), the less the total risk (measured on the vertical axis). Unsystematic risk isreduced by diversification; systematic risk is not. Diversification reduces unsystematicrisk because the prices of different stocks move differently, the price movements areless than perfectly correlated, and the decline in the prices of some stocks are offset byincreases in the prices of others."6 Brealey and Myers explain that "[w]ith more secu-rities, and therefore better diversification, portfolio risk declines until all unique risk iseliminated and only the bedrock of market risk remains." 263
C. Beta: The Measure of Market Risk
1. Introduction
Beta is the measure of the sensitivity of a security's return to market move-ments.' Thus, it is a measure of the systematic risk of a security.'" Beta indicateswhat the likely move for the particular stock will be considering a given move in themarket-how sensitive a particular stock is to a move in the market. For a stock with abeta of one, a 10% market rise would, on average, lead to a 10% rise in the price of thestock. For a stock with a beta of 1.5, a market rise of 10% would lead on average to a15% rise in the price of the stock. Thus, beta "measures the marginal contribution of astock to the risk of the market portfolio." ' Beta also "gauges the tendency of the re-turn on a security to move in parallel with the return of the stock market as awhole."26
The beta for a particular stock is calculated by running a linear regression betweenpast returns for that stock and past returns of a market index, such as the Standard andPoor's 500.'" Betas are generally computed on the basis of past data (i.e., ex post).Techniques exist, however, for estimating ex ante, or future, betas.2"
2. Statistical Derivation of Beta
Beta for a particular stock is determined by dividing (1) the covariance betweenreturns on the particular stock, and returns on the market portfolio; by (2) the varianceof the market portfolio." The variance of the market portfolio indicates the potentialfor deviation of the market's return from the market's expected return."'1 Themarket's expected return (i.e., the mean or average return) is the profit expected from
262. BREALEY & MYERs, supra note 6, at 137.263. Id. at 144.264. Id. at 143.265. SHAPIRO, supra note 6, at 118; see also GILSON & BLACK, LAW AND FINANCE, supra note 6, at 94-
98.266. BREALEY & MYERs, supra note 6, at 163.267. David W. Mullins, Jr., Does the Capital Asset Pricing Model Work?, HARv. Bus. REv. Jan.-Feb.
1982, at 105, 108 [hereinafter Does CAPM Work?].268. RAPPAPORT, supra note 6, at 58.269. Id. at 58-59.270. COPELAND & WESTON, supra note 6, at 198.271. HAUGEN, supra note 6, at 44.
[Spring

Modem Valuation Techniques in Mergers and Acquisitions
the market as a rate of return for a specified period. 2
The computation of the market's expected return can be illustrated as follows:
The probability of the outcome is determined by analyzing historical data concerningthe market's possible returns and the frequency of those returns.'" In summary, theexpected return is the weighted average return, found by multiplying each possiblereturn by the corresponding probability and summing the results.
In computing variance, the market's expected return is subtracted from themarket's actual return for a particular period or periods?' The resulting amount isthen squared, and this amount is then multiplied by the probability of such occurrenceto get the variance. The formula can be written as follows:S
Variance (rm) =[Actual Rate ofI Return for[Particular Period (r)
(Probability ofI Realizing thetActual Rate
272. Id.273. BREALEY & MYERs, supra note 6, at 132-33.274. Id.275. Id.
Market's Possible Returns Frequency Probability of Outcome Expected Return
[c] x [a]
15% 40 40% 6%
10% 20 20% 2%
0% 40 40% 0%
100 8% Expected Return
ExpectedMarketReturn (r)
19961
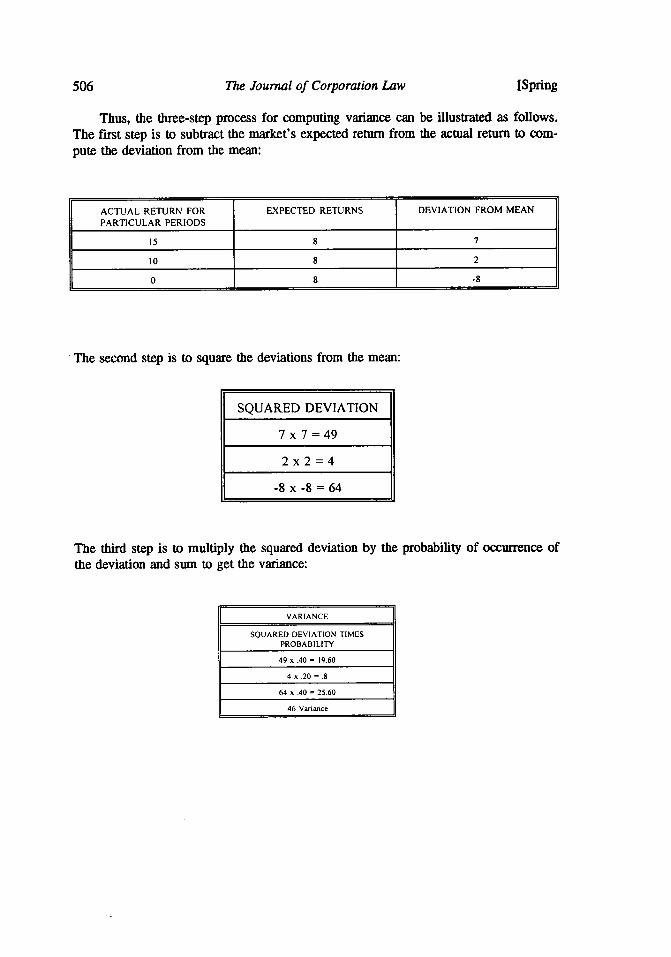
The Journal of Corporation Law [Spring
Thus, the three-step process for computing variance can be illustrated as follows.The first step is to subtract the market's expected return from the actual return to com-pute the deviation from the mean:
ACTUAL RETURN FOR EXPECTED RETURNS DEVIATION FROM MEANPARTICULAR PERIODS
15 8 7
10 8 2
0 8 -8
The second step is to square the deviations from the mean:
The third step is to multiply the squared deviationthe deviation and sum to get the variance:
VARIANCE
SQUARED DEVIATION TIMESPROBABILITY
49 x .40 = 19.60
4 x .20 = .8
64 x .40 = 25.60
46 Variance
by the probability of occurrence of
SQUARED DEVIATION
7 x 7 =49
2x2=4
-8 x -8 - 64
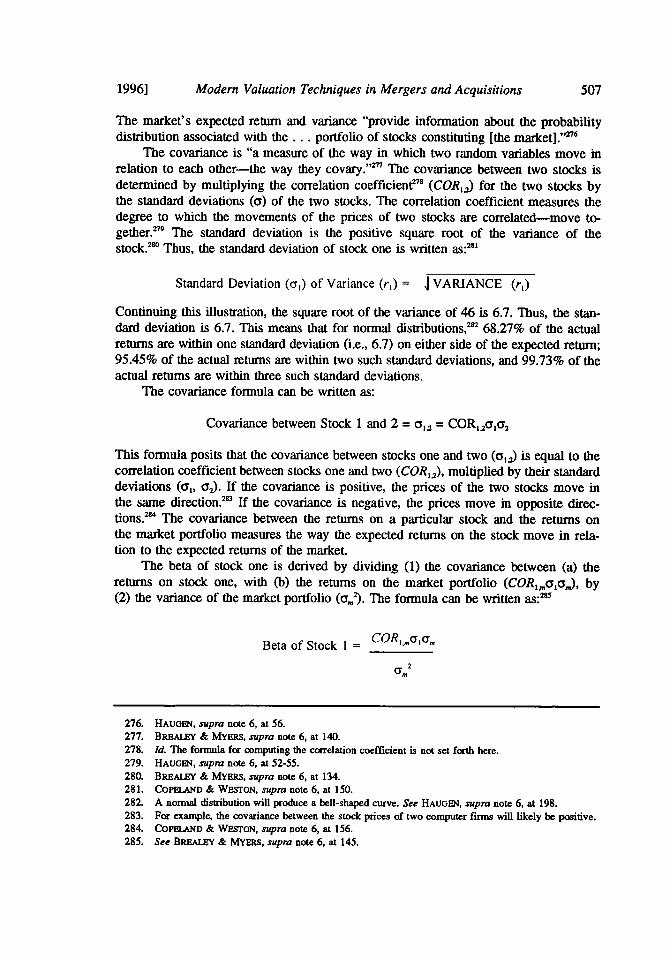
Modem Valuation Techniques in Mergers and Acquisitions
The market's expected return and variance "provide information about the probabilitydistribution associated with the ... portfolio of stocks constituting [the market]." 276
The covariance is "a measure of the way in which two random variables move inrelation to each other-the way they covary."t ' The covariance between two stocks isdetermined by multiplying the correlation coefficient 78 (CORr,) for the two stocks bythe standard deviations (a) of the two stocks. The correlation coefficient measures thedegree to which the movements of the prices of two stocks are correlated-move to-getherY9 The standard deviation is the positive square root of the variance of thestock.2' Thus, the standard deviation of stock one is written as:2"'
Standard Deviation (as) of Variance (r,) = I VARIANCE (rl)
Continuing this illustration, the square root of the variance of 46 is 6.7. Thus, the stan-dard deviation is 6.7. This means that for normal distributions,2" 68.27% of the actualreturns are within one standard deviation (i.e., 6.7) on either side of the expected return;95.45% of the actual returns are within two such standard deviations, and 99.73% of theactual returns are within three such standard deviations.
The covariance formula can be written as:
Covariance between Stock 1 and 2 = a, 2 = CORyoo 2
This formula posits that the covariance between stocks one and two (au) is equal to thecorrelation coefficient between stocks one and two (COR,,), multiplied by their standarddeviations (as, 02). If the covariance is positive, the prices of the two stocks move inthe same direction." If the covariance is negative, the prices move in opposite direc-tions.2" The covariance between the returns on a particular stock and the returns onthe market portfolio measures the way the expected returns on the stock move in rela-tion to the expected returns of the market.
The beta of stock one is derived by dividing (1) the covariance between (a) thereturns on stock one, with (b) the returns on the market portfolio (COR,,oo,j, by(2) the variance of the market portfolio (a,). The formula can be written as:21
Beta of Stock 1 = COR,,ao(m,
CF.2
276. HAUGEN, supra note 6, at 56.277. BRAtEY & MYERS, supra note 6, at 140.278. Id. The formula for computing the correlation coefficient is not set forth here.279. HAUGEN, supra note 6, at 52-55.280. BREALEY & MYERS, supra note 6, at 134.281. COPELAND & WESTON, supra note 6, at 150.282. A normal distribution will produce a bell-shaped curve. See HAUGEN, supra note 6, at 198.283. For example, the covariance between the stock prices of two computer firms will likely be positive.284. COPELAND & WESTON, supra note 6, at 156.285. See BREA.LY & MYERS, supra note 6, at 145.
19961
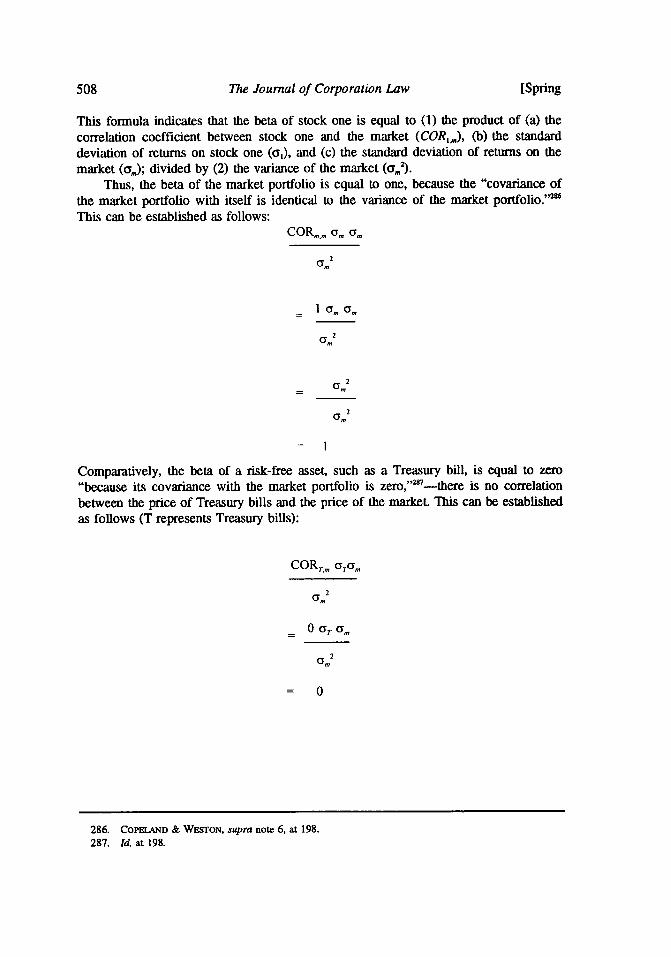
The Journal of Corporation Law
This formula indicates that the beta of stock one is equal to (1) the product of (a) thecorrelation coefficient between stock one and the market (COR,), (b) the standarddeviation of returns on stock one (ar), and (c) the standard deviation of returns on themarket (o,); divided by (2) the variance of the market (@).
Thus, the beta of the market portfolio is equal to one, because the "covariance ofthe market portfolio with itself is identical to the variance of the market portfolio."This can be established as follows:
COR,, Gm a.
a 2
a 2
ar 2
= 1
Comparatively, the beta of a risk-free asset, such as a Treasury bill, is equal to zero"because its covariance with the market portfolio is zero," 2 7-there is no correlationbetween the price of Treasury bills and the price of the market. This can be establishedas follows (T represents Treasury bills):
COR,, aoY,
0 (Y, cr.
am2
- 0
286. COPELAND & WESTON, supra note 6, at 198.287. Id. at 198.
[Spring

Modem Valuation Techniques in Mergers and Acquisitions
The beta of a particular stock, which can be negative, zero or positive, is an indicator ofthe degree to which the price of the stock changes in relation to changes in the mar-ket.
3. Further Elaboration on Beta
Because the market has a beta of one, a high beta stock is one with a beta greaterthan one and a low beta stock is one with a beta less than one. A high beta stock tendsto move up by a greater percentage than the market moves up and tends to move downby a greater percentage than the market moves down. Such stocks thereby tend to "am-plify the overall movements of the market."' However, "stocks with a beta betweenzero and one tend to move in the same direction as the market, but not as far. '"2 °
Stocks with negative betas tend to move in the opposite direction of the market.The following graph illustrates a stock that has a beta, or sensitivity to the market,
of tWO:29 t
GRAPH B
COMPARISON OF EXPECTED RETURN ON STOCK WITH EXPECTEDRETURN ON THE MARKET
Expected Return B=2on Stock A, percent
B=1
20
B=0.5
10 Return on Market,percent
A diversified portfolio of stocks with high betas has more risk than a diversifiedportfolio of stocks with low betas.2
9 As Brealey and Myers point out, "the risk of awell diversified portfolio is proportional to the portfolio's beta, which equals the aver-age betas of the securities included in the portfolio. '2 93 They further emphasize that"[tihe risk of a well diversified portfolio depends on the average beta of the securitiesincluded in the portfolio. ' 2' Portfolio risk declines with diversification until the point
288. HAUGEN, supra note 6, at 58.289. See BREALEY & MYERS, supra note 6, at 143.290. Id.291. Id. at 144.292. Id.293. Id. at 145.294. BRBALEY & MYERS, supra note 6, at 144.
1996]

The Journal of Corporation Law
where all unique or specific risk is eliminated and only the "bedrock of market riskremains.
'295
Betas estimate the amount by which investors expect the price of a particular stockto change as a result of a change in the market. A stock with a beta greater than one,such as Tandem Computer,29 6 is generally sensitive to movements in the market,whereas a stock with a low beta, such as AT&T, 29 is less sensitive to market moves.This is because the cash flows of AT&T are more certain than the cash flows of Tan-dem Computer; that is, there is more risk associated with Tandem's cash flows.2
Professor Shapiro explains that "[s]tocks with betas greater than one are oftencalled aggressive stocks because they go up faster than the market in a 'bull' (rising)market but fall faster in a 'bear' (declining) market. On the other hand, stocks withbetas lower than one are referred to as "defensive stocks" and "tend to fluctuate lessthan the market.
'30 °
Investment services often estimate the betas of various companies."0 For exam-ple, Merrill Lynch publishes a Beta Book."°2 Also, analysis of industry-specific betasallows for the estimation of betas for particular projects or divisions of larger firms."nIn determining betas firms may have to adjust for financial risks (i.e., leverage) thatthey employ.3l
D. Risk-Free Rate and Market Risk Premium
In addition to determining beta, in applying CAPM it is necessary to determine therisk-free rate and the market risk premium. The return on Treasury bills measures therisk-free rate of return."' The rate is risk-free because there is no safer investmentand the risk of default is essentially nonexistent. In comparison, a well diversified port-folio of common stocks offers the market return. The market return has to be greaterover time than the return on Treasury bills, otherwise no one would invest in commonstocks. Because the risk of holding common stocks is greater than the risk of holdingTreasury bills, the reward for holding common stock must be greater than the rewardfor holding Treasury bills.
Historically the market risk premium--the excess of the return on a diversifiedportfolio of common stocks over the Treasury bill rate--has been 8 .4 %." Thus, if the
295. Id.296. Id. at 163.297. Id.298. Id. at 162.299. SHAPIRO, supra note 6, at 120.300. Id.301. BREALEY & MYERS, supra note 6, at 186.302. See also the beta estimates provided by Wilshire Associates, BARRA, and Bloomberg. For some
rules of thumb for determining beta, see COPELAND El AL, VALUATION, supra note 6, at 197.303. BREALEY & MYERS, supra note 6, at 189.304. See 6nfra part V.F (discussing the difference between asset betas, which are unleveraged, and equity
betas, which account for a firm's leverage).305. BREALEY & MYERS, supra note 6, at 161. But see COPELAND Er AL., VALUATION, supra note 6, at
192 (suggesting that the risk-free rate should be the rate on ten-year Treasury bonds).306. BREALEY & MYERS, supra note 6, at 131; see also COPELAND ET AL, VALUATION, supra note 6, at
[Spring

1996] Modem Valuation Techniques in Mergers and Acquisitions 511
Treasury bill rate is presently 7%, the expected rate of return (including dividends andcapital gains) from holding a well diversified portfolio of common stocks should beapproximately 15.4%.
The algebraic formula for market risk premium, where r. means the market returnand r, means the risk-free rate on Treasury bills, is:
Market Risk Premium = (rm - r,)
E. The Capital Asset Pricing Model07
The elements of CAPM are (1) the beta for the particular stock; (2) the risk-freerate (r), and (3) the market risk premium (rm-rf). A market portfolio of common stockshas a beta of one because the "covariance of the market with itself is identical to thevariance of the market portfolio."'3 The expected risk premium of holding a marketportfolio is equal to the market risk premium (rm-r,), and the expected return of holdingthe market portfolio is equal to the sum of the risk free rate (r,), and the market riskpremium (rm-r,). Thus, there is a one-to-one relationship between the beta of a portfolioof common stocks and the expected return of such a portfolio. The following graphillustrates this one-to-one relationship:
GRAPH CBETA OF PORTFOLIO OF COMMON STOCKS
Expected Return
rm
rf
1.0 Beta
This graph shows that the beta of a risk-free Treasury bill, which has an expectedreturn of rf, is zero, and the beta for the market portfolio, which has a return of r, isone. The graph also illustrates that any security with a beta of less than one can expect
193 (stating that if the rate on ten-year Treasury bonds is taken as the risk free rate, the market risk premiumis five to six percent).
307. See, e.g., GILSON & BLAcK, LAW AND FINANcE, supra note 6, at 101-28; Jeffrey S. Glazer, TheCapital Asset Pricing Model: Risk Valuation, Judicial Interpretation and Market Bias, 50 Bus. LAw. 686(1995); Does CAPM Work?, supra note 267.
308. See supra part VI.C.2; COPELAND & WESTON, supra note 6, at 198.

512 The Journal of Corporation Law [Spring
a return that is less than the market return because such a security is less risky than themarket portfolio. Furthermore, any security with a beta greater than one has an expectedreturn that is more volatile than that of the market because that security is more riskythan the market portfolio. Thus, the cost of capital for a low beta stock will be less thanthe cost of capital for the market, and the cost of capital of a high beta stock will behigher than the cost of capital for the market. For example, AT&T, which has a beta ofless than one, will have a lower cost of capital than Tandem Computer, which has abeta greater than one.
The line intersecting the risk-free rate on the vertical axis is known as the securitymarket line (SML). The SML illustrates the capital asset pricing model, which providesthat "the expected risk premium on each investment is proportional to its beta.' 9
GRAPH DSECURITY MARKET LINE
ExpectedReturn
High Beta Stocks
rm __Require a Greater
fThan Market Return
~~Require Less Thanthe Market Rtu
1.0 Beta
The expected risk premium on a particular stock can, therefore, be written as:3t
Expected Risk Premium = (Beta) x (Expected Risk Premium of Market)= (Beta) x (r. - rf)= 3 (rm - rf)
The expected rate of return (or the discount rate, hurdle rate, or cost of capital) can bederived from the algebraic statement of the CAPM:
Expected Rate of Return = r = (Risk-Free Rate of Return) + (Beta)x (Market Risk Premium)
r rf+ [P (r. - rf)
309. BRfAt.m & MYERS, supra note 6, at 162.310. Id. at 138.

Modern Valuation Techniques in Mergers and Acquisitions
In a well functioning capital market, "a security cannot sell for an extended periodat prices low enough to yield more than the appropriate return indicated on theSML..31 Such a security would become an attractive investment relative to other se-curities with similar risk. The demand for the security would cause its price to rise untilthe expected return fell to the appropriate point on the SML. Conversely, a stock with aprice high enough to put its expected return below the appropriate point on the SMLwould induce investors to sell the stock, thereby driving down the price until the rate ofreturn was appropriately placed on the SML."'
Thus, in using CAPM to determine the appropriate discount rate for the acquisitionof a target corporation, it is necessary to identify: (1) the risk-free rate (i.e., the rate onTreasury bills), (2) the market risk premium, which over time has been 8.4%, and(3) the beta for the target corporation. Although there is an element of judgment indetermining beta, most estimates should be in the same ballpark.
If the target is involved in several lines of business, it is appropriate to determine,using the CAPM, a discount rate for each segment and to discount to present value,using the DCF model, the estimated free cash flows and terminal value of each line ofbusiness. In the words of Brealey and Myers, "[tihe true cost of capital depends on theuse to which the capital is put.''314
This is basically the method that was followed in valuing Warner's different busi-ness segments, both by Wasserstein/Shearson in their opinion to Time's board3 5 andby Lazard in its opinion to Warner's board.3 16 Both firms used a range of discountrates for each segment, but neither report indicates whether the discount rates weredetermined by using CAPM.
Some companies use different discount rates depending on the type of investmentbeing analyzed. For example, an investment that expands the firm's core business maybe analyzed with a discount rate equal to the firm's cost of capital, determined usingWACC. A more risky venture may be analyzed with a higher discount rate, and a lessrisky venture may have a lower rate. 7
CAPM was used by the Delaware Court of Chancery in the appraisal decision inCede & Co. v. Technicolor, Inc. ,8 where the court said, "IlThe CAPM methodologyis certainly one of the principle [sic] 'techniques or methods ... generally consideredacceptable [for estimating the cost of equity capital component of a discounted cashflow modeling] in the financial community ....,31 9
311. Does CAPM Work?, supra note 267, at 108.312. Id.313. BREAIY & MYERs, supra note 6, at 189.314. Id. at 182.315. See infra Appendix C, at C-2 to C-3.316. See infra Appendix D, at D-5 to D-6.317. BREALEY & MYERS, supra note 6, at 189.318. No. CIV.A. 7129, 1990 WL 161084 (Del. CL Oct. 19, 1990).319. Id. at *28 (citing Weinberger, 457 A.2d at 713); see, e.g., Northern Trust Co. v. C.I.R., 87 T.C. 349,
368 (1986)).
1996]

514 The Journal of Corporation Law [Spring
F. Asset and Equity Betas
A fmin's cost of capital is a function of its business risk-the risk associated withthe firm's investments or assets. 2 In a firm with no debt, the common shareholdersface only this business risk. But if the finn carries debt (i.e., is leveraged), the commonshareholders also face financial risk: the risk that the firm will not be able to service thedebt and therefore will go into bankruptcy."' Obviously, the more leverage the greaterthe risk to the common shareholders. Financial risk, however, does not affect businessrisk; leverage does not affect the firm's assets.3 "
In determining the beta of a firm's equity, the beta must be adjusted to reflect thefinancial risk (i.e., leverage) employed by the particular company. A firm's leveragecontrols its level of financial risk and its beta. As a firm's leverage increases, its finan-cial risk and beta correspondingly increase 3 A firm's asset beta would apply if the
firm did not employ any leverage. Therefore, the asset beta assumes a firm incurs busi-ness risk, but not financial risk.
Brealey and Myers explain that because low risk is generally associated with debtof large blue-chip firms, financial analysts generally assume that the beta of the debt ofsuch firms is zero. When the firm's debt beta is zero, its debt is not sensitive to movesin the equity markeLt This concept of stability is intuitively appealing. Debt holdersin firms that are not highly leveraged can be fairly certain that they will be paid regard-less of market shifts. Assuming Brealey and Myers are correct, the value of the debt isnot affected by market swings. Brealey and Myers explain, however, that stability maynot occur in periods of volatile interest rates such as the early 1980s, when betas oncorporate bonds were as high as .3 to .4 In a highly leveraged firm, it can be ex-pected that the value of the debt will change with changes in the market. However, re-gardless of whether the value of a firm's debt fluctuates or remains constant, investingin the firm's debt will be less risky than holding equity in the same firm.
If the beta of a firm's debt is zero, the beta of its stock will equal the finm's assetbeta. The asset beta is equal to the sum of the weighted average of the beta of thefirm's debt (D) and the beta of the firm's equity (E). 2 Thus, the firm's asset beta canbe expressed algebraically as:
f3 assets = -Beta of debt + h Beta of equityV
D EIn this formula - is the portion of the firm's value attributable to debt, and V is theportion of the vaYue attributable to equity.
320. BREAI.Y & MYERs, supra note 6, at 189.321. Id.322. Id. at 190.323. Id. at 191-92; see also COPELAND & WESTON, supra note 6, at 455-60.324. BREAIL. & MYERs, supra note 6, at 191.325. Id.326. Id.

Modem Valuation Techniques in Mergers and Acquisitions
If the beta of the firn's debt is positive (meaning the debt is sensitive to marketmoves), the beta for the firm's equity will exceed the firm's asset beta because of thefinancial risk associated with the debt. The weighted averages of the firm's debt betaand equity beta will equal the firm's asset beta (i.e., the beta of the nonleveraged or lowleveraged firm).
The following illustration helps conceptualize these ideas."z Assume that anonleveraged firm has an asset beta of .8. This is also the firm's equity beta, as illus-trated on the following graph:
GRAPH EASSET BETA
ExpectedReturns,percent
rm
12.2
rf
0.8 Beta
Beta Assets = 0.8Beta Equity = 0.8
This means that without any debt the stock is not very sensitive to market moves-theprice of the equity will move both up less and down less than the market.
Now assume that the firm takes on such substantial debt that debt represents 40%of the value of the firm, and the debt has a beta of .2. The firm's equity beta, which is
327. Id. at 191-92 (providing the basis for the illustration).
1996]
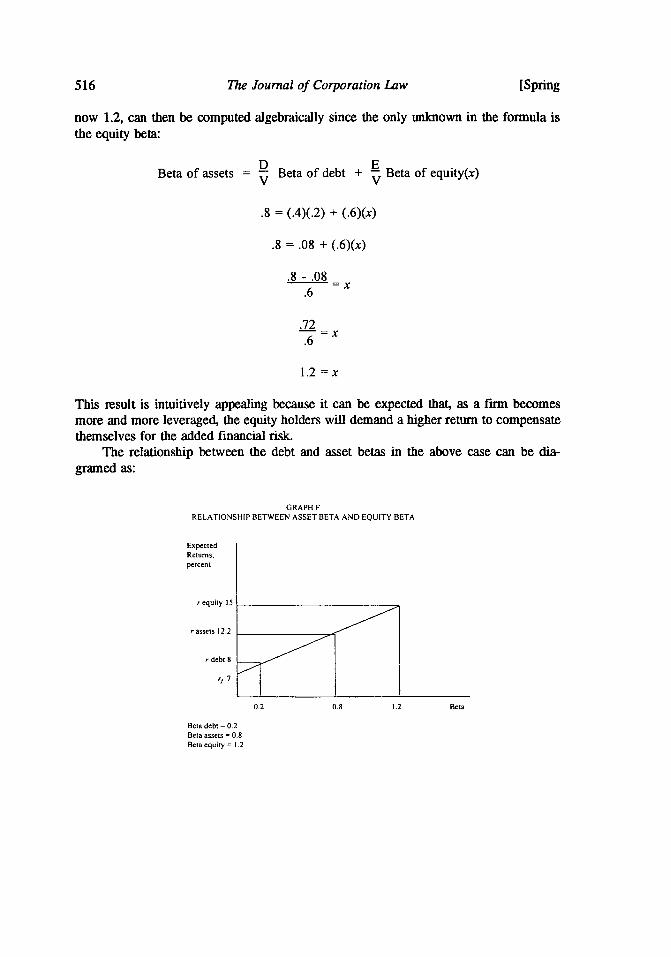
The Journal of Corporation Law
now 1.2, can then be computed algebraically since the only unknown in the formula isthe equity beta:
1D EBeta of assets = P Beta of debt + E
V VBeta of equity(x)
.8 = (.4)(.2) + (.6)(x)
.8 = .08 + (.6)(x)
.8 - .08.6
.72.6 =
1.2 = x
This result is intuitively appealing because it can be expected that, as a finn becomesmore and more leveraged, the equity holders will demand a higher return to compensatethemselves for the added financial risk.
The relationship between the debt and asset betas in the above case can be dia-gramed as:
GRAPH FRELATIONSHIP BETWEEN ASSET BETA AND EQUITY BETA
ExpectedReturns,percent
r equity 15
r assets 12.2
r debt 8
r,7
0.2 0.8 1.2 Beta
Beta debt = 0.2Beta assets = 0.8Beta equity = 1.2
[Spring

Modem Valuation Techniques in Mergers and Acquisitions
The following principles can be derived by relating the previous diagram to the follow-ing formula for determining the asset beta:
Beta of asset = D Beta of debt + E Beta of equityV V
First, the lower the beta of debt, the lower the beta of equity. If debt has a beta of zero,the beta of equity is equal to the asset beta. Second, the higher the beta for debt, thehigher the beta for equity. Third, the asset beta equals the weighted average of thefirm's debt and equity betas. Fourth, the firm's asset beta does not change with lever-age, as asset betas are not affected by financial risk. This, too, is intuitively appealingbecause the income stream does not depend on whether the cash flow pays the firm'sdebt holders or equity holders.
Many industry-wide betas reflect asset betas after removing the effects of financialleverage on beta. Thus, determining the equity beta of a particular firm in the industryrequires adjusting the asset beta upward for any leverage utilized.3" However, if anequity beta is available, it may be necessary to convert the equity beta into an assetbeta, a process referred to as "unlevering."'
In the acquisition context, it is generally appropriate to use asset betas in determin-ing the discount rate for the DCF model. If asset betas are used, any cost or benefitsassociated with the financing of the acquisition (e.g., tax benefits from interest deduc-tions) should be separately determined for each year and then discounted to presentvalue with the other cash flows. 3 In certain situations it may be appropriate to useequity betas. For example, the equity beta may be used in analyzing a partial stockinvestment in a leveraged firm and in determining the cost of equity capital when ap-plying WACC.
331
If the asset beta is used to determine the value of a target's assets in the DCFmodel, the target's outstanding debt is subtracted to ascertain the value of the equity.This technique of valuing the equity-first determining the value of assets with DCFand then subtracting the outstanding debt-was utilized by both Wasserstein/Shearson inits presentation to Time's board332 and by Lazard in its presentation to Warner'sboard.3
G. Fama and French Critique of CAPM and Responses
Although CAPM was criticized before 1992, most of the empirical studies similar-ly concluded that "[slecurity returns appear to be linearly related to beta as predicted bythe CAPM," and "[that tihere is a positive relationship between beta and past returns;that is, higher betas tend to lead to higher returns."3" A 1992 empirical examination
328. Id. at 190-92.329. See SHAPIRO, supra note 6, at 263-65 (discussing the unlevering process).330. See infra part VIII (dealing with the interaction between the investment decision and the financing
decision).331. See infra part IX (discussing WACC).332. See infra Appendix C, at C-7.333. See infra Appendix D, at D-4.334. SHAPIRO, supra note 6, at 124; see Gordon & Kornhauser, Efficient Markets, supra note 251, at 775-
19961

The Journal of Corporation Law
of beta conducted by Professors Fama and French seriously questioned the validity ofthe "basic prediction" of CAPM: "average stock returns are positively related to marketbetas." 35 They concluded that beta "does not seem to help explain the cross-section ofaverage stock returns."'3 They found that the size of a firm's market equity (ME)-astock's price times shares outstanding-and book to market equity (BE/ME) "provide asimple and powerful characterization of the cross-section of average stock returns forthe 1963-1990 period.""3
Fama and French found that if common stock portfolios are formed on the basis ofsize alone, "there seems to be evidence for the model's central prediction: average re-turn is positively related to P."" They pointed out, however, that the betas of portfo-lios ranked by size are "almost perfectly correlated with size," but when portfolios aresubdivided on the basis of betas, there is a "strong relation between average return andsize, but no relationship between average return and P.,,"'9
Fama and French formed twelve portfolios of securities on the basis of firmsize.' The data demonstrates a strong negative relationship between firm size and av-erage return, with average returns falling from 1.64% per month for the portfolio con-taining the smallest firms to 0.90% for the portfolio containing the largest firms."4 Astrong positive relationship between average returns and beta was also shown, with betadeclining from 1.44 for the portfolio containing the smallest firms to 0.90 for the port-folio containing the largest firms.4 2 These basic data can be summarized as follows:
Portfolios Formed on Size
Portfolio with Smallest Firms Portfolio with Largest Firms
Average Monthly Returns 1.64% 0.90%
Beta 1.44% 0.90%
Fama and French asserted that although a "simple size sort seems to supportthe... prediction of a positive relation between [3 and average returns.... the evi-dence is muddied by the tight relation between size and the 1P's of size portfolios."' 3
They concluded that the "proper inference seems to be that there is a relation betweensize and average return, but controlling for size there is no relation between 0 and aver-
76 (discussing much of the literature dealing with CAPM, including some of the critiques of the concept).335. Fama & French, supra note 18, at 428; cf. Fama, Efficient Capital Markets II supra note 17, at
1589-99 (providing an overall evaluation of CAPM and APT in the context of market efficiency).336. Fama & French, supra note 18, at 428.337. Id at 429.338. Id. at 432.339. Id.340. Id. at 433.341. Fama & French, supra note 18, at 433.342. Id. at 436.343. Id. at 433.
[Spring
Modem Valuation Techniques in Mergers and Acquisitions
age return."' They also found a strong relationship between average returns andbook to market equity.34
In explaining the implications of their findings, Fama and French stated that their"results imply that the performance of managed portfolios ... can be evaluated bycomparing their average returns with the average returns of benchmark portfolios withsimilar size and BE/ME characteristics" and that the "expected returns from differentportfolio strategies can be estimated from the historical average returns with matchingsize and BE/ME properties."' This conclusion may imply that the comparable com-panies and comparable transactions valuation techniques,4 which consider firms ofsimilar size, are more likely to produce an appropriate valuation of a target than theDCF technique.
Finally, Fama and French stated that "if there is a role for f3 in average returns, itis likely to be found in a multi-factor model that transforms the flat simple relationbetween average return and 03 into a positively sloped conditional relational."' Arbi-trage pricing theory (APT) is an example of the type of multi-factor model referred toby Fama and French. 9
It appears that, notwithstanding the findings of Fama and French, CAPM will stillbe used as a method of determining an appropriate discount rate. In a critique of theFama and French study, Professors Roll and Ross conclude that the "idea of a tradeoffbetween risk and return [which is at the heart of CAPM] is valid and meaningful...[and] ... the empirical findings are not by themselves sufficient to cause rejection ofthe theory. ' '3
'0 Roll and Ross also point out that a study by Amihud, Christensen, andMendelson replicating the Fama and French test, but utilizing more advanced tech-niques, concludes that "beta is alive and well."35
Another critique of the Fama and French study, authored by Fisher Black con-cludes:
If today's corporations do not face borrowing restrictions, and if the corpo-ration makes its investment decisions to maximize its stock price, the mar-ket for corporate assets should be governed by ordinary CAPM. A firmshould use discount rates for its investments that depend on their betas inthe usual way. 2
Finally, in a 1995 article entitled The CAPM Debate, the authors observe:
With academics debating the value of the CAPM, what are companies thatnow use it in their capital budgeting process to do? Maybe nothing differ-ent .... . [T]he data seem to suggest that those who choose to use the
344. Id.345. ld. at 440.346. Fama & French, supra note 18, at 452.347. See iMf& part X1.348. Fama & French, supra note 18, at 449.349. See infra part VIL350. Roll & Ross, supra note 19, at 115.351. Id. at 113-14.352. Fisher Black, Beta and Retunm, J. PORTFOUO MGmT. 8, 17 (1993).
19961
The Journal of Corporation Law
CAPM now despite the academic debate will actually not be getting worth-less advice .... [F]or those interested in the longer view, the CAPM stillseems to have something to offer."353
The CAPM model is intuitively appealing, and Fama and French did find a rela-tionship between beta and average returns when firms are organized according to size.Adjustments could be made in utilizing CAPM to take account of size differences. Al-though CAPM will still be used, it can be expected that greater emphasis will be givento both APT114 and the comparable companies and comparable transaction tech-niques." '
VII. USE OF ARBITRAGE PRICING THEORY (APT) IN DETERMINING THE APPROPRIATEDISCOUNT RATE
CAPM provides a basic economic model for determining the discount rate; thearbitrage pricing theory (APT) provides an alternative, albeit more elaborate economicmodel."s CAPM is a unidimensional model focusing only on the return of the market.On the other hand, APT attempts to account for all of the macroeconomic factors thatcan affect the price of a particular stock. The expected risk premium for each factor ismeasured, and then the stock's sensitivity to each factor is determined. Finally, the ex-pected return is computed.3 ' Needless to say, this is an extremely complicated pro-cess. As Copeland et al. explain, "APT can be thought of as a multifactor analogue tothe CAPM. ' 3
Empirical research generally indicates that no more than three to five commonfactors affect stock prices and must therefore be taken into account in APTY3 Thefour most common factors seem to be unexpected changes in industrial output, unex-pected changes in inflation, the difference between the yield on long-term and short-term Treasury bonds, and bond risk premiums.3 6 Professor Shapiro explains that"[tihese variables make intuitive sense as risk factors because unanticipated changes inthem systematically affect the value of all assets." 36'
Brealey and Myers have compared industry discount rates determined underCAPM and APT.3' The comparison shows, for example, that for railroads the dis-count rate under both models is the same: 17.9%. For the paper industry, the discount
353. Ravi Jaqannathan & Ellen R. McGrattan, The CAPM Debate, FED. RESERvE BANK OF MINNEAPOLUSQ. REv., Fall 1995, at 2, 16.
354. See infra part VII (discussing arbitrage pricing theory).355. See infra part XII (discussing the comparable companies and comparable transaction techniques).356. See Stephen A. Ross, The Arbitrage Theory of Capital Asset Prcing, J. EcoN. THEORY, 1976, at
341-60 (comprising "the seminal article on the topic"); see also BREALEY & MYERs, supra note 6, at 169-73;COPELIAND & WESTON, supra note 6, at 219-30; HAUGEN, supra note 6, at 256-77; SHAPIRO, supra note 6, at128-30 (all discussing APT).
357. BREALEY & MYERS, supra note 6, at 172-73.358. COPELAND Er AL, VALUATION, supra note 6, at 197.359. SHAPIRo, supra note 6, at 129.360. Il361. Id.362. BRBAtEY & MYERs, supra note 3, at 173.
[Spring

Modern Valuation Techniques in Mergers and Acquisitions
rate using CAPM (17.1%) is less than that determined using APT (18.4%). For utilities,however, the discount rate using CAPM (13.5%) is higher than the rate determinedunder APT (11.4%). Commenting on the two methods, Brealey and Myers-who seemto prefer CAPM3
63-state, "[e]ach of these different models of risk and return has itsfan club. However, all financial economists agree on two basic ideas: (1) Investorsrequire extra expected returns for taking risk, and (2) they appear to be concerned pre-dominantly with the risk they cannot eliminate by diversification. ' 6
VIII. INTERACTION BETWEEN INVESTMENT AND FINANCING DECISIONS: USE OFADJUSTED NET PRESENT VALUE TECHNIQUE
Brealey and Myers suggest a methodology for analyzing the interactions betweenthe investment decision, employing DCF and CAPM, and the financing decision.3"tTheir approach is to first compute the NPV of a project, assuming all-equity financing
and using the DCF model with the discount rate determined using CAPM with assetbetas. Under this base case, taxes are estimated assuming all-equity financing. The NPVis then adjusted to account for the effects of financing. The result is called adjustedNPV or APV 66 Brealey and Myers provide the following formula:36
= base case NPV + NPV of financing decisionscaused by acquisition of target
Brealey and Myers give two illustrations of financing effects. The first shows that ifstock is to be issued to finance the project, the NPV of the issuance cost will causeAPV to be less than the base case NPV. The second illustration shows that if part ofthe acquisition is to be financed by debt, the present value of the expected tax savingsfrom the interest deductions will cause APV to exceed the base case NPV.3 6 They ex-plain the process as follows:
A series of present value calculations is made .... The first establishes a
base-case value for the project: its value as a separate, all-equity financedmini-firm. Then each side effect is traced out and the present value of its
cost or benefit to the firm is calculated. Finally, all the present values areadded together to estimate the project's total contribution to the value of thefirm. Thus, in general:3"
sum of the present values of the sideeffects of accepting the project
363. Id. at 174 (stating that CAPM that is the "best model of risk and return").364. Id.365. Id. at Ch. 19.366. i. at 457-58. See generally David C. Mauer & Alexander J. Triontis, The Interaction of Corporate
Financing and Investment Decisions: A Dynamic Framework, 49 J. FIN. 1253 (1994).
367. BRBALEY & MYERs, supra note 6, at 458.368. Id. at 458-59.369. Id. at 460.
19961

522 The Journal of Corporation Law [Spring
Rappaport suggests that the function of the APV concept is similar to that of theweighted average cost of capital concept (WACC) 7 WACC accounts for the fmanc-ing decision by considering the cost of both debt and equity financing. Brealey andMyers point out three mistakes commonly made with WACC.3 ' First, the WACC for-mula works only for a project in the same line of business as the business normallycarried on by the fim."2 Second, applying the concept to a discrete project may leadto the assumption that more debt should be used in financing the project, thereby lower-ing the discount rate and making the project look more attractive.3 3 On this pointBrealey and Myers state:
[Tihe immediate source of funds for a project has no necessary connectionwith the hurdle rate for the project. What matters is the project's overallcontribution to the firm's borrowing power. A dollar invested in Q's petproject will not increase the firm's debt capacity by 90 cents. If it borrows90 percent of the project's cost, it is really borrowing in part against itsexisting assets. Any advantage from financing the new project with moredebt than normal should be attributed to the old projects, not to the newone.
374
Third, using excessive debt in an acquisition will not necessarily reduce the cost ofcapital because the debt will increase the financial risk to shareholders and therebyincrease the required rate of return on equity (i.e., the cost of equity). 5
As another alternative to WACC, Brealey and Myers suggest adjusting the cost ofcapital, determined using CAPM with asset betas, to reflect the "financing side effectsof an investment project." 376 Although they acknowledge that there is no generally ac-cepted way of adjusting the discount rate, they discuss two useful rules of thumb 7
Their bottom line, however, is that in general the APV technique should be used."' Itappears that the proper application of either APV, the adjusted beta method, or WACCproduces similar results because each measures the effects of the financing decision.
IX. USE OF THE WEIGHTED AVERAGE COST OF CAPrrAL (WACC) IN DETERMININGTHE APPROPRIATE DIscouNT RATE
In certain situations it may be appropriate to discount a target's cash flows at thetarget's weighted average cost of capital (WACC). The WACC is determined by sum-ming (1) the after-tax cost of debt, multiplied by the percentage of the value of the firm
370. See infra part IX (discussing WACC).371. BREALEY & MYERS, supra note 6, at 469-70.372. Id. at 470.373. Id.374. Id.375. Id.; see also supra part VI.F (illustrating this common mistake in discussing adjustments to asset
betas).376. BREALEY & MYERS, supra note 6, at 459-60.377. Id. at 461-64.378. Id. at 475.

Modem Valuation Techniques in Mergers and Acquisitions
that is represented by debt, and (2) the expected return on equity, multiplied by the per-centage of the value of the firm represented by equity."'
The after-tax cost of debt is determined by multiplying the firm's current borrow-ing rate (rd) by 1 minus the corporate tax rate (t), (1 - t). This is the reciprocal of thetax rate. If the corporate tax rate is 34%, (1 - t) is equal to 66% or .66. Thus, the after-tax cost of debt can be expressed as:
After tax cost of debt = rd(1 - t)= rd(.66)
The expected return on the firm's equity (r) is a function of the firm's business riskand financial risk, that is, the degree of leverage. The r. can be computed by usingCAPM and adjusting for financial risk."' Thus, the equity beta can be used in theWACC model for determining the cost of equity. Alternatively, the cost of equity canbe determined by using APT.'
Shapiro suggests using the dividend growth model as a check on the cost of equitydetermined under CAPM or APT when determining the cost of equity capital for theWACC formula.3 Under the dividend growth model, the cost of equity is determinedby:
38
Current Dividend Expected Growth in DividendCost of Equity Current Stock Price '
Thus, if the current dividend is $7, the current stock price is $100, the expected growthin the dividend is 5%, and the cost of equity is 12%:
Cost of Equity- $7 +5% =7% + 5%= 12%$100
The value of the firm (V) is equal to the sum of the value of the debt (D) andequity (E).
Thus, the WACC can be expressed algebraically as:
WACC = rd(l - t)- + r e fV V
379. See generally BRBALEY & MYERS, supra note 6, at 465-66 (providing a partial basis for the anal-ysis).
380. See supra part VI.F (discussing asset and equity betas).381. See supra part VII (discussing APT).382. SHAPIRo, supra note 6, at 283-84.383. Id.
19961

The Journal of Corporation Law
The following example illustrates the computation of WACC:3
Example (11). Acquiring corporation (AC) has a cost of debt (rd) of 10%,implying that its after-tax cost of debt (rd)(1-.34) is therefore, 6.6%. AC'scost of equity using CAPM and adjusting the beta for financial risk is 15%.Target corporation (TC) is in the same line of business as AC. AC plans tofinance its acquisition of TC using AC's historic debt to equity ratio-30%debt and 70% equity. Given these elements, AC's WACC is computed asfollows:
Weight (%) Cost of Capital (%) Weighted Cost (%)
Debt 30 6.6 1.9
Equity 70 is 10.5
Cost of Capital 12.4
Professor Rappaport explains that WACC "incorporates the returns demanded by bothdebtholders and shareholders because pre-interest cash flows are discounted---that is,cash flow on which both debtholders and shareholders have claims." '3 He furtherstates that the "appropriate cost of capital is, therefore, one that considers the claims ofeach group in proportion to its targeted relative capital contribution."3
WACC was one of the techniques utilized by Lazard in its valuation ofWarner." In discounting Warner's aggregate free cash flows from all of its businesssegments, Lazard used "a range about Warner's average cost of capital" as discountrates."u Brealey and Myers explain that the weighted average cost of capital is cor-rectly used as a discount rate for the firm as a whole but not necessarily for a particularproject:
The first thing to notice about the weighted-average formula is that all vari-ables in it refer to the firm as a whole. As a result the formula gives theright discount rate only for projects that are just like the firm undertakingthem. The formula works for the 'average' project. It is incorrect for pro-jects that are safer or riskier than the average of the firm's existing assets. Itis incorrect for projects whose acceptance would lead to an increase or de-crease in the firm's debt ratio?"9
384. See, e.g., RAPPAPORT, supra note 6, at 55.385. Id.386. Id.387. See infra Appendix D, at D-4.388. See id., at D-4.389. BREALEY & MYERS, supra note 6, at 465.
[Spring

Modem Valuation Techniques in Mergers and Acquisitions
Brealey and Myers suggest that the projected free cash flows of each segmentshould be discounted at the appropriate discount rate for that segment determined byusing CAPM 9° Conversely, Professor Rappaport supports use of the "weighted aver-age cost of debt and equity capital" as the "appropriate rate for discounting acompany's cash flow stream."39' Professor Rappaport suggests that, in discounting thecash flows of a potential target, the discount rate determined under CAPM should beused only for acquisitions financed by 100% equity. In that case the weighted averagecost of capital equals the cost of equity determined under CAPM. Whenever debt isused in the acquisition, the discount rate using the weighted average cost of capital isless than that obtained using CAPM because the cost of equity exceeds the cost of debt.Also, greater debt and a lower weighted average cost of capital results in a higher pricefor the target.
The basic difference between the WACC approach suggested by ProfessorRappaport and the all-equity (or asset beta) approach suggested by Brealey and Myersis that WACC takes account of the financing decision in the application of the DCFmodel, whereas Brealey and Myers suggest analyzing any debt financing benefits sepa-rately.
3W
X. APPLICATION OF DCF IN ACQUISITIONS THAT PRODUCE SYNERGIES
In applying the DCF and NPV techniques, any synergistic (or merger) gains result-ing from the acquisition must be taken into account. Synergistic gains increase cashflow as a result of either an increase in revenues or a decrease in cosL 3913 ProfessorRappaport has stated that synergistic gains fall into three principal categories: operating,financial, and tax.394
Brealey and Myers explain that in preparing a merger analysis, some firms includesynergistic gains in the forecast of the target's cash flows and then discount the cashflows to present value and compare the present value with the purchase price. Theydescribe this process as:
Estimated DCF valuation of Cash requiredNet gain = target, including - for acquisition 39
1
merger benefits
The "estimated net gain" is the same as the NPV resulting from the merger. This pro-cess, referred to here as the standard approach, is illustrated as follows:
Example (12). Assume that an acquiring firm has a preacquisition tradingvalue of $200 million and a target has a preacquisition trading value of $60million. A DCF analysis of the target's cash flows indicates, however, that
390. Id. at 181.391. RAPPAPORT, supra note 6, at 55.392. See supra part VII (discussing the Brealey and Myers approach).393. Cf. WEsroN ur AL.., MERGERs, supra note 2, at 194.394. RAPPAPORT, supra note 6, at 207-15.395. BREAMEY & MYERS, supra note 6, at 820.
19961

The Journal of Corporation Law
the target has a present value of $100 million. The acquisition requires $90million in cash. Therefore, the estimated net gain, or NPV, resulting fromthe acquisition is $10 million. Mter the acquisition, assuming the transac-tion is financed with $90 million from the sale of new equity, the combinedfirm will consequently have an expected value of $300 million."
Brealey and Myers have stated that the standard NPV process "is a dangerous pro-cedure. Even the brightest and best-trained analyst can make large errors in valuing abusiness. The estimated net gain may come up positive not because the merger makessense, but simply because the analyst's cash flow forecasts are too optimistic.""3 Asan alternative to this standard NPV approach, Brealey and Myers suggest a mergeranalysis that "starts with the target's stand-alone market value.., and concentrates onchanges in cash flow that would result from the merger."3 Professor Rappaport sug-gests a similar approach.'" As demonstrated infra, this alternative approach producesthe same result as the standard NPV approach, provided the two approaches are proper-ly applied. Further, this alternative approach is subject to the same flaw as the standardNPV approach: the possibility of an inaccurate DCF analysis.
The alternative approach starts by determining if there is an economic gain result-ing from the acquisition.4" Brealey and Myers explain that there is an "economic gainonly if the two firms are worth more together than apart."O' This concept can be ex-pressed as:4
Gain Resulting Value of Preacquisition Preacquisitionfrom Acquisition = Combined - Value of + Value of
Firms Acquiror Target
Under this formula, the gain resulting from the acquisition in Example (12) is$40 million, the estimated value of the combined firms ($300 million) minus the sum ofthe preacquisition value of both the acquiror ($200 million) and the target ($60 million).
Since the acquisition results in a gain, there is an "economic justification" for theacquisition.4' This does not mean, however, that the acquiror should make the acqui-sition. This question depends upon the division of the gains between the target's share-holders and the acquiror's shareholders. There is a positive NPV to the acquiror's share-holders only if the cost of the acquisition is not more than the gain resulting from the
396. The expected value represents the $200 million preacquisition trading value of the acquiror $90million purchase price of target $10 million NPV.
397. BREAiEY & MYERS, supra note 6, at 820.398. Id.399. RAPPAPORT, supra note 6, at 202-07.400. BREATEY & MYERS, supra note 6, at 817.401. Id. at 817-18.402. Id. at 818; see also RAPPAPORT, supra note 6, at 202.403. BREALEY & MYERS, supra note 6, at 818.
[Spring

Modem Valuation Techniques in Mergers and Acquisitions
acquisition. In a cash acquisition, the cost of the acquisition is the difference betweenthe cash paid to the target's shareholders and the preacquisition value of the target:4
Cost = (Cash) - (Preacquisition Value of Target)
In the above example, this cost is $30 million, the difference between the $90 millionpurchase price and the $60 million preacquisition trading price of the target.
The NPV to the acquiror's shareholders is the difference between acquisition gainsand cost:
[Value of [Preacquisition Preacquisition 1NPV = gain - cost = Combined - Value of + Value of Target I I
Firms I Acquiror I IL($300m) (($200m) ($60m) Ji
(Cash Preacquisition II ($90m) - Value of I
Target I( ($60m) J
Based on the facts in Example (12), this formula produces a NPV of $10 million, thedifference between the $40 million gain and the $30 million cost. This NPV equals theNPV calculated using the standard method shown in Example (12):
NPV = (PV of Target ($100,000,000)) - (Cost ($90,000,000))
As long as all the incremental cash flows, including those from synergistic gains,are properly identified,4 the two approaches should produce the same result. Finally,if the acquisition of the target is financed with stock of the acquiror, the target's share-holders will automatically share in any NPV benefits generated by the merger throughtheir ownership of the acquiror's stock. Therefore, this factor should be taken into ac-count in determining the amount of acquiror's stock to be transferred to the target'sshareholders.
4M
Further, it appears that the alternative approach functions only when the target isacquired either for stock of the acquiror or for cash raised by a new stock issuance ofthe acquiror. Only those cases appropriately consider the value of the stock of the com-bined firms as including the preacquisition value of the acquiror and target, which isimplicit in the alternative approach.! 7 For example, if the acquisition is completelydebt-financed, the equity value of the combined firm will equal the equity value of the
404. Id.405. See supra part V.D (discussing identification of incremental cash flows).406. See generally BREAMEY & MYERS, supra note 6, at 830; SHAPIRO, supra note 6, at 936-37.407. The alternative approach could possibly be used in a debt-financed acquisition if the value of the two
firns is considered to equal both the debt and equity of the firms.
1996]

528 The Journal of Corporation Law [Spring
acquiror plus the NPV of the transaction. The NPV, therefore, is the value added for theacquiror's shareholders.
Since both approaches are subject to the same potential flaws, and the standardapproach is used in all circumstances, the standard approach should be the preferredtechnique. The alternative can be used as a reality check in appropriate cases.
XI. ILLUSTRATION OF THE APPLICATION OF DCF, NPV, AND CAPM IN ANACQUISITION CONTEX1e'
Acquiring corporation (AC) is analyzing the proposed acquisition of target corpora-tion (TC) using DCF, NPV, and CAPM. The asking price of TC is $6 million. ACfollows the five steps set forth in Part III. First, AC estimates the amount and timing ofthe free cash flows and the terminal value of TC.4°
Estimated Free Cash Flows
Year 1 2 3 4 5
$600,000 $700,000 $800,000 $900,000 $1,000,000
The terminal value of TC at the end of the fifth year is estimated to be $7 million.4 "Thus, the cash flows are:
Free Cash Flow Terminal Value
-Year 12 1 3 4 I$600,000 $700,000 I $800,000 $900,000 $1,000,000 $7,000,000
There are two expected cash flows in year five because TC will likely throw off$1 million in operating cash. The balance of its assets will be sold for the terminalvalue of $7 million.
Second, AC determines the appropriate discount rate (r) by utilizing CAPM."Assume that AC is buying all the stock of TC, which is debt free, and the acquisitionwill be financed with existing cash. If the target has outstanding debt to be assumed, thefollowing methodology should still be utilized. However, after determining the value of
408. See Alfred Rappaport, Strategic Analysis for More Profitable Acquisitions, HARV. Bus. REV., July-Aug. 1979, at 99.
409. See bfra Appendix C, at C-2; supra part V.H (setting forth the cash flow statement in Example 5,providing an estimate of the free cash flow for the five-year period AC intends to operate TC).
410. See supra part V..3 (computing the $7 million terminal value in Example (8) using the competitiveequilibrium formula).
411. See infm Appendix C, at C-3. This chart does not indicate how the discount rate was determined.

Modem Valuation Techniques in Mergers and Acquisitions
the target, the value of the assumed debt is subtracted to determine the value of theequity." Also, the value of any marketable securities or other investments not ac-counted for in computing free cash flows and terminal value are added when computingthe value of TC.4U
Assume that TC operates one line of business. AC first determines the asset betafor TC's line of business, probably through the use of a beta book. If only an equitybeta is available, the beta will have to be adjusted (i.e., unleveraged) to arrive at theasset beta."' If there are multiple lines of business, separate asset betas and separatediscount rates would be determined for each business.
Assume that the asset beta is 1.2. TC then determines the risk-free (r) rate, as-sumed to be 5%. AC takes the market risk premium (rm-r) as the 8.4% historic premi-um.415 These elements are plugged into the CAPM model as follows:
r = rf + P(rm - rf)r = 5% + 1.2(8.4%)r = 5% + 10.08%
r = 15.08%
Thus, the appropriate discount rate is 15.08% (rounded to 15%). This rate does not haveto be adjusted because the acquisition is financed with available cash.
If the acquisition was partially financed with debt, then at least three adjustmentmethods could be used. First, if TC was in the same line of business as AC and theacquisition was financed with the same proportions of debt and equity as AC had out-standing, then AC could use its weighted average cost of capital (WACC) as the dis-count rate." 6 Second, as Brealey and Myers proposed, the discount rate determinedusing the asset beta could be adjusted to reflect the debt financing." 7 Either methodwill produce a discount rate lower than the rate determined using the asset beta. Third,the adjusted net present value (APV) method suggested by Brealey and Myers" 8 couldbe utilized to convert the expected benefits from the interest deduction on the debt topresent value. Each method would increase the net present value of the project over thenet present value produced with the asset beta. If each method is properly employed,the bottom line results (i.e., NPV for the project) should be the same.
412. See COPELAND Er AL, VALUATION, supra note 6, at 97-103; see also infra Appendix C, at C-3.413. See infra Appendix C, at C-7.414. See SHAPIRO, supra note 6, at 279-81 (discussing the unleveraging process).415. See supra note 306 and accompanying text.416. See supra part IX (discussing WACC).417. See supra part VIII (discussing the interaction between the financing decision and the investment
decision).418. Id.
19961
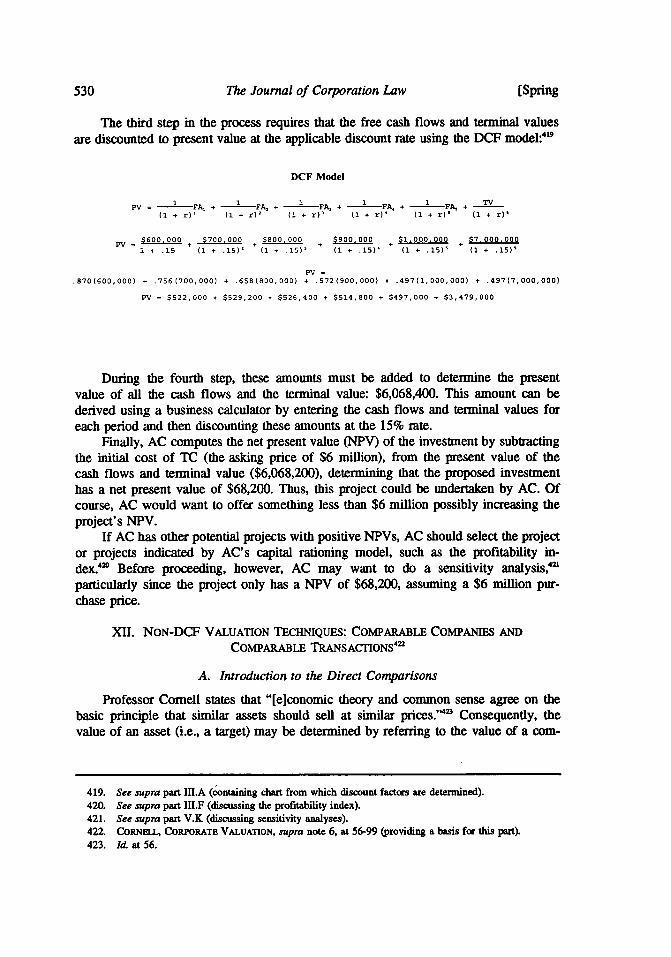
The Journal of Corporation Law
The third step in the process requires that the free cash flows and terminal valuesare discounted to present value at the applicable discount rate using the DCF model:41" '
DCF Model
PV = FA, + 1 FA, + i FA, + FA, + 1 FA, + TV
(1 + r)' (1 + r)' (i + r)' (I + r)4
(1 + r)' (1 + r)I
PV = $600,000 + $700,000 + $800,000 + $900,000 + $1,000,000 + $7,000,0001 + .15 ( + + .15), ( + .15), ( + .15)' (1 + iS)' (1 +
PV =
.870(600,000) + .756(700,000) + .658(800,000) + .572(900,000) + .497(1,000,000) + .497(7,000,000)
PV = $522,000 + $529,200 + $526,400 + $514,800 + $497,000 + $3,479,000
During the fourth step, these amounts must be added to determine the presentvalue of all the cash flows and the terminal value: $6,068,400. This amount can bederived using a business calculator by entering the cash flows and terminal values foreach period and then discounting these amounts at the 15% rate.
Finally, AC computes the net present value (NPV) of the investment by subtractingthe initial cost of TC (the asking price of $6 million), from the present value of thecash flows and terminal value ($6,068,200), determining that the proposed investmenthas a net present value of $68,200. Thus, this project could be undertaken by AC. Ofcourse, AC would want to offer something less than $6 million possibly increasing theproject's NPV.
If AC has other potential projects with positive NPVs, AC should select the projector projects indicated by AC's capital rationing model, such as the profitability in-dex.4 Before proceeding, however, AC may want to do a sensitivity analysis, 2
particularly since the project only has a NPV of $68,200, assuming a $6 million pur-chase price.
XlI. NON-DCF VALUATION TECHNIQUES: COMPARABLE COMPANIES AND
COMPARABLE TRANSACTIONS42
A. Introduction to the Direct Comparisons
Professor Cornell states that "[e]conomic theory and common sense agree on thebasic principle that similar assets should sell at similar prices." ' Consequently, thevalue of an asset (i.e., a target) may be determined by referring to the value of a com-
419. See supra part III.A (containing chart from which discount factors are determined).420. See supra part III.F (discussing the profitability index).421. See supra part V.K (discussing sensitivity analyses).422. CORNELL, CORPORATB VALUATION, supra note 6, at 56-99 (providing a basis for this part).423. Id. at 56.
[Spring

Modem Valuation Techniques in Mergers and Acquisitions
parable asset (i.e., a comparable company) recently sold by a reasonably informed sellerto a reasonably informed purchaser. Professor Cornell refers to this as the direct com-parison approach.
If the size of the comparable company is not identical to the size of the target,which will normally be the case, the size difference can be adjusted for by identifyingan observable variable related to the price or value of both the comparable companyand the target. The fundamental assumption of the direct comparison approach is thatthe ratio of the price (P) of the comparable company to the observable variable (X) ofthe comparable company is approximately equal to the ratio of the value (T/) of thetarget to the observable variable (X) of the target.4 This approach works if both theprice and observable variable are available for the comparable company and the observ-able variable is available for the target/.4
Where V, is the value of the target, X, is the observable variable of the target, Pcis the price of the comparable firm or firms, and X is the observable variable of thecomparable firm or firms, the above principle may be expressed as:41
VT - PC
XT XC
The only unknown variable is V, which can be determined as:41
VT = XT*
XC
For example, assume that (1) the trading price of the comparable company (P) is $100per share, (2) the observable variable (X,) is earnings per share of $20, and (3) theobservable variable of the target (XT) is earnings per share of $10. The per share valueof the target (VT) is fifty dollars:
vT = $10ox $100$20
VT = $10 X 5
VT = $50
The above formula merely derives the per share value of the target by multiplying thetarget's earnings per share by the price earnings ratio of the comparable firm.
Professor Cornell points out that "a critical step in applying the direct comparisonapproach is choosing observable variables, X, that have a consistent relationship to val-
424. Id.425. IM at 57.426. Id.427. CORNELL, CORPORATE VALUATION, supm note 6, at 57.428. Id.
1996]

532 The Journal of Corporation Law [Spring
ue, V [and price, PJ." He further explains that in valuing companies, observablevariables such as "cash flow and earnings are good choices because the ultimate sourcesof value are the net benefits received by investors." 0
B. Equivalence Between Direct Comparison and Direct Capitalization"'
In the direct comparison approach, in determining the value of the target (V), theobservable variable of the target (X) is multiplied by the ratio of the price of the com-parable firm or firms (P.) to the observable variable of the comparable firm or firms(X):
PcVT = XT 0 P
An equivalent alternative approach to valuing the target is the direct capitalization meth-od, in which the value of the target (V) is the observable variable of the target (X)divided by the observable variable of the comparable firm or firms (X,) to the price ofthe comparable firm or firms (P,):
VT XTXC/Pc
The denominator of the above equation (XclP) is known as the capitalization rate, therate at which the observable variable of the target is capitalized to ascertain the value ofthe target.
The equivalence of the direct comparison and direct capitalization methods can bedemonstrated under the assumption that Xr = ten dollars per share, Pc = $100 per shareand X, = twenty dollars per share:
DTRET rOMPAR1SON )TRC' APTTAT T7ATTNVT = TPXT
xc xc/PC
VT = $10 . $100 $10$20 VT- $20/$100
VT = $10 e 5 VT = $10.2
VT = $50 VT =$50
429. Id.430. Ld.; see also btfra Appendix C, at C-5; Appendix D, at D-6 (demonstrating that both Lazard and
Wasserstein/Shearson used the direct comparison approach in valuing Warner).431. CORNELL, CORPORATE VALUATION, supra note 6, at 57-59.

Modem Valuation Techniques in Mergers and Acquisitions
The above equations demonstrate that in determining the target's value under the directcomparison approach, the target's observable variable (earnings per share) is multipliedby the price to earnings ratio (PcIX,) of the comparable company. In determining thetarget's value under the direct capitalization approach, the target's earnings per share isdivided by the earnings to price ratio (XClPc) of the comparable company.
Professor Cornell explains that the capitalization rate should not be confused withthe cost of capital used in the DCF model.432 He states that "situations in which thecost of capital can be used as a capitalization rate are extraordinarily rare." 33
C. Selecting Comparable Companies and Determining Multiples"'
The selection of comparable companies invariably involves judgment. One ap-proach focuses on companies doing business in the same standard industrial classifica-tion (SIC) code, published in the federal government's Standard Industrial Classifica-tion Manual. Another approach focuses on reports of securities analysts, which oftencontain lists of comparable firms. Yet another approach is to review reports of invest-ment research firms such as Standard & Poor's, Moody's, and Valueline. Industry ex-perts, including operations personnel at both the target and the acquiror, may also assistin identifying comparable companies.
Once the comparable companies are selected, the relationship between thecompanies' trading price and the observable variable such as the earnings are analyzed.For example, if the price to earnings (P:E) ratio is used, a mean and median P:E ratiofor the companies may be computed. In the P:E ratio the value indicator (P) is the com-parable firms' equity trading price, and the observable variable (E) represents the after-tax earnings of such firms. If a company has a significantly higher or lower P:E ratiothan is representative of the group, such "outliers" may be eliminated.435
The following example illustrates the above process: 436
Comparable Company Equity Value/1995 Earnings
1 20
2 25
3 25
4 15
5 15
Average 100/5 = 20 Median = 20
432. See supra parts VI and VII (discussing CAPM and APT, respectively).433. CORNEiL, CORPORATE VALUATION, supra note 6, at 58-59.434. Id. at 60-69.435. Il at 68.436. See, e.g., id4 at 67.
19961
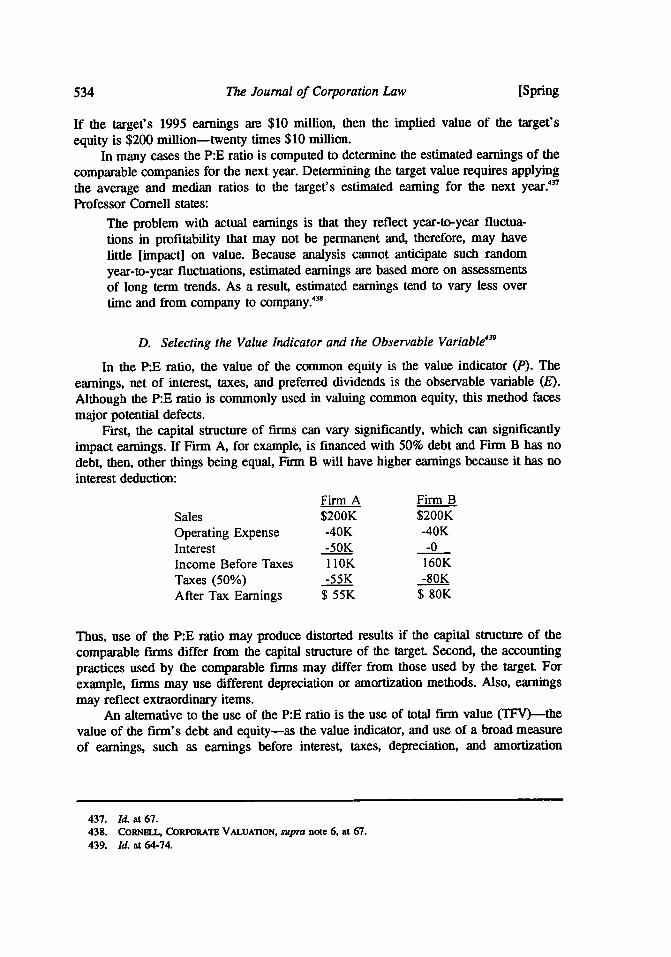
The Journal of Corporation Law
If the target's 1995 earnings are $10 million, then the implied value of the target'sequity is $200 million-twenty times $10 million.
In many cases the P:E ratio is computed to determine the estimated earnings of thecomparable companies for the next year. Determining the target value requires applyingthe average and median ratios to the target's estimated earning for the next yearfProfessor Cornell states:
The problem with actual earnings is that they reflect year-to-year fluctua-tions in profitability that may not be permanent and, therefore, may havelittle [impact] on value. Because analysis cannot anticipate such randomyear-to-year fluctuations, estimated earnings are based more on assessmentsof long term trends. As a result, estimated earnings tend to vary less overtime and from company to company.4
D. Selecting the Value Indicator and the Observable Variable'"
In the P:E ratio, the value of the common equity is the value indicator (P). Theearnings, net of interest, taxes, and preferred dividends is the observable variable (E).Although the P:E ratio is commonly used in valuing common equity, this method facesmajor potential defects.
First, the capital structure of firms can vary significantly, which can significantlyimpact earnings. If Firm A, for example, is financed with 50% debt and Firm B has nodebt, then, other things being equal, Firm B will have higher earnings because it has nointerest deduction:
Firm A Firm BSales $200K $200KOperating Expense -40K -40KInterest -50K -0Income Before Taxes 110K 160KTaxes (50%) -55K -80KAfter Tax Earnings $ 55K $ 80K
Thus, use of the P:E ratio may produce distorted results if the capital structure of thecomparable firms differ from the capital structure of the target. Second, the accountingpractices used by the comparable firms may differ from those used by the target. Forexample, firms may use different depreciation or amortization methods. Also, earningsmay reflect extraordinary items.
An alternative to the use of the P:E ratio is the use of total firm value (TFV)-thevalue of the firm's debt and equity-as the value indicator, and use of a broad measureof earnings, such as earnings before interest, taxes, depreciation, and amortization
437. Id. at 67.438. CORNIELL, CORPORATE VALUATION, supra note 6, at 67.439. Id. at 64-74.
[Spring

1996] Modem Valuation Techniques in Mergers and Acquisitions 535
(EBITDA) as the observable variable (E). Professor Cornell has examined the theoreti-cal reason for broadly measuring both firm value and earnings:
The view that broader measures of income are more appropriate is support-ed by the work of Miller and Modigliani. In several classic research papers,Modigliani and Miller present convincing arguments showing that the valueof the firm depends little, if at all, on the firm's capital structure. Therefore,the ratio of total firm value to a gross measure of income such as[EBITDA] should be similar even for firms with different capital struc-tures.44
The advantage of using the ratio of TFV to EBITDA can be illustrated. Assumethat Firms A and B are identified as comparable firms to the target. Firm A is financedwith 50% debt, with a principal amount of $500,000. The interest rate on the debt is10%, or $50,000 per year. The trading value of Firm A's common stock is $1 million.Firm B has no debt but has an amortization deduction attributable to an acquisition itmade. This amortization deduction is not accounted for in computing Firm B's taxes.The trading value of Firm B's common stock is $1.5 million. The reported earnings ofFirm A and Firm B are:
Firm A Firm BSales $200K $200KOperating Expense
other than depreciation -30K -30KDepreciation -20K -20KInterest -50K -0Income Before Taxes 100K 150KTaxes (50%) -50K -75KAfter Tax Earnings $ 50K $ 75KAmortization Deduction -0 - 10KReported Earnings $ 50K $ 65K
The P:E ratio of Firm A is twenty to one:
Price of Common Stock $1,000,000: Reported Earnings $50,000= $1,000,000 : $50,000= 20:1
The P:E ratio of Firm B is twenty-three to one:
Price of Common Stock $1,500,000: Reported Earnings $65,000= $1,500,000 : $65,000= 23.1:1
440. Id. at 71.

536 The Journal of Corporation Law [Spring
The EBITDA of Firms A and B are:
Firm A Finn BSales $200,000 $200,000Operating Expense
other than Depreciation -20,000 -20,000EBITDA $180,000 $180,000
Thus, when this broader measure of earnings is used, the firms have comparable earn-ings.
Here, the ratio of total firm value (TFV) can be used as the value indicator, andEBITDA can be used as the observable variable. Since Firm A has debt valued at$500,000 and common equity valued at $1 million, the TFV of Firm A is $1.5 million.Firm B has common stock with a value of $1.5 million and no debt. Therefore, its TFVis also $1.5 million. Since both Firm A and Firm B have the same TFV's and EBITDA,they each have an 8.3 to one ratio of TFV to EBITDA:
TVF ($1,500,000) : EBITDA ($180,000)- $1,500,000 : $180,000
= 8.3:1
If the target has EBITDA of $100,000, the estimated TFV of the target would be$830,000:
(Target's EBITDA) x (TFV:EBITDA Ratio of Comparable Firms) = Estimated TFV($100,000) x (8.3) = $830,000
The value of the target's common stock is $830,000, minus the value of its debt andpreferred stock.
In valuing a firm's debt and preferred stock for purposes of determining the totalfirm value (TFV), Professor Cornell posits that only comparable securities with compa-rable risk must be found. It is not necessary to find comparable firms. Professor Cornellelaborates:
It may seem paradoxical that firms that are not comparable can issue com-parable securities, but the paradox has a simple explanation. As long as acompany is not so highly leveraged that there is a significant risk of defaulton its fixed income securities, the prices of those securities depend primari-ly on the size of the promised payments and on the level of interest rates.Therefore, long-term debt or preferred stock issued by a medical supplycompany will be comparable to long-term debt or preferred stock issued bya computer company as long as the risk of default is similar.
441. Id. at 73.

Modem Valuation Techniques in Mergers and Acquisitions
In certain cases it may be appropriate to adjust the observable variable, such asearnings or EBITDA, to account for abnormalities. 2 For example, statistical methodsmay be used to calculate five-year averages in earnings. This average would reduce theimpact of abnormalities in earnings. As an alternative to statistical adjustments, theearnings or other observable variable may be directly adjusted to account for specificabnormalities. 3
E. Accounting for Control Premiums: The Comparable Transactions Approach
In identifying the value indicator, the current trading price of common equity ofcomparable firms may be used. However, this may understate the value of the targetbecause the current trading price may not reflect a "control premium".'" The pricereflecting a control premium is probably a better value indicator in determining thevalue of the target in a change of control transaction. Identifying comparable companiesthat have undergone comparable transactions is important in focusing on a control pre-mium. Alternatively, a control premium may be added to the value determined using thetrading value as the value indicator. Professor Cornell indicates that "it is safe to saythat the estimate of value derived from the market prices of securities establishes a floorbeneath a company's value. Under certain circumstances, the appraiser may choose toelevate the appraised value above that floor to take into account a control premi-um,"
445
F. Applicability of the Direct Comparison Approach in Time-Warner
Both Wasserstein/Shearson" and Lazard"7 used the direct comparison ap-proach in valuing Warner, and both used the comparable transaction approach and thecomparable companies approach. One of the Value Indicators Wasserstein/Shearsonused in its comparable transactions model was transaction value Net Debt, comprisingthe total firm value (TFV). Both Net Sales and EB1T were used as observable variables,constituting two broad measures of economic activity. A mean, median, high, and lowwere computed in determining the multiple of Net Sales (EBIT) to TFV (the ratio be-tween TFV and Net Sales, and TFV and EBT. The implied value of the assets of theFilm Entertainment segment was then determined by multiplying the 1989 Net Salesand EBIT for that segment by the mean, median, high, and low multipliers."
A similar procedure was followed with Wasserstein\Shearson's comparable compa-nies analysis," 9 except that a 50% control premium was added to the implied asset
442. Id. at 75-87.443. CORNELL, CORPORATE VALUATION, supra note 6, at 83-86.444. Id. at 87.445. Id.; see also Kleinwort Benson LTD. v. Silgon Corp., 1995 WL 376911, at *2-4 (Del. Ch. 1995)
(discussing control premiums).446. See infra Appendix C, at C-4 (illustrating Wasserstein/Shearson's use of the comparable transaction
approach); Appendix C, at C-5 (illustrating the comparable companies analysis).447. See infra Appendix D, at D-5 (illustrating Lazard's use of the comparable companies approach);
Appendix D, at D-6 (illustrating the comparable transaction analysis).448. See infra Appendix C, at C-4 (illustrating Wasserstein/Shearson's comparable transactions approach).449. See infra Appendix C, at C-5 (illustrating the comparable companies approach).
1996]

The Journal of Corporation Law
values. The addition of a control premium to the trading value is one of the techniquessuggested by Professor Comell!'
Lazard uses two value indicators in its comparable companies approach:45 (1)market cap-the total value of the firm's equity and debt, and (2) market value---thevalue of the firm's common stock. Lazard used: (1) revenues, (2) EBITDA, (3) operat-ing income (i.e., income after depreciation), and (4) net income (i.e., income after de-preciation, interest, and taxes) as observable variables, ranging from the broadest (reve-nues) to the narrowest (net income). For net income, the ratio is market value (i.e.,value of common equity) to net income. The ratio for the other three observable vari-
ables is market cap (i.e., TFV) to revenues, market cap to EBIT, and market cap tooperating income, respectively. The low and high multiples for each of these ratios are
computed for the selected comparable public companies and these multipliers are usedin computing the implied value range of Warner based on its 1989 estimated revenues,EB1TDA, operating income, and net income.
Lazard used a similar process in analyzing comparable acquisitions. Only themarket cap and market value used therein differ, in that they reflect a control premium.
XIII. CONCLUSION
DCF, CAPM, APT, and WACC are powerful economic models used in making
capital budgeting decisions, including the valuation of a target firm in a merger or ac-quisition context. Although the concepts behind these models may appear mystical, theapplication of the concepts is straightforward in the acquisition context. A five-stepprocess for applying these concepts is utilized:
First, the periodic and terminal free and negative cash flows that the target is ex-
pected to produce is estimated. In making these projections, all-equity financing is as-sumed so that there is no deduction for interest in computing taxes. The expected actualtax liability, accounting for depreciation, is also deducted. Depreciation and other non-cash expenses are added back, and expected costs of future capital improvements arededucted. Thus, this projects the target's pure cash flows.!" If CAPM or APT is usedto determine the discount rate, the cash flows associated with costs (such as stock ordebt issuance costs) and benefits (such as tax benefits from the interest deduction) ofthe financing structure are separately projected!4 ' This is not done if WACC is used.
Second, the appropriate discount rate for the target utilizing CAPM, APT, orWACC is determined.4 If the target has several lines of business, the appropriate dis-count rate must be determined for each business. The use of WACC is appropriate onlyif the target is engaged in the same line of business as the acquiror, and the acquisitionis financed with the same proportion of debt and equity that the acquiror has outstand-
450. See supra part XII.E (discussing the treatment of control premiums).
451. See infra Appendix D, at D-5 (illustrating Lazard's comparable companies approach at part 1I).452. See infra Appendix D, at D-6 (illustrating Lazard's comparable transaction approach at part IV).
453. See supra part V (discussing the estimation of free cash flows).
454. See supra part VIII (discussing the interaction between the financing decision and the investmentdecision).
455. See supra parts VI, VII, IX (discussing CAPM, APT, and WACC, respectively).
[Spring

Modem Valuation Techniques in Mergers and Acquisitions
ing. If WACC is used, the cost of equity will generally be determined through the useof CAPM or APT.4 6
Third, using the DCF model and the appropriate discount rate, the target's expectedperiodic and terminal free and negative cash flows are discounted to present value. IfCAPM or APT is used, the expected cash flows from the costs and benefits of the fi-nancing structure, such as the tax savings from the interest deduction, will be discount-ed with the other cash flows from operations. If WACC is used, the tax benefit of theinterest deduction is automatically taken into account in determining the cost of debt,leading to a cost of capital lower than would be the case using CAPM or APT.4'
Fourth, the present value of the target's cash flows is determined by adding thepositive present values of the free cash flows and the negative present values of thenegative cash flows. Any outstanding debt that the target has is subtracted and the valueof any investment securities and other such items is added in computing the presentvalue.
Fifth, the net present value (NPV) is determined by subtracting the purchase pricefor the target from the present value of the target. If CAPM or APT is used in deter-mining the cost of capital, and the costs and benefits of the financing decision are dis-counted, the NPV is referred to as adjusted NPV (APV), because the present value ofthe financing costs and benefits are taken into account. If the cost of capital can beappropriately determined by either using WACC, on the one hand, or CAPM or APT,on the other, the final NPV will be the same provided the financing effects are properlyaccounted for in applying the particular method.!'
Finally, in applying the valuation steps, Brealey and Myers have warned that:"even the brightest and best-trained analyst can make large errors in valuing a business.The estimated net gain [i.e., NPV] may come up positive not because the merger makessense, but simply because the analyst's cash flow forecasts are too optimistic."-" Tothis warning should be added another: a positive NPV may also be attributable to aninappropriately low discount rate. Thus, whenever there is a positive NPV, the valuationanalyst should clearly demonstrate that the acquisition is likely to produce economicrents, that is, excess profits.
456. See supra part IX (discussing WACC).457. Id.458. Id.459. BRBALY & MYERs, supra note 6, at 820.
1996]


APPENDIX A
EXCERPTS FROM JOINT TIME AND WARNER INFORMATION STATEMENT AND TIMEPROSPECTUS DATED DECEMBER 6, 1989
The Company. [Warner Communications] At the June 16, 1989 meeting of theCompany's Board of Directors all of the directors present at such meeting unanimouslyapproved and adopted the Merger Agreement and recommended that all stockholdersaccept the Offer and tender their shares in the Offer.
In making the determination on June 16, 1989 that the Offer was, and the Mergeris, fair to, and in the best interests of, the stockholders of the Company and recom-mending that stockholders of the Company tender their shares in the Offer and approveand adopt the Merger Agreement, the Board of Directors of the Company considered anumber of factors, including the following:
(iv) The oral and written presentations of Lazard delivered to the Boardof Directors at its meeting on June 16, 1989, including Lazard's oral opin-ion to the effect that, as of June 16, 1989, the consideration to be receivedin the Offer and the Merger, when taken together, is fair to the stockholdersof the Company from a financial point of view (a copy of such opinion asconfirmed in writing and setting forth the assumptions made, matters con-sidered, and procedures followed by Lazard, is discussed herein under"--Opinions of Financial Advisors" and set forth in Annex F hereto);
(d) The oral presentation of Lazard referred to in paragraph (iv) aboveincluded a detailed summary by representatives of Lazard of its writtenpresentation, which is described under the heading "Fairness Opinion of theCompany's Financial Advisor" and which is included as an exhibit to theSchedule 13E-3. The Lazard Presentation (as defined below) set forth rang-es of values by a variety of valuation analyses of the Company, includingpre-tax segment valuations of the Company and its businesses, as well asdiscounted cash flow and equity present value analyses. See "Opinions ofFinancial Advisors-Fairness Opinion of the Company's Financial Advi-sors". In connection with their consideration of such information, the di-rectors asked the Lazard representatives questions concerning the presenta-tion and commented on the content of the presentation. This presentation

A-2 The Journal of Corporation Law [Spring
was strongly favorable to the Board's determination and while the Boarddid not take any specific action with respect to the presentation, in makingits favorable determination regarding the Merger, the Board accepted theoverall analyses and conclusions of the Lazard Presentation.
Fairness Opinion of the Company's Financial Advisor
Lazard has delivered its written opinion to the Board of Directors of the Companyto the effect that, as of June 16, 1989, the consideration to be received by theCompany's stockholders in the Offer and the Merger, when taken together, is fair to theCompany's stockholders from a financial point of view. A copy of this opinion ofLazard is attached hereto as Annex F '. Company stockholders are urged to read thisopinion in its entirety for assumptions made, matters considered and limits of the reviewby Lazard.
The information contained in the Lazard Presentation, including the pre-tax seg-ment valuation of the Company and its businesses and the discounted cash flow andequity present value analyses, was based on the information reviewed and factors con-sidered by Lazard in rendering its fairness opinion, discussed above, and does not re-flect, among other things, actual financial results of the Company to date, revised pros-pects for the Company's businesses, changes in general business and economic condi-tions or any other transaction or event that has occurred or that may occur and that wasnot anticipated at the time such information was prepared, including the recent sale of amajor motion picture studio.
(i) Pre-tax Segment Valuation Analyses. Lazard performed its pre-taxsegment valuation of the Company and its businesses through discountedcash flow analyses, comparable acquisitions analyses and analyses of thepublic market trading values and private market values of comparable com-panies for each of the filmed entertainment, recorded music/music publish-ing, cable and broadcasting and publishing and related distribution segmentsof the Company.' Such analyses were based in part on certain projectionsprovided to Lazard by the Company. See "--Certain Estimated FinancialInformation". Based on such projections and analyses, and subject to theassumptions set forth in the Lazard Presentation, Lazard estimated that,based on the various analyses described above, the Company had a pre-taxhypothetical break-up value at the time of the Lazard Presentation of be-tween $13.05 billion and $15.36 billion or between $65.92 and $77.57 pershare.
1. See Appendix B.2. See Appendix D, pages D-5 and D-6 (regarding the film segment).

Appendix A
(ii) Discounted Cash Flow and Equity Present Value Analyses. TheLazard Presentation also contained a consolidated unleveraged discountedcash flow analysis of the Company, which was based in part on the projec-tions provided to Lazard by the Company See "-Certain Estimated Fi-nancial Information". Based on the projected future cash flow of the Com-pany for 1989 through 1994 derived from such projections and discountrates (ranging from 9.5% to 13.5%) believed to reflect the Company'sweighted average cost of capital, and estimated cash flow multiples of 9 to11, Lazard estimated that the total value of the Company's assets, less netdebt of $970 million (as of March 31, 1989 and including the impact of theacquisition of Lorimar), ranged from approximately $55.55 to $80.13 pershare. In addition, the Lazard Presentation contained a discounted presentvalue analysis of the Company's potential stock price in a stand-alone sce-nario, which also was based in part on the projections provided to Lazardby the Company. Based on estimates of earnings per share derived fromsuch projections and using equity discount rates of 12%, 14% and 16% andprice-to-earnings multiples of 16, 18 and 20, Lazard estimated that the netpresent discounted value of the Company's shares in a stand-alone scenarioranged from approximately $43.75 to $62.99 per share.'
(iii) Research Analyst Reports. The Lazard Presentation also containeda summary (without an endorsement) of previously published reports pre-pared by research analysts at ten other nationally recognized investmentbanking firms which set forth pre-tax break-up analysis valuations of theCompany that ranged in value from $53.68 per share to $76.21 per share,with an average value of $62.71 per share.
Fairness Opinions of Time Warner's Financial Advisors
Each of Wasserstein Perella and Shearson Lehman has delivered a written opinionto the Board of Directors of Time Warner to the effect that, as of June 16, 1989, thefinancial terms of the acquisition (as set forth in the Merger Agreement in effect onsuch date) of the Company by Time Warner are fair to Time Warner and its stockhold-ers from a financial point of view.
In connection with rendering their fairness opinions and with certain opinions giv-en in connection with the KDS Offer and the Amended KDS Offer, Wasserstein Perellaand Shearson Lehman made four presentations to the Board of Directors of Time
3. See Appendix D, page D-4.4. See Appendix D, page D-4.5. See Appendix D, pages D-2 and D-3.
1996]

The Journal of Corporation Law
Warner at meetings held on June 8, 1989, June 11, 1989, June 15-16, 1989, and June26, 1989 (collectively, the "June Presentations").
The information contained in the June Presentations, including the pre-tax segmentvaluations of the Company and its businesses, was based upon the information reviewedand factors considered by Wasserstein Perella and Shearson Lehman in rendering theirrespective fairness opinions, discussed above, and does not reflect, among other things,actual financial results of the Company to date, revised prospects for the Company'sbusinesses, changes in general business and economic conditions or any other transac-tion or event that has occurred or that may occur and that was not anticipated at thetime such information was prepared, including the recent sale of a major motion picturestudio.
(i) Pre-tax Segment Valuation. Wasserstein Perella and ShearsonLehman performed their pre-tax segment valuation of the Company throughdiscounted cash flow analyses,6 comparable acquisitions analyses and analy-ses of the public market trading values and private market values of com-parable companies' for each of the filmed entertainment, music/music pub-lishing, cable television, publishing and Lorimar units of the Company.'Such analyses were based in part on certain estimated financial informationfor 1989 and 1990 provided to Wasserstein Perella and Shearson Lehmanby the Company and on extrapolations of such projections through 1998performed by Wasserstein Perella and Shearson Lehman." See "--CertainEstimated Financial Information". Based on such projections and analyses,Wasserstein Perella and Shearson Lehman estimated that the Company hada pre-tax value at the time of the June Presentations of between $13.58 bil-lion and $15.31 billion or between $68.40 and $77.12 per share."
(ii) Comparable Acquisition Multiples. Wasserstein Perella andShearson Lehman also reviewed multiples of revenue and operating incomein five acquisitions of media companies since November 1987. Multiples ofrevenues in such acquisitions ranged from 1.3 to 4.0 and averaged 2.56.Multiples of operating income in such acquisitions ranged from 10.0 to 35.8and averaged 22.13, although such multiple was not available for one acqui-sition and not material for another. By contrast, a $70 per share acquisitionof the Company would represent a multiple of revenues equal to 2.5 and amultiple of operating income equal to 17.8.
6. See Appendix C, pages C-2 and C-3 (regarding DCF and the film segment).7. See Appendix C, page C-4 (involving comparable transactions analysis and the film segment).8. See Appendix C, page C-5 (illustrating comparable companies analysis and the film segment).9. See Appendix C, page C-6 (sumnmarizing pe-tax segment valuationof assets).
10. See Appendix C, page C-2 (regarding the film segment).11. See Appendix C, page C-7 (summarizing pre-tax segment valuation of equity).
[Spring

1996] Appendix A A-5
(iii) Research Analyst Reports. At the June 26, 1989 meeting of theBoard of Directors of Time Warner, Wasserstein Perella and ShearsonLehman also presented the published comments of two independent researchanalysts concerning the value of Time Warner after the Merger. WassersteinPerella and Shearson Lehman discussed the fact that both reports estimatedthat Time Warner should be valued at $173 per share after the Merger.Each of Wasserstein Perella and Shearson Lehman stated that such estimateswere not estimates by Wasserstein Perella or Shearson Lehman of the valueof Time Warner after the Merger and were provided for comparative pur-poses only.

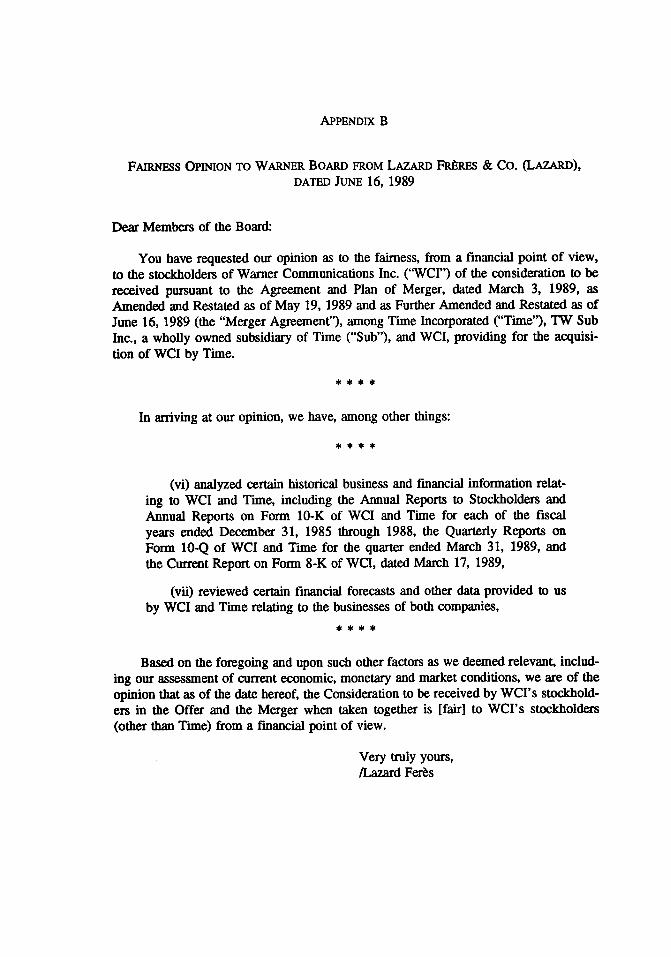
APPENDIX B
FAIRNESS OPINION TO WARNER BOARD FROM LAZARD FRPRE & CO. (LAZARD),DATED JUNE 16, 1989
Dear Members of the Board:
You have requested our opinion as to the fairness, from a financial point of view,to the stockholders of Warner Communications Inc. ('WCI") of the consideration to bereceived pursuant to the Agreement and Plan of Merger, dated March 3, 1989, asAmended and Restated as of May 19, 1989 and as Further Amended and Restated as ofJune 16, 1989 (the "Merger Agreement"), among Time Incorporated ("Time"), TW SubInc., a wholly owned subsidiary of Time ("Sub"), and WCI, providing for the acquisi-tion of WCI by Time.
In arriving at our opinion, we have, among other things:
(vi) analyzed certain historical business and financial information relat-ing to WCI and Time, including the Annual Reports to Stockholders andAnnual Reports on Form 10-K of WCI and Time for each of the fiscalyears ended December 31, 1985 through 1988, the Quarterly Reports onForm 10-Q of WCI and Time for the quarter ended March 31, 1989, andthe Current Report on Form 8-K of WCI, dated March 17, 1989,
(vii) reviewed certain financial forecasts and other data provided to usby WCI and Time relating to the businesses of both companies,
Based on the foregoing and upon such other factors as we deemed relevant, includ-ing our assessment of current economic, monetary and market conditions, we are of theopinion that as of the date hereof, the Consideration to be received by WCI's stockhold-ers in the Offer and the Merger when taken together is [fair] to WCI's stockholders(other than Time) from a financial point of view.
Very truly yours,/Lazard Ferns


APPENDIX C
EXCERPTS FROM JOINT PRESENTATION BY WASSERSTEIN PERELLA & CO., INC. AND
SHEARSON LEHMAN HUTTON, INC. TO TIME'S BOARD:EXHIBIT (B)(5) TO SCHEDULE 13E-3

The Journal of Corporation Law
z
,-
Wu C'.a 0
[Spring

1996]
CnQ
L.
em
.5"
0.= .30. >
Cr .3Cr C.) A-'.3
CC)) 000C"~ C)
.3~ 00A
Pr.- PP A3O .CA0r
'.-C~Arr)OOOP
Po .3 C.P ) .3 CP -'P .P
0 -'C) 00 00Cr0 r.30
5'0 Fo P
P.- P" 00 , P3 w0Cr w !.4CP-AOO.OwO;OO
-mJ-OOwOwO;OOO
Cr .P .3C .3 '
;MMOO00WO30O;000
a a a *a Z
Cr~0 Cr00 Cr~r r. toP P J 9OO ) 9 0 9*9-000
WiwoAw - o
II Cr o b
II Cr 0.3 A"wr 0-'Cr
ml~ 0 N 0
0 -' -4
0
: owoII o 0
I 0 . 000
Cr 0.30
l o1 .
": o
11r A-'~
A = 'pCr 0b.30
In ' -
": b
Appendix C
0?0Cc0Cr > C '
<
5 0
o ~ CC ~ Z -n R ,7,
0 0 CDIC CC
5 a
SCr Cr'0 Cr
~ V
- a
- S- a
:Ei00
'0 r
:>
, z
-4
00 Cr C
0. N D~
0. 110 .
0 I Cr 'C
0. -o '5C
00 .3 Cr
Or I0..
08 Cr" C
F Cr,0aI.3.
00 1
C
oo m4,
0-4 0 A
00o r"
Cr,
Po P5) '
t 0
0.
co
Cr Cr
.o
.-. .3
o3'.0.C
.3 ' -
90
00
* Cr
.3,
co C
'Cr
Iwo,
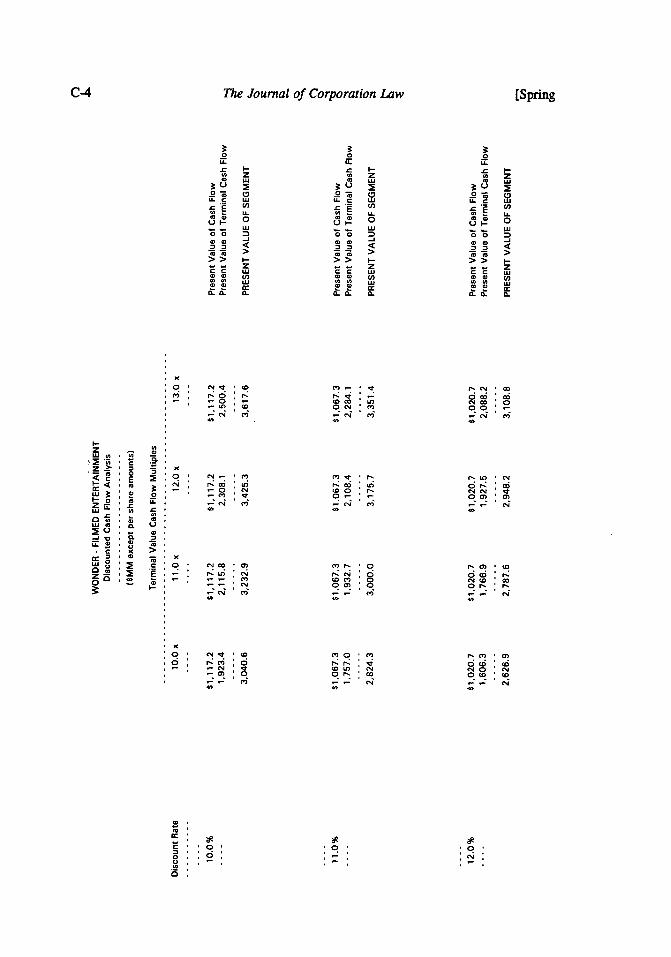
The Journal of Corporation Law
qo coi ' t.;; q M 'v,.. C., *ON *
A-
z -
-J a
0 E
[Spring
*e
'2' '0'N '
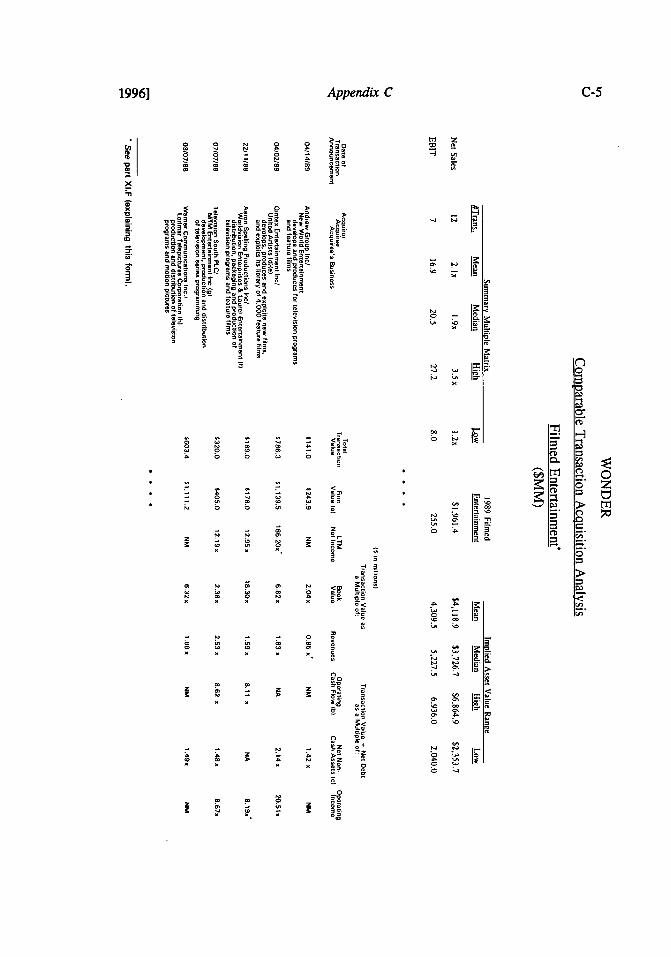
1996] Appendix C C-5
Sm z
A. A .W
_x
A j - . -.
03
4-
3 A<~ AW~~ >< - C
,o3',, . _. o"
- AS -. A A:_- 00
x x
WW5 C3
- e >
z z..
X -. QSLA (
~ 3.. OW SSC cE
- 0 A~ ~3O 0 5 3~z
> ~W5 C
X X 1
R.00
AI~<W)OC I

The Journal of Corporation Law
z
O0 0 z
v q
C 0
2
z CNN
C 4C N N
lz
CO ON
CNi
2:;ZZU
v6u6
0 ii1W
NSd
C I III
00000- - NA
0NC
ig z:
*z~ ::
CC)"il
CCC I)
NC.- ) I
7- 7- E
0)C E 'E -N* ,~ 6
.~ ! A0 000 0 0 ;6
[Spring
ziG,
'-NC II x
C
(U-
tE
<<w00
U U
zC
O2
cdoo.-oz
2,,0I C C
F6
E:

19961 Appendix C C-7
OQF•J N a " "
- 0 0 000 0 0 0
o o o oj
Ca)(A) ( N) >
0 0 0 0 0o 0 0 0 0 0
,??.
) o 0a 0
w) 14 0) K)~A) 0 0 0 01 0 'o 0 0 0 0 0
z~ ~~ 0 n>( U 0.> 0 S
>) 4 CA) o >
C) 0 0 0 ) 0oz o 0 0 00
0-4 Z 0
o0 001 0 0 0
0 n 0 0
zo n G)
o 0D 0 0o0 0 0 00

The Journal of Corporation Law
00
0
0 00
M ,
0 m a
N - alc
"1 10 160
-aa, m ,MQ~~a a
0 0 00 81
0 0 0 1 010a, N.N1 "mN a, N-
ai.OI~
a'.a
iTCd) 4)
,0a,.00 0 a00000 O O I 0. . . . . . . . . . Oa N •
a I
0.)
•
.' -n- .
[Spring
4)

Appendix C19961
yy Cr -
rr .3
CC o~ CC"
Sm00
w _o2Cr C:
CC:t 0:03 i Wr: Af r
-03 -~ ~'~5 Cr'; : to:Cr:-:
Cr-C 0 Ato 03: 030 to:to -'-.3HP' w ~A 559 Cr5~ H5PCH9 955" PYP':Cr03 0 Cr-' -.3:0 -. 3:0 -:CroCr 0:0 0:-.3:fl -
00 o O-5
fl
Cr:0 0
Po o
H!" L, o P59 C5
9[
!Opp
p.3 -
Cr woo
Cr: Cr: -03:Cr -.C:Cr:Cr0 Cr'-.)'Cr:w 03:0:to:o to:-:
e.ao - go:
oo
0ioo.
C . 'o
0 0.
o c: o-
66 CrP:000FP
00 woo
00 -:oo rbto
r ~
S
0: 0
0 -P,00
i. 1C ttob 030000 to:03 :3
Cr 0: Cr: r CCr: ~ ! 1 P: - -.-. 3 €0,r Cr: Cr :0
Cr. t o::-:oo :ooo- to:Cr
03: 03 C C:-: -'Cr= Cr:
r Z' 0 0: 0 -- Cr:- 2.: 03: 0
0- - Or0' 0' 0:00" rC 0- rt' t
o: -:
0: 0:j
C:-
0: -.j
0o:-:0 0:.
Wo: 6bb959999w 000w
03-0:
o:. 0:00
w3 c-: C
CrF: 0 F:w: Cr;o
CrO :o -: M -: 1- to:-:o -:000
Cr: CrC>Cr Cr0 b ' r I 03:-:i i'o
Cr: Cr
Cr: 000Cr-: coo-
oo ~o ~ r - , , - S w ooSPto 303 0 ~ 0: ~ Cr C:Cr Cr:: .3o-.033 0 33 C' Cr r-Rr*r0 'r r C' C
, l
03: Cr 6 -oJ b "
0: = -'03
CCio -. 3oo000 ,
P P. .o>,0.t 03 0
'o 6 6


APPENDIX D
EXCERPTS FROM THE PRESENTATION TO THE WARNER BOARD BY LAZARD REGARDING
THE VALUATION OF WARNER: EXHIBrr (B)(2) TO THE TIME/WARNER SCHEDULE 13E-3

D-2 The Journal of Corporation Law [Spring
PC'
PC-
rjO
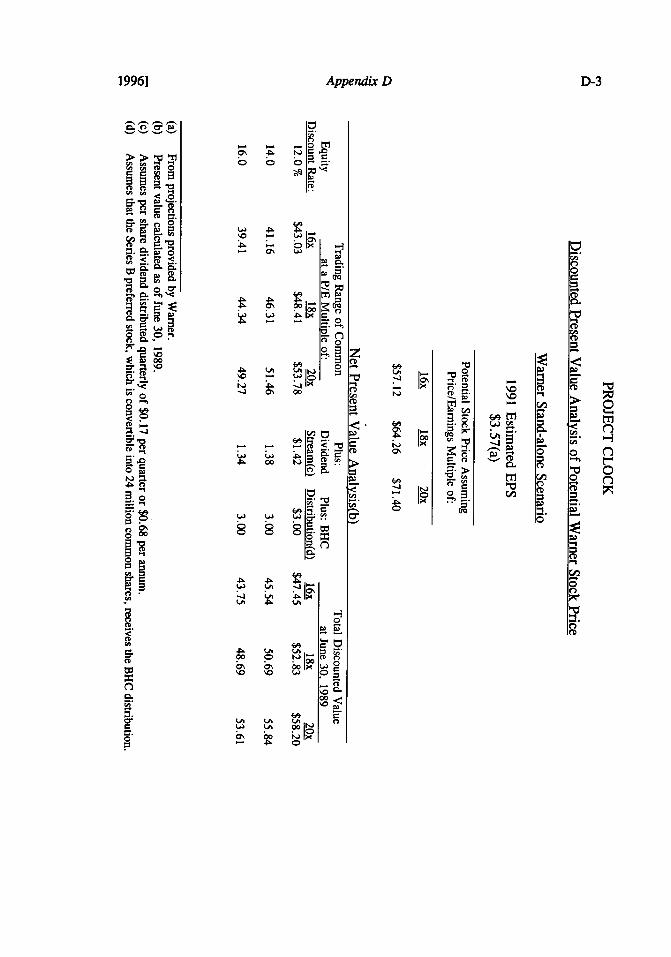
0% .~ g08
.
00o
-~00
ct-.
n0
00
-J
1996] Appendix D
T90 1 ;;6 >4
IV00
0
0-.
A. 00 n
6q

D-4 The Journal of Corporation Law [Spring
60!0
00*
000
r- el -0
00 0
PLO 000~~ 0 00q
Q 0 0 00 U-
o 0~'
4. QON -
o zC.0 7E) Ea
4.)4
CO 0.
COa

1996] Appendix D
o M %D
m 00
0.2
a.
OR w. I=4
0S
-4 =. 0 ' so
.0 " -- " -" -
a, rlj 0 og 0
'of @
00 -4'01
0.a
0 0
LACW 00 w L 0
0
ft 5'-<
m0.0
Ce 0
S ~
- 000
Oh -

The Journal of Corporation Law [Spring
60) 00
0 .04a
*0
A 0
ink
on~o
> z9
.w0
.09L

1996]
00 0.a,-a 00
00 w,
,j 00
Appendi D
=. ,- -~
0'
- o
o w~ tA 0'
w LA~ 00 4LA= 9,4


APPENDIX E
SOLVENCY OPINION ISSUED BY THE MANUFACTURER'S APPRAISAL COMPANY TO THELENDERS IN TIME'S ACQUISITION OF WARNER: SCHEDULE (B)(15) TO THE
TIME/WARNER SCHEDULE 13E-3
THE MANUFACTURERS' APPRAISAL COMPANY
The Lenders now or hereafterparties to the Credit Agreement
Ladies and Gentlemen:
Pursuant to an Amended and Restated Agreement and Plan of Merger dated as ofJune 16, 1989 (the "Merger Agreement"), among Time Incorporated ("Time"), TW SubInc. ("the Merger Sub") and Warner Communications Inc. ('Warner"), and the relatedOffer to Purchase of Time dated June 16, 1989, Time has offered to purchase 100 mil-lion outstanding shares of Common Stock, par value $1 per share (the "Shares"), ofWarner at $70.00 per share (the "Tender Offer").
The amount required to purchase 100 million shares and to pay related fees andexpenses is estimated to be $7.3 billion, and the amount required to pay the MergerConsideration will depend on the portion of the Merger Consideration which is cash. Atleast one half of the Merger Consideration will be comprised of equity securities ofTime.
Finally, we have assumed for the purposes of this letter that the Credit Agreementswill be refinanced on the Merger Date through a new bank facility of facilities in anaggregate principal amount of at least $11.5 billion, having a final maturity of sevenyears and an average life of approximately four years.
The aforementioned transactions including the Merger and the transaction resultingfrom the Tender Offer are hereinafter referred to collectively as the "Transactions." Thefinancing vehicles related to the Transactions are hereinafter referred to collectively asthe "Financing." The merged entity resulting from the effectuation of the Transactions,consisting essentially of Time and Warner and their respective businesses, is hereinafterreferred to as the "Company."

E-2 The Journal of Corporation Law [Spring
You have requested our opinion as to whether, after giving effect to the Transac-
tions and the Financing:
(i) On a pro forma basis, the fair saleable value of the Company's assets ex-ceeds its stated liabilities, including identified contingent liabilities.
(ii) The Company will be able to pay its debts when due.(iii) The Company will not have unreasonably small capital with which to con-
duct its business.
For purposes of this letter, certain terms are defined as follows:
(1) "fair saleable value" is defined as the aggregate amount at which the assetsof the Company, valued in its entirety as a going concern, would changehands in the open market, assuming a sale by a willing buyer to a willingpurchaser dealing at arm's length, each having reasonable knowledge of all
relevant facts, with neither party being under any compulsion to act. We be-
lieve that this is a reasonable basis on which to value the Company, andnothing has come to our attention which causes us to believe that the Com-
pany both before and after the Transactions and the Financing is not a goingconcern;
(3) "able to pay its debts when due" means that, assuming the Transactions andthe Financing have been consummated as proposed, during the period cov-ered by the financial projections prepared by management of the Company,the cash flow of the Company will be sufficient to provide cash necessary topay the Company's debts (including those related to contingent liabilities) assuch debts mature and become due; and
(4) "will not have unreasonably small capital with which to conduct its business"means that the Company will not lack sufficient capital for the needs (includ-ing the anticipated needs) for capital of its businesses, including requirementsrelated to contingent liabilities, as management of the Company has indicatedthe business of the Company is proposed to be conducted following the con-summation of the Transactions, and after giving due consideration to theprevailing practices in the industries in which it will be engaged.
In the course of rendering the opinion contained in this letter, we visitedvarious of the Company's facilities, and interviewed certain Company per-
sonnel, including management. Furthermore, we reviewed and consideredvarious data, including but not limited to, the following:
(7) Financial models, including pro forma income statements, balance sheets,cash flow statements, and supporting schedules reflecting the subject Transactions.

19961 Appendix E E-3
While various judgments and estimates which consider reasonable and appropriateunder the circumstances were made by us in the determination of fair saleable value, noassurance can be given by us that the sale price which might ultimately be realized inan actual transaction, if and when effected, will be at the fair saleable value estimateresulting from our analysis.

APPENDIX F
EXCERPT FROM JOINT BANK AMERICA (BAC) AND SECURITY PACIFIC (SPC) PRoxYSTATEMENTS AND BANK AMERICA PROSPECTUS, DATED NOVEMBER 14, 1991
OPINIONS OF FINANCIAL ADVISORS
BAC. BAC has retained Morgan Stanley to act as its financial advisor in connec-tion with the Merger. Morgan Stanley delivered to the BAC Board of Directors its writ-ten opinion that, based upon and subject to the factors and assumptions set forth in thewritten opinion, on August 11, 1991 the Conversion Ratio was fair from a financialpoint of view to BAC. No limitations were imposed by BAC with respect to the investi-gations made or the procedures followed by Morgan Stanley in rendering its opinion.
The full text of the opinion of Morgan Stanley, which sets forth assumptions made,matters considered and limitations on the review undertaken by Morgan Stanley, isattached as Annex 5 to this Joint Proxy Statement. BAC shareholders are urged to readthe opinion in its entirety. Morgan Stanley's opinion is directed only to the ConversionRatio and does not constitute a recommendation to any BAC shareholder as to howsuch shareholder should vote at the BAC Meeting. The summary of the opinion ofMorgan Stanley set forth in this Joint Proxy Statement is qualified in its entirety byreference to the opinion.
The following is a summary of the analyses Morgan Stanley utilized in arriving atits opinion as to the fairness of the Conversion Ratio and that Morgan Stanley discussedwith the BAC Board of Directors on August 10 and 11, 1991.
Overview of SPC. Morgan Stanley evaluated the positions and strengthsof SPC in certain lines of business, certain financial and operating informa-tion of SPC (including historical net income, nonperforming assets, netcharge-off ratios and the breakdown of the loan portfolio), SPC's announcedrestructuring plans and the stock market trading history of SPC.
In addition, Morgan Stanley reviewed the historical market to bookmultiples of SPC and BAC and the relationship between movements of suchcommon stocks and movements of a composite index comprised of compa-rable bank holding companies.
SPC Valuation Analysis. Morgan Stanley arrived at values for SPCusing four valuation methodologies: an analysis of the relationship betweenreturn on equity and price to book value ratio; a comparable company anal-ysis; an analysis of prices and terms of recent mergers and acquisitions in-

The Journal of Corporation Law
volving comparable bank holding companies and a dividend discount analy-sis. These methodologies are discussed below:
Analysis of Relationship Between Return on Equity and Price toBook Value. Based on a sampling of approximately 40 publicly tradedbank holding companies, Morgan Stanley determined a theoreticalrelationship in the market between the ratio of expected sustainablereturn on equity to risk-adjusted required return on investment andprice to book value.
Comparable Company Analysis. Comparable company analysisanalyzes a company's operating performance relative to a group ofpublicity traded peers. Based on relative performance and outlook fora company versus its peers, this analysis enables an implied unaffect-ed market trading value to be determined.
Comparable Merger and Acquisition Analysis. Comparable merg-er and acquisition analysis provides a valuation range based uponpremiums paid for selected bank holding companies in recent trans-actions.
Dividend Discount Analysis. The stand-alone valuation of SPCwas estimated by adding (i) the present value of future dividendstreams that SPC could produce over a five-year period from 1992through 1996 and (ii) the present value of SPC's 1996 terminal value.The terminal value of SPC's common equity at the end of the five-year period was determined by applying a range of multiples (from1.Ox to 1.2x) to SPC's terminal year book value. Earnings were pro-jected assuming SPC performed in accordance with forecasted resultsof operations and certain variations thereof. The dividend streams andterminal values were discounted to present values using a range ofdiscount rates (from 15% to 16%) chosen to reflect different assump-tions regarding the required rates of return of holders or prospectivebuyers of SPC's common equity. The hypothetical maximum value ofSPC to BAC was determined by adding the range of stand-alone valu-ations of SPC (which ranged from approximately $23.50 to approxi-mately $32.50 per share of SPC Common Stock) to the present valueof after-tax cost savings, net of merger expenses and deposit-run off(the total of which was assumed to be approximately $28 per share ofSPC Common Stock), resulting in a range of $51.50 to $60.50 per
[Spring

1996] Appendix F F-3
share of SPC Common Stock. This valuation method allocates all ofthe cost savings to SPC's value, even though SPC could not generatethose values as an independent concern. In addition, this valuationdoes not reflect the fact that on October 15, 1991, SPC announcedthat its Board of Directors suspended the payment of further cashdividends on shares of SPC Common Stock.