Embed Size (px)
Citation preview

A KALEIDOSCOPE OF CULTURE:
MEASURING THE DIVERSITY OF CHICAGO’S
NEIGHBORHOODS
School of Public Service Policy Study
Chaddick Institute for Metropolitan Development 243 S. Wabash Avenue
Chicago, Ill. 60604
July 1, 2008
Lauren Fischer* Joseph P. Schwieterman
Contact:
[email protected] 312/362-5731 office
* Fischer is a research associate at the Chaddick Institute; Schwieterman is a professor in
the School of Public Service and Director of the Chaddick Institute

2
I. Introduction
he neighborhoods of Chicago are a veritable kaleidoscope of culture—colorful amalgams of languages, dialects, religions, and culinary traditions.
These modern-day melting pots are integral to the city’s reputation as a global metropolis and vital contributors to its post-industrial economy.
In many neighborhoods, diversity is also an important business development tool.
Grants and public aid programs are increasingly directed at neighborhoods able to demonstrate how they can leverage diversity for the common good. Advocacy organizations showcase diversity as a way to demonstrate to would-be homeowners that their part of the city offers the best in urban life. Tour guides and visitors manuals attract thousands to ethnic festivals, parades, and cultural events held throughout the city.
All this raises several interesting questions: What neighborhoods are really the
most diverse? What factors make them diverse? How is their diversity changing? Answering these questions may seem subjective, but we can address them systematically by drawing upon statistics of ethnicity, income, race, age, and other factors which influence diversity.
In the paragraphs below, we develop a “composite diversity index” for the neighborhoods of Chicago. Using information from the U.S. Census, we rank each of the city’s neighborhoods on the basis of their diversity and assess how diversity is likely to evolve in the years ahead.
The analytical portion of this report is organized into five parts. The next section considers the city’s changing demographic character. Section III summarizes the tools we use to measure diversity. We review our key findings in Section IV and the issues surrounding diversity in Sections V and VI. In the appendixes, we provide the rankings for the neighborhoods in our study and review the various indexes we use to measure their diversity.
II. A Heritage of Diversity
The rich character of neighborhoods in Chicago has inspired generations of scholars and writers of popular literature. More than a century ago, Theodore Dreiser’s novel, Sister Carrie, published in 1900, and Upton Sinclair’s The Jungle, published in 1906, provided vivid—if disquieting—portraits of life in various working-class neighborhoods.1 In 1916, Carl Sandburg famously characterized the city for being “stormy, husky, brawling” in his landmark poem, Chicago. In the 1920s, sociologists at the University of Chicago offered more scientific assessments of neighborhood life, attracting worldwide attention for their spatial analysis of residential areas.2 Harvey Warren Zorbaugh’s The Gold Coast and the Slum, published in 1929, broke new ground in the understanding of neighborhood change and
T

3
emerged as a classic in the field of sociology. In 1946, Louis Wirth conducted pioneering work on the racial issues facing Hyde Park, helping to reframe that neighborhood’s struggle toward the integration of blacks and whites. Often traveling door-to-door, legendary community organizer Saul Alinsky mobilized residents in the Back-of-the-Yards during the transitional postwar years.3 In 1946, he penned Reveille for Radicals, a veritable manifesto about the need to build greater neighborhood cohesion so as to fight City Hall more effectively. Calling for nothing less than a “backyard revolution” in cities across the country, Alinsky was a catalyst in the city’s budding community-organizing movement and founder of the nation’s oldest community-based organization, Back of Yards Neighborhood Council. In the 1950s and 1960s, Chicago became a laboratory for the study of urban redevelopment, especially on the South and West sides. Future of Cities & Urban Redevelopment, a 1953 volume edited by Coleman Woodbury, offered a particularly prominent warning about the changing nature of neighborhoods and cities, focusing heavily on Chicago.4
Fascination with the city’s neighborhoods grew in the 1970s and 1980s, inspiring stage plays, comedy acts, movies, and books. Skits on Saturday Night Live, the ascendance of “Wrigleyville” as a neighborhood revered by Cubs fans everywhere, scenes from major motion pictures, and Studs Terkel’s accounts of everyday people gave Chicago’s neighborhoods great prominence in the popular culture.
Today, diversity is widely seen as one the city’s most enduring features. In April 2008, Mayor Richard M. Daley cited it as being instrumental to the city’s Olympic bid, declaring “We welcome immigrants from other lands as we have for generations. Out of our diversity comes our city’s greatest strength.”
III. Taking Inventory By many measures, Chicago is a much more diverse place than it was a quarter-century ago. Dozens of neighborhoods have seen an influx of Latinos, which now account for about 26% of the city’s population, up 115% from 1980. The city’s non-Latino immigrant population has also grown sharply. Native-born Europeans now account for roughly 23% of the city’s immigrants while Asians account for 18%.
As these populations grow, the number of non-Latino whites living in the city has
fallen gradually, a process dating back at least to the mid-1950s.5 Roughly 30% of the city’s population is now non-Latino white, and another 36% are black. The relatively equal share of the populace identified as Latino, non-Latino white, and black contributes to Chicago’s reputation as a more racially diverse—and politically dynamic-- place than many other large Midwestern cities.6
At least three neighborhoods claim distinction with respect to diversity. Albany
Park, on the northwest side, touts itself as a neighborhood that is "one of the most diverse

4
in the nation” and highlights the fact that its residents have emigrated from six continents and that its schoolchildren speak 40 different languages.7 Rogers Park, located on the north lakefront, uses the tagline "diverse in every way" and claims that it is has the most diverse population in the City of Chicago.8
Hyde Park takes pride in its ethnic diversity as well as its heterogeneity with respect to education and income. The south lakefront neighborhood promotes itself as having a “population that thrives on diversity” and notes that it is “recognized as a national model of racial diversity and urban stability.” 9 Much of its diversity stems from the constituencies affiliated with the University of Chicago.
A fourth neighborhood, Uptown, is more modest when it comes to diversity. Its
promoters, however, see protecting “rich diversity” as critical to achieving important neighborhood goals, which include making improvements to its business core, developing an entertainment district, and revitalizing the neighborhood as a whole.10 Such claims are consistent with the images of these neighborhoods. Nevertheless, there has been no systematic effort to evaluate them comprehensively. Most previous studies that evaluate the level of diversity in geographic areas focus on census tracts or metropolitan areas rather than particular neighborhoods.
A study by USAToday in 2001 falls into this category, evaluating the distribution of ethnic groups in cities throughout the country to identify those that are the most diverse. A pair of other studies, one by John Logan at the University of Albany and another by Nyden, Lukehart, Maly, and Peterson (who are affiliated with institutions in Chicago), also probe deeply into the diversity of metropolitan areas.
Among research focusing on Chicago’s neighborhoods, Michael T. Maly’s work with neighborhood diversity is particularly noteworthy, evaluating the racial and ethnic composition in census tracts throughout the city between 1980 and 1990. His Roosevelt University study creates a “neighborhood diversity index” to identify the most and least racially integrated areas. Other research efforts, including works by John Koval, Mari Gallagher, and others, offer similar perspectives on the racial and ethnic diversity in the city11.
In the paragraphs below, we attempt to build upon these earlier efforts by
considering a wider range of variables in ranking the diversity of each of the city’s neighborhoods. Types of Diversity
To develop a composite index of diversity, we use U.S. Census data to measure the three different aspects of the diversity of each neighborhood.
Ethnic Diversity. When practitioners and social scientists refer to “diversity,” they are typically speaking of the plurality of multiple ethnic groups within a specific

5
area. Using census data, we divided the population of each neighborhood into five categories: Asian, Black, Latino, Non-Latino White, and “Other”. The “Non-Latino White” population of each neighborhood was enumerated by combining the answers to two different questions on the census form.
The significance of this type of diversity often lies not in ethnic (or national)
identities themselves, but in the factors correlated with ethnicity, such as social or cultural norms, religious identification, and language. It is wrong to assume that all, or even most, individuals of a particular ethnic group embrace similar values or customs; nevertheless, there can be a strong correlation between a population’s ethnic composition and a neighborhood’s religious and cultural structure.
Income Diversity. This aspect of diversity refers to a variance in household economic status within the same neighborhood. We measured it by consolidating several income ranges in Census reports into three categories: low-income households, comprising households with annual incomes of less than $35,000; middle-income, comprising households earning $35,000 to $99,000; and upper-income, which are households whose annual incomes are $100,000 or more. As a general rule, this aspect of diversity is rising. Between 2000 and 2010, the percentage of the city’s population that is low income is expected to fall from 45.5% to 35.9%, while the middle-income bracket is expected to grow from 42.8% to 45% and the upper-income bracket is expected to grow from 11.6% to 19%.12 The effects of this change, however, will differ greatly between neighborhoods. In some areas, “gentrification” will create a more equal distribution of residents of various incomes, thus adding to diversity. In other neighborhoods, however, gentrification has progressed to the point that it is now having a dampening effect with respect to income diversity. We describe this phenomenon in greater detail in Section V.
Age Diversity. The variance of ages among neighborhood residents also contributes to a neighborhood’s diversity. To measure this, we used census data to create three categories of residents: children (residents under 18); adults (18 to 54); and senior citizens (55 years or older). The latter category is identical to the one used for federal policies related to housing discrimination. A neighborhood’s diversity with respect to age is often linked to the role of major institutions, such as universities or nursing homes, targeting particular markets. Although businesses, especially retailers, are keenly aware of the age distribution of residents, this aspect of diversity has not been as extensively studied by social scientists as the other aspects.13 Measures of Diversity We use four indexes to measure each of the above aspects of a neighborhood’s diversity. The Herfindahl Index and Horvath Index are prominent measurements in the

6
field of economics. The third measurement tool, the Fischer Index, was developed specifically for this study. The fourth, the DePaul Composite Diversity Index, provides a composite score based on a weighted average of the scores of the first three indexes. (Please refer to the sidebar as well as Appendix B for a more extensive discussion of these tools.)
Four Tools to Measure Diversity Our analysis uses four indexes to compute the level of ethnic, income, and age diversity in each neighborhood. After quantifying the extent of the diversity in a neighborhood, we calculate its overall diversity by combining scores from the first three indexes, assigning the highest “weight” (.65) to ethnic diversity and a lower “weight” to income diversity (.30). We assign the smallest “weight” (.05) to age diversity due to the fact that it is generally considered to be only a minor aspect of a neighborhood’s overall diversity.
1. Herfindahl Index. This index, developed by Orris C. Herfindahl and Albert O. Hirschmann in the 1960s, is an exponential function of the “market share” of each participant in an industry or economy. “Herfindahl Scores” are standardized, ranging only from zero to one. A score of zero suggests a complete lack of concentration while a score of one indicates complete dominance by one entity. 2. Horvath Index. This index, developed by economist Janos Horvath in 1970s, is similar to the Herfindahl Index, but it provides an absolute (rather than a relative) measure of the level of market concentration. The Horvath Index is also a function of the share of each “participant” and generally produces scores that range from one to more than fifty (see appendix). 3. The Fischer Index is equal to one divided by one minus the share of the largest group in a neighborhood. Unlike the other indexes, this index produces scores that have a simple interpretation: a score of 1.5 indicates that one out of every 1.5 people in the neighborhood does not belong to the dominant group.
Rather than relying on any one of the above indexes, we consolidate their scores to create the DePaul Composite Diversity Index. To compile this index, all scores are expressed as a proportion of that index’s mean for the 24 “finalist” neighborhoods, thereby allowing us to accurately “weight” them. The Herfindahl Index receives half the weight because of its prominence in social science research, while the Horvath and Fischer Indexes are each assigned half of the remaining weight (25% each).14
A summary of the statistical methods used to compute the index scores can be
found in Appendix B.

7

8
IV. Comparing Neighborhoods
Our approach to measuring diversity allows for the following observations about
the city’s neighborhoods.
• The city’s most ethnically diverse neighborhoods are located on the North Side. Three of the four most ethnically diverse neighborhoods in our composite index are north of the Loop. None of the top ten are on the far south or far west sides.
On the basis of the Herfindahl Index, Uptown is the city’s most ethnically
diversity neighborhood, while on the basis of the Horvath Index, the most ethnically diverse area is farther north, in Rogers Park. The Fischer Index suggests that New City (southwest of downtown) is the most diverse. In the composite index, the five most ethnically diverse neighborhoods are, in order from most diverse to least, Rogers Park, Uptown, New City, Albany Park and Hyde Park. Five of the top eight are clustered together on the North Side, giving this area the distinction of being the most ethnically diverse part of the city.
In the top five most ethnically diverse areas, no one ethnic group accounts for
more than 55 percent of the population. In all these neighborhoods, at least three distinct ethnic groups each compose 15 percent or more of the population. In six of the eight most ethnically diverse neighborhoods in the city, Asians account for more than 10 percent of the total population.
• The most income-diverse neighborhoods in the city tend to be in close proximity to Chicago’s downtown Loop district. The five community areas that are the most income-diverse on the basis of the composite index are within four miles of the Loop (as measured from their geographic center).
Hyde Park ranks highest in income diversity on the basis of the Fischer and
Horvath indexes, while West Town is the most diverse on the basis of the Herfindahl Index. In the composite index, Hyde Park and West Town rank first and second, respectively.
Consider the extent of Hyde Park’s income diversity. High-income households in
Hyde Park (those earning $100,000 or more) account for 15.6% of its population, middle-income for 37.8%, and low-income for 46.5%. This mix is extraordinary considering the relatively paucity of income diversity in nearby neighborhoods. Washington Park and Grand Boulevard, which are contiguous with Hyde Park, rank in the bottom five with respect to income diversity.
If present trends continue, Near West Side and Bridgeport will, within a decade, surpass Hyde Park and West Town as the most income-diverse in neighborhoods in our composite index. For Bridgeport, this is primarily due to an anticipated increase in the number of high-income households (their share is expected to rise from 9% in 2005 to

9
16% in 2010), while in West Town it is due to a more even mix of arriving middle- and high-income households.
• The most age-diverse neighborhoods tend to be widely dispersed throughout the city. Several of the highest-ranking neighborhoods for age diversity, however, are on the South Side. Among the neighborhoods ranking highest with respect to age diversity, the East Side (a portion of which is often called “South Chicago”) stands out for being the most diverse according to all three measures, while Ashburn ranks as the second-most age-diverse neighborhood.
In each of these neighborhoods, nearly one-third of the population are under 18,
and at least 18% are 55 or older. Hyde Park, which is quite diverse in other respects, has comparatively little age diversity, partially due to the relative paucity of children—at 13% it had the lowest percentage of children of any city neighborhood. (It is common for neighborhoods with large numbers of college students to have relatively few children.)
• Four of the five neighborhoods with the highest overall diversity are on the North and Northwest sides. By our statistical measures, Uptown is, overall, the most diverse neighborhood.
The top five neighborhoods for overall diversity, as determined by the DePaul
Composite Diversity Index, are (in order from most to least diverse) Uptown, Rogers Park, Hyde Park, Bridgeport, and Albany Park. All five neighborhoods rank in the top ten with respect to ethnic and income diversity. In four of these five neighborhoods, more than three-eighths of the population is foreign-born: 38% in Uptown, 39% in Rogers Park, 37% in Bridgeport and 58% in Albany Park. In Hyde Park, however, only 19% of the population is foreign-born.
Of the top ten most diverse neighborhoods, half are located on the North Side.
These neighborhoods owe a great deal of their diversity to their role as port-of-entry neighborhoods and generally offer extensive housing options and social support services for immigrants. All also have good access to public transportation, especially CTA rapid-transit routes.

10
Table 1: DePaul Composite Diversity Scores
Neighborhood
Diversity Index Composite Score
1. Uptown .8564 2. Rogers Park .8678 3. Hyde Park .8794 4. Bridgeport .8887 5. Albany Park .8899 6. Edgewater .9080 7. New City .9093 8. West Ridge .9140 9. Near West Side .9364 10. West Town .9507 11. Ashburn .9526 12. Humboldt Park .9656 13. Chicago Lawn .9873 14. McKinley Park 1.0096 15. Logan Square 1.0347 16. Belmont Cragin 1.0500 17. Gage Park 1.0693 18. Avondale 1.0787 19. East Side 1.0986 20. Brighton Park 1.1022 21. South Lawndale 1.1595 22. Hermosa 1.1946 23. Lower West Side 1.2969
V. Issues of Diversity This review of the city’s neighborhoods lends credence to the claims of Albany Park, Hyde Park, Rogers Park, and Uptown with respect to their diversity. These four neighborhoods, as well as Bridgeport, are the top five neighborhoods in our comprehensive index. Uptown’s ranking testifies to the powerful forces that have reshaped it over the past decade. In this neighborhood, institutions struggle to meet the needs of its heterogeneous population, and residents have been pushing hard for policies to protect the supply of affordable housing, which is diminishing as a result of investments catering to upper-income groups.

11
Similar issues affect Albany Park, Hyde Park, and Bridgeport. In all of these neighborhoods, more than one-third of households are low-income and more than 10% are high-income, making them areas of greatly contrasting wealth. By comparison, in Woodlawn and Riverdale, which are much less diverse, fewer than 4% of the households are high-income.
As the demographic character of the city changes, our assessment suggests that
the following issues warrant serious attention. • For the foreseeable future, gentrification will continue to alter the diversity of
neighborhoods in profound ways. Since the 1960s, many educated young professionals have been moving to lakefront neighborhoods, including Lake View, Lincoln Park, and Edgewater. Gradually, the phenomenon spread to more inland areas, such as Bucktown, Lincoln Square, and Wicker Park. By the early 1990s, “empty nesters”, wealthy out-of-towners, and retirees were also arriving in large numbers, often buying condominiums in the Central Area and the Near North Side.
In poorer neighborhoods, the earliest phases of gentrification tend to increase
income diversity by creating a more equal mix of rich, middle-class, and poor residents. It is common for “urban pioneers” to bring such diversity, moving to refurbished housing in close proximity to lower-income populations. Indeed, this is now happening in parts of West Town, Rogers Park, Uptown and many other neighborhoods. As higher-income people continue to displace lower-income residents, however, gentrification then begins to have the opposite effect. The ensuing reduction in diversity accelerates as developers and speculators discover the area, causing property values to escalate sharply, which lessens the supply of low-cost rental housing and drives up property taxes. In some neighborhoods on the North and West sides, the gentrification process has progressed to such a point that low-income residents now account for a minority share of the population.
For example, Lincoln Park was, as recently as the early 1980s, a mix of working class families and immigrants, including many Filipinos, and more affluent residents. Today, the median household income of Lincoln Park registers as one of the highest in the city, $78,466, and is expected to increase to $94,342 by 2010. Surprisingly, Lincoln Park still registers as one of the most income-diverse areas in the city, with 23% low- income, 39% middle-income and 37% upper-income households. (Many of the low-income households are college students in the DePaul neighborhood and residents of Cabrini Green and other Section 8 housing facilities in the most southwestern section of the neighborhood.)15
Closer to downtown, the condominium boom has also spawned the creation of
entirely new sub-neighborhoods, such as Central Station and Lake Shore East, which are composed largely of middle- and high-income households and have relatively little income diversity. However, since these sub-neighborhoods are located within the
12
boundaries of larger community areas, their high-income residents have actually brought more income diversity to a traditionally lower-income area.16
• Despite rising diversity in the city as a whole, Chicago’s reputation as a place lacking integration between white residents and black residents seems destined to persist. By most commonly accepted measures, Chicago will likely remain the most segregated major city in the country.17
Efforts to deter the movement of blacks into traditionally “white” areas are a
prominent part of the city’s history. Through the early 1900s, it was common for developers to have buyers of real estate in newly created subdivisions sign “restricted covenants” written for the explicit purpose of keeping African-Americans and Asians out of the area. At one point, upwards to a quarter of the city was subject to these covenants.18
Unlike numerous Southern cities, Chicago never had racial zoning, i.e., rules
explicitly banning certain people from designated areas. Nevertheless, the selective enforcement of zoning emerged as a serious policy issue during the Great Depression.19 More recently, the private practice of red lining by banks and insurance companies restricted development in minority sections of the city and prevented many minorities from relocating to white-dominated areas.
In the 1970s, the city gained notoriety for its public-housing projects, which concentrated tens of thousands of the poor, primarily African-Americans, into poorly maintained public housing complexes, many of which were located on the South Side and on the West Side. Some of the public-housing developments have been demolished, and there are rules governing lending; but it often remains nearly impossible for low-income families to relocate to high-income areas without government policies to encourage affordable housing in those areas.
At the same time, there is evidence that some blacks have little interest in moving to more integrated neighborhoods. Instead, many high-income African-American residents choose to reside in largely black neighborhoods on the South Side, creating several ethnically homogenous communities, such as Avalon Park, where the middle- and high-income households outnumber those in the low-income category. In any case, our data as well as previous research suggests that these spatial patterns will remain part of city life for years to come. • Public service agencies are placing great emphasis on community-development strategies that cultivate the involvement of diverse constituencies, marking a fundamental shift in strategy from a quarter-century ago. The efforts of neighborhood organizations to leverage diversity in community-building efforts back nearly a half-century. The Woodlawn Organization emerged as a pioneer in this area on the South Side in 1960 while Bethel New Life served a similar role in West Garfield Park in the late 1970s. The city has made special efforts to increase

13
the voice of ethnic and racial minorities since Harold Washington, Chicago’s first black mayor, took office in 1983. Mayor Washington assembled an administrative team that leveraged the “community assets” of the neighborhoods with a goal of promoting social equity. Not only were some of these strategies slow to gather momentum, but there were conflicts between groups in some neighborhoods that some scholars contend gradually weakened the social fabric of the neighborhoods.
Mayor Richard M. Daley also pushed for investments in human capital with the diversity of neighborhoods in mind. By the early 1990s, community policing, enterprise zones, new types of block grants and other policies were being used to help neighborhoods “improve from within.”
Today, local chambers of commerce and community development organizations have grown more sophisticated and rely heavily on citizen input. Grass-roots participation and team-building are seen as crucial steps in the creation of a sense of community. Many community-based organizations, including economic development corporations, have adopted the policy that their advisory boards must mirror the ethnic and racial composition of the residents. In addition many of these organizations mandate citizen input and require participation from residents prior to approving projects.
VI. Conclusion
Drawing upon statistics about ethnicity, income, and age provides a valuable perspective on the diversity of Chicago’s neighborhoods. As a general rule, our findings suggest that ethnic diversity tends to be strongly correlated with income diversity (the most ethnically diverse areas tend to also have high income diversity). Although there is less of a correlation between age and ethnicity or income, the latter is a relatively minor factor in a neighborhood’s diversity score. Consequently, the rankings generated by our composite index change only modestly when we assign different “weights” to ethnic and income diversity. The lack of information about some of the subtle aspects of ethnicity is a major obstacle to creating a more exhaustive index. Due to our reliance on census data, our indexes consider the distribution of five categories of ethnicity, with a significant share of the population being consolidated into a nondescript “other” category. Also, our index does not consider each neighborhood’s diversity with respect to language, religion, or country of origin. Without more extensive data, unfortunately, a more elaborate index will be an elusive goal.
Regardless of these impediments, the indexes we used are sophisticated tools that
proved beneficial and informative in our comparison of the diversity of city’s neighborhoods. Our results show that Albany Park, Hyde Park, New City, Rogers Park, and, especially, Uptown, along with some other areas of the city, are noteworthy for their diversity or aspects of their makeup that contribute to their diversity. Each exemplifies the qualities that seem destined to keep Chicago’s neighborhoods a focal point of scholarly inquiry for years to come.

14
Appendix A
Figure 2: Chicago Community Area Map
15
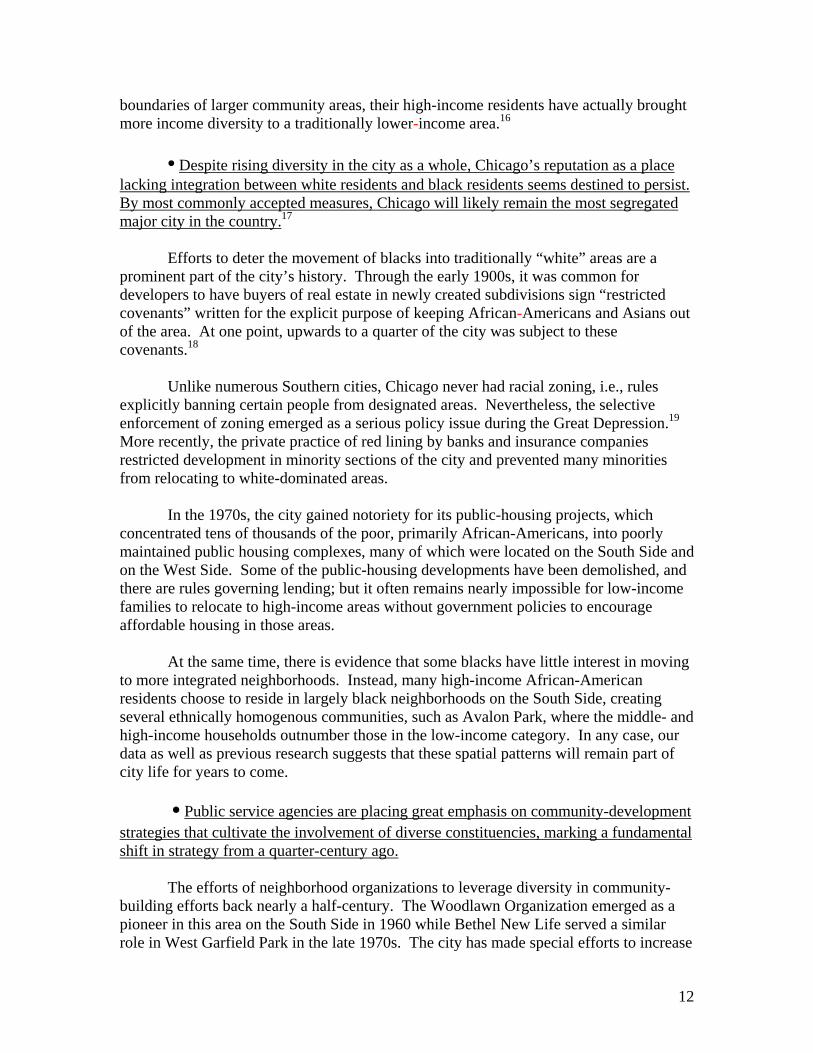
Weighted Ranking Neighborhood Ethnicity Income Age
Composite Index Score
% Foreign Born
Population
1. Uptown 2 5 17 .856 38% 65,374 2. Rogers Park 1 10 22 .868 39% 66,362 3. Hyde Park 5 1 23 .879 19% 30,989 4. Bridgeport 7 4 11 .889 37% 35,251 5. Albany Park 4 9 14 .890 58% 60,699 6. Edgewater 6 7 18 .908 41% 64,234 7. New City 3 21 5 .910 34% 47,221 8. West Ridge 8 8 3 .914 51% 75,507 9. Near West Side 11 3 20 .936 15% 49,999 10. West Town 13 2 19 .951 26% 91,926 11. Ashburn 9 20 1 .953 14% 36,082 12. Humboldt Park 10 17 4 .966 22% 62,612 13. Chicago Lawn 12 15 6 .987 25% 61,221 14. McKinley Park 14 18 7 1.010 43% 15,467 15. Logan Square 16 6 16 1.034 33% 85,821 16. Belmont Cragin 15 23 8 1.050 48% 77,456 17. Gage Park 17 11 10 1.069 51% 38,910 18. Avondale 18 13 13 1.079 49% 44,365 19. East Side 19 19 2 1.099 33% 22,522 20. Brighton Park 20 16 9 1.102 52% 44,074 21. South Lawndale 21 14 21 1.160 52% 87,847 22. Hermosa 22 12 12 1.195 37% 26,836 23. Lower West Side
23 22 15 1.297 54% 43,546
Table 2: Chicago’s Most Diverse Neighborhoods

16
Weighted Ranking Neighborhood Fischer Herfindahl Horvath
Composite Index Score
1. Uptown 6 1 1 .856 2. Rogers Park 2 2 2 .868 3. Hyde Park 1 4 5 .879 4. Bridgeport 5 7 3 .889 5. Albany Park 4 5 4 .890 6. Edgewater 9 3 8 .908 7. New City 3 9 6 .910 8. West Ridge 10 6 7 .914 9. Near West Side 13 8 9 .936 10. West Town 8 11 11 .951 11. Ashburn 11 10 10 .953 12. Humboldt Park 7 13 12 .966 13. Chicago Lawn 15 12 13 .987 14. McKinley Park 12 14 14 1.010 15. Logan Square 16 15 15 1.034 16. Belmont Cragin 14 16 16 1.050 17. Gage Park 19 17 17 1.069 18. Avondale 18 18 18 1.079 19. East Side 17 20 19 1.099 20. Brighton Park 20 19 20 1.102 21. South Lawndale 21 21 21 1.160 22. Hermosa 22 22 22 1.195 23. Lower West Side 23 23 23 1.297
Table 3: Ranking by Diversity Measure
17
Appendix B
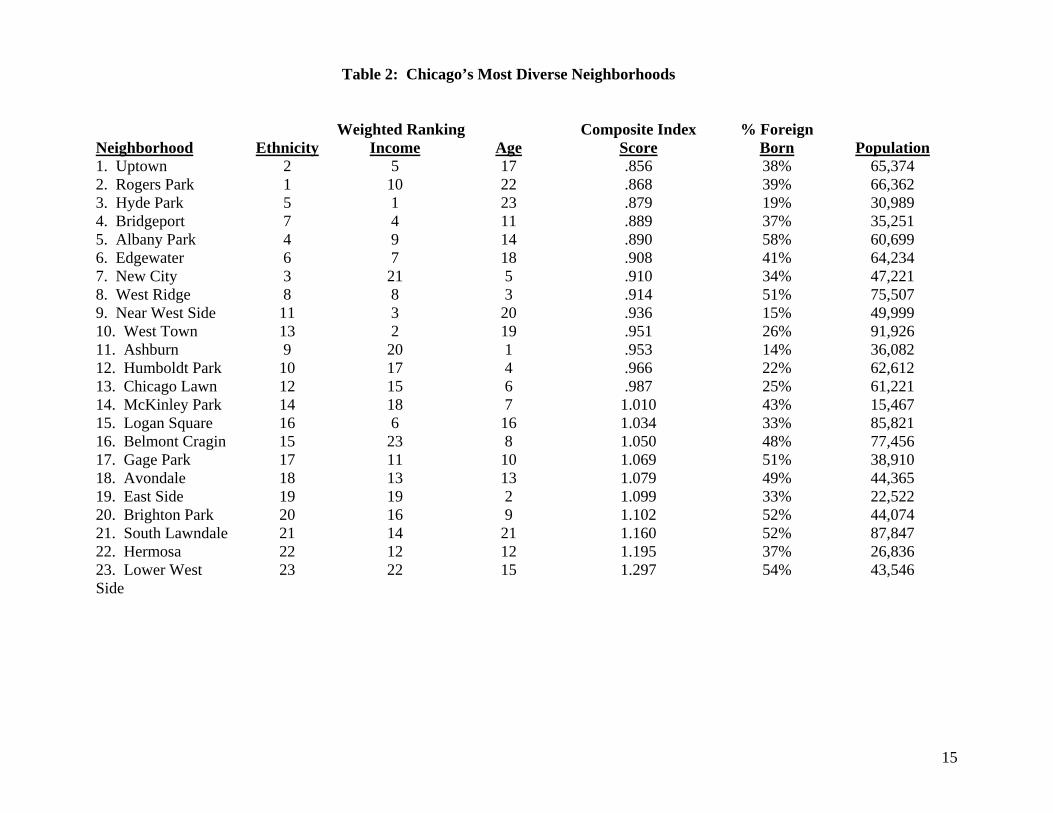
Measures of Diversity 1. Herfindahl Index The Herfindahl Index calculated as a sum of the squares of the market share of various participants in an industry. The formula is:
where s is the share of each of the n market participants. In Chicago, the most diverse neighborhoods had a Herfindahl Score of around .31, while the least diverse had a score of around .55. 2. Horvath Comprehensive Concentration Index The Horvath Comprehensive Concentration Index, unlike the Herfindahl Index, takes into account the market share of the dominant participant in an industry (noted as S1) in a discrete way. The formula is:
where s is the share of the share of the population accoutned for by an ethnic, income or age group and N represents the number of groups in the Neighborhood. In Chicago, the most diverse neighborhoods had a Horvath Score of around 1.4, while the least diverse had a score of around 2.6. 3. Fischer Index The Fischer Index is a measure unique to this study. It measures the size of the population not represented by the largest group. A neighborhood’s score on the Fischer Index is calculated by taking the inverse of one minus the proportion of the largest group. Scores typically range from around 1.2 to 3, with the most diverse neighborhoods having the lowest scores. If the population of a particular neighborhood is 66% white, 20%

18
black, and 14% Asian, the Fischer Score would be 1.5 (1.0 divided by .66). The formula is:
where S = the share of the population accounted for by the largest group
Of the three measures used to analyze diversity, the Herfindahl score is the most robust for several reasons. First, the score is standardized with values ranging from zero to one. In both the Fischer and Horvath calculations, homogenous neighborhoods can achieve relatively high scores which skew the data and make it impossible to discuss the relative amount of difference in diversity between neighborhoods. For these measures, we can only discuss diversity through the rankings of the neighborhoods. In contrast, the standardized Herfindahl score allows us to examine the amount of difference between neighborhoods. 1 Sinclair, Upton. The Jungle. (1906); Dreiser, Theodore. Sister Carrie. (1900) 2 Citation: The Chicago School of Sociology: Institutionalization, Diversity, and the Rise of Sociological Research. Martin Bulmer, Chicago: University of Chicago Press. 3 Alinksy, Saul. Reveille for Radicals. New York (1969) 4 Woodbury, Coleman et al. The Future of Cities and Urban Redevelopment. University of Chicago Press (1953) 5 The city’s population rose to its peak around 1955. 6 “Latino Growth in Metropolitan America: Changing Patterns, New Locations”. Center on Urban and Metropolitan Policy and the Pew Hispanic Center. July 2002: Brookings Institute. 7 Albany Park Community Center. Homepage Online. Accessed from http://www.apcc-chgo.org/ 8 DevCorp: Rogers Park Business, Community and Economic Development Corporation. Homepage Online. Accessed from http://www.rogers-park.com/ 9 South East Chicago Commission. Homepage Online. Accessed from http://www.hydeparkchicago.org/index.html 10 Uptown Chicago Commission. Homepage Online. Accessed from http://www.uptownchicagocommission.org/ 11 Koval, John P., Larry Bennett, Michael I J Bennett, Fassil Demissie, Roberta Garner and Kiljoong Kim. The New Chicago: A Social and Cultural Anlaysis. Temple Press Pennsylvania (2006). And Gallagher, Mari. “Trends Impacting Latinos in the Workplace” Presentation to the Illinois Legislative Latino Caucus Foundation, December 6, 2007. 12 We defined low income as households with an annual income of under $35,000, middle income households make between $35,000 and $99,000 and high income is $100,000 or greater. The increase in the number of high income households marks a trend that has not been seen since affluent residents left the city in droves during the 1960s and 70s. 13 The dearth of such research may be due to relatively modest differences between many neighborhoods with respect to the age distribution of residents. 14 We gave a greater weighting to the Herfindahl Index (.5) because it is the most commonly used and the only standardized measure of the three in our study. However, we felt that Horvath and Fischer scores provided alternative analysis that complimented the Herfindahl results and we combined them according to a lesser weight (.25). It is important to note that all three measures produced relatively consistent results. 15 The student population that resides in Lincoln Park, attends DePaul University and commutes to other educational institutions throughout the city. While the income of individual students may qualify their households as “lower income” in reality their housing costs may be subsidized by parents and student
19
loans15. Lower income developments in Lincoln Park are largely segregated from the upper income portions of the neighborhood which are located closer to the Lake. 16 One result has been a push to mandate that developers “set aside” affordable housing units catering to those who would otherwise be priced out of the area, an idea the mayor has resisted for economic reasons. 17 Maly, Michael T. “The Neighborhood Diversity Index: A Complementary Measure of Racial Residential Settlement”. Journal of Urban Affairs, Vol.22, No.1.(pg. 37-47:2000). 18 Schwieterman, Joseph P. and Dana M. Caspall. The Politics of Place: A History of Zoning in Chicago. Lake Claremont Press (2006). 19 Enforcement of some rules was at times linked to the desire of whites to deter African Americans from moving to their neighborhoods.

![Kaleidoscope - Amazon Web Services€¦ · Kaleidoscope Make your own reflecting kaleidoscope Written By: Kailash NR Kaleidoscope Guide ID: 520 -Release: 1.0 [major] 2019-02-04 This](https://img.dokumen.tips/doc/110x75/5fa4c91eb608da22fd275ca1/kaleidoscope-amazon-web-services-kaleidoscope-make-your-own-reflecting-kaleidoscope.jpg)