Embed Size (px)
Citation preview
Pergamon PII: S0883-2927(97)00070--X
Applied Geochemistry, Vol. 13, pp. 257-268, 1998 © 1998 Elsevier Science Ltd. All rights reserved
Printed in Great Britain 0883-2927/98 $19.00 + 0.00
A hydrogeochemical transport model for an oxidation experiment with pyrite/calcite/exchangers/organic matter containing sand
C. A. J. Appelo, E. Verweij and H. Sch~ifer Faculty of Earth Sciences, De Boelelaan 1085, 1081 HV Amsterdam, The Netherlands
(Received 22 January 1997; accepted in revised form 27 June 1997)
Abstract--We report the hydrogeochemical modeling of a complicated suite of reactions that take place during the oxidation of pyrite in a marine sediment. The sediment was equilibrated in a column with MgCI2 solution and subsequently oxidized with H202. The oxidation of pyrite triggers dissolution of calcite, cation and proton exchange, and CO2 sorption. The composition of the column effluent was modeled with PHREEQC, a hydrogeochemical transport model. The model was extended with a formal ID transport module which includes dispersion and diffusion. The algorithm solves the advection-reaction--dispersion equation with explicit finite differences in a split-operator scheme. Also, kinetic reactions for pyrite oxidation, calcite dissolution and precipitation, and organic C oxidation were included. Kinetic relations for pyrite oxidation and calcite dissolution were taken from the literature, and a coefficient equivalent to the ratio A/V (surface over volume), was adjusted to fit the experimental data. The comparison of model and experiment shows that ion exchange and sorption are dominant chemical processes in regulating and buffering water quality changes upon the oxidation of pyrite. Cation exchange was assigned to the colloidal fraction ( < 2/~m) and deprotonated organic matter, proton buffeting to organic matter, and CO2 sorption to amorphous Fe-oxyhydroxide. These processes have been neglected in earlier modeling studies of pyrite oxidation in natural sediments. © 1998 Elsevier Science Ltd. All rights reserved
INTRODUCTION
The effects of pyrite oxidation on groundwater or porewater composition have been studied using hydro- geochemical transport models (Boudreau, 1991; Glynn et al., 1991; Postma et al., 1991; Van Cappellen and Wang, 1996; Wunderly et al., 1996). In these modeling studies a natural setting was considered that was sampled and analyzed, often in meticulous detail. The models were all succesful in explaining the observed water chemistry (pH, major ion concentrations). However, it is clear that the initial and boundary conditions (flow conditions, disturbances by organ- isms) are generally not known exactly for natural conditions. This leads to ambiguity for the reaction models. For example, ion exchange of the major cations and proton exchange are undoubtedly important processes in the unsteady situation that accompanies pyrite oxidation. These processes were neglected, or only partially considered in the studies cited above.
The importance of cation exchange was clearly demonstrated in the column experiments reported by Bronswijk et al. (1993), Ritsema and Groenenberg (1993) and Van Wijk et al. (1993). These authors sampled pyrite-containing soils in large diameter columns and allowed pyrite to oxidize in the columns during drainage and aeration of the originally water- saturated soils. The analyzed water composition and exchangeable cations were modeled quite successfully with a hydrogeochemical transport model in which cation exchange of all the major cations was included. Still, the match of analyzed and modeled concentra- tions showed inconsistencies which may be due to the variable initial conditions that exist naturally in a soil.
Another oxidation experiment was carried out with a pyrite-containing sediment in the laboratory. Before oxidation, the ion exchange reactions were simplified by bringing the sediment into Mg-form, i.e. initially having only Mg 2÷ in the pore water and on the solid exchange sites. The overall mineralogical properties are not affected because this was done under anaero- bic conditions. In the subsequent oxidation stage, H202 solution was pumped into the column with a constant flux so that the oxidation capacity was known exactly. Hydrogen peroxide was used to provide an increased overall reaction progress, and also to block bacterial reactions which could trigger more complicated side-reactions. The MgCI2 concen- tration in the solutions was varied to be able to reconstruct the column hydraulic parameters (flow velocity, porosity, dispersivity) from the CI - break- through curves during the various stages in the experiment. By bringing the sediment to the labora- tory, and preparing it for an action-reaction analysis while conserving the natural characteristics, we hoped to find the exact reactions that occur in a natural, pyrite-containing sediment that is subjected to oxida- tion (e.g. a marine sediment that is poldered and aerated; a waterlogged soil that is drained; oxidizing tip heaps of a brown coal mine).
The column effluent was modeled initially using the geochemical transport model PHREEQM (Appelo and Postma, 1993). However, severe discrepancies showed that the reaction model was incomplete. The differences were related to proton buffering of the acid produced during oxidation, and to a kinetic reaction of pyrite with H202. These problems could not be solved by using PHREEQM without extensive modifications
257

258 C.A.J . Appelo et al.
to the code, and the experiment was shelved. With the advent o f P H R E E Q C (Parkhurst, 1995), a new modeling exercise was done, given the considerably greater flexibility of P H R E E Q C and the improved convergence with redox problems. The major progress with respect to earlier models (Parkhurst et al., 1980; Plummer, 1992), lies in the ability of P H R E E Q C to do calculations with multiple exchangers and sorbing surfaces, each of which can have different affinities for different solutes. It means that sorption and ion exchange can be better connected to properties of individual components in a natural sediment, or rock. The code had to be adapted because the transport capacities of P H R E E Q C as published (Parkhurst, 1995) are limited. Here, the results of the experiment and the modeling are presented.
We discuss the sediment chemical characteristics, details of the column experiment, and the model P H R E E Q C and extensions to the code. The model is then used to demonstrate how inclusion of the individual chemical processes leads to the water quality changes observed in the column experiment.
METHODOLOGY
Sediment characteristics
Sediment was cored from the Dintelse Gorzen in the Krammer Volkerak area of The Netherlands in 1993. Two 60 mm i.d. PVC liners were hammered side by side into the soil to below the groundwater table and frozen in liquid N2 immediately after excavation. During transport to the laboratory the samples were kept on dry ice and stored in the laboratory at - 25°C. One core was used for the column experiment. The other was sectioned in 20 mm slices and used for analysis of grain size distribution, bulk density, porosity, organic matter content (CO2 measurement by GC after combustion) and calcite (Seheibler method). Also analyzed were acid volatile sulfides (A VS, cold extraction with HCI and Sn 2+ added to prevent S 2- oxidation by Fe 3+, Pruden and Bloomfield, 1968), pyrite and S O (Cr 2+ reducible S, Canfield et al., 1986; Fossing and Jorgensen, 1989), and amorphous (oxalate extraction, Schwertmann, 1964) and crystalline (dithionite extraction, Sehwertmann, 1964) Fe- oxyhydroxides. Pore water was analyzed after centrifuging the soil with an airtight tube assembly (modified from Saager et al., 1990), filled in a glove box. The centrifuged solid sample was analyzed for exchangeable cations (1 M NaCI and I M NH4CI extractions, modified from Hofstec, 1971) and its cation exchange capacity. Results from the analyses over the depth interval used in the column experiment are given in Table 1. Crystalline Fe-oxyhydroxide is less than
3 ppm in all samples. The presence of amorphous Fe- hydroxides points to the seasonality of redox reactions in the sediment: there appears to be oxidation of FeS2 in the summer (observed in pore waters, not reported here), and subsequent reduction during waterlogging in the winter. SEM pictures show the pyrite in the sediment to be in the form of framboids.
Cation exchange coef]~cients
Exchangeable cations in the NaCI and NH4CI extracts were corrected for the solute cations of the remaining pore solution in the centrifuged samples. The correction was a maximum of 60% for Na +. The combined analysis of porewater composition and exchangeable cations allows calculation of the exchange coefficients (Table 2). The coefficients are for the reaction
with
l / i I i+ + Na-X ~ 1/i l-Xi + Na + (1)
[l-X] Ill [Na +] Kt\Na = [Na-X] [li+] l/i (2)
The equivalent fraction is used for calculating the activity of exchangeable species (Gaines and Thomas convention), while for solute ions the total molality of the free, uncom- plexed ion in solution is used. This is similar to having the same activity coefficients for solute and exchangeable species, which gives a more constant Kr, Na when the salinity varies (Appelo, 1994). The coefficients in Table 2 indicate a relatively high selectivity for the divalent cations with respect to Na +, as is usual for saline Dutch soils, while the observed selectivity among the Ca 2 +/Mg 2+ pair is normal.
Column experiment
The laboratory column used for this study has been described by Appelo et al. (1990). The column is of stainless steel lined with Teflon, and placed in a water bath at a temperature of 7.5°C. The inner diameter is 60 mm and fits closely the cores from the PVC liner. Spirally grooved Teflon caps guide the passage to the inlet and outlet tubes of stainless steel. An HPLC pump (LKB 2150) pumped the initial equilibrating solutions, while a peristaltic pump (LKB Varioperpex) was used for the H202 solution because gas bubbles from the rapidly decomposing H202 impeded the HPLC pump's functioning. Initial solutions were kept anaerobic by bubbling humidified N2 gas through the storage flasks. Outflow from the column was sampled both with a fraction collector (Gilson 221) and manually for analysis of
i pH and alkalinity. The flow rate was 10 ml h - and samples were weighed as a check. Aliquots for cation analysis were acidified with concentrated HNO3 to pH < 2.0, and for anion analysis were diluted 1:2 with distilled water. Sodium and K + were analyzed by flame photometry (Eppendor0 and other
Table I. Analysis of sediment properties at 4 depths. CEC is cation exchange capacity (NaCI extraction), A VS is acid volatile sulfide
Depth cm b.s. < 2/~m wt% Calcite wt% Org. C wt% CEC meq/100 g
am. Fe-ox AVS Pyrite
ppm Fe ppm S ppm S
40--42 4.6 7.25 0.28 3.18 341 7 728 42-44 4.1 7.58 0.23 3.43 379 6 935 44--46 3.0 6.17 0.11 2.12 317 11 510 46--48 3.3 5.92 0.10 1.98 357 5 456

A hydrogeochemical transport model 259
Table 2. Solute and exchangeable cations and selectivity coefficients for the reaction: 1/mM ''+ + Na-X ~ 1/mM-X,,, + Na +
Depth Na ~" K + Mg 2 + Ca 2 + cm b.s. ~ solute, mmol I- i
Na-X K-X Ms-X2 Ca-X2 KK\r~ KMs\N,~ gca\Na exchangeable, meq/100 g
40-42 304 9 31 7 1.29 0.45 0.99 0.43 11.7 2.36 3.26 42-44 315 10 34 7 1.33 0.47 1.14 0.47 11.2 2.53 3.58 44 46 293 10 29 6 0.79 0.35 0.67 0.29 13.1 2.61 3.74 46--48 294 8 30 6 0.68 0.39 0.68 0.21 20.9 2.89 3.55
cations by ICP-OES (Perkin-Elmer 6500XR). Chloride, TIC (total inorganic C) and SO42- were analyzed by automated procedures (Skalar equipment), alkalinity by titration with H2SO4 (Mettler memotitrator DL40) and pH in a flow- through cell with a Ross electrode connected to a Knick portamess pH meter.
A 53 mm section from the frozen sediment was inserted in the column and after thawing equilibrated with 280 mM MgCI2. Before starting the oxidation experiment the MgCI2 concentration in the input solution was first reduced to 10 mM, and then changed to 2.5 mM MgCI2 while 350 mmol H202/I was added. Four column pore volumes, or 220 ml, of the H202 solution were injected. This solution was displaced with 5 mM MgCI2. The variation in CI- concentrations was introduced in order to have a conservative marker for calculating dispersivity2+ . and pore volume. Initial" eqmhbra-" " tion with Mg provided a uniform exchanger composition, and allowed the side reactions that follow pyrite oxidation (CaCO 3 dissolution and Ca 2 +/Mg 2÷ cation exchange) to be deduced. The column data for the 4 input solutions are given in Table 3.
The CI- breakthrough curves were fitted with CXTFIT (Parker and Van Genuchten, 1984) and optimized for pore volume and dispersivity. Optimized pore volumes equalled the gravimetric pore volume of 56.4 ml, except for the last solution. Breakthrough of this last (fourth) solution indi- cated slightly enhanced dispersivity and more rapid break- through (smaller pore volume) due to 02 bubbles in the column which blocked part of the pore space.
PHREEQC IN THE ARD EQUATION
Transport model
Conservation of mass for a chemical that is transported (Fig. 1), yields the advect ion-react ion- dispersion (ARD) equation:
Oc Oc Oq 02c O~ = -V~x - -~ + DL ~ (3)
where c is concentrat ion in water (mol l - 1), t is time (s), v is pore water flow velocity (m s - t ) , x is distance (m), q is concentrat ion in the solid phase (expressed as
mol 1- t of pore water), and DL is the hydrodynamic dispersion coefficient [m 2 s - i, DL = De + CtLV, with D,. the diffusion coefficient, and CtL the dispersivity (m)]. The term -v(Oc/Ox) represents advective transport, Oq/Ot is reaction with the solid (q in the same units as c), and DL(O2c/aX ~) gives dispersive transport. The usual assumption is that v and DL are equal for all solute species, so that c can be the total dissolved concentration for a component, including all redox species.
The transport part of equation (3) is solved with an explicit finite difference scheme that is forward in time, central in space for dispersion, and backward in space for advective transport (cf. Appelo and Postma, 1993). The chemical interaction term Oq/Ot is calculated separately from the transport part for each timestep for all solute components and all reactions with the solid. This numerical approach follows the basic components of the AR D equation in a split-operator scheme (Press et al., 1989; YanenKo, 1971). With each timestep advective transport is first calculated, fol- lowed by the chemical reactions, and thereafter dispersive transport, which again is followed by calculation of the chemical reactions. The scheme differs from most of the other hydrogeochemical transport models (Yeh and Tripathi, 1989) in that chemical reactions are calculated after both the advective and dispersive step. This reduces numerical dispersion, and the need to iterate between chemistry and transport.
A major advantage of the split-operator scheme is that numerical accuracy and stability can be obtained by relating the timestep to the grid size for the individual parts of the equation. Thus, numerical dispersion is minimized by always having:
(At) A = dx/v (4)
where (At)A is the timestep for advective transport, and Ax is the cell length. Numerical instabilities
Table 3. Input solution compositions and column data. Column PV is pore volume optimized from CI- breakthrough curves (the pore volume from gravimetric analysis is 56.4 ml)
Solution No. Cl- , mmol 1- i H202, mmol l - t Column_PV, ml Dispersivity, mm
1. 560 - - 56 9.9 2. 19.8 - - 56 12.3 3. 5.3 350 56 5.4 4. 10.2 - - 44 16.9
260 C.A.J. Appelo et al.
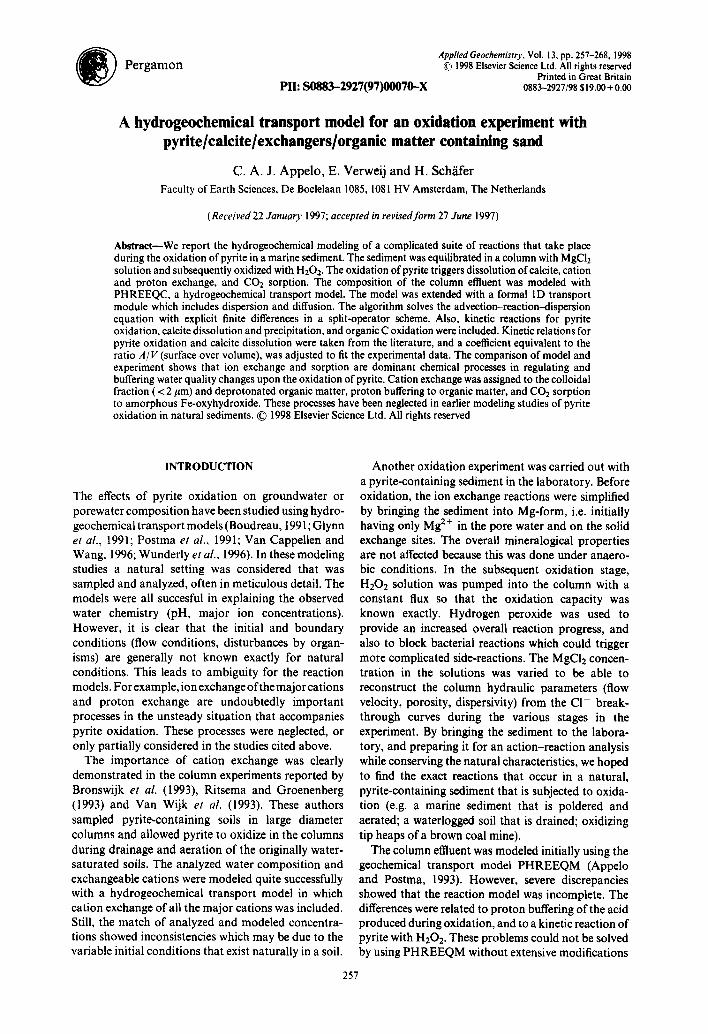
ac ,~
dx
Fig. 1. The components of the advection--dispersion-reac- tion (ADR) equation. Conservation of mass entails that the components are added for the indicated volume, which gives
equation (1) as result.
(oscillations) in the calculation of diffusion/dispersion are eliminated by the constraint:
(At)o < (Ax)2/(3DL) (5)
where (At)o is the timestep for dispersive/diffusive transport calculations. The 2 conditions defined by equations (4) and (5) are the Courant condition for advective transport and the Von Neumann criterion for dispersive transport calculations respectively (cf. Press et al., 1989). Numerical dispersion is negligible when Ax<~ because physical dispersive transport is then equal to, or more important than, advective transport.
The numerical scheme has been checked by com- paring with analytical solutions for simple cases involving linear exchange (cf. Appelo and Postma, 1993). A further, general control for more compli- cated reactions is that different discretizations show the same overall results, and display only sharpened concentration fronts when the finer grid reduces numerical dispersion. In the split-operator scheme given by equations (4) and (5) the grid can be as fine as the desired accuracy requires (and computer time permits). When Ax is made smaller in a finer grid in this way, the timestep for dispersive transport calcula- tions [equation (5)] may become smaller than the timestep for advective calculations [equation (4)], because the dispersive transport has quadratic depen- dence on grid size. This conflict is solved by time- stepping dispersive transport until ~, (A t )o=(At )a while the chemical reactions are calculated after each, smaller, dispersive timestep.
PHREEQC is used to calculate chemical reactions and equilibria between a set of exchangers, mineral phases and the solution. In PHREEQC, a Runge- Kutta procedure was programmed to integrate kinetic reactions during each timestep. The timelength for each kinetic calculation is equal to (At)A/(1 +j), where / is the number of dispersive timesteps.
Kinetic relations in P H R E E Q C
Kinetic relationships have been included for pyrite oxidation, calcite dissolution and precipitation, and
organic matter oxidation. The reaction rates take the general form:
A m '
where
rmin is the specific reaction rate for mineral min, mol dm-2 s - I ,
A / V is the ratio of mineral surface area to solution volume, d m - 1, and
(m/mo) i is a factor to account for changes in A, and also for selective dissolution and ageing (of. Appelo and Postma, 1993).
The rates are assumed to be linearly related to the surface area of the mineral. In the column experiment only small fractions of the solids reacted, so that (m/ m0);is a constant in our case. The exponent i= 2/3 was used, valid for ideally dissolving spheres and cubes.
The specific oxidation rate for pyrite, rpyr, with 02 is (Williamson and Rimstidt, 1994):
-- 0.5 -0.11 rpyr = ICpmo,_mH+ ( 7 )
where
kp = 10- 10.19 mol dm -2 s - i at 25°C, mo2 is the concentration of dissolved oxygen,
mol 1- i, mH- is the concentration of protons, mol 1- ~.
By using this rate equation, it was assumed that the rate dependence on H 2 0 2 - and on equivalent O2-concentrations are identical. This is probably correct for our experiment as the H202 decomposed in the inlet tubes, and only 02 was analyzed in the effluent. In the model, the product ofkp' A / V w a s used as a fitting parameter. Note that the experimental fitting parameter contains the lower experimental temperature of 7.5°C.
The specific reaction rate for calcite dissolution and precipitation is (Plummer et al., 1978):
rc~ = kl [H +] + k2[CO2] "t- k a [ H 2 0 ] - k4[Ca2+][HCO~ -]
(8)
in which the square brackets indicate activity for the ions or molecules and kin...3 a r e temperature-depen- dent constants given by Piummer et al. (1978). The value of k4 is variable, but it must be such that the reaction rate becomes zero at equilibrium. It has been approximated as follows. If the specific rate equation is arranged in a part r;; for dissolution, and a part rh, for precipitation, then:
roe = r / . - rh (9)
In a pure water and calcite system the precipitation rate becomes
rh = k4[Ca2+][HCO3] ~ 2k4[Ca2+] 2 (10a)
At equilibrium [Ca 2+] is the activity at saturation,

A hydrogeochemical transport model 261
[Ca 2+ s]. A l s o , the net reac t ion rate r. . = O, and there-
fore:
2k4 = rf/[Ca2+s]2 (10b)
This gives:
//[Ca2+], 2j r o e = r / 1-- k ~ , ] / (11)
In a pure Ca~C02 system at constant C02 pressure, the ion activity product l A P is:
IAPcalcite = [Ca2+][HCO3]2/Pco: ~- 4[Ca2+]3/Pco.,
(12)
The rate for calcite can thus be approximated by:
rcalcit e ----- r/( 1 -- (IAP/Kcalcite) 2/3) (13)
where r r contains the terms given in equation (8). In the model, A / V was adjusted to fit the data.
Oxidation of organic matter is calculated from the first order reaction:
dC - - = - k , , C (14) dt
The rate constant k,. (l/s) was adjusted to fit the experiment.
Ion exchange and proton buffering
Ion exchange is calculated by PHREEQC in terms of association reactions of exchanger and ions, with the constraint that all the exchange sites are always fully occupied by ions: i.e. no 'free' X - exists. The association reactions take the form of half reactions. For example, the exchange reaction of/~ + with respect to Na-X as in equation (I):
l / i I i+ + Na-X ~ 1/i l-Xi + Na+; log Kt\Na (la)
is written as 2 half reactions:
X- + Na + o Na-X; log Ksax = 0.0 (lb)
and
I i+ + iX - ~ l-Xl; (lc)
log Ktx = i log KroNa + log KNaX = i log Kt\Na
The value of the association constant for I-Xi follows from the (known) value of log K~Na and the reference value of log KNax = 0.0. For our sediment the observed exchange coefficients for the Ca 2 +/Na + and Mg 2 +/Na + pairs (Table 2)give as average:
Mg 2+ + 2X- ~ Mg-X2; log KMgx: = 0.8 05)
Ca2+ + 2 X - *-~ Ca-X2; log Kcax., = 1.1 (16)
Considerable pH buffering due to proton exchange was recorded when the sediment was preflushed with
MgCI2 solution and again when the H202 solution was displaced. Proton exchangers in this sediment are organic matter, oxides, and silicates depending on the pH range (Ulrich et aL, 1979; Bunge and Radke, 1982; Novosad and Novosad, 1984; Grittioen and Appelo, 1993; Gritiioen, 1993; Scheidegger et aL, 1994). These buffers were included in the PHREEQC database as individual exchangers with individual exchanger properties.
Organic matter
For organic matter the approach of multiple H- exchangers (Tipping and Hurley, 1992) was combined with proton/cation exchange to account for back- ground electrolyte concentration effects (Marinsky, 1987; Appelo and Postma, 1993). Tipping and Hurley (1992) fitted experimental data to a range of acidities for more acid (carboxylic) and less acid (phenolic) groups of humic and fulvic acids. As pH increases more groups dissociate successively and a negative charge develops on the organic molecule. The charge can be compensated for partly by trace metals and alkaline-earth cations, which compete with the pro- tons. The charge gives rise to a negative potential which influences the association of the cations via the Boltzmann relation. Background cations are assumed not to compete directly for association with the acid sites, but only to compensate the net negative charge in the double layer (the micellar solution). In the Tipping and Hurley (1992) model, ions in the micellar solution are distributed according to the ratio in solution, raised to the power of the charge ratio. This is different from usual double-layer calculations, in which the Boltzmann relation influences the relative abundance of heterovalent ions at each point in the double layer.
This model was adapted to include only ion- association, which has the advantage that an equally good fit of the experimental data can be obtained with fewer parameters (Milne et al., 1995a). Exclusion of
double-layer calculations requires that all exchange reactions are written so that an electrically neutral exchange complex results (bidentate association for a divalent cation). The shifts in titration curves, observed when the concentration of background electrolyte is varied, are modeled using association reactions with the cation from the background electrolyte (Marinsky, 1987).
The PHREEQC database was extended with the equilibria (cf. Table 4)
H + + Ya- ~ H-Ya; K~tra (17)
and
K + + Ya- ~ K-Ya; Krr , (18)
M 2+ + 2Ya- ~ M-Ya2; gMYa2 (19)
262 C. A. J. Appelo et al.
Table 4. Model parameters for the column experiment
Mineral equil.:
Kinetic parameters:
Exchange reactions:
Cations, X
Ya = Ya...Yf
Protons
Anions, Z
Fe(OH)3 = Fe 3+ + 3OH-; log K = -40.0
pyrite calcite org.C kp(A/V) A / V k,. 10 - 6.79 1 0 0 / d m 10 - 6.S4/s
1 ~+ +tX-~-* l-Xi; logK
Na-X Mg-X2 Ca-X2 0.0 0.8 1.1
Na-Ya K-Ya Mg-Ya2 - 1.0 -0.75 -0.2
H-Ya H-Yb H-Yc 1.65 3.3 4.95
H20-Z H2CO3-Z HCI-Z 0.0 -3.3 -7.05
Ca-Ya2 0.1
H-Yd H-Ye H-Yf 6.85 9.6 12.35
X, Y, Z calculated from soil chemical analysis, in mmol l-I: X=0.6 x [%_<2/zm] x 10 x (pb/e); Ytot = 4.8 x [%_OC] x I 0 x (pb/g); Z = [ppm Feam] x (pb/g)/558; Pb = 1.654; e = 0.376.
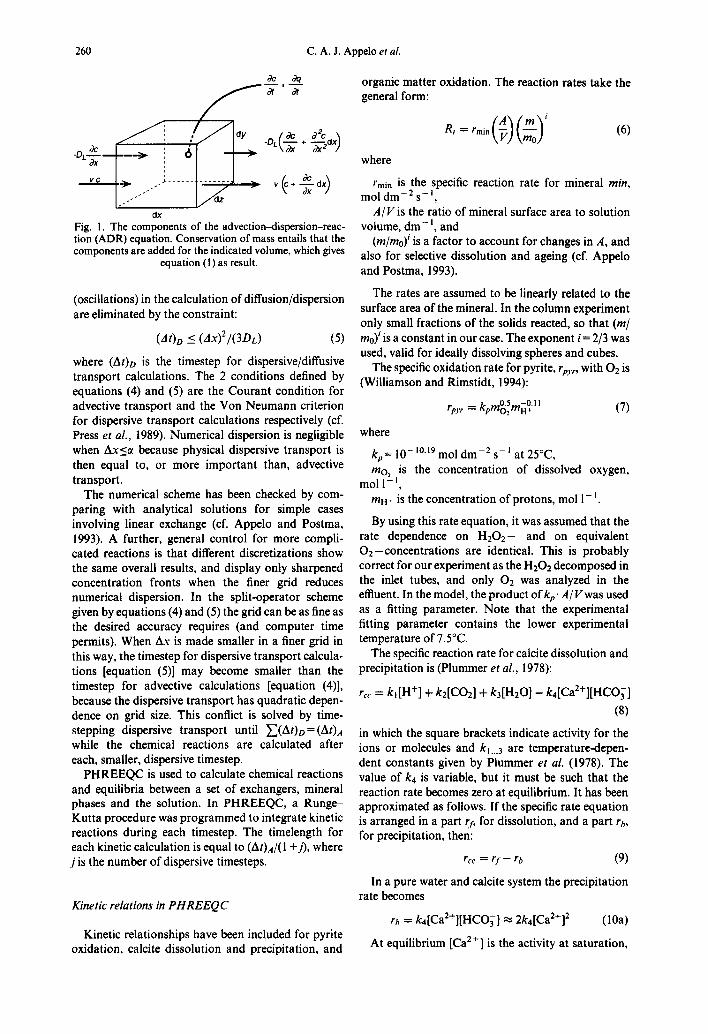
for 6 exchangers Ya = Ya...Yf and 2 divalent cations (M s + = Mg 2 + and Ca 2 ÷). The K values for proton exchange were taken from Tipping and Hurley (1992), while the same K was used for all 6 sites for the 2 cations. It was found that 6 conceptual exchangers, rather than the 8 used by Tipping and Hurley (1992), provided equally smooth curves when all exchange sites were given equal weight. The background electrolyte association was obtained by optimizing the titrations of Milne et al. (1995b) for purified humic acid in KNO3 at various ionic strengths. Figure 2 shows the fit obtained for 0,33 and 0.008 M when optimizing on log KKya (=- -0 .75) and the total exchange capacity (= 4.8 meq g - l C). Organic matter has a slightly lower selectivity for Na ÷, expressed by log KNaVa = - 1.0. The KMya values were taken to be equal to the observed exchange coefficients KM~Na, with respect to g N a Y a .
3.5
3
2.5
1
0.5 ~ .....: 0.008 M
4 5 7 8 9 10
pit Fig. 2. Proton dissociation from purified humic acid as a function of pH at 2 ionic strengths of KNO3, compared with a generalized model using 6 exchangers varying in KHv and with K + and H + competition. The ordinate indicates the part of total negative charge not balanced by H +. Thin
continuous lines: data from Milne et aL, 1995b.
Fe-oxyhydrox ides
Another important pH buffer in these sediments is amorphous Fe-oxyhydroxide. Since the solute pH is < 8.8 in the experiment, the Fe-oxyhydroxide surface will be positively charged at all times and only anion exchange is significant. However, S O 4 2 - is not sorbed in the experiment, because the elution curve for SO42- matches the C1- breakthrough during displacement of the H202 solution. Carbonate ions are important (Zachara et al., 1987; Zeltner and Anderson, 1988; Van Geen et al., 1994), and CO2-sorption data from Van Geen et al. (1994) were modeled as an anion exchange of O H - , HCO3- , and CIO4- from the background electrolyte, using the equations:
H + + O H - + Z ~ H20-Z; log KH:oz = 0.0 (20)
H + + HCO~ + Z ,a, H2CO3-Z; log Krhco3z = -3 .30
(21)
H ÷ + CIO 4 + Z ~ HCIO4-Z; log KHOO, Z = --7.05
(22)
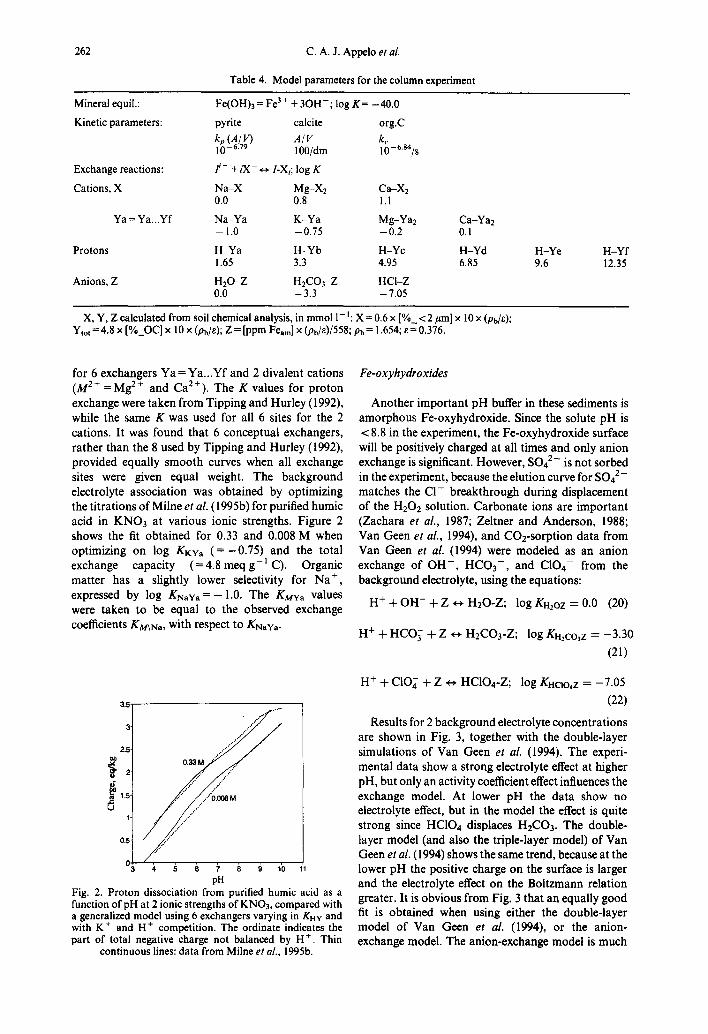
Results for 2 background electrolyte concentrations are shown in Fig. 3, together with the double-layer simulations of Van Oeen et al. (1994). The experi- mental data show a strong electrolyte effect at higher pH, but only an activity coefficient effect influences the exchange model. At lower pH the data show no electrolyte effect, but in the model the effect is quite strong since HCIO4 displaces H2CO3. The double- layer model (and also the triple-layer model) of Van Geen et al. (1994) shows the same trend, because at the lower pH the positive charge on the surface is larger and the electrolyte effect on the Boitzmann relation greater. It is obvious from Fig. 3 that an equally good fit is obtained when using either the double-layer model of Van Geen et al. (1994), or the anion- exchange model. The anion-exchange model is much

A hydrogeochemical transport model 263
it .-:SI';::::"-;? '.. /.. ",. ......
o.6 /" ~; .........
..~ o., : , : f •
o.2. .,.. :o ~, d . / ~ .
2 3 4 5 6 7 8
pH Fig. 3. CO2 sorption on goethite from 55 pM T I C (total inorganic C) solution in 0.01 and 0.1 M NaCIO4. Exchange model (heavy lines) compared with double-layer model (thin lines). (Data and double-layer model from Van Geen et al.,
1994).
faster computationally and was therefore preferred. Since Fe(OH)3 builds up during oxidation, PHREEQC was extended with an option to make the Z-exchanger dependent on the amounts of Fe(OH)3 present.
MODEL CALCULATION OF THE COLUMN OXIDATION EXPERIMENT
We will show how the complicated and interacting processes that take place in the experiment can be modeled using a step-by-step approach. The approach illustrates the systematics of modeling these types of experiments in going from accepted theory to more intricate processes. The most important reaction is, of course, pyrite oxidation and the associated release of protons. The pH is buffered by calcite dissolution, which increases the Ca 2 + and HCO3- concentrations. A large part of the Ca 2+ increase is buffered by exchange with Mg 2÷ . Additionally, other pH buffer- ing processes have an effect and organic matter is also oxidized.
H202. The Williamson and Rimstidt (1994) kinetic relation contains a small dependency on mH÷ (equa- tion (7)). It leads to a decrease of SO42- of 0.1 mM when the pH goes from 8 to 7.4 (as occurred in the experiment). However, the constant S O 2 - concen- tration in the effluent implies that the mH+ dependency is absent. The mH+ term was therefore omitted in the simulations (the exponent for this term was set to 0).
Figure 4 shows the evolution of SO42- and pH if pyrite reacts according to:
FeS2 + 7.5H202 ~ Fe(OH)3 + 2SO24 - (23)
+ 4H + + 4H20
The product kp(Al~ was adapted to fit the observed SO42- concentration of 2.7mM. The optimized value of kp (A/V) = 10 -6.79 can be related to the surface area of pyrite. With kp = 10-1°19(mH+) -0'11 ~--- 10 -9'41, A / V = 417/dm. This gives A=0 .77m2g -~ pyrite (the column con- tains on average 5.4 g pyrite/l pore water, cf. Tables 1 and 4). Although this surface area appears to be reasonable, it must be realized that the experiment was carried out at a temperature of 7.5°C while kp = 10 -10"19 holds for 25°C. The value ofkp may be smaller at the lower temperature, and the surface area of the pyrite may be correspondingly higher. It should be noted that in Fig. 4 the solution pH falls to ca. 3.0 with log KFe(OH)~ = --40.0 when pH buffering reac- tions are absent•
Pyrite oxidation and calcite dissolution
The combination of pyrite oxidation and calcite dissolution leads to the concentrations in the effluent shown in Fig. 5. The pH now only decreases to 7.1 during H202 injection. A small pH increase can be noted during the first 20 ml outflow that is related to the longer residence time in the column when the flow velocity was decreased on injection of the H202 solution. The (A/I/) term for calcite is the only variable
Pyrite oxidation
0.012 The oxidation rate of pyrite has been observed to
depend in a complicated manner on the surface area 0.011 and reaction extent. On the one hand, the oxidant attack on grains may be non-uniform (McKibben and o.00e. Barnes, 1986), or at more neutral pH, a coating of Fe oxide on the grains may inhibit the rate as the reaction ~ 0.~ continues (Goldhaber, 1983; Nicholson et al., 1990).
0.004 On the other hand, Nicholson et al. (1988) noted that the (A/V) relation in the kinetics equation was valid in 0.tin the initial reaction period. In our column, a steady state SO42- concentration was reached in the outflow o which indicates that aging effects were absent. This is probably related to the small fraction of the pyrite (1.5%) that was oxidized following the injection of
IOmMMgCI2 ~-- 350rnMH202 -~-- 5mMMgCI2
,7.Y 0 100
ml outflow Fig. 4. Calculated S O 2 - concentration and pH when
solution is injected in a column with pyrite.
12
10
8
-0 pH
-4
"2
H202
264 C. A. J. Appelo et al.
0.012"
0.01
0.008 ~ .
~ 0.006' ~ .
0.004.
0.002-
fO mM MgCI2 --~. 350 mM H202 .-~ $ mM M~I 2 "12
10
pH CII2+
-I00 0 100 200 300 400 ml outflow
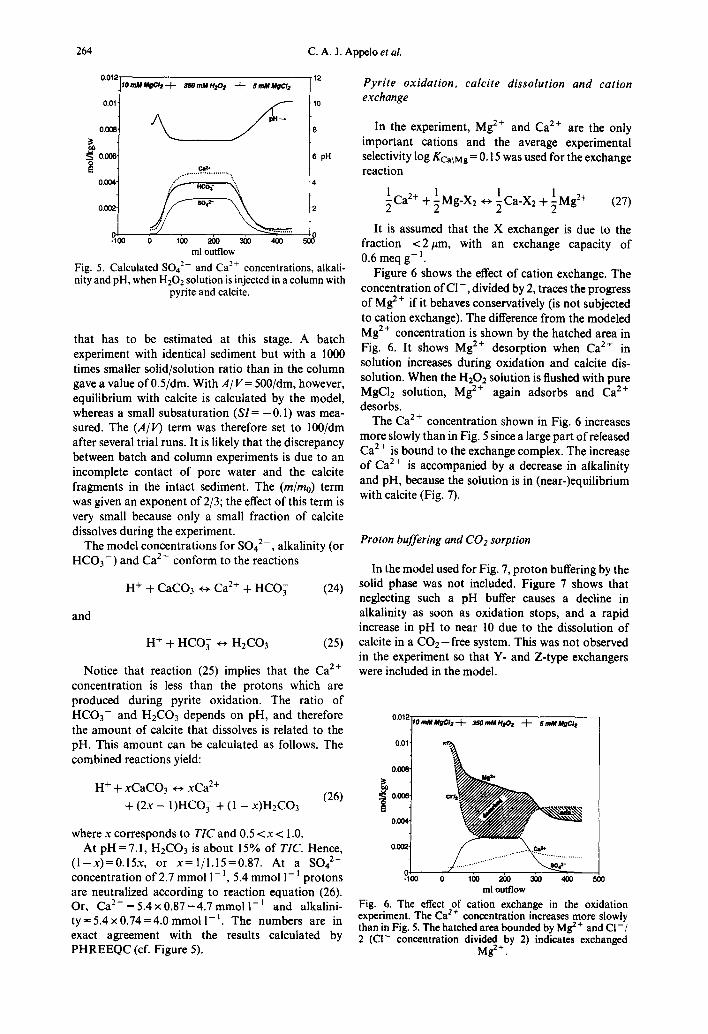
Fig. 5. Calculated S042- and Ca 2÷ concentrations, alkali- nity and pH, when H202 solution is injected in a column with
pyrite and calcite.
that has to be estimated at this stage. A batch experiment with identical sediment but with a 1000 times smaller solid/solution ratio than in the column gave a value of 0.5/dm. With A/V= 500/dm, however, equilibrium with calcite is calculated by the model, whereas a small subsaturation (SI= -O. 1) was mea- sured. The (A/V) term was therefore set to 100/dm after several trial runs. It is likely that the discrepancy between batch and column experiments is due to an incomplete contact of pore water and the calcite fragments in the intact sediment. The (m/mo) term was given an exponent of 2/3; the effect of this term is very small because only a small fraction of calcite dissolves during the experiment.
The model concentrations for SO42-, alkalinity (or HCO3-) and Ca 2 ÷ conform to the reactions
and
H + + CaCO3 ~ Ca 2+ + HCO~ (24)
H + + HCO 3 ~ H2CO3 (25)
Notice that reaction (25) implies that the Ca 2÷ concentration is less than the protons which are produced during pyrite oxidation. The ratio of HCO3- and H2CO 3 depends on pH, and therefore the amount of calcite that dissolves is related to the pH. This amount can be calculated as follows. The combined reactions yield:
H + + xCaCO3 ~ xCa 2+ (26)
+ (2x - I)HCO~- + (1 - x)H2CO3
where x corresponds to TIC and 0.5 < x < 1.0. At pH=7.1 , H2CO 3 is about 15% of TIC. Hence,
(1-x)=O.15x, or x=1/1.15=0.87. At a SO42- concentration of 2.7 mmol 1-i , 5.4 mmol 1-~ protons are neutralized according to reaction equation (26). Or, Ca 2 + = 5.4 x 0.87 = 4.7 mmol 1-1 and alkalini- t y = 5 . 4 x 0 . 7 4 = 4 . 0 m m o i l - ' . The numbers are in exact agreement with the results calculated by PHREEQC (cf. Figure 5).
Pyrite oxidation, calcite dissolution and cation exchange
In the experiment, Mg 2+ and Ca 2+ are the only important cations and the average experimental selectivity log Kca\Mg = 0.15 was used for the exchange reaction
~Ca2 + 1 1 1 + ~ Mg-X2 ~ ~ Ca-X2 + ~ Mg 2+ (27)
It is assumed that the X exchanger is due to the fraction <2/~m, with an exchange capacity of 0.6 meq g - 1.
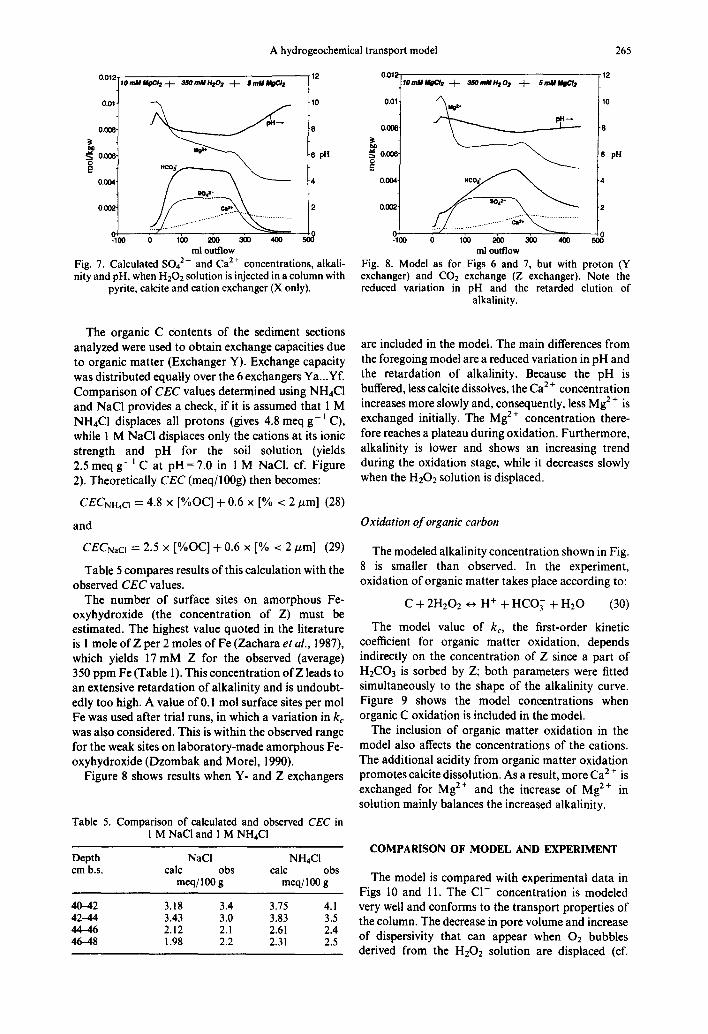
Figure 6 shows the effect of cation exchange. The concentration of C l - , divided by 2, traces the progress of Mg 2+ if it behaves conservatively (is not subjected to cation exchange). The difference from the modeled Mg 2÷ concentration is shown by the hatched area in Fig. 6. It shows Mg 2÷ desorption when Ca 2÷ in solution increases during oxidation and calcite dis- solution. When the H202 solution is flushed with pure MgCI~ solution, Mg 2÷ again adsorbs and Ca 2÷ desorbs.
The Ca 2 ÷ concentration shown in Fig. 6 increases more slowly than in Fig. 5 since a large part of released Ca 2 + is bound to the exchange complex. The increase of Ca 2 ÷ is accompanied by a decrease in alkalinity and pH, because the solution is in (near-)equilibrium with calcite (Fig. 7).
Proton buffering and C02 sorption
In the model used for Fig. 7, proton buffering by the solid phase was not included. Figure 7 shows that neglecting such a pH buffer causes a decline in alkalinity as soon as oxidation stops, and a rapid increase in pH to near 10 due to the dissolution of calcite in a CO2-f ree system. This was not observed in the experiment so that Y- and Z-type exchangers were included in the model.
0.012 • fOr~WMgCI2-~ 3SOmMIf202 -~- SmMMgCI?
0•01"
0.0~ ~ ~
~ O.OOe cr12 a
0.004
0 I00 ~0 ~0 44~0 500
ml outflow
Fig. 6. The effect of cation exchange in the oxidation experiment. The Ca 2+ concentration increases more slowly than in Fig. 5. The hatched area bounded by Mg 2+ and CI-/ 2 (C1- concentration divided by 2) indicates exchanged
Mg 2+
A hydrogeochemical transport model 265
8.012
0,01"
0.008"
~ 0.006" ~ -
0.004-
lOn~lfMgCI2-- ~ 3SOmMHz02 + SmUMgCb
ml outflow
12
.10
-8
-6 pn
-4
-2
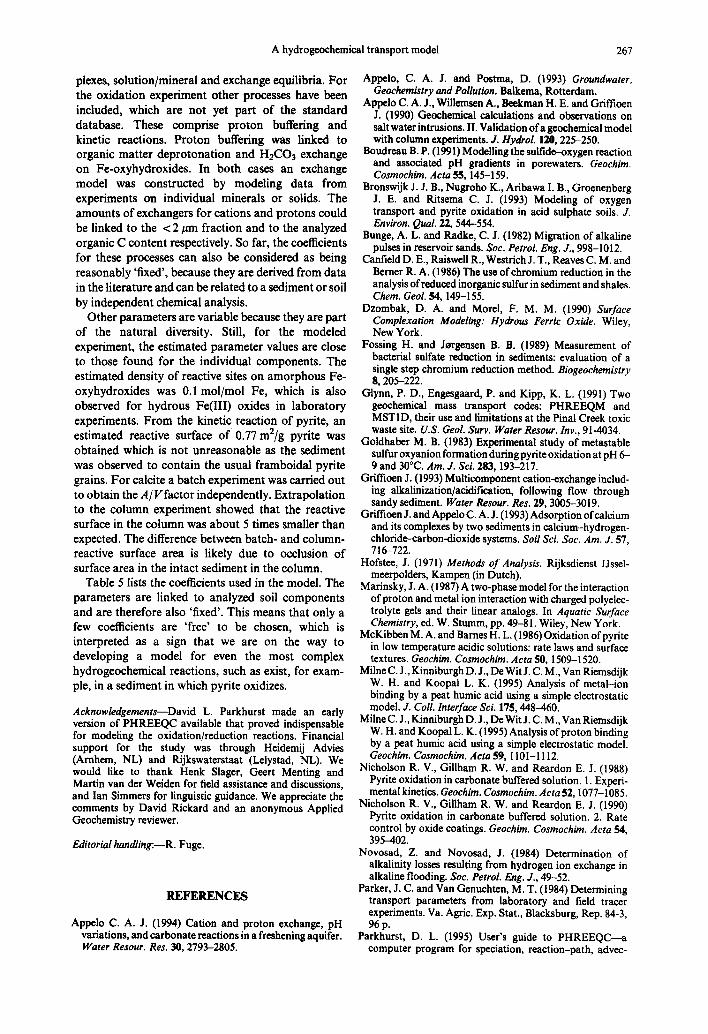
Fig. 7. Calculated 5042- and Ca 2+ concentrations, alkali- nity and pH, when H202 solution is injected in a column with
pyrite, calcite and cation exchanger (X only).
12 0.0,: ,o~.,~,. + .~ - . . o . + . - , ~ . ]11 ~ 0.0' ~ 0
O.O(~
0 .~"
C~ -100 0 ICI0 ~ ~
ml outflow Fig. 8. Model as for Figs 6 and 7, but with proton (Y exchanger) and CO2 exchange (Z exchanger). Note the reduced variation in pH and the retarded elution of
alkalinity.
The organic C contents of the sediment sections analyzed were used to obtain exchange capacities due to organic matter (Exchanger Y). Exchange capacity was distributed equally over the 6 exchangers Ya...Yf. Comparison of CEC values determined using NH4CI and NaC1 provides a check, if it is assumed that 1 M NH4C1 displaces all protons (gives 4.8 meq g - I C), while 1 M NaCI displaces only the cations at its ionic strength and pH for the soil solution (yields 2.5 meq g - i C at pH = 7.0 in 1 M NaC1, cf. Figure 2). Theoretically CEC (meq/100g) then becomes:
CECNH4CI = 4.8 x [%OC] + 0.6 x [% < 2/zm] (28)
and
CECNaa = 2.5 x [%OC] + 0.6 x [% < 2/zm] (29)
Table 5 compares results of this calculation with the observed CEC values.
The number of surface sites on amorphous Fe- oxyhydroxide (the concentration of Z) must be estimated. The highest value quoted in the literature is l mole of Z per 2 moles of Fe (Zachara et al., 1987), which yields 17 mM Z for the observed (average) 350 ppm Fe (Table l). This concentration of Z leads to an extensive retardation of alkalinity and is undoubt- edly too high. A value of 0.1 mol surface sites per tool Fe was used after trial runs, in which a variation in kc was also considered. This is within the observed range for the weak sites on laboratory-made amorphous Fe- oxyhydroxide (Dzombak and Morel, 1990).
Figure 8 shows results when Y- and Z exchangers
Table 5. Comparison of calculated and observed CEC in l M NaCl and l M NH4CI
Depth NaCI NH4CI cm b.s. calc obs calc obs
meq/100 g meq/100 g
40--42 3.18 3.4 3.75 42--44 3.43 3.0 3.83 44 46 2.12 2.1 2.61 46-48 1.98 2.2 2.31
are included in the model. The main differences from the foregoing model are a reduced variation in pH and the retardation of alkalinity. Because the pH is buffered, less calcite dissolves, the Ca 2 ÷ concentration increases more slowly and, consequently, less Mg 2+ is exchanged initially. The Mg 2+ concentration there- fore reaches a plateau during oxidation. Furthermore, alkalinity is lower and shows an increasing trend during the oxidation stage, while it decreases slowly when the H202 solution is displaced.
Oxidation of organic carbon
The modeled alkalinity concentration shown in Fig. 8 is smaller than observed. In the experiment, oxidation of organic matter takes place according to:
C + 2H202 ~-~ H + + HCO 3 + H20 (30)
The model value of kc, the first-order kinetic coefficient for organic matter oxidation, depends indirectly on the concentration of Z since a part of H2CO3 is sorbed by Z; both parameters were fitted simultaneously to the shape of the alkalinity curve. Figure 9 shows the model concentrations when organic C oxidation is included in the model.
The inclusion of organic matter oxidation in the model also affects the concentrations of the cations. The additional acidity from organic matter oxidation promotes calcite dissolution. As a result, more Ca 2 ÷ is exchanged for Mg 2÷ and the increase of Mg 2÷ in solution mainly balances the increased alkalinity.
COMPARISON OF MODEL AND EXPERIMENT
The model is compared with experimental data in Figs 10 and 11. The C1- concentration is modeled
4,1 very well and conforms to the transport properties of 3.5 the column. The decrease in pore volume and increase 2.4 of dispersivity that can appear when O2 bubbles 2.5
derived from the H202 solution are displaced (of.

266 C.A.J. Appelo et ak
0.012" 12 I O mM M~CI~ -t-- 3$O reM HlOa -J~ S mM MgCI~
0.01 1~2+ 10
0.008 8
0.006 " "6 pH
o.oo4 14
0 . ~ ' -2
ml outflow Fig. 9. Organic C oxidation added to the model used in Fig. 8. H202 oxidation in a column with pyrite, organic matter,
calcite, and cation, proton and CO2 exchangers.
0.(~
0.016
k 0,012
0.(308
0.004 2
-1~ o 100 2oo 3o0 4oo ~ ~ 700 ml outflow
Fig. 10. Model and column results compared: Mg 2+ CI- concentrations and pH.
"10
-8
'0 pH
.4
and
increased the error for the low concentration range. It is also possible that dissolved organic matter has had an influence on alkalinity. Back titrations follow- ing CO2 removal with N2 gas at pH 3.5 provided ambiguous results, however.
The measured Ca 2+ concentration shows some small irregularities. After 40 ml (from point 0 in Fig. 11), an increase of Ca 2÷ concentration occurs which may be due to the change of pump and the temporary halt to the flow. The more continuous trace of other concentrations suggests that this interruption effect was only minor (as was also found when the interruption was included in the model). The Ca 2÷ concentration is at most 0.3 mM higher in the model than measured, both at the peak during oxidation and at the end during elution with 5 mM MgCI2. It is possible to reduce this difference almost completely by increasing the exchange capacity with a factor of 1.2 (obtained from trial runs). It is also possible that proton buffering is higher than estimated. The calculated pH is below that measured, which means that at a similar subsaturation with respect to calcite in both model and experiment (SI= -0 .1) , the model predicts more Ca 2 ÷ in solution. The constant Ca 2 ÷ concentration during the last elution with 5 mM MgC12 is notable in the experiment and is well matched by the model. It can only be modeled correctly by including the pH and CO2 buffers discussed above.
CONCLUSIONS AND OUTLOOK
0.01
0.00~
~ 0.00~ m Hcos"
E o.oo4
0.1~
w . . . . .
ml outflow
Fig. 11. Model and column results compared: Ca 2+ and SO42- concentrations and alkalinity.
Table 3) are not noticeable, and so a uniform pore volume (56 ml) and dispersivity (5.4 mm) were used. The SO42- concentration is also modeled well, which means that after its release from pyrite (and oxidation) SO42- behaves conservatively like CI - .
The concentrations of other ions are also modeled well. The rise in alkalinity is correctly modeled, but the calculated reduction after oxidation is somewhat more extended and continuous. Alkalinity was mea- sured in a small volume (2 ml), which may have
It is illustrative at this stage to compare Figs 5 and 9. Figure 5 shows the model concentrations due to pyrite oxidation in a sediment with buffering by calcite only. The reaction scheme is simple, and the concentrations can be calculated by hand as illustrated in the paper. Figure 9 shows the concentrations when the full suite of reactions is included in the model. The Ca 2+ concentration is lower than the SO42- concentration in the first figure, while the opposite is true in the latter figure. In Fig. 5 the HCO3- concentration drops rapidly and the pH increases to 10 when the oxidant is flushed. In Fig. 9 the decrease in the HCO3- concentration is subdued, and the pH is much more stable. The differences are due to cation and proton exchange, H2CO3 sorption, and organic matter oxida- tion. The conclusion is that these side reactions are very important in regulating the water chemistry in a natural sediment when pyrite oxidizes.
It is clear that the complicated suite of reactions can only be evaluated properly with a hydrogeochemical transport (computer) model, while at the same time, the importance of the side reactions becomes immedi- ately clear when experimental and model results are compared. It is of interest to consider how far the capacity of the standard model is sufficient for a real environment. The standard database of PHREEQC contains well established relations for aqueous tom-
A hydrogeochemical transport model 267
plexes, solution/mineral and exchange equilibria. For the oxidation experiment other processes have been included, which are not yet part of the standard database. These comprise proton buffering and kinetic reactions. Proton buffering was linked to organic matter deprotonation and H2CO3 exchange on Fe-oxyhydroxides. In both cases an exchange model was constructed by modeling data from experiments on individual minerals or solids. The amounts of exchangers for cations and protons could be linked to the < 2/zm fraction and to the analyzed organic C content respectively. So far, the coefficients for these processes can also be considered as being reasonably 'fixed', because they are derived from data in the literature and can be related to a sediment or soil by independent chemical analysis.
Other parameters are variable because they are part of the natural diversity. Still, for the modeled experiment, the estimated parameter values are close to those found for the individual components. The estimated density of reactive sites on amorphous Fe- oxyhydroxides was 0.1 mol/mol Fe, which is also observed for hydrous Fe(III) oxides in laboratory experiments. From the kinetic reaction of pyrite, an estimated reactive surface o f 0.77 m2/g pyrite was obtained which is not unreasonable as the sediment was observed to contain the usual framboidal pyrite grains. For calcite a batch experiment was carried out to obtain the A~ Vfactor independently. Extrapolation to the column experiment showed that the reactive surface in the column was about 5 times smaller than expected. The difference between batch- and column- reactive surface area is likely due to occlusion of surface area in the intact sediment in the column.
Table 5 lists the coefficients used in the model. The parameters are linked to analyzed soil components and are therefore also 'fixed'. This means that only a few coefficients are 'free' to be chosen, which is interpreted as a sign that we are on the way to developing a model for even the most complex hydrogeochemical reactions, such as exist, for exam- ple, in a sediment in which pyrite oxidizes.
Acknowledgements--David L. Parkhurst made an early version of PHREEQC available that proved indispensable for modeling the oxidation/reduction reactions. Financial support for the study was through Heidemij Advies (Arnhem, NL) and Rijkswaterstaat (Lelystad, NL). We would like to thank Henk Slager, Geert Meriting and Martin van der Weiden for field assistance and discussions, and Ian Simmers for linguistic guidance. We appreciate the comments by David Rickard and an anonymous Applied Geochemistry reviewer.
Editorial handling:--R. Fuge.
REFERENCES
Appelo C. A. J. (1994) Cation and proton exchange, pH variations, and carbonate reactions in a freshening aquifer. Water Resour. Res. 30, 2793-2805.
Appelo, C. A. J. and Postma, D. (1993) Groundwater, Geochemistry and Pollution. Balkema, Rotterdam.
Appeio C. A. J., Willemsen A., Ikekman H. E. and Griffioen J. (1990) Geochemical calculations and observations on salt water intrusions. II. Validation of a geochemical model with column experiments. J. Hydrol. 120, 225-250.
Boudreau B. P. (1991 ) Modelling the sulfide-oxygen reaction and associated pH gradients in porewaters. Geochim. Cosmochim. Acta 55, 145-159.
Bronswijk J. J. B., Nugroho K., Aribawa I. B., Groenenberg J. E. and Ritsema C. J. (1993) Modeling of oxygen transport and pyrite oxidation in acid sulphate soils. J. Environ. Qual. 22, 544-554.
Bunge, A. L. and Radke, C. J. (1982) Migration of alkaline pulses in reservoir sands. Soc. Petrol. Eng. J., 998-1012.
Canfield D. E., Raiswell R., Westrich J. T., Reaves C. M. and Berner R. A. (1986) The use of chromium reduction in the analysis of reduced inorganic sulfur in sediment and shales. Chem. Geol. 54, 149-155.
Dzombak, D. A. and Morel, F. M. M. (1990) Surface Complexation Modeling: Hydrous Ferric Oxide. Wiley, New York.
Fossing H. and J~rgensen B. B. (1989) Measurement of bacterial sulfate reduction in sediments: evaluation of a single step chromium reduction method. Biogeochemistry 8, 205-222.
Glynn, P. D., Engesgaard, P. and Kipp, K. L. (1991) Two geochemical mass transport codes: PHREEQM and MST1D, their use and limitations at the Pinal Creek toxic waste site. U.S. Geol. Surv. Water Resour. Inv., 91-4034.
Goldhaber M. B. (1983) Experimental study of metastable sulfur oxyanion formation during pyrite oxidation at pH 6- 9 and 30°C. Am. J. Sci. 283, 193-217.
Griffioen J. (1993) Multicomponent cation-exchange includ- ing alkalinization/acidification, following flow through sandy sediment. Water Resour. Res. 29, 3005-3019.
Griffioen J. and Appelo C. A. J. (1993) Adsorption of calcium and its complexes by two sediments in calcium-hydrogen- chloride--carbon-dioxide systems. Soil ScL Soc. Am. J. 57, 716-722.
Hofstee, J. (1971) Methods of Analysis. Rijksdienst IJssel- meerpolders, Kampen (in Dutch).
Marinsky, J. A. (1987) A two-phase model for the interaction of proton and metal ion interaction with charged polyelec- trolyte gels and their linear analogs. In Aquatic Surface Chemistry, ed. W. Sturnm, pp. 49-81. Wiley, New York.
McKihben M. A. and Barnes H. L. (1986) Oxidation of pyrite in low temperature acidic solutions: rate laws and surface textures. Geochim. Cosmochim. Acta 50, 1509-1520.
Milne C. J., Kinulburgh D. J., De Wit J. C. M., Van Riemsdijk W. H. and Koopal L. K. (1995) Analysis of metal-ion binding by a peat humic acid using a simple electrostatic model. J. Coll. Interface Sci. 175, 448-460.
Milne C. J., Kinniburgh D. J., De Wit J. C. M., Van Riemsdijk W. H. and Koopal L. K. (1995) Analysis of proton binding by a peat humic acid using a simple electrostatic model. Geochim. Cosmochim. Acta 59, 1 I01-1112.
Nicholson R. V., GiUham R. W. and Reardon E. J. (1988) Pyrite oxidation in carbonate buffered solution. 1. Experi- mental kinetics. Geochim. Cosmochim. Acta 52, 1077-1085.
Nicholson R. V., Gillham R. W. and Reardon E. J. (1990) Pyrite oxidation in carbonate buffered solution. 2. Rate control by oxide coatings. Geochim. Cosmochim. Acta 54, 395-402.
Novosad, Z. and Novosad, J. (1984) Determination of alkalinity losses resulting from hydrogen ion exchange in alkaline flooding. Soc. Petrol. Eng. J., 49-52.
Parker, J. C. and Van Genuchten, M. T. (1984) Determining transport parameters from laboratory and field tracer experiments. Va. Agric. Exp. Star., Blacksburg, Rep. 84-3, 96 p.
Parkhurst, D. L. (1995) User's guide to PHREEQC--a computer program for speciation, reaction-path, advec-

268 C.A.J . Appelo et al.
five-transport, and inverse geochemical calculations. U.S. Geol. Surv. Water Resour. Inv., 95-4227.
Parkhurst, D. L., Thorstenson, D. C. and Plummet, L. N. (I 980) PHREEQE--A computer program for geochemical calculations. U.S. Geol. Surv. Water Resour. Inv., 80-96.
Plummer, L. N. (1992) Geochemical modeling of water-rock interaction: past, present, future. In Water-Rock Inter- action, eds. Y. K. Kharaka and A. S. Maest, Vol. I, pp. 23- 33. Balkema, Rotterdam.
Plummer L. N., Wigley T. M. L. and Parkhurst D. L. (1978) The kinetics of calcite dissolution in CO2 water systems at 5 to 60°C and 0.0 to 1.0 arm CO2. Am. J. Sci. 278, 179-216.
Postma D., Boesen C., Kristiansen H. and Larsen F. (1991) Nitrate reduction in an unconfined sandy aquifer: water chemistry, reduction processes and geochemical modeling. Water Resour. Res. 27, 227-230.
Press, W. H., Flannery, B. P., Teukolsky, S. A. and Vetterling, W. T. (1989) Numerical Recipes in Pascal. Cambridge University Press, cambridge.
Pruden G. and Bloomfield C. (1968) The determination of iron(II) sulfide in soil in the presence of iron(Ill) oxide. Analyst 93, 532-534.
Ritsema C. J. and Groenenberg J. E. (1993) Pyrite oxidation, carbonate weathering, and gypsum formation in a drained potential acid sulfate soil. Soil Sci. Soc. Am. J. 57, 968-976.
Saager P. M., Sweerts J. P. and Ellermeijer H. J. (1990) A simple porewater sampler for coarse, sandy sediments of low porosity. Limnol. Oceanogr. 35, 747-751.
Scheidegger A., Burgisser C. S., Borkovec M., Sticher H., Meeussen H. and Van Riemsdijk W. (1994) Convective transport of acids and bases in porous media. Water Resour. Res. 30, 2937-2944.
Schwertmann U. (1964) Differenzierung der Eisenoxide des Bodens durch Extraktion mit Ammonium Oxalat-16sung. Z. Pflanzenerndhr. Bodenk. 105, 194-202.
Tipping E. and Hurley M. A. 0992) A unifying model of cation binding by humic substances. Geochim. Cosmochim. Acta 56, 3627-3641.
Ulrich, B., Mayer, R. and Khanna, P. K. (1979) Deposition
yon Luftverunreinigungen und ihre Auswirkungen in Wald~- kosystemen im Soiling. J. Sauerlinder Verlag, Frankfurt a.M.
Van Cappellen P. and Wang Y. (1996) Cycling of iron and manganese in surface sediments: a general theory for the coupled transport and reaction of carbon, oxygen, nitro- gen, sulfur, iron, and manganese. Am. J. Sci. 296, 197-243.
Van Geen A., Robertson A. P. and Leckie J. O. (1994) Complexation of carbonate species at the goethite surface: implications for adsorption of metal ions in natural waters. Geochim. Cosmochim. Acta 58, 2073-2086.
Van Wijk, A. L. M., Widjaja-Adhi, I. P. G., Ritsema, C. J. and Konsten, C. J. M. (1993) A simulation model for acid sulphate soils, II: validation and application. In Selected Papers o f the Ho Chi Minh Symposium on Acid Sulphate Soils, eds. D. L. Dent and M. E. F. Van Mensvoort, Pub. 53, pp. 357-367. ILRI, Wageningen.
Williamson M. A. and Rimstidt J. D. (1994) The kinetics and electrochemical rate-determining step of aqueous pyrite oxidation. Geochim. Cosmochim. Acta 58, 5443-5454.
Wunderly M. D., Blowes D. W., Frind E. O. and Ptacek C. J. (1996) Sufide mineral oxidation and subsequent reactive transport of oxidatioon products in mine tailing impound- ments: a numerical model. Water Resour. Res. 32, 3173- 3187.
Yanenko, N. (1971) The Method o f Fractional Steps. Springer, New York.
Yeh G. T. and Tripathi V. S. (1989) A critical evaluation of recent developments in hydrogeochemical transport models of reactive multichemical components. Water Resour. Res. 25, 93-108.
Zachara J. M., Girvin D. C., Schmidt R. L. and Resch C. T. (1987) Chromate adsorption on amorphous iron oxy- hydroxide in the presence of major groundwater ions. Environ. Sci. Technol. 21,589-594.
Zeltner W. A. and Anderson M. A. (1988) Surface charge development at the goethite/aqueous solution interface: effects of CO2 adsorption. Langmuir 4, 469-474.